FOMC Service Report
16S rRNA Gene V1V3 Amplicon Sequencing
Version V1.41 fork
The Forsyth Institute, Cambridge, MA, USA November 28, 2023 Project ID: DEMO_02
I. Project Summary
Project DEMO_02 services do not include NGS sequencing of the V1V3 region of the 16S rRNA gene amplicons from the samples. First and foremost, please
download this report .
These links will expire after 60 days. We cannot guarantee the availability of your data after 60 days.
Full Bioinformatics analysis service was requested.
We provide many downstream analyses such as taxonomy assignment, alpha and beta diversity analyses, and differential abundance analysis.
For taxonomy assignment, most informative would be the taxonomy barplots interactive barplots
If you specify which groups of samples you want to compare for differential abundance, we provide both ANCOM LEfSe
II. Workflow Checklist
☑ 1. Sample Received ☑ 2. Sample Quality Evaluated ☑ 3. Sample Prepared for Sequencing ☑ 4. Next-Gen Sequencing ☑ 5. Sequence Quality Check ☑ 6. Absolute Abundance ☑ 7. Report and Raw Sequence Data Available for Download ☑ 8. Bioinformatics Analysis - Reads Processing (DADA2 Quality Trimming, Denoising, Paired Reads Merging) ☑ 9. Bioinformatics Analysis - Reads Taxonomy Assignment ☑ 10. Bioinformatics Analysis - Alpha Diversity Analysis ☑ 11. Bioinformatics Analysis - Beta Diversity Analysis ☑ 12. Bioinformatics Analysis - Differential Abundance Analysis ☑ 13. Bioinformatics Analysis - Heatmap Profile ☑ 14. Bioinformatics Analysis - Network Association
III. NGS Sequencing
IV. Complete Report Download
The complete report of your project, including all links in this report, can be downloaded by clicking the link provided below. The downloaded file is a compressed ZIP file and once unzipped, open the file “REPORT.html” (may only shown as "REPORT" in your computer) by double clicking it. Your default web browser will open it and you will see the exact content of this report.
Please download and save the file to your computer storage device. The download link will expire after 60 days upon your receiving of this report.
Complete report download link:
To view the report, please follow the following steps:
1. Download the .zip file from the report link above. 2. Extract all the contents of the downloaded .zip file to your desktop. 3. Open the extracted folder and find the "REPORT.html" (may shown as only "REPORT"). 4. Open (double-clicking) the REPORT.html file. Your default browser will open the top age of the complete report. Within the
report, there are links to view all the analyses performed for the project.
V. Raw Sequence Data Download
Not available
VI. Analysis - DADA2 Read Processing
Not available
Sample Meta Information
#SampleID Group Detail Group1 Group2 SRR24654017 K Missing Plaque missing plaque missing plaque missing plaque SRR24654018 K Caries Free Plaque CFAT plaque CFAT plaque CFAT plaque SRR24654019 K Caries Free Plaque CFAT plaque CFAT plaque CFAT plaque SRR24654020 K Caries Free Plaque CFAT plaque CFAT plaque CFAT plaque SRR24654021 K Caries Plaque EC plaque EC plaque EC plaque SRR24654022 K Missing Plaque missing plaque missing plaque missing plaque SRR24654023 K Missing Plaque missing plaque missing plaque missing plaque SRR24654024 K Missing Plaque missing plaque missing plaque missing plaque SRR24654025 K Caries Free Plaque CFAT plaque CFAT plaque CFAT plaque SRR24654026 K Caries Free Plaque CFAT plaque CFAT plaque CFAT plaque SRR24654027 K Caries Plaque EC plaque EC plaque EC plaque SRR24654028 K Caries Free Plaque C2.5 plaque C2.5 plaque C2.5 plaque SRR24654029 K Caries Plaque AC plaque AC plaque AC plaque SRR24654030 K Caries Plaque AC plaque AC plaque AC plaque SRR24654031 K Caries Free Plaque C2.5 plaque C2.5 plaque C2.5 plaque SRR24654032 K Caries Free Plaque C6.5 plaque C6.5 plaque C6.5 plaque SRR24654033 K Caries Free Plaque C6.5 plaque C6.5 plaque C6.5 plaque SRR24654034 K Caries Plaque AC plaque AC plaque AC plaque SRR24654035 K Caries Plaque AC plaque AC plaque AC plaque SRR24654036 K Caries Plaque EC plaque EC plaque EC plaque SRR24654037 K Caries Free Plaque C2.5 plaque C2.5 plaque C2.5 plaque SRR24654038 K Missing Plaque missing plaque missing plaque missing plaque SRR24654039 K Missing Plaque missing plaque missing plaque missing plaque SRR24654040 K Missing Plaque missing plaque missing plaque missing plaque SRR24654041 K Caries Free Plaque CFAT plaque CFAT plaque CFAT plaque SRR24654042 K Caries Free Plaque CFAT plaque CFAT plaque CFAT plaque SRR24654043 K Caries Free Plaque C6.5 plaque C6.5 plaque C6.5 plaque SRR24654044 K Caries Free Plaque C6.5 plaque C6.5 plaque C6.5 plaque SRR24654045 K Caries Free Plaque CFAT plaque CFAT plaque CFAT plaque SRR24654046 K Caries Free Plaque CFAT plaque CFAT plaque CFAT plaque SRR24654047 K Caries Free Plaque C2.5 plaque C2.5 plaque C2.5 plaque SRR24654048 K Caries Free Plaque C6.5 plaque C6.5 plaque C6.5 plaque SRR24654049 K Caries Free Plaque C6.5 plaque C6.5 plaque C6.5 plaque SRR24654050 K Caries Free Plaque C6.5 plaque C6.5 plaque C6.5 plaque SRR24654051 K Caries Free Plaque C6.5 plaque C6.5 plaque C6.5 plaque SRR24654052 K Caries Free Plaque C6.5 plaque C6.5 plaque C6.5 plaque SRR24654053 K Caries Free Plaque C6.5 plaque C6.5 plaque C6.5 plaque SRR24654054 K Caries Plaque EC plaque EC plaque EC plaque SRR24654055 K Caries Free Plaque C4 plaque C4 plaque C4 plaque SRR24654056 K Caries Free Plaque C4 plaque C4 plaque C4 plaque SRR24654057 K Missing Plaque missing plaque missing plaque missing plaque SRR24654058 K Caries Plaque AC plaque AC plaque AC plaque SRR24654059 K Caries Free Plaque C2.5 plaque C2.5 plaque C2.5 plaque SRR24654060 K Caries Free Plaque C6.5 plaque C6.5 plaque C6.5 plaque SRR24654061 K Caries Free Plaque C6.5 plaque C6.5 plaque C6.5 plaque SRR24654062 K Caries Plaque EC plaque EC plaque EC plaque SRR24654063 K Caries Plaque AC plaque AC plaque AC plaque SRR24654064 K Caries Plaque AC plaque AC plaque AC plaque SRR24654065 K Caries Free Plaque C2.5 plaque C2.5 plaque C2.5 plaque SRR24654066 K Caries Plaque EC plaque EC plaque EC plaque SRR24654067 K Caries Free Plaque C4 plaque C4 plaque C4 plaque SRR24654068 K Caries Free Plaque C4 plaque C4 plaque C4 plaque SRR24654069 K Caries Plaque EC plaque EC plaque EC plaque SRR24654070 K Caries Free Plaque C4 plaque C4 plaque C4 plaque SRR24654071 K Caries Free Plaque C4 plaque C4 plaque C4 plaque SRR24654072 K Caries Plaque EC plaque EC plaque EC plaque SRR24654073 K Caries Plaque EC plaque EC plaque EC plaque SRR24654074 K Caries Plaque AC plaque AC plaque AC plaque SRR24654075 K Caries Plaque EC plaque EC plaque EC plaque SRR24654076 K Caries Free Plaque remin plaque remin plaque remin plaque SRR24654077 K Caries Plaque EC plaque EC plaque EC plaque SRR24654078 K Caries Free Plaque C2.5 plaque C2.5 plaque C2.5 plaque SRR24654079 K Caries Plaque AC plaque AC plaque AC plaque SRR24654080 K Caries Free Plaque C4 plaque C4 plaque C4 plaque SRR24654081 K Caries Free Plaque C4 plaque C4 plaque C4 plaque SRR24654082 K Caries Plaque EC plaque EC plaque EC plaque SRR24654083 K Caries Plaque EC plaque EC plaque EC plaque SRR24654084 K Caries Free Plaque C2.5 plaque C2.5 plaque C2.5 plaque SRR24654085 K Missing Plaque missing plaque missing plaque missing plaque SRR24654086 K Caries Free Plaque C6.5 plaque C6.5 plaque C6.5 plaque SRR24654087 K Caries Free Plaque C6.5 plaque C6.5 plaque C6.5 plaque SRR24654088 K Caries Free Plaque C6.5 plaque C6.5 plaque C6.5 plaque SRR24654089 K Caries Plaque AC plaque AC plaque AC plaque SRR24654090 K Caries Plaque EC plaque EC plaque EC plaque SRR24654091 K Caries Free Plaque CFAT plaque CFAT plaque CFAT plaque SRR24654092 K Caries Free Plaque remin plaque remin plaque remin plaque SRR24654093 K Caries Plaque EC plaque EC plaque EC plaque SRR24654094 K Caries Plaque EC plaque EC plaque EC plaque SRR24654095 K Caries Free Plaque C2.5 plaque C2.5 plaque C2.5 plaque SRR24654096 K Caries Free Plaque C6.5 plaque C6.5 plaque C6.5 plaque SRR24654097 K Caries Free Plaque C6.5 plaque C6.5 plaque C6.5 plaque SRR24654098 K Caries Free Plaque C6.5 plaque C6.5 plaque C6.5 plaque SRR24654099 K Caries Free Plaque CFAT plaque CFAT plaque CFAT plaque SRR24654100 K Caries Free Plaque CFAT plaque CFAT plaque CFAT plaque SRR24654101 K Caries Free Plaque CFAT plaque CFAT plaque CFAT plaque SRR24654102 K Missing Plaque missing plaque missing plaque missing plaque SRR24654103 K Missing Plaque missing plaque missing plaque missing plaque SRR24654104 K Caries Plaque EC plaque EC plaque EC plaque SRR24654105 K Missing Plaque missing plaque missing plaque missing plaque SRR24654106 K Caries Free Plaque remin plaque remin plaque remin plaque SRR24654107 K Caries Plaque EC plaque EC plaque EC plaque SRR24654108 K Caries Free Plaque C2.5 plaque C2.5 plaque C2.5 plaque SRR24654109 K Caries Free Plaque CFAT plaque CFAT plaque CFAT plaque SRR24654110 K Caries Free Plaque CFAT plaque CFAT plaque CFAT plaque SRR24654111 K Caries Free Plaque CFAT plaque CFAT plaque CFAT plaque SRR24654112 K Caries Free Plaque CFAT plaque CFAT plaque CFAT plaque SRR24654113 K Caries Free Plaque CFAT plaque CFAT plaque CFAT plaque SRR24654114 K Caries Free Plaque CFAT plaque CFAT plaque CFAT plaque SRR24654115 K Caries Free Plaque C2.5 plaque C2.5 plaque C2.5 plaque SRR24654116 K Caries Plaque EC plaque EC plaque EC plaque SRR24654117 K Caries Plaque EC plaque EC plaque EC plaque SRR24654118 K Caries Free Plaque C2.5 plaque C2.5 plaque C2.5 plaque SRR24654119 K Caries Plaque AC plaque AC plaque AC plaque SRR24654120 K Caries Plaque AC plaque AC plaque AC plaque SRR24654121 K Caries Free Plaque C2.5 plaque C2.5 plaque C2.5 plaque SRR24654122 K Caries Free Plaque CFAT plaque CFAT plaque CFAT plaque SRR24654123 K Missing Plaque missing plaque missing plaque missing plaque SRR24654124 K Caries Free Plaque remin plaque remin plaque remin plaque SRR24654125 K Caries Plaque EC plaque EC plaque EC plaque SRR24654126 K Caries Free Plaque C2.5 plaque C2.5 plaque C2.5 plaque SRR24654127 K Missing Plaque missing plaque missing plaque missing plaque SRR24654128 K Missing Plaque missing plaque missing plaque missing plaque SRR24654129 K Caries Plaque EC plaque EC plaque EC plaque SRR24654130 K Missing Plaque missing plaque missing plaque missing plaque SRR24654131 K Caries Plaque EC plaque EC plaque EC plaque SRR24654132 K Caries Free Plaque C4 plaque C4 plaque C4 plaque SRR24654133 K Caries Free Plaque C4 plaque C4 plaque C4 plaque SRR24654134 K Caries Free Plaque CFAT plaque CFAT plaque CFAT plaque SRR24654135 K Caries Free Plaque CFAT plaque CFAT plaque CFAT plaque SRR24654136 K Caries Plaque EC plaque EC plaque EC plaque SRR24654137 K Caries Free Plaque C4 plaque C4 plaque C4 plaque SRR24654138 K Caries Free Plaque CFAT plaque CFAT plaque CFAT plaque SRR24654139 K Caries Free Plaque CFAT plaque CFAT plaque CFAT plaque SRR24654140 K Caries Free Plaque C4 plaque C4 plaque C4 plaque SRR24654141 K Caries Free Plaque CFAT plaque CFAT plaque CFAT plaque SRR24654142 K Caries Free Plaque C6.5 plaque C6.5 plaque C6.5 plaque SRR24654143 K Caries Free Plaque C6.5 plaque C6.5 plaque C6.5 plaque SRR24654144 K Caries Free Plaque CFAT plaque CFAT plaque CFAT plaque SRR24654145 K Caries Free Plaque CFAT plaque CFAT plaque CFAT plaque SRR24654146 K Caries Free Plaque CFAT plaque CFAT plaque CFAT plaque SRR24654147 K Caries Free Plaque remin plaque remin plaque remin plaque SRR24654148 K Caries Plaque EC plaque EC plaque EC plaque SRR24654149 K Caries Free Plaque C2.5 plaque C2.5 plaque C2.5 plaque SRR24654150 K Caries Free Plaque CFAT plaque CFAT plaque CFAT plaque SRR24654151 K Caries Free Plaque C4 plaque C4 plaque C4 plaque SRR24654152 K Caries Free Plaque CFAT plaque CFAT plaque CFAT plaque SRR24654153 K Caries Free Plaque CFAT plaque CFAT plaque CFAT plaque SRR24654154 K Missing Plaque missing plaque missing plaque missing plaque SRR24654155 K Caries Free Plaque C4 plaque C4 plaque C4 plaque SRR24654156 K Caries Plaque EC plaque EC plaque EC plaque SRR24654157 K Caries Free Plaque C4 plaque C4 plaque C4 plaque SRR24654158 K Caries Free Plaque C4 plaque C4 plaque C4 plaque SRR24654159 K Caries Plaque EC plaque EC plaque EC plaque SRR24654160 K Caries Free Plaque C4 plaque C4 plaque C4 plaque SRR24654161 K Caries Free Plaque C4 plaque C4 plaque C4 plaque SRR24654162 K Caries Free Plaque C6.5 plaque C6.5 plaque C6.5 plaque SRR24654163 K Caries Free Plaque C6.5 plaque C6.5 plaque C6.5 plaque SRR24654164 K Caries Free Plaque C6.5 plaque C6.5 plaque C6.5 plaque SRR24654165 K Caries Free Plaque CFAT plaque CFAT plaque CFAT plaque SRR24654166 K Caries Plaque EC plaque EC plaque EC plaque SRR24654167 K Caries Free Plaque CFAT plaque CFAT plaque CFAT plaque SRR24654168 K Caries Free Plaque CFAT plaque CFAT plaque CFAT plaque SRR24654169 K Caries Plaque EC plaque EC plaque EC plaque SRR24654170 K Caries Plaque EC plaque EC plaque EC plaque SRR24654171 K Caries Plaque EC plaque EC plaque EC plaque SRR24654172 K Caries Plaque EC plaque EC plaque EC plaque SRR24654173 K Caries Free Plaque C2.5 plaque C2.5 plaque C2.5 plaque SRR24654174 K Caries Free Plaque C6.5 plaque C6.5 plaque C6.5 plaque SRR24654175 K Caries Free Plaque C6.5 plaque C6.5 plaque C6.5 plaque SRR24654176 K Caries Free Plaque C6.5 plaque C6.5 plaque C6.5 plaque SRR24654177 K Caries Free Plaque C4 plaque C4 plaque C4 plaque SRR24654178 K Caries Free Plaque remin plaque remin plaque remin plaque SRR24654179 K Caries Plaque EC plaque EC plaque EC plaque SRR24654180 K Caries Free Plaque C2.5 plaque C2.5 plaque C2.5 plaque SRR24654181 K Caries Free Plaque C6.5 plaque C6.5 plaque C6.5 plaque SRR24654182 K Caries Free Plaque C6.5 plaque C6.5 plaque C6.5 plaque SRR24654183 K Caries Free Plaque C6.5 plaque C6.5 plaque C6.5 plaque SRR24654184 K Caries Free Plaque CFAT plaque CFAT plaque CFAT plaque SRR24654185 K Caries Free Plaque CFAT plaque CFAT plaque CFAT plaque SRR24654186 K Caries Free Plaque CFAT plaque CFAT plaque CFAT plaque SRR24654187 K Caries Free Plaque CFAT plaque CFAT plaque CFAT plaque SRR24654188 K Caries Plaque EC plaque EC plaque EC plaque SRR24654189 K Caries Free Plaque C4 plaque C4 plaque C4 plaque SRR24654190 K Caries Free Plaque remin plaque remin plaque remin plaque SRR24654191 K Caries Plaque EC plaque EC plaque EC plaque SRR24654192 K Caries Plaque AC plaque AC plaque AC plaque SRR24654193 K Caries Free Plaque C2.5 plaque C2.5 plaque C2.5 plaque SRR24654194 K Caries Plaque AC plaque AC plaque AC plaque SRR24654195 K Caries Plaque EC plaque EC plaque EC plaque SRR24654196 K Caries Free Plaque C2.5 plaque C2.5 plaque C2.5 plaque SRR24654197 K Caries Plaque EC plaque EC plaque EC plaque SRR24654198 K Caries Plaque EC plaque EC plaque EC plaque SRR24654199 K Caries Free Plaque C2.5 plaque C2.5 plaque C2.5 plaque SRR24654200 K Caries Free Plaque C6.5 plaque C6.5 plaque C6.5 plaque SRR24654201 K Caries Free Plaque C6.5 plaque C6.5 plaque C6.5 plaque SRR24654202 K Caries Free Plaque C6.5 plaque C6.5 plaque C6.5 plaque SRR24654203 K Caries Plaque EC plaque EC plaque EC plaque SRR24654204 K Caries Plaque EC plaque EC plaque EC plaque SRR24654205 K Caries Plaque AC plaque AC plaque AC plaque SRR24654206 K Caries Plaque EC plaque EC plaque EC plaque SRR24654207 K Caries Free Plaque C2.5 plaque C2.5 plaque C2.5 plaque SRR24654208 K Caries Plaque EC plaque EC plaque EC plaque SRR24654209 K Caries Free Plaque C4 plaque C4 plaque C4 plaque SRR24654210 K Caries Free Plaque C4 plaque C4 plaque C4 plaque SRR24654211 K Caries Free Plaque CFAT plaque CFAT plaque CFAT plaque SRR24654212 K Caries Free Plaque CFAT plaque CFAT plaque CFAT plaque SRR24654213 K Caries Free Plaque CFAT plaque CFAT plaque CFAT plaque SRR24654214 K Caries Plaque EC plaque EC plaque EC plaque SRR24654215 K Caries Free Plaque C2.5 plaque C2.5 plaque C2.5 plaque SRR24654216 K Caries Plaque EC plaque EC plaque EC plaque SRR24654217 K Caries Free Plaque C2.5 plaque C2.5 plaque C2.5 plaque SRR24654218 K Caries Free Plaque CFAT plaque CFAT plaque CFAT plaque SRR24654219 K Caries Plaque EC plaque EC plaque EC plaque SRR24654220 K Missing Plaque missing plaque missing plaque missing plaque SRR24654221 K Missing Plaque missing plaque missing plaque missing plaque SRR24654222 K Caries Free Plaque CFAT plaque CFAT plaque CFAT plaque SRR24654223 K Caries Free Plaque CFAT plaque CFAT plaque CFAT plaque SRR24654224 K Caries Free Plaque CFAT plaque CFAT plaque CFAT plaque SRR24654225 K Caries Plaque AC plaque AC plaque AC plaque SRR24654226 K Caries Free Plaque C4 plaque C4 plaque C4 plaque SRR24654227 K Caries Free Plaque C4 plaque C4 plaque C4 plaque SRR24654228 K Missing Plaque missing plaque missing plaque missing plaque SRR24654229 K Missing Plaque missing plaque missing plaque missing plaque SRR24654230 K Caries Free Plaque C1 plaque C1 plaque C1 plaque SRR24654231 K Caries Plaque AC plaque AC plaque AC plaque SRR24654232 K Caries Free Plaque C4 plaque C4 plaque C4 plaque SRR24654233 K Caries Free Plaque C6.5 plaque C6.5 plaque C6.5 plaque SRR24654234 K Caries Free Plaque C6.5 plaque C6.5 plaque C6.5 plaque SRR24654235 K Missing Plaque missing plaque missing plaque missing plaque SRR24654236 K Missing Plaque missing plaque missing plaque missing plaque SRR24654237 K Missing Plaque missing plaque missing plaque missing plaque SRR24654238 K Missing Plaque missing plaque missing plaque missing plaque SRR24654239 K Missing Plaque missing plaque missing plaque missing plaque SRR24654240 K Missing Plaque missing plaque missing plaque missing plaque SRR24654241 K Caries Free Plaque C1 plaque C1 plaque C1 plaque SRR24654242 K Missing Plaque missing plaque missing plaque missing plaque SRR24654243 K Missing Plaque missing plaque missing plaque missing plaque SRR24654244 K Missing Plaque missing plaque missing plaque missing plaque SRR24654245 K Caries Free Plaque CFAT plaque CFAT plaque CFAT plaque SRR24654246 K Caries Free Plaque CFAT plaque CFAT plaque CFAT plaque SRR24654247 K Caries Free Plaque CFAT plaque CFAT plaque CFAT plaque SRR24654248 K Caries Plaque AC plaque AC plaque AC plaque SRR24654249 K Caries Free Plaque C4 plaque C4 plaque C4 plaque SRR24654250 K Caries Free Plaque C4 plaque C4 plaque C4 plaque SRR24654251 K Caries Free Plaque C2.5 plaque C2.5 plaque C2.5 plaque SRR24654252 K Caries Free Plaque remin plaque remin plaque remin plaque SRR24654253 K Caries Plaque EC plaque EC plaque EC plaque SRR24654254 K Caries Free Plaque C2.5 plaque C2.5 plaque C2.5 plaque SRR24654255 K Caries Plaque EC plaque EC plaque EC plaque SRR24654256 K Missing Plaque missing plaque missing plaque missing plaque SRR24654257 K Caries Plaque EC plaque EC plaque EC plaque SRR24654258 K Caries Free Plaque C2.5 plaque C2.5 plaque C2.5 plaque SRR24654259 K Caries Plaque EC plaque EC plaque EC plaque SRR24654260 K Caries Plaque EC plaque EC plaque EC plaque SRR24654261 K Caries Free Plaque C2.5 plaque C2.5 plaque C2.5 plaque SRR24654262 K Caries Plaque EC plaque EC plaque EC plaque SRR24654263 K Caries Plaque EC plaque EC plaque EC plaque SRR24654264 K Caries Free Plaque C2.5 plaque C2.5 plaque C2.5 plaque SRR24654265 K Caries Plaque EC plaque EC plaque EC plaque SRR24654266 K Caries Free Plaque C4 plaque C4 plaque C4 plaque SRR24654267 K Missing Plaque missing plaque missing plaque missing plaque SRR24654268 K Caries Free Plaque C4 plaque C4 plaque C4 plaque SRR24654269 K Caries Plaque EC plaque EC plaque EC plaque SRR24654270 K Caries Plaque EC plaque EC plaque EC plaque SRR24654271 K Caries Plaque EC plaque EC plaque EC plaque SRR24654272 K Caries Free Plaque C4 plaque C4 plaque C4 plaque SRR24654273 K Caries Plaque EC plaque EC plaque EC plaque SRR24654274 K Caries Free Plaque C4 plaque C4 plaque C4 plaque SRR24654275 K Caries Free Plaque C4 plaque C4 plaque C4 plaque SRR24654276 K Caries Free Plaque CFAT plaque CFAT plaque CFAT plaque SRR24654277 K Caries Free Plaque CFAT plaque CFAT plaque CFAT plaque SRR24654278 K Caries Plaque AC plaque AC plaque AC plaque SRR24654279 K Caries Free Plaque CFAT plaque CFAT plaque CFAT plaque SRR24654280 K Caries Free Plaque remin plaque remin plaque remin plaque SRR24654281 K Caries Plaque EC plaque EC plaque EC plaque SRR24654282 K Caries Free Plaque C2.5 plaque C2.5 plaque C2.5 plaque SRR24654283 K Caries Free Plaque CFAT plaque CFAT plaque CFAT plaque SRR24654284 K Caries Free Plaque CFAT plaque CFAT plaque CFAT plaque SRR24654285 K Caries Free Plaque CFAT plaque CFAT plaque CFAT plaque SRR24654286 K Missing Plaque missing plaque missing plaque missing plaque SRR24654287 K Caries Free Plaque remin plaque remin plaque remin plaque SRR24654288 K Caries Free Plaque CFAT plaque CFAT plaque CFAT plaque SRR24654289 K Caries Free Plaque CFAT plaque CFAT plaque CFAT plaque SRR24654290 K Caries Plaque EC plaque EC plaque EC plaque SRR24654291 K Caries Plaque EC plaque EC plaque EC plaque SRR24654292 K Caries Free Plaque C2.5 plaque C2.5 plaque C2.5 plaque SRR24654293 K Caries Free Plaque CFAT plaque CFAT plaque CFAT plaque SRR24654294 K Caries Free Plaque CFAT plaque CFAT plaque CFAT plaque SRR24654295 K Caries Free Plaque CFAT plaque CFAT plaque CFAT plaque SRR24654296 K Caries Free Plaque CFAT plaque CFAT plaque CFAT plaque SRR24654297 K Caries Free Plaque CFAT plaque CFAT plaque CFAT plaque SRR24654298 K Missing Plaque missing plaque missing plaque missing plaque SRR24654299 K Caries Plaque EC plaque EC plaque EC plaque SRR24654300 K Caries Free Plaque C4 plaque C4 plaque C4 plaque SRR24654301 K Caries Free Plaque C4 plaque C4 plaque C4 plaque SRR24654302 K Missing Plaque missing plaque missing plaque missing plaque SRR24654303 K Missing Plaque missing plaque missing plaque missing plaque SRR24654304 K Missing Plaque missing plaque missing plaque missing plaque SRR24654305 K Caries Free Plaque CFAT plaque CFAT plaque CFAT plaque SRR24654306 K Caries Free Plaque CFAT plaque CFAT plaque CFAT plaque SRR24654307 K Caries Free Plaque CFAT plaque CFAT plaque CFAT plaque SRR24654308 K Caries Plaque AC plaque AC plaque AC plaque SRR24654309 K Missing Plaque missing plaque missing plaque missing plaque SRR24654310 K Caries Plaque EC plaque EC plaque EC plaque SRR24654311 K Caries Free Plaque C2.5 plaque C2.5 plaque C2.5 plaque SRR24654312 K Caries Plaque EC plaque EC plaque EC plaque SRR24654313 K Caries Plaque EC plaque EC plaque EC plaque SRR24654314 K Caries Free Plaque C2.5 plaque C2.5 plaque C2.5 plaque SRR24654315 K Missing Plaque missing plaque missing plaque missing plaque SRR24654316 K Missing Plaque missing plaque missing plaque missing plaque SRR24654317 K Missing Plaque missing plaque missing plaque missing plaque SRR24654318 K Missing Plaque missing plaque missing plaque missing plaque SRR24654319 K Missing Plaque missing plaque missing plaque missing plaque SRR24654320 K Caries Free Plaque CFAT plaque CFAT plaque CFAT plaque SRR24654321 K Caries Free Plaque CFAT plaque CFAT plaque CFAT plaque SRR24654322 K Caries Plaque AC plaque AC plaque AC plaque SRR24654323 K Caries Free Plaque CFAT plaque CFAT plaque CFAT plaque SRR24654324 K Caries Plaque EC plaque EC plaque EC plaque SRR24654325 K Caries Free Plaque C4 plaque C4 plaque C4 plaque SRR24654326 K Caries Free Plaque C4 plaque C4 plaque C4 plaque SRR24654327 K Caries Free Plaque remin plaque remin plaque remin plaque SRR24654328 K Caries Plaque EC plaque EC plaque EC plaque SRR24654329 K Caries Free Plaque C2.5 plaque C2.5 plaque C2.5 plaque SRR24654330 K Caries Free Plaque CFAT plaque CFAT plaque CFAT plaque SRR24654331 K Caries Free Plaque CFAT plaque CFAT plaque CFAT plaque SRR24654332 K Caries Free Plaque CFAT plaque CFAT plaque CFAT plaque SRR24654333 K Caries Plaque EC plaque EC plaque EC plaque SRR24654334 K Caries Plaque EC plaque EC plaque EC plaque SRR24654335 K Caries Free Plaque C6.5 plaque C6.5 plaque C6.5 plaque SRR24654336 K Caries Free Plaque C6.5 plaque C6.5 plaque C6.5 plaque SRR24654337 K Caries Free Plaque C6.5 plaque C6.5 plaque C6.5 plaque SRR24654338 K Caries Plaque EC plaque EC plaque EC plaque SRR24654339 K Caries Free Plaque C4 plaque C4 plaque C4 plaque SRR24654340 K Caries Free Plaque C4 plaque C4 plaque C4 plaque SRR24654341 K Caries Free Plaque CFAT plaque CFAT plaque CFAT plaque SRR24654342 K Caries Free Plaque CFAT plaque CFAT plaque CFAT plaque SRR24654343 K Caries Free Plaque CFAT plaque CFAT plaque CFAT plaque SRR24654344 K Caries Plaque EC plaque EC plaque EC plaque SRR24654345 K Caries Free Plaque C2.5 plaque C2.5 plaque C2.5 plaque SRR24654346 K Caries Free Plaque C4 plaque C4 plaque C4 plaque SRR24654347 K Caries Free Plaque CFAT plaque CFAT plaque CFAT plaque SRR24654348 K Caries Free Plaque C4 plaque C4 plaque C4 plaque SRR24654349 K Caries Free Plaque C2.5 plaque C2.5 plaque C2.5 plaque SRR24654350 K Caries Free Plaque CFAT plaque CFAT plaque CFAT plaque SRR24654351 K Caries Free Plaque CFAT plaque CFAT plaque CFAT plaque SRR24654352 K Caries Free Plaque CFAT plaque CFAT plaque CFAT plaque SRR24654353 K Caries Plaque EC plaque EC plaque EC plaque SRR24654354 K Caries Free Plaque C4 plaque C4 plaque C4 plaque SRR24654355 K Caries Free Plaque C4 plaque C4 plaque C4 plaque SRR24654356 K Caries Plaque AC plaque AC plaque AC plaque SRR24654357 K Caries Free Plaque C6.5 plaque C6.5 plaque C6.5 plaque SRR24654358 K Caries Free Plaque C6.5 plaque C6.5 plaque C6.5 plaque SRR24654359 K Caries Free Plaque C6.5 plaque C6.5 plaque C6.5 plaque SRR24654360 K Caries Free Plaque CFAT plaque CFAT plaque CFAT plaque SRR24654361 K Caries Free Plaque CFAT plaque CFAT plaque CFAT plaque SRR24654362 K Caries Free Plaque CFAT plaque CFAT plaque CFAT plaque SRR24654363 K Caries Plaque EC plaque EC plaque EC plaque SRR24654364 K Caries Free Plaque C4 plaque C4 plaque C4 plaque SRR24654365 K Caries Plaque EC plaque EC plaque EC plaque SRR24654366 K Caries Free Plaque C4 plaque C4 plaque C4 plaque SRR24654367 K Caries Plaque EC plaque EC plaque EC plaque SRR24654368 K Caries Free Plaque C4 plaque C4 plaque C4 plaque SRR24654369 K Caries Free Plaque C4 plaque C4 plaque C4 plaque SRR24654370 K Caries Plaque EC plaque EC plaque EC plaque SRR24654371 K Caries Plaque EC plaque EC plaque EC plaque SRR24654372 K Caries Free Plaque C2.5 plaque C2.5 plaque C2.5 plaque SRR24654373 K Caries Free Plaque CFAT plaque CFAT plaque CFAT plaque SRR24654374 K Caries Free Plaque CFAT plaque CFAT plaque CFAT plaque SRR24654375 K Caries Free Plaque CFAT plaque CFAT plaque CFAT plaque SRR24654376 K Caries Free Plaque C2.5 plaque C2.5 plaque C2.5 plaque SRR24654377 K Caries Free Plaque C6.5 plaque C6.5 plaque C6.5 plaque SRR24654378 K Caries Free Plaque C6.5 plaque C6.5 plaque C6.5 plaque SRR24654379 K Caries Free Plaque C6.5 plaque C6.5 plaque C6.5 plaque SRR24654380 K Caries Plaque EC plaque EC plaque EC plaque SRR24654381 K Caries Plaque EC plaque EC plaque EC plaque SRR24654382 K Caries Free Plaque C2.5 plaque C2.5 plaque C2.5 plaque SRR24654383 K Caries Free Plaque CFAT plaque CFAT plaque CFAT plaque SRR24654384 K Caries Free Plaque CFAT plaque CFAT plaque CFAT plaque SRR24654385 K Caries Plaque EC plaque EC plaque EC plaque SRR24654386 K Caries Free Plaque C2.5 plaque C2.5 plaque C2.5 plaque SRR24654387 K Caries Plaque AC plaque AC plaque AC plaque SRR24654388 K Caries Free Plaque C4 plaque C4 plaque C4 plaque SRR24654389 K Caries Free Plaque C4 plaque C4 plaque C4 plaque SRR24654390 K Missing Plaque missing plaque missing plaque missing plaque SRR24654391 K Missing Plaque missing plaque missing plaque missing plaque SRR24654392 K Caries Free Plaque C6.5 plaque C6.5 plaque C6.5 plaque SRR24654393 K Caries Free Plaque C6.5 plaque C6.5 plaque C6.5 plaque SRR24654394 K Caries Free Plaque C6.5 plaque C6.5 plaque C6.5 plaque SRR24654395 K Caries Plaque AC plaque AC plaque AC plaque SRR24654396 K Caries Free Plaque CFAT plaque CFAT plaque CFAT plaque SRR24654397 K Caries Free Plaque CFAT plaque CFAT plaque CFAT plaque SRR24654398 K Caries Free Plaque CFAT plaque CFAT plaque CFAT plaque SRR24654399 K Caries Free Plaque C6.5 plaque C6.5 plaque C6.5 plaque SRR24654400 K Caries Free Plaque C6.5 plaque C6.5 plaque C6.5 plaque SRR24654401 K Caries Free Plaque C6.5 plaque C6.5 plaque C6.5 plaque SRR24654402 K Caries Free Plaque C6.5 plaque C6.5 plaque C6.5 plaque SRR24654403 K Caries Free Plaque C6.5 plaque C6.5 plaque C6.5 plaque SRR24654404 K Caries Free Plaque C6.5 plaque C6.5 plaque C6.5 plaque SRR24654405 K Caries Free Plaque C6.5 plaque C6.5 plaque C6.5 plaque SRR24654406 K Caries Free Plaque C4 plaque C4 plaque C4 plaque SRR24654407 K Caries Free Plaque C6.5 plaque C6.5 plaque C6.5 plaque SRR24654408 K Caries Free Plaque C6.5 plaque C6.5 plaque C6.5 plaque SRR24654409 K Caries Free Plaque C6.5 plaque C6.5 plaque C6.5 plaque SRR24654410 K Caries Free Plaque C6.5 plaque C6.5 plaque C6.5 plaque SRR24654411 K Caries Plaque AC plaque AC plaque AC plaque SRR24654412 K Caries Free Plaque C4 plaque C4 plaque C4 plaque SRR24654413 K Caries Free Plaque C4 plaque C4 plaque C4 plaque SRR24654414 K Caries Plaque EC plaque EC plaque EC plaque SRR24654415 K Caries Free Plaque C4 plaque C4 plaque C4 plaque SRR24654416 K Caries Free Plaque C4 plaque C4 plaque C4 plaque SRR24654417 K Caries Plaque EC plaque EC plaque EC plaque SRR24654418 K Caries Plaque EC plaque EC plaque EC plaque SRR24654419 K Caries Free Plaque C2.5 plaque C2.5 plaque C2.5 plaque SRR24654420 K Caries Plaque EC plaque EC plaque EC plaque SRR24654421 K Caries Free Plaque C2.5 plaque C2.5 plaque C2.5 plaque SRR24654422 K Caries Free Plaque C4 plaque C4 plaque C4 plaque SRR24654423 K Caries Free Plaque C4 plaque C4 plaque C4 plaque SRR24654424 K Caries Plaque EC plaque EC plaque EC plaque SRR24654425 K Caries Plaque EC plaque EC plaque EC plaque SRR24654426 K Caries Free Plaque C2.5 plaque C2.5 plaque C2.5 plaque SRR24654427 K Caries Free Plaque C6.5 plaque C6.5 plaque C6.5 plaque SRR24654428 K Caries Free Plaque C6.5 plaque C6.5 plaque C6.5 plaque SRR24654429 K Caries Free Plaque C6.5 plaque C6.5 plaque C6.5 plaque SRR24654430 K Caries Free Plaque remin plaque remin plaque remin plaque SRR24654431 K Caries Plaque EC plaque EC plaque EC plaque SRR24654432 K Caries Plaque EC plaque EC plaque EC plaque SRR24654433 K Caries Free Plaque C2.5 plaque C2.5 plaque C2.5 plaque SRR24654434 K Caries Free Plaque CFAT plaque CFAT plaque CFAT plaque SRR24654435 K Caries Free Plaque CFAT plaque CFAT plaque CFAT plaque SRR24654436 K Caries Free Plaque CFAT plaque CFAT plaque CFAT plaque SRR24654437 K Missing Plaque missing plaque missing plaque missing plaque SRR24654438 K Missing Plaque missing plaque missing plaque missing plaque SRR24654439 K Caries Free Plaque CFAT plaque CFAT plaque CFAT plaque SRR24654440 K Caries Free Plaque CFAT plaque CFAT plaque CFAT plaque SRR24654441 K Caries Plaque EC plaque EC plaque EC plaque SRR24654442 K Caries Free Plaque C4 plaque C4 plaque C4 plaque SRR24654443 K Caries Free Plaque C4 plaque C4 plaque C4 plaque SRR24654444 K Caries Free Plaque C6.5 plaque C6.5 plaque C6.5 plaque SRR24654445 K Caries Free Plaque C6.5 plaque C6.5 plaque C6.5 plaque SRR24654446 K Caries Plaque EC plaque EC plaque EC plaque SRR24654447 K Caries Free Plaque C6.5 plaque C6.5 plaque C6.5 plaque SRR24654448 K Caries Plaque AC plaque AC plaque AC plaque SRR24654449 K Caries Plaque EC plaque EC plaque EC plaque SRR24654450 K Caries Free Plaque C2.5 plaque C2.5 plaque C2.5 plaque SRR24654451 K Caries Free Plaque remin plaque remin plaque remin plaque SRR24654452 K Caries Plaque EC plaque EC plaque EC plaque SRR24654453 K Caries Free Plaque C2.5 plaque C2.5 plaque C2.5 plaque SRR24654454 K Caries Plaque AC plaque AC plaque AC plaque SRR24654455 K Caries Free Plaque C4 plaque C4 plaque C4 plaque SRR24654456 K Caries Free Plaque C4 plaque C4 plaque C4 plaque SRR24654457 K Caries Free Plaque C4 plaque C4 plaque C4 plaque SRR24654458 K Caries Plaque EC plaque EC plaque EC plaque SRR24654459 K Caries Free Plaque C4 plaque C4 plaque C4 plaque SRR24654460 K Caries Free Plaque C4 plaque C4 plaque C4 plaque SRR24654461 K Caries Plaque EC plaque EC plaque EC plaque SRR24654462 K Caries Free Plaque C4 plaque C4 plaque C4 plaque SRR24654463 K Caries Free Plaque C4 plaque C4 plaque C4 plaque SRR24654464 K Caries Free Plaque remin plaque remin plaque remin plaque SRR24654465 K Caries Free Plaque CFAT plaque CFAT plaque CFAT plaque SRR24654466 K Caries Free Plaque CFAT plaque CFAT plaque CFAT plaque SRR24654467 K Caries Plaque AC plaque AC plaque AC plaque SRR24654468 K Caries Plaque AC plaque AC plaque AC plaque SRR24654469 K Caries Free Plaque C2.5 plaque C2.5 plaque C2.5 plaque SRR24654470 K Caries Plaque AC plaque AC plaque AC plaque SRR24654471 K Caries Free Plaque C1 plaque C1 plaque C1 plaque SRR24654472 K Caries Plaque EC plaque EC plaque EC plaque SRR24654473 K Caries Free Plaque C1 plaque C1 plaque C1 plaque SRR24654474 K Caries Free Plaque C4 plaque C4 plaque C4 plaque SRR24654475 K Missing Plaque missing plaque missing plaque missing plaque SRR24654476 K Missing Plaque missing plaque missing plaque missing plaque SRR24654477 K Caries Plaque AC plaque AC plaque AC plaque SRR24654478 K Caries Free Plaque C4 plaque C4 plaque C4 plaque SRR24654479 K Caries Plaque AC plaque AC plaque AC plaque SRR24654480 K Caries Free Plaque C4 plaque C4 plaque C4 plaque SRR24654481 K Caries Free Plaque C4 plaque C4 plaque C4 plaque SRR24654482 K Caries Free Plaque C6.5 plaque C6.5 plaque C6.5 plaque SRR24654483 K Caries Free Plaque C4 plaque C4 plaque C4 plaque SRR24654484 K Caries Free Plaque C6.5 plaque C6.5 plaque C6.5 plaque SRR24654485 K Caries Free Plaque C6.5 plaque C6.5 plaque C6.5 plaque SRR24654486 K Caries Free Plaque C6.5 plaque C6.5 plaque C6.5 plaque SRR24654487 K Missing Plaque missing plaque missing plaque missing plaque SRR24654488 K Missing Plaque missing plaque missing plaque missing plaque SRR24654489 K Missing Plaque missing plaque missing plaque missing plaque SRR24654490 K Caries Free Plaque C6.5 plaque C6.5 plaque C6.5 plaque SRR24654491 K Caries Free Plaque C6.5 plaque C6.5 plaque C6.5 plaque SRR24654492 K Missing Plaque missing plaque missing plaque missing plaque SRR24654493 K Missing Plaque missing plaque missing plaque missing plaque SRR24654494 K Caries Free Plaque C4 plaque C4 plaque C4 plaque SRR24654495 K Missing Plaque missing plaque missing plaque missing plaque SRR24654496 K Missing Plaque missing plaque missing plaque missing plaque SRR24654497 K Missing Plaque missing plaque missing plaque missing plaque SRR24654498 K Caries Free Plaque CFAT plaque CFAT plaque CFAT plaque SRR24654499 K Missing Plaque missing plaque missing plaque missing plaque SRR24654500 K Caries Free Plaque CFAT plaque CFAT plaque CFAT plaque SRR24654501 K Caries Free Plaque CFAT plaque CFAT plaque CFAT plaque SRR24654502 K Caries Free Plaque CFAT plaque CFAT plaque CFAT plaque SRR24654503 K Caries Free Plaque C6.5 plaque C6.5 plaque C6.5 plaque SRR24654504 K Caries Free Plaque C6.5 plaque C6.5 plaque C6.5 plaque SRR24654505 K Caries Free Plaque CFAT plaque CFAT plaque CFAT plaque SRR24654506 K Caries Free Plaque CFAT plaque CFAT plaque CFAT plaque SRR24654507 K Caries Free Plaque CFAT plaque CFAT plaque CFAT plaque SRR24654508 K Caries Plaque AC plaque AC plaque AC plaque SRR24654509 K Caries Free Plaque CFAT plaque CFAT plaque CFAT plaque SRR24654510 K Caries Plaque EC plaque EC plaque EC plaque SRR24654511 K Caries Free Plaque C2.5 plaque C2.5 plaque C2.5 plaque SRR24654512 K Caries Free Plaque C6.5 plaque C6.5 plaque C6.5 plaque SRR24654513 K Caries Free Plaque C6.5 plaque C6.5 plaque C6.5 plaque SRR24654514 K Caries Free Plaque C6.5 plaque C6.5 plaque C6.5 plaque SRR24654515 K Caries Plaque AC plaque AC plaque AC plaque SRR24654516 K Caries Plaque AC plaque AC plaque AC plaque SRR24654517 K Caries Free Plaque C2.5 plaque C2.5 plaque C2.5 plaque SRR24654518 K Caries Plaque AC plaque AC plaque AC plaque SRR24654519 K Caries Free Plaque C4 plaque C4 plaque C4 plaque SRR24654520 K Caries Free Plaque CFAT plaque CFAT plaque CFAT plaque SRR24654521 K Caries Free Plaque C6.5 plaque C6.5 plaque C6.5 plaque SRR24654522 K Caries Free Plaque C6.5 plaque C6.5 plaque C6.5 plaque SRR24654523 K Caries Free Plaque C6.5 plaque C6.5 plaque C6.5 plaque SRR24654524 K Caries Plaque AC plaque AC plaque AC plaque SRR24654525 K Caries Free Plaque C4 plaque C4 plaque C4 plaque SRR24654526 K Caries Free Plaque C4 plaque C4 plaque C4 plaque SRR24654527 K Caries Free Plaque CFAT plaque CFAT plaque CFAT plaque SRR24654528 K Caries Free Plaque CFAT plaque CFAT plaque CFAT plaque SRR24654529 K Caries Plaque EC plaque EC plaque EC plaque SRR24654530 K Caries Free Plaque C4 plaque C4 plaque C4 plaque SRR24654531 K Caries Free Plaque C4 plaque C4 plaque C4 plaque SRR24654532 K Caries Plaque EC plaque EC plaque EC plaque SRR24654533 K Caries Free Plaque C4 plaque C4 plaque C4 plaque SRR24654534 K Caries Free Plaque C4 plaque C4 plaque C4 plaque SRR24654535 K Caries Plaque AC plaque AC plaque AC plaque SRR24654536 K Missing Plaque missing plaque missing plaque missing plaque SRR24654537 K Missing Plaque missing plaque missing plaque missing plaque SRR24654538 K Missing Plaque missing plaque missing plaque missing plaque SRR24654539 K Caries Plaque EC plaque EC plaque EC plaque SRR24654540 K Caries Free Plaque C4 plaque C4 plaque C4 plaque SRR24654541 K Caries Plaque AC plaque AC plaque AC plaque SRR24654542 K Caries Free Plaque C4 plaque C4 plaque C4 plaque SRR24654543 K Caries Free Plaque C4 plaque C4 plaque C4 plaque SRR24654544 K Caries Plaque AC plaque AC plaque AC plaque SRR24654545 K Caries Free Plaque C4 plaque C4 plaque C4 plaque SRR24654546 K Caries Free Plaque C2.5 plaque C2.5 plaque C2.5 plaque SRR24654547 K Caries Free Plaque C4 plaque C4 plaque C4 plaque SRR24654548 K Caries Free Plaque C6.5 plaque C6.5 plaque C6.5 plaque SRR24654549 K Caries Free Plaque C6.5 plaque C6.5 plaque C6.5 plaque SRR24654550 K Caries Free Plaque C6.5 plaque C6.5 plaque C6.5 plaque SRR24654551 K Caries Plaque AC plaque AC plaque AC plaque SRR24654552 K Caries Plaque AC plaque AC plaque AC plaque SRR24654553 K Caries Free Plaque C2.5 plaque C2.5 plaque C2.5 plaque SRR24654554 K Caries Free Plaque CFAT plaque CFAT plaque CFAT plaque SRR24654555 K Caries Free Plaque CFAT plaque CFAT plaque CFAT plaque SRR24654556 K Caries Free Plaque CFAT plaque CFAT plaque CFAT plaque SRR24654557 K Caries Plaque AC plaque AC plaque AC plaque SRR24654558 K Caries Plaque EC plaque EC plaque EC plaque SRR24654559 K Caries Free Plaque C4 plaque C4 plaque C4 plaque SRR24654560 K Caries Free Plaque C4 plaque C4 plaque C4 plaque SRR24654561 K Missing Plaque missing plaque missing plaque missing plaque SRR24654562 K Missing Plaque missing plaque missing plaque missing plaque SRR24654563 K Missing Plaque missing plaque missing plaque missing plaque SRR24654564 K Missing Plaque missing plaque missing plaque missing plaque SRR24654565 K Missing Plaque missing plaque missing plaque missing plaque SRR24654566 K Missing Plaque missing plaque missing plaque missing plaque SRR24654567 K Missing Plaque missing plaque missing plaque missing plaque SRR24654568 K Missing Plaque missing plaque missing plaque missing plaque SRR24654569 K Caries Plaque EC plaque EC plaque EC plaque SRR24654570 K Caries Plaque EC plaque EC plaque EC plaque SRR24654571 K Caries Plaque EC plaque EC plaque EC plaque SRR24654572 K Caries Free Plaque C2.5 plaque C2.5 plaque C2.5 plaque SRR24654573 K Caries Plaque AC plaque AC plaque AC plaque SRR24654574 K Caries Plaque AC plaque AC plaque AC plaque SRR24654575 K Caries Free Plaque C2.5 plaque C2.5 plaque C2.5 plaque SRR24654576 K Caries Plaque AC plaque AC plaque AC plaque SRR24654577 K Caries Plaque EC plaque EC plaque EC plaque SRR24654578 K Caries Free Plaque C2.5 plaque C2.5 plaque C2.5 plaque SRR24654579 K Caries Plaque EC plaque EC plaque EC plaque SRR24654580 K Caries Free Plaque C4 plaque C4 plaque C4 plaque SRR24654581 K Caries Free Plaque C4 plaque C4 plaque C4 plaque SRR24654582 K Caries Free Plaque C2.5 plaque C2.5 plaque C2.5 plaque SRR24654583 K Missing Plaque missing plaque missing plaque missing plaque SRR24654584 K Missing Plaque missing plaque missing plaque missing plaque SRR24654585 K Missing Plaque missing plaque missing plaque missing plaque SRR24654586 K Caries Free Plaque CFAT plaque CFAT plaque CFAT plaque SRR24654587 K Caries Free Plaque CFAT plaque CFAT plaque CFAT plaque SRR24654588 K Caries Plaque EC plaque EC plaque EC plaque SRR24654589 K Caries Free Plaque CFAT plaque CFAT plaque CFAT plaque SRR24654590 K Caries Plaque EC plaque EC plaque EC plaque SRR24654591 K Caries Free Plaque C4 plaque C4 plaque C4 plaque SRR24654592 K Caries Free Plaque C4 plaque C4 plaque C4 plaque SRR24654593 K Caries Plaque AC plaque AC plaque AC plaque SRR24654594 K Caries Free Plaque C4 plaque C4 plaque C4 plaque SRR24654595 K Caries Free Plaque C4 plaque C4 plaque C4 plaque SRR24654596 K Caries Plaque AC plaque AC plaque AC plaque SRR24654597 K Caries Free Plaque C4 plaque C4 plaque C4 plaque SRR24654598 K Caries Free Plaque C4 plaque C4 plaque C4 plaque SRR24654599 K Caries Free Plaque C4 plaque C4 plaque C4 plaque SRR24654600 K Caries Plaque AC plaque AC plaque AC plaque SRR24654601 K Caries Plaque AC plaque AC plaque AC plaque SRR24654602 K Caries Free Plaque C2.5 plaque C2.5 plaque C2.5 plaque SRR24654603 K Caries Free Plaque C6.5 plaque C6.5 plaque C6.5 plaque SRR24654604 K Caries Free Plaque C6.5 plaque C6.5 plaque C6.5 plaque SRR24654605 K Caries Free Plaque C6.5 plaque C6.5 plaque C6.5 plaque SRR24654606 K Caries Plaque EC plaque EC plaque EC plaque SRR24654607 K Caries Free Plaque C4 plaque C4 plaque C4 plaque SRR24654608 K Caries Free Plaque C4 plaque C4 plaque C4 plaque SRR24654609 K Caries Plaque EC plaque EC plaque EC plaque SRR24654610 K Caries Free Plaque C4 plaque C4 plaque C4 plaque SRR24654611 K Caries Free Plaque C4 plaque C4 plaque C4 plaque SRR24654612 K Caries Free Plaque C4 plaque C4 plaque C4 plaque SRR24654613 K Missing Plaque missing plaque missing plaque missing plaque SRR24654614 K Missing Plaque missing plaque missing plaque missing plaque SRR24654615 K Caries Free Plaque C4 plaque C4 plaque C4 plaque SRR24654616 K Caries Free Plaque CFAT plaque CFAT plaque CFAT plaque SRR24654617 K Caries Free Plaque CFAT plaque CFAT plaque CFAT plaque SRR24654618 K Caries Free Plaque CFAT plaque CFAT plaque CFAT plaque SRR24654619 K Missing Plaque missing plaque missing plaque missing plaque SRR24654620 K Missing Plaque missing plaque missing plaque missing plaque SRR24654621 K Missing Plaque missing plaque missing plaque missing plaque SRR24654622 K Caries Free Plaque C6.5 plaque C6.5 plaque C6.5 plaque SRR24654623 K Caries Free Plaque C6.5 plaque C6.5 plaque C6.5 plaque SRR24654624 K Caries Plaque EC plaque EC plaque EC plaque SRR24654625 K Caries Free Plaque C6.5 plaque C6.5 plaque C6.5 plaque SRR24654626 K Caries Free Plaque CFAT plaque CFAT plaque CFAT plaque SRR24654627 K Caries Free Plaque CFAT plaque CFAT plaque CFAT plaque SRR24654628 K Caries Free Plaque CFAT plaque CFAT plaque CFAT plaque SRR24654629 K Missing Plaque missing plaque missing plaque missing plaque SRR24654630 K Missing Plaque missing plaque missing plaque missing plaque SRR24654631 K Missing Plaque missing plaque missing plaque missing plaque SRR24654632 K Caries Free Plaque C6.5 plaque C6.5 plaque C6.5 plaque SRR24654633 K Caries Free Plaque C6.5 plaque C6.5 plaque C6.5 plaque SRR24654634 K Caries Free Plaque C6.5 plaque C6.5 plaque C6.5 plaque SRR24654635 K Caries Free Plaque C4 plaque C4 plaque C4 plaque SRR24654636 K Caries Plaque EC plaque EC plaque EC plaque SRR24654637 K Caries Free Plaque C4 plaque C4 plaque C4 plaque SRR24654638 K Caries Free Plaque C4 plaque C4 plaque C4 plaque SRR24654639 K Caries Free Plaque C6.5 plaque C6.5 plaque C6.5 plaque SRR24654640 K Caries Free Plaque C6.5 plaque C6.5 plaque C6.5 plaque SRR24654641 K Caries Free Plaque C6.5 plaque C6.5 plaque C6.5 plaque SRR24654642 K Caries Plaque EC plaque EC plaque EC plaque SRR24654643 K Caries Free Plaque C4 plaque C4 plaque C4 plaque SRR24654644 K Caries Free Plaque C4 plaque C4 plaque C4 plaque SRR24654645 K Caries Free Plaque remin plaque remin plaque remin plaque SRR24654646 K Caries Free Plaque C4 plaque C4 plaque C4 plaque SRR24654647 K Caries Plaque EC plaque EC plaque EC plaque SRR24654648 K Caries Free Plaque C2.5 plaque C2.5 plaque C2.5 plaque SRR24654649 K Caries Free Plaque remin plaque remin plaque remin plaque SRR24654650 K Caries Free Plaque C4 plaque C4 plaque C4 plaque SRR24654651 K Caries Plaque EC plaque EC plaque EC plaque SRR24654652 K Caries Free Plaque C2.5 plaque C2.5 plaque C2.5 plaque SRR24654653 K Caries Free Plaque CFAT plaque CFAT plaque CFAT plaque SRR24654654 K Caries Free Plaque CFAT plaque CFAT plaque CFAT plaque SRR24654655 K Caries Free Plaque CFAT plaque CFAT plaque CFAT plaque SRR24654656 K Caries Free Plaque CFAT plaque CFAT plaque CFAT plaque SRR24654657 K Caries Free Plaque CFAT plaque CFAT plaque CFAT plaque SRR24654658 K Caries Free Plaque CFAT plaque CFAT plaque CFAT plaque SRR24654659 K Caries Plaque EC plaque EC plaque EC plaque SRR24654660 K Caries Free Plaque C4 plaque C4 plaque C4 plaque SRR24654661 K Caries Plaque EC plaque EC plaque EC plaque SRR24654662 K Caries Free Plaque C4 plaque C4 plaque C4 plaque SRR24654663 K Caries Free Plaque CFAT plaque CFAT plaque CFAT plaque SRR24654664 K Caries Free Plaque CFAT plaque CFAT plaque CFAT plaque SRR24654665 K Caries Free Plaque CFAT plaque CFAT plaque CFAT plaque SRR24654666 K Caries Plaque AC plaque AC plaque AC plaque SRR24654667 K Caries Plaque EC plaque EC plaque EC plaque SRR24654668 K Caries Free Plaque C2.5 plaque C2.5 plaque C2.5 plaque SRR24654669 K Caries Free Plaque remin plaque remin plaque remin plaque SRR24654670 K Caries Plaque EC plaque EC plaque EC plaque SRR24654671 K Caries Free Plaque C2.5 plaque C2.5 plaque C2.5 plaque SRR24654672 K Caries Plaque EC plaque EC plaque EC plaque SRR24654673 K Caries Free Plaque C6.5 plaque C6.5 plaque C6.5 plaque SRR24654674 K Caries Free Plaque C6.5 plaque C6.5 plaque C6.5 plaque SRR24654675 K Caries Free Plaque C6.5 plaque C6.5 plaque C6.5 plaque SRR24654676 K Caries Plaque EC plaque EC plaque EC plaque SRR24654677 K Caries Plaque EC plaque EC plaque EC plaque SRR24654678 K Caries Free Plaque C2.5 plaque C2.5 plaque C2.5 plaque SRR24654679 K Missing Plaque missing plaque missing plaque missing plaque SRR24654680 K Missing Plaque missing plaque missing plaque missing plaque SRR24654681 K Caries Plaque EC plaque EC plaque EC plaque SRR24654682 K Caries Free Plaque C4 plaque C4 plaque C4 plaque SRR24654683 K Caries Free Plaque C4 plaque C4 plaque C4 plaque SRR24654684 K Caries Plaque AC plaque AC plaque AC plaque SRR24654685 K Caries Free Plaque C6.5 plaque C6.5 plaque C6.5 plaque SRR24654686 K Caries Free Plaque C6.5 plaque C6.5 plaque C6.5 plaque SRR24654687 K Caries Plaque EC plaque EC plaque EC plaque SRR24654688 K Caries Free Plaque remin plaque remin plaque remin plaque SRR24654689 K Caries Plaque EC plaque EC plaque EC plaque SRR24654690 K Caries Free Plaque C2.5 plaque C2.5 plaque C2.5 plaque SRR24654691 K Caries Plaque AC plaque AC plaque AC plaque SRR24654692 K Caries Plaque AC plaque AC plaque AC plaque SRR24654693 K Caries Free Plaque C2.5 plaque C2.5 plaque C2.5 plaque SRR24654694 K Caries Free Plaque CFAT plaque CFAT plaque CFAT plaque SRR24654695 K Caries Free Plaque CFAT plaque CFAT plaque CFAT plaque SRR24654696 K Caries Free Plaque CFAT plaque CFAT plaque CFAT plaque SRR24654697 K Missing Plaque missing plaque missing plaque missing plaque SRR24654698 K Caries Free Plaque C4 plaque C4 plaque C4 plaque SRR24654699 K Missing Plaque missing plaque missing plaque missing plaque SRR24654700 K Missing Plaque missing plaque missing plaque missing plaque SRR24654701 K Caries Plaque EC plaque EC plaque EC plaque SRR24654702 K Caries Free Plaque C4 plaque C4 plaque C4 plaque SRR24654703 K Caries Free Plaque C4 plaque C4 plaque C4 plaque SRR24654704 K Caries Plaque AC plaque AC plaque AC plaque SRR24654705 K Caries Free Plaque C4 plaque C4 plaque C4 plaque SRR24654706 K Caries Plaque AC plaque AC plaque AC plaque SRR24654707 K Caries Free Plaque C4 plaque C4 plaque C4 plaque SRR24654708 K Caries Free Plaque C4 plaque C4 plaque C4 plaque SRR24654709 K Caries Plaque EC plaque EC plaque EC plaque SRR24654710 K Caries Plaque AC plaque AC plaque AC plaque SRR24654711 K Caries Free Plaque CFAT plaque CFAT plaque CFAT plaque SRR24654712 K Missing Plaque missing plaque missing plaque missing plaque SRR24654713 K Caries Plaque EC plaque EC plaque EC plaque SRR24654714 K Missing Plaque missing plaque missing plaque missing plaque SRR24654715 K Missing Plaque missing plaque missing plaque missing plaque SRR24654716 K Caries Free Plaque CFAT plaque CFAT plaque CFAT plaque SRR24654717 K Caries Free Plaque CFAT plaque CFAT plaque CFAT plaque SRR24654718 K Caries Free Plaque CFAT plaque CFAT plaque CFAT plaque SRR24654719 K Caries Free Plaque CFAT plaque CFAT plaque CFAT plaque SRR24654720 K Caries Free Plaque CFAT plaque CFAT plaque CFAT plaque SRR24654721 K Caries Free Plaque CFAT plaque CFAT plaque CFAT plaque SRR24654722 K Caries Free Plaque C6.5 plaque C6.5 plaque C6.5 plaque SRR24654723 K Caries Free Plaque C6.5 plaque C6.5 plaque C6.5 plaque SRR24654724 K Caries Free Plaque C4 plaque C4 plaque C4 plaque SRR24654725 K Caries Plaque AC plaque AC plaque AC plaque SRR24654726 K Caries Free Plaque C4 plaque C4 plaque C4 plaque SRR24654727 K Caries Free Plaque C4 plaque C4 plaque C4 plaque SRR24654728 K Caries Plaque EC plaque EC plaque EC plaque SRR24654729 K Caries Free Plaque C4 plaque C4 plaque C4 plaque SRR24654730 K Caries Free Plaque C4 plaque C4 plaque C4 plaque SRR24654731 K Caries Free Plaque CFAT plaque CFAT plaque CFAT plaque SRR24654732 K Caries Free Plaque CFAT plaque CFAT plaque CFAT plaque SRR24654733 K Caries Free Plaque CFAT plaque CFAT plaque CFAT plaque SRR24654734 K Caries Plaque AC plaque AC plaque AC plaque SRR24654735 K Caries Free Plaque C4 plaque C4 plaque C4 plaque SRR24654736 K Caries Free Plaque C4 plaque C4 plaque C4 plaque SRR24654737 K Caries Free Plaque C4 plaque C4 plaque C4 plaque SRR24654738 K Caries Free Plaque C6.5 plaque C6.5 plaque C6.5 plaque SRR24654739 K Caries Free Plaque C6.5 plaque C6.5 plaque C6.5 plaque SRR24654740 K Caries Free Plaque C6.5 plaque C6.5 plaque C6.5 plaque SRR24654741 K Caries Free Plaque remin plaque remin plaque remin plaque SRR24654742 K Caries Plaque EC plaque EC plaque EC plaque SRR24654743 K Caries Plaque AC plaque AC plaque AC plaque SRR24654744 K Caries Plaque EC plaque EC plaque EC plaque SRR24654745 K Caries Free Plaque C2.5 plaque C2.5 plaque C2.5 plaque SRR24654746 K Caries Plaque EC plaque EC plaque EC plaque SRR24654747 K Caries Plaque EC plaque EC plaque EC plaque SRR24654748 K Caries Free Plaque C2.5 plaque C2.5 plaque C2.5 plaque SRR24654749 K Caries Free Plaque CFAT plaque CFAT plaque CFAT plaque SRR24654750 K Caries Free Plaque C4 plaque C4 plaque C4 plaque SRR24654751 K Caries Free Plaque CFAT plaque CFAT plaque CFAT plaque SRR24654752 K Caries Free Plaque CFAT plaque CFAT plaque CFAT plaque SRR24654753 K Caries Plaque EC plaque EC plaque EC plaque SRR24654754 K Caries Free Plaque C4 plaque C4 plaque C4 plaque SRR24654755 K Caries Free Plaque C4 plaque C4 plaque C4 plaque SRR24654756 K Caries Free Plaque CFAT plaque CFAT plaque CFAT plaque SRR24654757 K Caries Free Plaque CFAT plaque CFAT plaque CFAT plaque SRR24654758 K Caries Free Plaque CFAT plaque CFAT plaque CFAT plaque SRR24654759 K Caries Free Plaque remin plaque remin plaque remin plaque SRR24654760 K Caries Plaque EC plaque EC plaque EC plaque SRR24654761 K Caries Free Plaque C4 plaque C4 plaque C4 plaque SRR24654762 K Caries Free Plaque C2.5 plaque C2.5 plaque C2.5 plaque SRR24654763 K Caries Plaque EC plaque EC plaque EC plaque SRR24654764 K Caries Plaque EC plaque EC plaque EC plaque SRR24654765 K Caries Free Plaque C2.5 plaque C2.5 plaque C2.5 plaque SRR24654766 K Caries Plaque EC plaque EC plaque EC plaque SRR24654767 K Caries Plaque EC plaque EC plaque EC plaque SRR24654768 K Caries Free Plaque C2.5 plaque C2.5 plaque C2.5 plaque SRR24654769 K Caries Plaque AC plaque AC plaque AC plaque SRR24654770 K Caries Plaque AC plaque AC plaque AC plaque SRR24654771 K Missing Plaque missing plaque missing plaque missing plaque SRR24654772 K Caries Plaque AC plaque AC plaque AC plaque SRR24654773 K Caries Plaque EC plaque EC plaque EC plaque SRR24654774 K Caries Free Plaque C2.5 plaque C2.5 plaque C2.5 plaque SRR24655708 K Caries Saliva AC saliva AC Caries SRR24655709 K Caries Saliva AC saliva AC Caries SRR24655710 K Caries Free Saliva CFAT saliva CF Caries Free SRR24655711 K Caries Free Saliva CFAT saliva CF Caries Free SRR24655712 K Caries Free Saliva C6.5 saliva CF Caries Free SRR24655713 K Caries Free Saliva C6.5 saliva CF Caries Free SRR24655714 K Caries Free Saliva C6.5 saliva CF Caries Free SRR24655715 K Caries Free Saliva C6.5 saliva CF Caries Free SRR24655716 K Caries Free Saliva C6.5 saliva CF Caries Free SRR24655717 K Caries Free Saliva C6.5 saliva CF Caries Free SRR24655718 K Caries Saliva EC saliva EC Caries SRR24655719 K Caries Saliva AC saliva AC Caries SRR24655720 K Caries Free Saliva C4 saliva CF Caries Free SRR24655721 K Caries Free Saliva C4 saliva CF Caries Free SRR24655722 K Missing Saliva missing saliva missing missing SRR24655723 K Missing Saliva missing saliva missing missing SRR24655724 K Missing Saliva missing saliva missing missing SRR24655725 K Caries Free Saliva CFAT saliva CF Caries Free SRR24655726 K Caries Free Saliva CFAT saliva CF Caries Free SRR24655727 K Caries Free Saliva CFAT saliva CF Caries Free SRR24655728 K Caries Saliva AC saliva AC Caries SRR24655729 K Caries Free Saliva C4 saliva CF Caries Free SRR24655730 K Caries Saliva AC saliva AC Caries SRR24655731 K Caries Free Saliva C4 saliva CF Caries Free SRR24655732 K Missing Saliva missing saliva missing missing SRR24655733 K Missing Saliva missing saliva missing missing SRR24655734 K Missing Saliva missing saliva missing missing SRR24655735 K Caries Saliva AC saliva AC Caries SRR24655736 K Caries Free Saliva C4 saliva CF Caries Free SRR24655737 K Caries Free Saliva C4 saliva CF Caries Free SRR24655738 K Caries Free Saliva C6.5 saliva CF Caries Free SRR24655739 K Caries Free Saliva C6.5 saliva CF Caries Free SRR24655740 K Caries Free Saliva C6.5 saliva CF Caries Free SRR24655741 K Caries Free Saliva C1 saliva CF Caries Free SRR24655742 K Caries Saliva EC saliva EC Caries SRR24655743 K Caries Free Saliva C4 saliva CF Caries Free SRR24655744 K Caries Free Saliva C4 saliva CF Caries Free SRR24655745 K Caries Free Saliva C2.5 saliva CF Caries Free SRR24655746 K Caries Saliva EC saliva EC Caries SRR24655747 K Caries Saliva EC saliva EC Caries SRR24655748 K Caries Free Saliva C2.5 saliva CF Caries Free SRR24655749 K Caries Free Saliva remin saliva re Caries Free SRR24655750 K Caries Saliva EC saliva EC Caries SRR24655751 K Caries Free Saliva C2.5 saliva CF Caries Free SRR24655752 K Caries Saliva AC saliva AC Caries SRR24655753 K Caries Free Saliva C4 saliva CF Caries Free SRR24655754 K Caries Free Saliva C4 saliva CF Caries Free SRR24655755 K Caries Saliva EC saliva EC Caries SRR24655756 K Missing Saliva missing saliva missing missing SRR24655757 K Caries Saliva AC saliva AC Caries SRR24655758 K Caries Saliva EC saliva EC Caries SRR24655759 K Caries Free Saliva C2.5 saliva CF Caries Free SRR24655760 K Caries Free Saliva C6.5 saliva CF Caries Free SRR24655761 K Caries Free Saliva C6.5 saliva CF Caries Free SRR24655762 K Caries Free Saliva C6.5 saliva CF Caries Free SRR24655763 K Caries Saliva AC saliva AC Caries SRR24655764 K Caries Saliva EC saliva EC Caries SRR24655765 K Caries Free Saliva C2.5 saliva CF Caries Free SRR24655766 K Caries Free Saliva remin saliva re Caries Free SRR24655767 K Caries Saliva EC saliva EC Caries SRR24655768 K Missing Saliva missing saliva missing missing SRR24655769 K Caries Free Saliva C2.5 saliva CF Caries Free SRR24655770 K Caries Saliva EC saliva EC Caries SRR24655771 K Caries Saliva EC saliva EC Caries SRR24655772 K Caries Free Saliva C2.5 saliva CF Caries Free SRR24655773 K Caries Saliva EC saliva EC Caries SRR24655774 K Caries Free Saliva CFAT saliva CF Caries Free SRR24655775 K Caries Free Saliva CFAT saliva CF Caries Free SRR24655776 K Caries Free Saliva CFAT saliva CF Caries Free SRR24655777 K Caries Saliva EC saliva EC Caries SRR24655778 K Caries Free Saliva C4 saliva CF Caries Free SRR24655779 K Caries Free Saliva C4 saliva CF Caries Free SRR24655780 K Caries Free Saliva C4 saliva CF Caries Free SRR24655781 K Caries Free Saliva CFAT saliva CF Caries Free SRR24655782 K Caries Free Saliva CFAT saliva CF Caries Free SRR24655783 K Caries Free Saliva CFAT saliva CF Caries Free SRR24655784 K Caries Free Saliva C6.5 saliva CF Caries Free SRR24655785 K Caries Free Saliva C6.5 saliva CF Caries Free SRR24655786 K Caries Free Saliva C6.5 saliva CF Caries Free SRR24655787 K Caries Free Saliva CFAT saliva CF Caries Free SRR24655788 K Caries Free Saliva CFAT saliva CF Caries Free SRR24655789 K Caries Free Saliva CFAT saliva CF Caries Free SRR24655790 K Caries Free Saliva C4 saliva CF Caries Free SRR24655791 K Caries Free Saliva remin saliva re Caries Free SRR24655792 K Caries Saliva EC saliva EC Caries SRR24655793 K Caries Free Saliva C2.5 saliva CF Caries Free SRR24655794 K Caries Free Saliva CFAT saliva CF Caries Free SRR24655795 K Caries Free Saliva CFAT saliva CF Caries Free SRR24655796 K Caries Free Saliva CFAT saliva CF Caries Free SRR24655797 K Missing Saliva missing saliva missing missing SRR24655798 K Missing Saliva missing saliva missing missing SRR24655799 K Missing Saliva missing saliva missing missing SRR24655800 K Missing Saliva missing saliva missing missing SRR24655801 K Caries Saliva AC saliva AC Caries SRR24655802 K Missing Saliva missing saliva missing missing SRR24655803 K Missing Saliva missing saliva missing missing SRR24655804 K Caries Free Saliva CFAT saliva CF Caries Free SRR24655805 K Caries Free Saliva CFAT saliva CF Caries Free SRR24655806 K Caries Free Saliva C4 saliva CF Caries Free SRR24655807 K Caries Free Saliva C4 saliva CF Caries Free SRR24655808 K Caries Free Saliva C6.5 saliva CF Caries Free SRR24655809 K Caries Free Saliva C6.5 saliva CF Caries Free SRR24655810 K Caries Free Saliva C6.5 saliva CF Caries Free SRR24655811 K Caries Free Saliva CFAT saliva CF Caries Free SRR24655812 K Caries Free Saliva CFAT saliva CF Caries Free SRR24655813 K Caries Free Saliva CFAT saliva CF Caries Free SRR24655814 K Caries Saliva EC saliva EC Caries SRR24655815 K Caries Saliva EC saliva EC Caries SRR24655816 K Caries Free Saliva C4 saliva CF Caries Free SRR24655817 K Caries Free Saliva C2.5 saliva CF Caries Free SRR24655818 K Caries Saliva EC saliva EC Caries SRR24655819 K Caries Saliva EC saliva EC Caries SRR24655820 K Caries Free Saliva C2.5 saliva CF Caries Free SRR24655821 K Caries Free Saliva C6.5 saliva CF Caries Free SRR24655822 K Caries Free Saliva C6.5 saliva CF Caries Free SRR24655823 K Caries Free Saliva C6.5 saliva CF Caries Free SRR24655824 K Caries Free Saliva remin saliva re Caries Free SRR24655825 K Caries Saliva EC saliva EC Caries SRR24655826 K Caries Free Saliva C2.5 saliva CF Caries Free SRR24655827 K Caries Free Saliva C4 saliva CF Caries Free SRR24655828 K Caries Free Saliva C6.5 saliva CF Caries Free SRR24655829 K Caries Free Saliva C6.5 saliva CF Caries Free SRR24655830 K Caries Free Saliva C6.5 saliva CF Caries Free SRR24655831 K Caries Free Saliva CFAT saliva CF Caries Free SRR24655832 K Caries Free Saliva CFAT saliva CF Caries Free SRR24655833 K Caries Free Saliva CFAT saliva CF Caries Free SRR24655834 K Caries Free Saliva CFAT saliva CF Caries Free SRR24655835 K Caries Free Saliva CFAT saliva CF Caries Free SRR24655836 K Caries Free Saliva CFAT saliva CF Caries Free SRR24655837 K Caries Free Saliva CFAT saliva CF Caries Free SRR24655838 K Caries Free Saliva CFAT saliva CF Caries Free SRR24655839 K Caries Saliva EC saliva EC Caries SRR24655840 K Caries Saliva EC saliva EC Caries SRR24655841 K Caries Free Saliva CFAT saliva CF Caries Free SRR24655842 K Caries Free Saliva CFAT saliva CF Caries Free SRR24655843 K Caries Free Saliva CFAT saliva CF Caries Free SRR24655844 K Caries Free Saliva CFAT saliva CF Caries Free SRR24655845 K Caries Free Saliva CFAT saliva CF Caries Free SRR24655846 K Caries Saliva EC saliva EC Caries SRR24655847 K Caries Free Saliva C4 saliva CF Caries Free SRR24655848 K Caries Free Saliva C4 saliva CF Caries Free SRR24655849 K Caries Free Saliva CFAT saliva CF Caries Free SRR24655850 K Caries Free Saliva CFAT saliva CF Caries Free SRR24655851 K Caries Saliva EC saliva EC Caries SRR24655852 K Caries Free Saliva CFAT saliva CF Caries Free SRR24655853 K Caries Saliva AC saliva AC Caries SRR24655854 K Caries Saliva EC saliva EC Caries SRR24655855 K Caries Free Saliva C2.5 saliva CF Caries Free SRR24655856 K Caries Free Saliva remin saliva re Caries Free SRR24655857 K Caries Saliva EC saliva EC Caries SRR24655858 K Caries Free Saliva C2.5 saliva CF Caries Free SRR24655859 K Caries Free Saliva C6.5 saliva CF Caries Free SRR24655860 K Caries Free Saliva C6.5 saliva CF Caries Free SRR24655861 K Caries Free Saliva C6.5 saliva CF Caries Free SRR24655862 K Caries Free Saliva C2.5 saliva CF Caries Free SRR24655863 K Caries Saliva EC saliva EC Caries SRR24655864 K Caries Saliva EC saliva EC Caries SRR24655865 K Caries Free Saliva C2.5 saliva CF Caries Free SRR24655866 K Caries Saliva EC saliva EC Caries SRR24655867 K Caries Saliva EC saliva EC Caries SRR24655868 K Caries Free Saliva C2.5 saliva CF Caries Free SRR24655869 K Caries Saliva EC saliva EC Caries SRR24655870 K Caries Free Saliva C2.5 saliva CF Caries Free SRR24655871 K Caries Saliva AC saliva AC Caries SRR24655872 K Caries Free Saliva C1 saliva CF Caries Free SRR24655873 K Caries Free Saliva C1 saliva CF Caries Free SRR24655874 K Caries Saliva AC saliva AC Caries SRR24655875 K Caries Saliva EC saliva EC Caries SRR24655876 K Caries Free Saliva C4 saliva CF Caries Free SRR24655877 K Caries Free Saliva C4 saliva CF Caries Free SRR24655878 K Missing Saliva missing saliva missing missing SRR24655879 K Missing Saliva missing saliva missing missing SRR24655880 K Missing Saliva missing saliva missing missing SRR24655881 K Caries Saliva AC saliva AC Caries SRR24655882 K Caries Free Saliva C4 saliva CF Caries Free SRR24655883 K Caries Free Saliva C4 saliva CF Caries Free SRR24655884 K Caries Saliva AC saliva AC Caries SRR24655885 K Caries Free Saliva C4 saliva CF Caries Free SRR24655886 K Caries Free Saliva C4 saliva CF Caries Free SRR24655887 K Caries Saliva EC saliva EC Caries SRR24655888 K Caries Free Saliva C4 saliva CF Caries Free SRR24655889 K Caries Free Saliva C6.5 saliva CF Caries Free SRR24655890 K Caries Free Saliva C6.5 saliva CF Caries Free SRR24655891 K Caries Free Saliva C6.5 saliva CF Caries Free SRR24655892 K Caries Free Saliva C6.5 saliva CF Caries Free SRR24655893 K Caries Free Saliva C6.5 saliva CF Caries Free SRR24655894 K Caries Free Saliva C6.5 saliva CF Caries Free SRR24655895 K Missing Saliva missing saliva missing missing SRR24655896 K Missing Saliva missing saliva missing missing SRR24655897 K Missing Saliva missing saliva missing missing SRR24655898 K Caries Free Saliva C4 saliva CF Caries Free SRR24655899 K Caries Free Saliva C6.5 saliva CF Caries Free SRR24655900 K Caries Free Saliva C6.5 saliva CF Caries Free SRR24655901 K Caries Free Saliva C6.5 saliva CF Caries Free SRR24655902 K Caries Free Saliva C4 saliva CF Caries Free SRR24655903 K Caries Saliva AC saliva AC Caries SRR24655904 K Caries Free Saliva C4 saliva CF Caries Free SRR24655905 K Caries Free Saliva C4 saliva CF Caries Free SRR24655906 K Caries Saliva AC saliva AC Caries SRR24655907 K Caries Free Saliva C4 saliva CF Caries Free SRR24655908 K Caries Free Saliva C4 saliva CF Caries Free SRR24655909 K Caries Saliva AC saliva AC Caries SRR24655910 K Caries Saliva EC saliva EC Caries SRR24655911 K Caries Saliva EC saliva EC Caries SRR24655912 K Caries Free Saliva C2.5 saliva CF Caries Free SRR24655913 K Caries Saliva AC saliva AC Caries SRR24655914 K Caries Saliva AC saliva AC Caries SRR24655915 K Caries Free Saliva C2.5 saliva CF Caries Free SRR24655916 K Caries Free Saliva C6.5 saliva CF Caries Free SRR24655917 K Caries Free Saliva C6.5 saliva CF Caries Free SRR24655918 K Caries Free Saliva C6.5 saliva CF Caries Free SRR24655919 K Caries Saliva AC saliva AC Caries SRR24655920 K Caries Saliva AC saliva AC Caries SRR24655921 K Caries Saliva EC saliva EC Caries SRR24655922 K Caries Free Saliva C2.5 saliva CF Caries Free SRR24655923 K Missing Saliva missing saliva missing missing SRR24655924 K Missing Saliva missing saliva missing missing SRR24655925 K Missing Saliva missing saliva missing missing SRR24655926 K Caries Free Saliva CFAT saliva CF Caries Free SRR24655927 K Caries Free Saliva CFAT saliva CF Caries Free SRR24655928 K Caries Free Saliva CFAT saliva CF Caries Free SRR24655929 K Caries Free Saliva C6.5 saliva CF Caries Free SRR24655930 K Caries Free Saliva C6.5 saliva CF Caries Free SRR24655931 K Caries Free Saliva C6.5 saliva CF Caries Free SRR24655932 K Caries Free Saliva C2.5 saliva CF Caries Free SRR24655933 K Caries Free Saliva CFAT saliva CF Caries Free SRR24655934 K Caries Free Saliva C2.5 saliva CF Caries Free SRR24655935 K Missing Saliva missing saliva missing missing SRR24655936 K Missing Saliva missing saliva missing missing SRR24655937 K Missing Saliva missing saliva missing missing SRR24655938 K Missing Saliva missing saliva missing missing SRR24655939 K Missing Saliva missing saliva missing missing SRR24655940 K Missing Saliva missing saliva missing missing SRR24655941 K Missing Saliva missing saliva missing missing SRR24655942 K Missing Saliva missing saliva missing missing SRR24655943 K Missing Saliva missing saliva missing missing SRR24655944 K Caries Free Saliva CFAT saliva CF Caries Free SRR24655945 K Caries Free Saliva CFAT saliva CF Caries Free SRR24655946 K Caries Free Saliva CFAT saliva CF Caries Free SRR24655947 K Caries Free Saliva CFAT saliva CF Caries Free SRR24655948 K Caries Saliva AC saliva AC Caries SRR24655949 K Caries Free Saliva C4 saliva CF Caries Free SRR24655950 K Caries Free Saliva C4 saliva CF Caries Free SRR24655951 K Missing Saliva missing saliva missing missing SRR24655952 K Missing Saliva missing saliva missing missing SRR24655953 K Missing Saliva missing saliva missing missing SRR24655954 K Caries Free Saliva CFAT saliva CF Caries Free SRR24655955 K Caries Free Saliva CFAT saliva CF Caries Free SRR24655956 K Caries Free Saliva CFAT saliva CF Caries Free SRR24655957 K Caries Free Saliva CFAT saliva CF Caries Free SRR24655958 K Caries Free Saliva C6.5 saliva CF Caries Free SRR24655959 K Caries Free Saliva C6.5 saliva CF Caries Free SRR24655960 K Caries Free Saliva C6.5 saliva CF Caries Free SRR24655961 K Caries Free Saliva CFAT saliva CF Caries Free SRR24655962 K Caries Free Saliva CFAT saliva CF Caries Free SRR24655963 K Caries Free Saliva CFAT saliva CF Caries Free SRR24655964 K Caries Saliva AC saliva AC Caries SRR24655965 K Caries Saliva EC saliva EC Caries SRR24655966 K Caries Saliva EC saliva EC Caries SRR24655967 K Caries Free Saliva C2.5 saliva CF Caries Free SRR24655968 K Caries Saliva EC saliva EC Caries SRR24655969 K Caries Saliva EC saliva EC Caries SRR24655970 K Caries Free Saliva C2.5 saliva CF Caries Free SRR24655971 K Missing Saliva missing saliva missing missing SRR24655972 K Caries Saliva EC saliva EC Caries SRR24655973 K Caries Free Saliva C4 saliva CF Caries Free SRR24655974 K Caries Free Saliva C4 saliva CF Caries Free SRR24655975 K Caries Saliva EC saliva EC Caries SRR24655976 K Caries Saliva EC saliva EC Caries SRR24655977 K Caries Free Saliva C2.5 saliva CF Caries Free SRR24655978 K Caries Saliva EC saliva EC Caries SRR24655979 K Caries Free Saliva C4 saliva CF Caries Free SRR24655980 K Caries Free Saliva C4 saliva CF Caries Free SRR24655981 K Caries Saliva EC saliva EC Caries SRR24655982 K Caries Saliva AC saliva AC Caries SRR24655983 K Caries Free Saliva C4 saliva CF Caries Free SRR24655984 K Caries Free Saliva C4 saliva CF Caries Free SRR24655985 K Caries Free Saliva CFAT saliva CF Caries Free SRR24655986 K Caries Free Saliva CFAT saliva CF Caries Free SRR24655987 K Caries Free Saliva CFAT saliva CF Caries Free SRR24655988 K Caries Free Saliva remin saliva re Caries Free SRR24655989 K Caries Saliva EC saliva EC Caries SRR24655990 K Caries Free Saliva C2.5 saliva CF Caries Free SRR24655991 K Caries Saliva EC saliva EC Caries SRR24655992 K Caries Free Saliva C4 saliva CF Caries Free SRR24655993 K Caries Saliva AC saliva AC Caries SRR24655994 K Caries Free Saliva C4 saliva CF Caries Free SRR24655995 K Caries Saliva EC saliva EC Caries SRR24655996 K Caries Free Saliva C4 saliva CF Caries Free SRR24655997 K Caries Free Saliva C4 saliva CF Caries Free SRR24655998 K Missing Saliva missing saliva missing missing SRR24655999 K Caries Saliva EC saliva EC Caries SRR24656000 K Missing Saliva missing saliva missing missing SRR24656001 K Caries Free Saliva remin saliva re Caries Free SRR24656002 K Caries Saliva EC saliva EC Caries SRR24656003 K Caries Free Saliva C2.5 saliva CF Caries Free SRR24656004 K Caries Free Saliva CFAT saliva CF Caries Free SRR24656005 K Caries Free Saliva CFAT saliva CF Caries Free SRR24656006 K Caries Free Saliva CFAT saliva CF Caries Free SRR24656007 K Caries Free Saliva CFAT saliva CF Caries Free SRR24656008 K Caries Free Saliva CFAT saliva CF Caries Free SRR24656009 K Caries Free Saliva CFAT saliva CF Caries Free SRR24656010 K Caries Free Saliva C2.5 saliva CF Caries Free SRR24656011 K Caries Saliva EC saliva EC Caries SRR24656012 K Caries Saliva EC saliva EC Caries SRR24656013 K Caries Free Saliva C2.5 saliva CF Caries Free SRR24656014 K Caries Saliva AC saliva AC Caries SRR24656015 K Caries Saliva AC saliva AC Caries SRR24656016 K Caries Free Saliva C2.5 saliva CF Caries Free SRR24656017 K Caries Free Saliva CFAT saliva CF Caries Free SRR24656018 K Caries Free Saliva CFAT saliva CF Caries Free SRR24656019 K Caries Free Saliva CFAT saliva CF Caries Free SRR24656020 K Caries Free Saliva CFAT saliva CF Caries Free SRR24656021 K Missing Saliva missing saliva missing missing SRR24656022 K Caries Free Saliva CFAT saliva CF Caries Free SRR24656023 K Caries Free Saliva CFAT saliva CF Caries Free SRR24656024 K Caries Saliva EC saliva EC Caries SRR24656025 K Caries Saliva EC saliva EC Caries SRR24656026 K Caries Free Saliva C2.5 saliva CF Caries Free SRR24656027 K Caries Free Saliva CFAT saliva CF Caries Free SRR24656028 K Caries Free Saliva CFAT saliva CF Caries Free SRR24656029 K Caries Free Saliva CFAT saliva CF Caries Free SRR24656030 K Caries Free Saliva CFAT saliva CF Caries Free SRR24656031 K Caries Saliva EC saliva EC Caries SRR24656032 K Caries Free Saliva C4 saliva CF Caries Free SRR24656033 K Caries Free Saliva C4 saliva CF Caries Free SRR24656034 K Caries Free Saliva remin saliva re Caries Free SRR24656035 K Caries Saliva EC saliva EC Caries SRR24656036 K Caries Saliva EC saliva EC Caries SRR24656037 K Caries Free Saliva C2.5 saliva CF Caries Free SRR24656038 K Caries Free Saliva CFAT saliva CF Caries Free SRR24656039 K Caries Free Saliva CFAT saliva CF Caries Free SRR24656040 K Caries Free Saliva CFAT saliva CF Caries Free SRR24656041 K Caries Free Saliva C6.5 saliva CF Caries Free SRR24656042 K Caries Free Saliva C6.5 saliva CF Caries Free SRR24656043 K Caries Free Saliva C6.5 saliva CF Caries Free SRR24656044 K Caries Saliva EC saliva EC Caries SRR24656045 K Caries Free Saliva C4 saliva CF Caries Free SRR24656046 K Caries Saliva EC saliva EC Caries SRR24656047 K Caries Free Saliva C4 saliva CF Caries Free SRR24656048 K Caries Free Saliva C4 saliva CF Caries Free SRR24656049 K Caries Saliva EC saliva EC Caries SRR24656050 K Caries Saliva EC saliva EC Caries SRR24656051 K Caries Free Saliva C2.5 saliva CF Caries Free SRR24656052 K Caries Free Saliva CFAT saliva CF Caries Free SRR24656053 K Caries Free Saliva CFAT saliva CF Caries Free SRR24656054 K Caries Free Saliva CFAT saliva CF Caries Free SRR24656055 K Caries Free Saliva C2.5 saliva CF Caries Free SRR24656056 K Caries Free Saliva C6.5 saliva CF Caries Free SRR24656057 K Caries Free Saliva C6.5 saliva CF Caries Free SRR24656058 K Caries Free Saliva C6.5 saliva CF Caries Free SRR24656059 K Caries Saliva EC saliva EC Caries SRR24656060 K Caries Saliva EC saliva EC Caries SRR24656061 K Caries Free Saliva C2.5 saliva CF Caries Free SRR24656062 K Caries Free Saliva CFAT saliva CF Caries Free SRR24656063 K Caries Free Saliva CFAT saliva CF Caries Free SRR24656064 K Caries Free Saliva CFAT saliva CF Caries Free SRR24656065 K Caries Free Saliva remin saliva re Caries Free SRR24656066 K Caries Saliva EC saliva EC Caries SRR24656067 K Caries Saliva EC saliva EC Caries SRR24656068 K Caries Free Saliva C2.5 saliva CF Caries Free SRR24656069 K Caries Free Saliva C6.5 saliva CF Caries Free SRR24656070 K Caries Free Saliva C6.5 saliva CF Caries Free SRR24656071 K Caries Free Saliva C6.5 saliva CF Caries Free SRR24656072 K Caries Free Saliva CFAT saliva CF Caries Free SRR24656073 K Caries Free Saliva CFAT saliva CF Caries Free SRR24656074 K Caries Free Saliva CFAT saliva CF Caries Free SRR24656075 K Missing Saliva missing saliva missing missing SRR24656076 K Caries Free Saliva C4 saliva CF Caries Free SRR24656077 K Caries Saliva AC saliva AC Caries SRR24656078 K Caries Free Saliva C4 saliva CF Caries Free SRR24656079 K Caries Free Saliva C4 saliva CF Caries Free SRR24656080 K Caries Saliva EC saliva EC Caries SRR24656081 K Caries Free Saliva C4 saliva CF Caries Free SRR24656082 K Caries Saliva AC saliva AC Caries SRR24656083 K Caries Saliva AC saliva AC Caries SRR24656084 K Caries Free Saliva C2.5 saliva CF Caries Free SRR24656085 K Caries Free Saliva C6.5 saliva CF Caries Free SRR24656086 K Caries Free Saliva C6.5 saliva CF Caries Free SRR24656087 K Caries Free Saliva C6.5 saliva CF Caries Free SRR24656088 K Caries Saliva EC saliva EC Caries SRR24656089 K Caries Free Saliva C4 saliva CF Caries Free SRR24656090 K Caries Free Saliva C4 saliva CF Caries Free SRR24656091 K Caries Free Saliva C4 saliva CF Caries Free SRR24656092 K Caries Saliva EC saliva EC Caries SRR24656093 K Caries Free Saliva C4 saliva CF Caries Free SRR24656094 K Caries Free Saliva C4 saliva CF Caries Free SRR24656095 K Missing Saliva missing saliva missing missing SRR24656096 K Missing Saliva missing saliva missing missing SRR24656097 K Missing Saliva missing saliva missing missing SRR24656098 K Caries Free Saliva remin saliva re Caries Free SRR24656099 K Caries Saliva EC saliva EC Caries SRR24656100 K Caries Free Saliva C2.5 saliva CF Caries Free SRR24656101 K Missing Saliva missing saliva missing missing SRR24656102 K Caries Saliva EC saliva EC Caries SRR24656103 K Missing Saliva missing saliva missing missing SRR24656104 K Missing Saliva missing saliva missing missing SRR24656105 K Caries Saliva EC saliva EC Caries SRR24656106 K Caries Free Saliva C4 saliva CF Caries Free SRR24656107 K Caries Free Saliva C4 saliva CF Caries Free SRR24656108 K Missing Saliva missing saliva missing missing SRR24656109 K Caries Free Saliva C6.5 saliva CF Caries Free SRR24656110 K Caries Free Saliva C6.5 saliva CF Caries Free SRR24656111 K Caries Free Saliva C6.5 saliva CF Caries Free SRR24656112 K Caries Free Saliva CFAT saliva CF Caries Free SRR24656113 K Caries Free Saliva CFAT saliva CF Caries Free SRR24656114 K Caries Free Saliva CFAT saliva CF Caries Free SRR24656115 K Caries Free Saliva C6.5 saliva CF Caries Free SRR24656116 K Caries Free Saliva C6.5 saliva CF Caries Free SRR24656117 K Caries Free Saliva C4 saliva CF Caries Free SRR24656118 K Caries Free Saliva C6.5 saliva CF Caries Free SRR24656119 K Caries Free Saliva C6.5 saliva CF Caries Free SRR24656120 K Caries Free Saliva C6.5 saliva CF Caries Free SRR24656121 K Caries Free Saliva C6.5 saliva CF Caries Free SRR24656122 K Caries Free Saliva C6.5 saliva CF Caries Free SRR24656123 K Caries Free Saliva C6.5 saliva CF Caries Free SRR24656124 K Caries Free Saliva C6.5 saliva CF Caries Free SRR24656125 K Caries Free Saliva C6.5 saliva CF Caries Free SRR24656126 K Caries Free Saliva C6.5 saliva CF Caries Free SRR24656127 K Caries Free Saliva C6.5 saliva CF Caries Free SRR24656128 K Caries Free Saliva C4 saliva CF Caries Free SRR24656129 K Caries Saliva AC saliva AC Caries SRR24656130 K Caries Free Saliva C4 saliva CF Caries Free SRR24656131 K Caries Free Saliva C4 saliva CF Caries Free SRR24656132 K Caries Saliva EC saliva EC Caries SRR24656133 K Caries Free Saliva C4 saliva CF Caries Free SRR24656134 K Caries Free Saliva C4 saliva CF Caries Free SRR24656135 K Caries Saliva EC saliva EC Caries SRR24656136 K Caries Free Saliva C4 saliva CF Caries Free SRR24656137 K Caries Free Saliva C4 saliva CF Caries Free SRR24656138 K Caries Saliva EC saliva EC Caries SRR24656139 K Caries Saliva EC saliva EC Caries SRR24656140 K Caries Free Saliva remin saliva re Caries Free SRR24656141 K Caries Saliva EC saliva EC Caries SRR24656142 K Caries Free Saliva C2.5 saliva CF Caries Free SRR24656143 K Caries Saliva AC saliva AC Caries SRR24656144 K Caries Saliva AC saliva AC Caries SRR24656145 K Caries Saliva EC saliva EC Caries SRR24656146 K Caries Free Saliva C2.5 saliva CF Caries Free SRR24656147 K Caries Saliva EC saliva EC Caries SRR24656148 K Caries Saliva EC saliva EC Caries SRR24656149 K Caries Free Saliva C2.5 saliva CF Caries Free SRR24656150 K Caries Free Saliva C6.5 saliva CF Caries Free SRR24656151 K Caries Free Saliva C6.5 saliva CF Caries Free SRR24656152 K Caries Free Saliva C6.5 saliva CF Caries Free SRR24656153 K Caries Saliva AC saliva AC Caries SRR24656154 K Caries Saliva EC saliva EC Caries SRR24656155 K Caries Saliva EC saliva EC Caries SRR24656156 K Caries Free Saliva C2.5 saliva CF Caries Free SRR24656157 K Caries Saliva EC saliva EC Caries SRR24656158 K Caries Free Saliva C4 saliva CF Caries Free SRR24656159 K Caries Free Saliva C4 saliva CF Caries Free SRR24656160 K Caries Free Saliva CFAT saliva CF Caries Free SRR24656161 K Caries Free Saliva CFAT saliva CF Caries Free SRR24656162 K Caries Free Saliva CFAT saliva CF Caries Free SRR24656163 K Caries Saliva EC saliva EC Caries SRR24656164 K Caries Saliva EC saliva EC Caries SRR24656165 K Caries Free Saliva C2.5 saliva CF Caries Free SRR24656166 K Caries Free Saliva C2.5 saliva CF Caries Free SRR24656167 K Caries Free Saliva CFAT saliva CF Caries Free SRR24656168 K Caries Free Saliva CFAT saliva CF Caries Free SRR24656169 K Caries Free Saliva CFAT saliva CF Caries Free SRR24656170 K Caries Saliva EC saliva EC Caries SRR24656171 K Caries Free Saliva C4 saliva CF Caries Free SRR24656172 K Caries Free Saliva C4 saliva CF Caries Free SRR24656173 K Caries Free Saliva C2.5 saliva CF Caries Free SRR24656174 K Caries Free Saliva CFAT saliva CF Caries Free SRR24656175 K Caries Free Saliva CFAT saliva CF Caries Free SRR24656176 K Caries Free Saliva CFAT saliva CF Caries Free SRR24656177 K Caries Saliva EC saliva EC Caries SRR24656178 K Caries Free Saliva C4 saliva CF Caries Free SRR24656179 K Caries Free Saliva C4 saliva CF Caries Free SRR24656180 K Caries Free Saliva CFAT saliva CF Caries Free SRR24656181 K Caries Free Saliva CFAT saliva CF Caries Free SRR24656182 K Caries Free Saliva CFAT saliva CF Caries Free SRR24656183 K Missing Saliva missing saliva missing missing SRR24656184 K Caries Saliva EC saliva EC Caries SRR24656185 K Missing Saliva missing saliva missing missing SRR24656186 K Missing Saliva missing saliva missing missing SRR24656187 K Caries Free Saliva C6.5 saliva CF Caries Free SRR24656188 K Caries Saliva EC saliva EC Caries SRR24656189 K Caries Free Saliva CFAT saliva CF Caries Free SRR24656190 K Caries Free Saliva CFAT saliva CF Caries Free SRR24656191 K Caries Saliva EC saliva EC Caries SRR24656192 K Caries Free Saliva C4 saliva CF Caries Free SRR24656193 K Caries Free Saliva C4 saliva CF Caries Free SRR24656194 K Caries Free Saliva C6.5 saliva CF Caries Free SRR24656195 K Caries Free Saliva C6.5 saliva CF Caries Free SRR24656196 K Caries Free Saliva C6.5 saliva CF Caries Free SRR24656197 K Caries Saliva AC saliva AC Caries SRR24656198 K Caries Saliva EC saliva EC Caries SRR24656199 K Caries Free Saliva C4 saliva CF Caries Free SRR24656200 K Caries Free Saliva C2.5 saliva CF Caries Free SRR24656201 K Caries Free Saliva remin saliva re Caries Free SRR24656202 K Caries Saliva EC saliva EC Caries SRR24656203 K Caries Free Saliva C2.5 saliva CF Caries Free SRR24656204 K Caries Saliva AC saliva AC Caries SRR24656205 K Caries Free Saliva C4 saliva CF Caries Free SRR24656206 K Caries Free Saliva C4 saliva CF Caries Free SRR24656207 K Caries Saliva EC saliva EC Caries SRR24656208 K Caries Free Saliva C4 saliva CF Caries Free SRR24656209 K Caries Free Saliva C4 saliva CF Caries Free SRR24656210 K Caries Free Saliva C4 saliva CF Caries Free SRR24656211 K Caries Saliva EC saliva EC Caries SRR24656212 K Caries Free Saliva C4 saliva CF Caries Free SRR24656213 K Caries Free Saliva C4 saliva CF Caries Free SRR24656214 K Caries Free Saliva remin saliva re Caries Free SRR24656215 K Caries Saliva EC saliva EC Caries SRR24656216 K Caries Free Saliva C2.5 saliva CF Caries Free SRR24656217 K Caries Free Saliva remin saliva re Caries Free SRR24656218 K Caries Saliva EC saliva EC Caries SRR24656219 K Caries Free Saliva C2.5 saliva CF Caries Free SRR24656220 K Caries Free Saliva C4 saliva CF Caries Free SRR24656221 K Caries Free Saliva C4 saliva CF Caries Free SRR24656222 K Caries Saliva EC saliva EC Caries SRR24656223 K Caries Saliva EC saliva EC Caries SRR24656224 K Caries Saliva EC saliva EC Caries SRR24656225 K Caries Free Saliva C2.5 saliva CF Caries Free SRR24656226 K Caries Free Saliva C6.5 saliva CF Caries Free SRR24656227 K Caries Free Saliva C6.5 saliva CF Caries Free SRR24656228 K Caries Free Saliva C6.5 saliva CF Caries Free SRR24656229 K Caries Free Saliva remin saliva re Caries Free SRR24656230 K Caries Saliva EC saliva EC Caries SRR24656231 K Caries Free Saliva C2.5 saliva CF Caries Free SRR24656232 K Caries Free Saliva CFAT saliva CF Caries Free SRR24656233 K Caries Free Saliva CFAT saliva CF Caries Free SRR24656234 K Caries Saliva EC saliva EC Caries SRR24656235 K Caries Free Saliva CFAT saliva CF Caries Free SRR24656236 K Missing Saliva missing saliva missing missing SRR24656237 K Missing Saliva missing saliva missing missing SRR24656238 K Missing Saliva missing saliva missing missing SRR24656239 K Caries Free Saliva CFAT saliva CF Caries Free SRR24656240 K Caries Free Saliva CFAT saliva CF Caries Free SRR24656241 K Caries Free Saliva CFAT saliva CF Caries Free SRR24656242 K Missing Saliva missing saliva missing missing SRR24656243 K Missing Saliva missing saliva missing missing SRR24656244 K Missing Saliva missing saliva missing missing SRR24656245 K Caries Free Saliva C2.5 saliva CF Caries Free SRR24656246 K Caries Free Saliva CFAT saliva CF Caries Free SRR24656247 K Caries Free Saliva CFAT saliva CF Caries Free SRR24656248 K Caries Free Saliva CFAT saliva CF Caries Free SRR24656249 K Caries Saliva EC saliva EC Caries SRR24656250 K Caries Free Saliva C4 saliva CF Caries Free SRR24656251 K Caries Free Saliva C4 saliva CF Caries Free SRR24656252 K Missing Saliva missing saliva missing missing SRR24656253 K Missing Saliva missing saliva missing missing SRR24656254 K Missing Saliva missing saliva missing missing SRR24656255 K Missing Saliva missing saliva missing missing SRR24656256 K Missing Saliva missing saliva missing missing SRR24656257 K Missing Saliva missing saliva missing missing SRR24656258 K Caries Saliva EC saliva EC Caries SRR24656259 K Caries Saliva EC saliva EC Caries SRR24656260 K Caries Free Saliva C4 saliva CF Caries Free SRR24656261 K Caries Free Saliva C4 saliva CF Caries Free SRR24656262 K Caries Saliva AC saliva AC Caries SRR24656263 K Caries Free Saliva C4 saliva CF Caries Free SRR24656264 K Caries Free Saliva C4 saliva CF Caries Free SRR24656265 K Caries Free Saliva C6.5 saliva CF Caries Free SRR24656266 K Caries Free Saliva C6.5 saliva CF Caries Free SRR24656267 K Caries Free Saliva C6.5 saliva CF Caries Free SRR24656268 K Caries Free Saliva remin saliva re Caries Free SRR24656269 K Caries Saliva EC saliva EC Caries SRR24656270 K Caries Free Saliva C4 saliva CF Caries Free SRR24656271 K Caries Free Saliva C2.5 saliva CF Caries Free SRR24656272 K Caries Saliva AC saliva AC Caries SRR24656273 K Caries Saliva AC saliva AC Caries SRR24656274 K Caries Free Saliva C2.5 saliva CF Caries Free SRR24656275 K Caries Free Saliva CFAT saliva CF Caries Free SRR24656276 K Caries Free Saliva CFAT saliva CF Caries Free SRR24656277 K Caries Free Saliva CFAT saliva CF Caries Free SRR24656278 K Missing Saliva missing saliva missing missing SRR24656279 K Missing Saliva missing saliva missing missing SRR24656280 K Missing Saliva missing saliva missing missing SRR24656281 K Caries Free Saliva C4 saliva CF Caries Free SRR24656282 K Caries Saliva EC saliva EC Caries SRR24656283 K Caries Free Saliva C4 saliva CF Caries Free SRR24656284 K Caries Free Saliva C2.5 saliva CF Caries Free SRR24656285 K Caries Free Saliva CFAT saliva CF Caries Free SRR24656286 K Caries Free Saliva C6.5 saliva CF Caries Free SRR24656287 K Caries Free Saliva C6.5 saliva CF Caries Free SRR24656288 K Caries Free Saliva C6.5 saliva CF Caries Free SRR24656289 K Caries Saliva AC saliva AC Caries SRR24656290 K Caries Saliva AC saliva AC Caries SRR24656291 K Caries Free Saliva C2.5 saliva CF Caries Free SRR24656292 K Caries Saliva AC saliva AC Caries SRR24656293 K Caries Free Saliva C4 saliva CF Caries Free SRR24656294 K Caries Free Saliva C4 saliva CF Caries Free SRR24656295 K Caries Free Saliva C6.5 saliva CF Caries Free SRR24656296 K Caries Saliva EC saliva EC Caries SRR24656297 K Caries Free Saliva C6.5 saliva CF Caries Free SRR24656298 K Caries Free Saliva C6.5 saliva CF Caries Free SRR24656299 K Caries Saliva AC saliva AC Caries SRR24656300 K Caries Free Saliva C4 saliva CF Caries Free SRR24656301 K Caries Free Saliva C4 saliva CF Caries Free SRR24656302 K Caries Free Saliva CFAT saliva CF Caries Free SRR24656303 K Caries Free Saliva CFAT saliva CF Caries Free SRR24656304 K Caries Free Saliva CFAT saliva CF Caries Free SRR24656305 K Missing Saliva missing saliva missing missing SRR24656306 K Missing Saliva missing saliva missing missing SRR24656307 K Caries Free Saliva C4 saliva CF Caries Free SRR24656308 K Missing Saliva missing saliva missing missing SRR24656309 K Caries Free Saliva CFAT saliva CF Caries Free SRR24656310 K Caries Free Saliva CFAT saliva CF Caries Free SRR24656311 K Caries Free Saliva CFAT saliva CF Caries Free SRR24656312 K Caries Free Saliva CFAT saliva CF Caries Free SRR24656313 K Caries Free Saliva CFAT saliva CF Caries Free SRR24656314 K Caries Free Saliva CFAT saliva CF Caries Free SRR24656315 K Caries Free Saliva C6.5 saliva CF Caries Free SRR24656316 K Missing Saliva missing saliva missing missing SRR24656317 K Missing Saliva missing saliva missing missing SRR24656318 K Missing Saliva missing saliva missing missing SRR24656319 K Caries Saliva EC saliva EC Caries SRR24656320 K Caries Free Saliva C4 saliva CF Caries Free SRR24656321 K Caries Free Saliva C4 saliva CF Caries Free SRR24656322 K Caries Free Saliva C2.5 saliva CF Caries Free SRR24656323 K Caries Saliva AC saliva AC Caries SRR24656324 K Caries Free Saliva C4 saliva CF Caries Free SRR24656325 K Caries Free Saliva C4 saliva CF Caries Free SRR24656326 K Caries Saliva AC saliva AC Caries SRR24656327 K Caries Free Saliva C4 saliva CF Caries Free SRR24656328 K Caries Free Saliva C4 saliva CF Caries Free SRR24656329 K Caries Free Saliva C6.5 saliva CF Caries Free SRR24656330 K Caries Free Saliva C6.5 saliva CF Caries Free SRR24656331 K Caries Free Saliva C6.5 saliva CF Caries Free SRR24656332 K Caries Saliva AC saliva AC Caries SRR24656333 K Caries Saliva AC saliva AC Caries SRR24656334 K Caries Saliva AC saliva AC Caries SRR24656335 K Caries Free Saliva C2.5 saliva CF Caries Free SRR24656336 K Caries Free Saliva CFAT saliva CF Caries Free SRR24656337 K Caries Free Saliva CFAT saliva CF Caries Free SRR24656338 K Caries Free Saliva CFAT saliva CF Caries Free SRR24656339 K Caries Saliva EC saliva EC Caries SRR24656340 K Caries Free Saliva C4 saliva CF Caries Free SRR24656341 K Caries Free Saliva C4 saliva CF Caries Free SRR24656342 K Caries Saliva AC saliva AC Caries SRR24656343 K Caries Saliva EC saliva EC Caries SRR24656344 K Caries Free Saliva C4 saliva CF Caries Free SRR24656345 K Caries Free Saliva C2.5 saliva CF Caries Free SRR24656346 K Caries Saliva EC saliva EC Caries SRR24656347 K Caries Saliva EC saliva EC Caries SRR24656348 K Missing Saliva missing saliva missing missing SRR24656349 K Missing Saliva missing saliva missing missing SRR24656350 K Missing Saliva missing saliva missing missing SRR24656351 K Missing Saliva missing saliva missing missing SRR24656352 K Caries Saliva EC saliva EC Caries SRR24656353 K Caries Saliva EC saliva EC Caries SRR24656354 K Caries Free Saliva C2.5 saliva CF Caries Free SRR24656355 K Caries Saliva AC saliva AC Caries SRR24656356 K Caries Saliva AC saliva AC Caries SRR24656357 K Caries Free Saliva C2.5 saliva CF Caries Free SRR24656358 K Caries Free Saliva C2.5 saliva CF Caries Free SRR24656359 K Caries Saliva AC saliva AC Caries SRR24656360 K Caries Saliva EC saliva EC Caries SRR24656361 K Caries Free Saliva C2.5 saliva CF Caries Free SRR24656362 K Caries Saliva EC saliva EC Caries SRR24656363 K Caries Free Saliva C4 saliva CF Caries Free SRR24656364 K Caries Free Saliva C4 saliva CF Caries Free SRR24656365 K Caries Saliva EC saliva EC Caries SRR24656366 K Caries Free Saliva C4 saliva CF Caries Free SRR24656367 K Caries Free Saliva C4 saliva CF Caries Free SRR24656368 K Caries Saliva AC saliva AC Caries SRR24656369 K Caries Free Saliva remin saliva re Caries Free SRR24656370 K Caries Free Saliva C6.5 saliva CF Caries Free SRR24656371 K Caries Free Saliva C6.5 saliva CF Caries Free SRR24656372 K Caries Free Saliva C6.5 saliva CF Caries Free SRR24656373 K Caries Free Saliva CFAT saliva CF Caries Free SRR24656374 K Caries Free Saliva CFAT saliva CF Caries Free SRR24656375 K Caries Free Saliva CFAT saliva CF Caries Free SRR24656376 K Caries Saliva EC saliva EC Caries SRR24656377 K Caries Free Saliva C4 saliva CF Caries Free SRR24656378 K Caries Free Saliva CFAT saliva CF Caries Free SRR24656379 K Caries Free Saliva CFAT saliva CF Caries Free SRR24656380 K Missing Saliva missing saliva missing missing SRR24656381 K Caries Free Saliva CFAT saliva CF Caries Free SRR24656382 K Caries Saliva EC saliva EC Caries SRR24656383 K Caries Free Saliva C4 saliva CF Caries Free SRR24656384 K Caries Free Saliva C4 saliva CF Caries Free SRR24656385 K Missing Saliva missing saliva missing missing SRR24656386 K Missing Saliva missing saliva missing missing SRR24656387 K Missing Saliva missing saliva missing missing SRR24656388 K Caries Free Saliva CFAT saliva CF Caries Free SRR24656389 K Caries Free Saliva CFAT saliva CF Caries Free SRR24656390 K Caries Free Saliva CFAT saliva CF Caries Free SRR24656391 K Missing Saliva missing saliva missing missing SRR24656392 K Caries Saliva AC saliva AC Caries SRR24656393 K Caries Saliva EC saliva EC Caries SRR24656394 K Caries Free Saliva C2.5 saliva CF Caries Free SRR24656395 K Caries Saliva EC saliva EC Caries SRR24656396 K Caries Saliva EC saliva EC Caries SRR24656397 K Caries Free Saliva C2.5 saliva CF Caries Free SRR24656398 K Missing Saliva missing saliva missing missing SRR24656399 K Missing Saliva missing saliva missing missing SRR24656400 K Missing Saliva missing saliva missing missing SRR24656401 K Caries Free Saliva CFAT saliva CF Caries Free SRR24656402 K Caries Saliva EC saliva EC Caries SRR24656403 K Caries Free Saliva CFAT saliva CF Caries Free SRR24656404 K Caries Free Saliva CFAT saliva CF Caries Free SRR24656405 K Caries Saliva EC saliva EC Caries SRR24656406 K Caries Free Saliva C4 saliva CF Caries Free SRR24656407 K Caries Free Saliva C4 saliva CF Caries Free SRR24656408 K Caries Saliva AC saliva AC Caries SRR24656409 K Caries Free Saliva C4 saliva CF Caries Free SRR24656410 K Caries Free Saliva C6.5 saliva CF Caries Free SRR24656411 K Caries Free Saliva C6.5 saliva CF Caries Free SRR24656412 K Caries Free Saliva CFAT saliva CF Caries Free SRR24656413 K Caries Free Saliva CFAT saliva CF Caries Free SRR24656414 K Caries Free Saliva CFAT saliva CF Caries Free SRR24656415 K Missing Saliva missing saliva missing missing SRR24656416 K Missing Saliva missing saliva missing missing SRR24656417 K Caries Free Saliva C4 saliva CF Caries Free SRR24656418 K Missing Saliva missing saliva missing missing SRR24656419 K Caries Free Saliva C6.5 saliva CF Caries Free SRR24656420 K Caries Free Saliva C6.5 saliva CF Caries Free SRR24656421 K Caries Free Saliva C6.5 saliva CF Caries Free SRR24656422 K Caries Saliva EC saliva EC Caries SRR24656423 K Caries Free Saliva C4 saliva CF Caries Free SRR24656424 K Caries Free Saliva C4 saliva CF Caries Free SRR24656425 K Caries Free Saliva C6.5 saliva CF Caries Free SRR24656426 K Caries Free Saliva C6.5 saliva CF Caries Free SRR24656427 K Caries Free Saliva C6.5 saliva CF Caries Free SRR24656428 K Caries Free Saliva C4 saliva CF Caries Free SRR24656429 K Caries Free Saliva C2.5 saliva CF Caries Free SRR24656430 K Caries Saliva EC saliva EC Caries SRR24656431 K Caries Free Saliva C4 saliva CF Caries Free SRR24656432 K Caries Free Saliva C4 saliva CF Caries Free SRR24656433 K Caries Free Saliva remin saliva re Caries Free SRR24656434 K Caries Saliva EC saliva EC Caries SRR24656435 K Caries Free Saliva C2.5 saliva CF Caries Free SRR24656436 K Caries Saliva AC saliva AC Caries SRR24656437 K Caries Free Saliva C4 saliva CF Caries Free SRR24656438 K Caries Free Saliva C4 saliva CF Caries Free SRR24656439 K Missing Saliva missing saliva missing missing SRR24656440 K Caries Saliva AC saliva AC Caries SRR24656441 K Missing Saliva missing saliva missing missing SRR24656442 K Caries Free Saliva C6.5 saliva CF Caries Free SRR24656443 K Caries Free Saliva C6.5 saliva CF Caries Free SRR24656444 K Caries Free Saliva C4 saliva CF Caries Free SRR24656445 K Caries Saliva AC saliva AC Caries SRR24656446 K Caries Free Saliva C4 saliva CF Caries Free SRR24656447 K Caries Free Saliva C4 saliva CF Caries Free SRR24656448 K Caries Saliva EC saliva EC Caries SRR24656449 K Caries Free Saliva C4 saliva CF Caries Free SRR24656450 K Caries Free Saliva C4 saliva CF Caries Free SRR24656451 K Caries Free Saliva CFAT saliva CF Caries Free SRR24656452 K Caries Free Saliva CFAT saliva CF Caries Free SRR24656453 K Caries Free Saliva CFAT saliva CF Caries Free SRR24656454 K Caries Saliva AC saliva AC Caries SRR24656455 K Caries Saliva EC saliva EC Caries SRR24656456 K Caries Free Saliva C4 saliva CF Caries Free SRR24656457 K Caries Free Saliva C4 saliva CF Caries Free SRR24656458 K Caries Free Saliva C6.5 saliva CF Caries Free SRR24656459 K Caries Free Saliva C6.5 saliva CF Caries Free SRR24656460 K Caries Free Saliva C6.5 saliva CF Caries Free SRR24656461 K Caries Free Saliva remin saliva re Caries Free SRR24656462 K Caries Saliva EC saliva EC Caries SRR24656463 K Caries Free Saliva C2.5 saliva CF Caries Free SRR24656464 K Caries Free Saliva C6.5 saliva CF Caries Free SRR24656465 K Caries Free Saliva C6.5 saliva CF Caries Free SRR24656466 K Caries Saliva EC saliva EC Caries SRR24656467 K Caries Free Saliva C6.5 saliva CF Caries Free SRR24656468 K Caries Saliva AC saliva AC Caries SRR24656469 K Caries Saliva AC saliva AC Caries SRR24656470 K Caries Free Saliva C2.5 saliva CF Caries Free SRR24656471 K Caries Saliva EC saliva EC Caries SRR24656472 K Caries Free Saliva C4 saliva CF Caries Free SRR24656473 K Caries Free Saliva C4 saliva CF Caries Free SRR24656474 K Caries Free Saliva C2.5 saliva CF Caries Free SRR24656475 K Caries Free Saliva CFAT saliva CF Caries Free SRR24656476 K Caries Free Saliva CFAT saliva CF Caries Free SRR24656477 K Caries Free Saliva CFAT saliva CF Caries Free SRR24656478 K Caries Saliva EC saliva EC Caries SRR24656479 K Caries Free Saliva C4 saliva CF Caries Free SRR24656480 K Caries Free Saliva C4 saliva CF Caries Free SRR24656481 K Caries Free Saliva C4 saliva CF Caries Free SRR24656482 K Caries Free Saliva CFAT saliva CF Caries Free SRR24656483 K Caries Free Saliva CFAT saliva CF Caries Free SRR24656484 K Caries Free Saliva CFAT saliva CF Caries Free SRR24656485 K Caries Free Saliva remin saliva re Caries Free SRR24656486 K Caries Saliva EC saliva EC Caries SRR24656487 K Caries Free Saliva C2.5 saliva CF Caries Free SRR24656488 K Caries Saliva EC saliva EC Caries SRR24656489 K Caries Saliva EC saliva EC Caries SRR24656490 K Caries Free Saliva C2.5 saliva CF Caries Free SRR24656491 K Caries Saliva EC saliva EC Caries SRR24656492 K Caries Saliva AC saliva AC Caries SRR24656493 K Caries Saliva EC saliva EC Caries SRR24656494 K Caries Free Saliva C2.5 saliva CF Caries Free SRR24656495 K Caries Saliva AC saliva AC Caries SRR24656496 K Caries Saliva AC saliva AC Caries SRR24656497 K Caries Free Saliva C2.5 saliva CF Caries Free SRR24656498 K Missing Saliva missing saliva missing missing SRR24656499 K Missing Saliva missing saliva missing missing SRR24656500 K Missing Saliva missing saliva missing missing SRR24656501 K Missing Saliva missing saliva missing missing SRR24656502 K Missing Saliva missing saliva missing missing SRR24656503 K Caries Saliva EC saliva EC Caries SRR24656504 K Caries Saliva EC saliva EC Caries SRR24656505 K Caries Free Saliva C2.5 saliva CF Caries Free F12694.S001 W Caries Saliva Caries_Static CS Caries F12694.S002 W Caries Saliva Caries_Active CA Caries F12694.S003 W Caries Saliva Caries_Active CA Caries F12694.S004 W Caries Saliva Caries_Active CA Caries F12694.S005 W Caries Saliva Caries_Active CA Caries F12694.S006 W Caries Saliva Caries_Active CA Caries F12694.S007 W Caries Free Saliva Caries_Free CF Caries Free F12694.S008 W Caries Saliva Caries_Active CA Caries F12694.S009 W Caries Saliva Caries_Static CS Caries F12694.S010 W Caries Saliva Caries_Active CA Caries F12694.S011 W Caries Free Saliva Caries_Free CF Caries Free F12694.S012 W Caries Free Saliva Caries_Free CF Caries Free F12694.S013 W Caries Saliva Caries_Active CA Caries F12694.S014 W Caries Saliva Caries_Static CS Caries F12694.S015 W Caries Free Saliva Caries_Free CF Caries Free F12694.S016 W Caries Free Saliva Caries_Free CF Caries Free F12694.S017 W Caries Free Saliva Caries_Free CF Caries Free F12694.S018 W Caries Free Saliva Caries_Free CF Caries Free F12694.S019 W Caries Free Saliva Caries_Free CF Caries Free F12694.S020 W Caries Saliva Caries_Static CS Caries F12694.S021 W Caries Saliva Caries_Active CA Caries F12694.S022 W Caries Saliva Caries_Static CS Caries F12694.S023 W Caries Saliva Caries_Active CA Caries F12694.S024 W Caries Saliva Caries_Active CA Caries F12694.S025 W Caries Free Saliva Caries_Free CF Caries Free F12694.S026 W Caries Saliva Caries_Active CA Caries F12694.S027 W Caries Free Saliva Caries_Free CF Caries Free F12694.S028 W Caries Saliva Caries_Active CA Caries F12694.S029 W Caries Free Saliva Caries_Free CF Caries Free F12694.S030 W Caries Saliva Caries_Active CA Caries F12694.S031 W Caries Saliva Caries_Active CA Caries F12694.S032 W Caries Saliva Caries_Active CA Caries F12694.S033 W Caries Free Saliva Caries_Free CF Caries Free F12694.S034 W Caries Saliva Caries_Active CA Caries F12694.S035 W Caries Free Saliva Caries_Free CF Caries Free F12694.S036 W Caries Saliva Caries_Active CA Caries F12694.S037 W Caries Saliva Caries_Active CA Caries F12694.S038 W Caries Saliva Caries_Active CA Caries F12694.S039 W Caries Free Saliva Caries_Free CF Caries Free F12694.S040 W Caries Saliva Caries_Static CS Caries F12694.S041 W Caries Free Saliva Caries_Free CF Caries Free F12694.S042 W Caries Free Saliva Caries_Free CF Caries Free F12694.S043 W Caries Free Saliva Caries_Free CF Caries Free F12694.S044 W Caries Saliva Caries_Active CA Caries F12694.S045 W Caries Saliva Caries_Active CA Caries F12694.S046 W Caries Free Saliva Caries_Free CF Caries Free F12694.S047 W Caries Saliva Caries_Active CA Caries F12694.S048 W Caries Saliva Caries_Active CA Caries F12694.S049 W Caries Saliva Caries_Active CA Caries F12694.S050 W Caries Free Saliva Caries_Free CF Caries Free F12694.S051 W Caries Saliva Caries_Active CA Caries F12694.S052 W Caries Saliva Caries_Active CA Caries F12694.S053 W Caries Saliva Caries_Active CA Caries F12694.S054 W Caries Saliva Caries_Active CA Caries F12694.S055 W Caries Saliva Caries_Static CS Caries F12694.S056 W Caries Free Saliva Caries_Free CF Caries Free F12694.S057 W Caries Saliva Caries_Active CA Caries F12694.S058 W Caries Saliva Caries_Active CA Caries F12694.S059 W Caries Free Saliva Caries_Free CF Caries Free F12694.S060 W Caries Saliva Caries_Static CS Caries F12694.S061 W Caries Free Saliva Caries_Free CF Caries Free F12694.S062 W Caries Saliva Caries_Active CA Caries F12694.S063 W Caries Saliva Caries_Active CA Caries F12694.S064 W Caries Saliva Caries_Active CA Caries F12694.S065 W Caries Free Saliva Caries_Free CF Caries Free F12694.S066 W Caries Saliva Caries_Active CA Caries F12694.S067 W Caries Free Saliva Caries_Free CF Caries Free F12694.S068 W Caries Free Saliva Caries_Free CF Caries Free F12694.S069 W Caries Saliva Caries_Active CA Caries F12694.S070 W Caries Saliva Caries_Static CS Caries F12694.S071 W Caries Saliva Caries_Active CA Caries F12694.S072 W Caries Saliva Caries_Active CA Caries F12694.S073 W Caries Free Saliva Caries_Free CF Caries Free F12694.S074 W Caries Saliva Caries_Active CA Caries F12694.S075 W Caries Saliva Caries_Active CA Caries F12694.S076 W Caries Saliva Caries_Active CA Caries F12694.S077 W Caries Free Saliva Caries_Free CF Caries Free F12694.S078 W Caries Free Saliva Caries_Free CF Caries Free F12694.S079 W Caries Free Saliva Caries_Free CF Caries Free F12694.S080 W Caries Saliva Caries_Active CA Caries F12694.S081 W Caries Saliva Caries_Static CS Caries F12694.S082 W Caries Free Saliva Caries_Free CF Caries Free F12694.S083 W Caries Saliva Caries_Active CA Caries F12694.S084 W Caries Saliva Caries_Active CA Caries F12694.S085 W Caries Saliva Caries_Static CS Caries F12694.S086 W Caries Free Saliva Caries_Free CF Caries Free F12694.S087 W Caries Free Saliva Caries_Free CF Caries Free F12694.S088 W Caries Free Saliva Caries_Free CF Caries Free F12694.S089 W Caries Free Saliva Caries_Free CF Caries Free F12694.S090 W Caries Free Saliva Caries_Free CF Caries Free F12694.S091 W Caries Saliva Caries_Active CA Caries F12694.S092 W Caries Free Saliva Caries_Free CF Caries Free F12694.S093 W Caries Saliva Caries_Active CA Caries F12694.S094 W Caries Free Saliva Caries_Free CF Caries Free F12694.S095 W Caries Saliva Caries_Active CA Caries F12694.S096 W Caries Saliva Caries_Active CA Caries F12694.S097 W Caries Free Saliva Caries_Free CF Caries Free F12694.S098 W Caries Saliva Caries_Active CA Caries F12694.S099 W Caries Saliva Caries_Active CA Caries F12694.S100 W Caries Saliva Caries_Static CS Caries F12694.S101 W Caries Saliva Caries_Active CA Caries F12694.S102 W Caries Saliva Caries_Active CA Caries F12694.S103 W Caries Free Saliva Caries_Free CF Caries Free F12694.S104 W Caries Saliva Caries_Static CS Caries F12694.S105 W Caries Saliva Caries_Active CA Caries F12694.S106 W Caries Saliva Caries_Static CS Caries F12694.S107 W Caries Saliva Caries_Active CA Caries F12694.S108 W Caries Saliva Caries_Static CS Caries F12694.S109 W Caries Saliva Caries_Active CA Caries F12694.S110 W Caries Free Saliva Caries_Free CF Caries Free F12694.S111 W Caries Saliva Caries_Static CS Caries F12694.S112 W Caries Saliva Caries_Static CS Caries F12694.S113 W Caries Saliva Caries_Active CA Caries F12694.S114 W Caries Saliva Caries_Active CA Caries F12694.S115 W Caries Free Saliva Caries_Free CF Caries Free F12694.S116 W Caries Free Saliva Caries_Free CF Caries Free F12694.S117 W Caries Saliva Caries_Static CS Caries F12694.S118 W Caries Saliva Caries_Active CA Caries F12694.S119 W Caries Saliva Caries_Static CS Caries F12694.S120 W Caries Free Saliva Caries_Free CF Caries Free F12694.S121 W Caries Saliva Caries_Static CS Caries F12694.S122 W Caries Saliva Caries_Active CA Caries F12694.S123 W Caries Saliva Caries_Active CA Caries F12694.S124 W Caries Saliva Caries_Active CA Caries F12694.S125 W Caries Saliva Caries_Static CS Caries F12694.S126 W Caries Free Saliva Caries_Free CF Caries Free F12694.S127 W Caries Saliva Caries_Active CA Caries F12694.S128 W Caries Free Saliva Caries_Free CF Caries Free F12694.S129 W Caries Free Saliva Caries_Free CF Caries Free F12694.S130 W Caries Saliva Caries_Active CA Caries F12694.S131 W Caries Free Saliva Caries_Free CF Caries Free F12694.S132 W Caries Free Saliva Caries_Free CF Caries Free F12694.S133 W Caries Saliva Caries_Static CS Caries F12694.S134 W Caries Free Saliva Caries_Free CF Caries Free F12694.S135 W Caries Free Saliva Caries_Free CF Caries Free F12694.S136 W Caries Saliva Caries_Active CA Caries F12694.S137 W Caries Saliva Caries_Active CA Caries F12694.S138 W Caries Free Saliva Caries_Free CF Caries Free F12694.S139 W Caries Free Saliva Caries_Free CF Caries Free F12694.S140 W Caries Free Saliva Caries_Free CF Caries Free F12694.S141 W Caries Saliva Caries_Static CS Caries F12694.S142 W Caries Saliva Caries_Active CA Caries F12694.S143 W Caries Saliva Caries_Active CA Caries F12694.S144 W Caries Saliva Caries_Active CA Caries F12694.S145 W Caries Saliva Caries_Active CA Caries F12694.S146 W Caries Free Saliva Caries_Free CF Caries Free F12694.S147 W Caries Saliva Caries_Active CA Caries F12694.S148 W Caries Saliva Caries_Active CA Caries F12694.S149 W Caries Saliva Caries_Static CS Caries F12694.S150 W Caries Free Saliva Caries_Free CF Caries Free F12694.S151 W Caries Saliva Caries_Active CA Caries F12694.S152 W Caries Saliva Caries_Active CA Caries F12694.S153 W Caries Saliva Caries_Active CA Caries F12694.S154 W Caries Saliva Caries_Active CA Caries F12694.S155 W Caries Saliva Caries_Active CA Caries F12694.S156 W Caries Free Saliva Caries_Free CF Caries Free F12694.S157 W Caries Saliva Caries_Static CS Caries F12694.S158 W Caries Free Saliva Caries_Free CF Caries Free F12694.S159 W Caries Saliva Caries_Active CA Caries F12694.S160 W Caries Free Saliva Caries_Free CF Caries Free F12694.S161 W Caries Saliva Caries_Active CA Caries F12694.S162 W Caries Free Saliva Caries_Free CF Caries Free F12694.S163 W Caries Free Saliva Caries_Free CF Caries Free F12694.S164 W Caries Free Saliva Caries_Free CF Caries Free F12694.S165 W Caries Saliva Caries_Active CA Caries F12694.S166 W Caries Saliva Caries_Active CA Caries F12694.S167 W Caries Saliva Caries_Active CA Caries F12694.S168 W Caries Saliva Caries_Active CA Caries F12694.S169 W Caries Saliva Caries_Static CS Caries F12694.S170 W Caries Saliva Caries_Active CA Caries F12694.S171 W Caries Saliva Caries_Active CA Caries F12694.S172 W Caries Saliva Caries_Static CS Caries F12694.S173 W Caries Saliva Caries_Active CA Caries F12694.S174 W Caries Saliva Caries_Active CA Caries F12694.S175 W Caries Saliva Caries_Active CA Caries F12694.S176 W Caries Saliva Caries_Active CA Caries F12694.S177 W Caries Saliva Caries_Active CA Caries F12694.S178 W Caries Free Saliva Caries_Free CF Caries Free F12694.S179 W Caries Saliva Caries_Active CA Caries F12694.S180 W Caries Free Saliva Caries_Free CF Caries Free F12694.S181 W Caries Free Saliva Caries_Free CF Caries Free F12694.S182 W Caries Saliva Caries_Active CA Caries F12694.S183 W Caries Saliva Caries_Active CA Caries F12694.S184 W Caries Saliva Caries_Active CA Caries F12694.S185 W Caries Saliva Caries_Active CA Caries F12694.S186 W Caries Free Saliva Caries_Free CF Caries Free F12694.S187 W Caries Saliva Caries_Active CA Caries F12694.S188 W Caries Saliva Caries_Static CS Caries F12694.S189 W Caries Saliva Caries_Static CS Caries F12694.S190 W Caries Saliva Caries_Active CA Caries F12694.S191 W Caries Saliva Caries_Active CA Caries F12694.S192 W Caries Saliva Caries_Active CA Caries F12694.S193 W Caries Free Saliva Caries_Free CF Caries Free F12694.S194 W Caries Saliva Caries_Static CS Caries F12694.S195 W Caries Free Saliva Caries_Free CF Caries Free F12694.S196 W Caries Free Saliva Caries_Free CF Caries Free F12694.S197 W Caries Saliva Caries_Active CA Caries F12694.S198 W Caries Free Saliva Caries_Free CF Caries Free F12694.S199 W Caries Saliva Caries_Active CA Caries F12694.S200 W Caries Saliva Caries_Static CS Caries F12694.S201 W Caries Saliva Caries_Active CA Caries F12694.S202 W Caries Saliva Caries_Active CA Caries F12694.S203 W Caries Saliva Caries_Active CA Caries F12694.S204 W Caries Saliva Caries_Static CS Caries F12694.S205 W Caries Free Saliva Caries_Free CF Caries Free F12694.S206 W Caries Free Saliva Caries_Free CF Caries Free F12694.S207 W Caries Free Saliva Caries_Free CF Caries Free F12694.S208 W Caries Saliva Caries_Active CA Caries F12694.S209 W Caries Saliva Caries_Static CS Caries F12694.S210 W Caries Free Saliva Caries_Free CF Caries Free F12694.S211 W Caries Saliva Caries_Active CA Caries F12694.S212 W Caries Free Saliva Caries_Free CF Caries Free F12694.S213 W Caries Saliva Caries_Static CS Caries F12694.S214 W Caries Saliva Caries_Active CA Caries F12694.S215 W Caries Saliva Caries_Active CA Caries F12694.S216 W Caries Saliva Caries_Static CS Caries F12694.S217 W Caries Saliva Caries_Active CA Caries F12694.S218 W Caries Saliva Caries_Static CS Caries F12694.S219 W Caries Saliva Caries_Active CA Caries F12694.S220 W Caries Free Saliva Caries_Free CF Caries Free F12694.S221 W Caries Free Saliva Caries_Free CF Caries Free F12694.S222 W Caries Free Saliva Caries_Free CF Caries Free F12694.S223 W Caries Saliva Caries_Active CA Caries F12694.S224 W Caries Saliva Caries_Active CA Caries F12694.S225 W Caries Saliva Caries_Active CA Caries F12694.S226 W Caries Saliva Caries_Active CA Caries F12694.S227 W Caries Saliva Caries_Active CA Caries F12694.S228 W Caries Free Saliva Caries_Free CF Caries Free F12694.S229 W Caries Saliva Caries_Static CS Caries F12694.S230 W Caries Saliva Caries_Active CA Caries F12694.S231 W Caries Free Saliva Caries_Free CF Caries Free F12694.S232 W Caries Saliva Caries_Active CA Caries F12694.S233 W Caries Free Saliva Caries_Free CF Caries Free F12694.S234 W Caries Saliva Caries_Active CA Caries F12694.S235 W Caries Saliva Caries_Active CA Caries F12694.S236 W Caries Free Saliva Caries_Free CF Caries Free F12694.S237 W Caries Saliva Caries_Active CA Caries F12694.S238 W Caries Saliva Caries_Active CA Caries F12694.S239 W Caries Saliva Caries_Active CA Caries F12694.S240 W Caries Free Saliva Caries_Free CF Caries Free F12694.S241 W Caries Saliva Caries_Static CS Caries F12694.S242 W Caries Saliva Caries_Active CA Caries F12694.S243 W Caries Saliva Caries_Active CA Caries F12694.S244 W Caries Free Saliva Caries_Free CF Caries Free F12694.S245 W Caries Saliva Caries_Active CA Caries F12694.S246 W Caries Saliva Caries_Active CA Caries F12694.S247 W Caries Free Saliva Caries_Free CF Caries Free F12694.S248 W Caries Saliva Caries_Static CS Caries F12694.S249 W Caries Free Saliva Caries_Free CF Caries Free F12694.S250 W Caries Free Saliva Caries_Free CF Caries Free F12694.S251 W Caries Saliva Caries_Static CS Caries F12694.S252 W Caries Free Saliva Caries_Free CF Caries Free F12694.S253 W Caries Saliva Caries_Active CA Caries F12694.S254 W Caries Free Saliva Caries_Free CF Caries Free F12694.S255 W Caries Saliva Caries_Active CA Caries F12694.S256 W Caries Saliva Caries_Active CA Caries F12694.S257 W Unknown Unknown Unknown Unknown F12694.S258 W Unknown Unknown Unknown Unknown F12694.S259 W Unknown Unknown Unknown Unknown F12694.S260 W Unknown Unknown Unknown Unknown F12694.S261 W Unknown Unknown Unknown Unknown F12694.S262 W Unknown Unknown Unknown Unknown F12694.S263 W Unknown Unknown Unknown Unknown F12694.S264 W Unknown Unknown Unknown Unknown F12694.S265 W Unknown Unknown Unknown Unknown F12694.S266 W Unknown Unknown Unknown Unknown F12694.S267 W Unknown Unknown Unknown Unknown F12694.S268 W Unknown Unknown Unknown Unknown
ASV Read Counts by Samples
#Sample ID Read Count SRR24654665 6 SRR24654130 7 SRR24654141 9 SRR24654118 9 SRR24654284 10 SRR24654166 11 SRR24654661 13 SRR24654076 14 SRR24654091 14 SRR24654735 16 SRR24654395 21 SRR24654047 21 SRR24654347 23 SRR24654766 28 SRR24655761 29 SRR24654349 74 SRR24654328 103 SRR24654137 118 SRR24654755 131 SRR24654546 132 SRR24654758 143 SRR24654155 145 SRR24654320 162 SRR24654582 166 SRR24654759 372 SRR24655824 473 SRR24654072 526 SRR24654315 626 SRR24654084 729 SRR24654108 2,269 SRR24654714 2,275 SRR24654075 2,561 SRR24654074 2,641 SRR24654598 2,742 SRR24654338 2,764 SRR24654757 3,705 SRR24654024 4,269 SRR24654774 4,394 SRR24654305 4,551 SRR24654327 5,131 SRR24654445 5,358 SRR24656223 5,745 SRR24654579 5,950 SRR24654217 5,968 SRR24654086 6,050 SRR24654195 6,079 SRR24654061 6,389 SRR24654749 6,831 SRR24654188 7,194 SRR24654708 7,197 SRR24656394 7,430 SRR24654573 7,511 SRR24655793 7,851 SRR24654087 8,134 SRR24656155 8,140 SRR24654437 8,196 SRR24656430 8,209 SRR24656234 8,326 SRR24654133 8,360 SRR24655791 8,471 SRR24654078 8,707 SRR24654563 8,708 SRR24655993 8,738 SRR24654088 8,779 SRR24655756 8,851 SRR24656188 9,086 SRR24654435 9,094 SRR24656163 9,143 SRR24656210 9,277 SRR24656409 9,380 SRR24656085 9,381 SRR24654566 9,534 SRR24655894 9,682 SRR24655780 9,689 SRR24655966 9,707 SRR24656092 9,765 SRR24655792 9,841 SRR24654189 9,854 SRR24655777 9,922 SRR24654059 9,941 SRR24655802 9,972 SRR24654319 9,989 SRR24656087 10,015 SRR24656095 10,132 SRR24656322 10,146 SRR24654019 10,251 SRR24654218 10,273 SRR24655800 10,277 SRR24656392 10,306 SRR24654438 10,380 SRR24656405 10,406 SRR24656032 10,454 SRR24656449 10,481 SRR24656139 10,542 SRR24654211 10,547 SRR24654020 10,568 SRR24655768 10,619 SRR24656237 10,619 SRR24656408 10,626 SRR24655787 10,649 SRR24654079 10,656 SRR24654254 10,747 SRR24656451 10,870 SRR24654583 10,887 SRR24656165 11,001 SRR24656094 11,096 SRR24656159 11,121 SRR24656398 11,135 SRR24655921 11,204 SRR24655719 11,274 SRR24656222 11,280 SRR24656093 11,312 SRR24656401 11,336 SRR24656103 11,356 SRR24656407 11,361 SRR24655788 11,365 SRR24654533 11,391 SRR24656030 11,408 SRR24654168 11,459 SRR24655789 11,477 SRR24656463 11,505 SRR24654539 11,526 SRR24656393 11,562 SRR24655799 11,592 SRR24655875 11,609 SRR24656231 11,710 SRR24655805 11,712 SRR24654053 11,746 SRR24654017 11,813 SRR24654259 11,822 SRR24654430 11,833 SRR24656082 11,854 SRR24656098 11,900 SRR24656097 11,913 SRR24655862 11,938 SRR24656486 12,002 SRR24655866 12,030 SRR24654089 12,057 SRR24655795 12,060 SRR24654468 12,068 SRR24654190 12,166 SRR24654132 12,205 SRR24656400 12,215 SRR24656084 12,240 SRR24654538 12,260 SRR24655856 12,273 SRR24656440 12,321 SRR24656406 12,341 SRR24656099 12,390 SRR24656031 12,407 SRR24654060 12,420 SRR24654065 12,464 SRR24656224 12,477 SRR24655743 12,478 SRR24654146 12,492 SRR24654336 12,522 SRR24654026 12,523 SRR24654064 12,527 SRR24654534 12,555 SRR24654144 12,563 SRR24656076 12,587 SRR24656399 12,600 SRR24656033 12,617 SRR24656395 12,617 SRR24656396 12,650 SRR24654200 12,652 SRR24654495 12,692 SRR24656404 12,705 SRR24655746 12,724 SRR24655945 12,740 SRR24654741 12,767 SRR24656104 12,773 SRR24654262 12,808 SRR24654332 12,810 SRR24654071 12,822 SRR24654530 12,825 SRR24655898 12,826 SRR24655786 12,839 SRR24656488 12,851 SRR24656492 12,881 SRR24656467 12,891 SRR24654681 12,917 SRR24655774 12,943 SRR24654484 12,963 SRR24656081 12,995 SRR24654473 12,996 SRR24655924 13,095 SRR24655816 13,104 SRR24654209 13,139 SRR24654391 13,163 SRR24656358 13,165 SRR24656403 13,168 SRR24654317 13,193 SRR24654260 13,208 SRR24655858 13,274 SRR24654321 13,342 SRR24654070 13,357 SRR24656315 13,420 SRR24654471 13,429 SRR24654213 13,437 SRR24654265 13,478 SRR24654626 13,521 SRR24654744 13,576 SRR24654470 13,596 SRR24654386 13,602 SRR24654416 13,606 SRR24654212 13,617 SRR24654379 13,669 SRR24654150 13,681 SRR24654742 13,696 SRR24656105 13,704 SRR24656164 13,720 SRR24654436 13,741 SRR24654085 13,759 SRR24654113 13,788 SRR24656089 13,792 SRR24656314 13,800 SRR24655803 13,805 SRR24654486 13,807 SRR24654693 13,818 SRR24654018 13,855 SRR24654481 13,862 SRR24654644 13,903 SRR24655952 13,923 SRR24654424 13,956 SRR24655782 13,992 SRR24654271 14,055 SRR24654680 14,083 SRR24655775 14,107 SRR24654199 14,109 SRR24656296 14,139 SRR24654193 14,140 SRR24656481 14,178 SRR24656144 14,198 SRR24656380 14,226 SRR24655776 14,237 SRR24654197 14,268 SRR24654291 14,287 SRR24655778 14,290 SRR24656245 14,317 SRR24654428 14,332 SRR24654022 14,335 SRR24655794 14,360 SRR24656083 14,380 SRR24656086 14,385 SRR24656100 14,407 SRR24654590 14,408 SRR24654414 14,412 SRR24655884 14,499 SRR24654134 14,513 SRR24654664 14,553 SRR24655785 14,553 SRR24656397 14,569 SRR24655851 14,587 SRR24654274 14,595 SRR24654154 14,596 SRR24654613 14,604 SRR24654267 14,641 SRR24654387 14,651 SRR24654619 14,657 SRR24654594 14,657 SRR24656458 14,666 SRR24656080 14,672 SRR24654252 14,689 SRR24656369 14,699 SRR24654094 14,709 SRR24654077 14,718 SRR24654235 14,721 SRR24654696 14,764 SRR24654127 14,775 SRR24656106 14,800 SRR24654098 14,801 SRR24654119 14,833 SRR24656096 14,844 SRR24656150 14,867 SRR24656107 14,903 SRR24654187 14,909 SRR24655773 14,912 SRR24654273 14,915 SRR24654096 14,915 SRR24656161 14,918 SRR24654290 14,925 SRR24656249 14,934 SRR24656442 14,967 SRR24654679 14,991 SRR24654431 14,998 SRR24654540 15,015 SRR24654068 15,022 SRR24654330 15,044 SRR24656444 15,065 SRR24655781 15,070 SRR24656286 15,084 SRR24654185 15,092 SRR24654153 15,094 SRR24654125 15,114 SRR24654124 15,130 SRR24654318 15,142 SRR24654081 15,167 SRR24656240 15,176 SRR24656078 15,215 SRR24654300 15,243 SRR24654434 15,244 SRR24654131 15,284 SRR24656189 15,309 SRR24655965 15,319 SRR24656328 15,319 SRR24655955 15,350 SRR24654459 15,364 SRR24654587 15,384 SRR24655779 15,415 SRR24654263 15,415 SRR24655796 15,433 SRR24655914 15,450 SRR24654532 15,451 SRR24654585 15,452 SRR24654462 15,485 SRR24654293 15,487 SRR24654174 15,494 SRR24654737 15,531 SRR24655946 15,531 SRR24654374 15,535 SRR24655949 15,538 SRR24654234 15,557 SRR24654350 15,574 SRR24654650 15,579 SRR24655867 15,583 SRR24656356 15,589 SRR24656251 15,602 SRR24654621 15,611 SRR24656156 15,611 SRR24656169 15,627 SRR24654567 15,645 SRR24654201 15,649 SRR24656142 15,656 SRR24654423 15,669 SRR24656457 15,671 SRR24655730 15,673 SRR24654121 15,696 SRR24655944 15,713 SRR24654365 15,756 SRR24654251 15,766 SRR24654258 15,824 SRR24655954 15,831 SRR24654257 15,853 SRR24655925 15,858 SRR24654102 15,858 SRR24654275 15,864 SRR24654148 15,877 SRR24654323 15,880 SRR24656010 15,882 SRR24656417 15,942 SRR24654311 15,945 SRR24654177 15,947 SRR24654591 15,979 SRR24655798 15,986 SRR24654553 15,988 SRR24654485 15,990 SRR24656291 16,022 SRR24656233 16,034 SRR24654080 16,041 SRR24654232 16,061 SRR24654239 16,073 SRR24654425 16,075 SRR24654066 16,075 SRR24654654 16,081 SRR24654422 16,098 SRR24654139 16,103 SRR24654522 16,122 SRR24656464 16,129 SRR24654128 16,132 SRR24654117 16,142 SRR24656341 16,154 SRR24654420 16,185 SRR24654717 16,211 SRR24654592 16,231 SRR24654194 16,240 SRR24656312 16,242 SRR24655760 16,257 SRR24654366 16,271 SRR24654344 16,277 SRR24654444 16,324 SRR24655809 16,339 SRR24654628 16,340 SRR24654083 16,356 SRR24655790 16,361 SRR24656287 16,368 SRR24654294 16,373 SRR24656241 16,382 SRR24656148 16,393 SRR24654025 16,394 SRR24654580 16,398 SRR24654666 16,417 SRR24654283 16,436 SRR24654611 16,439 SRR24655748 16,475 SRR24655868 16,478 SRR24656445 16,505 SRR24654126 16,511 SRR24655859 16,526 SRR24654512 16,556 SRR24656044 16,556 SRR24654261 16,568 SRR24656246 16,601 SRR24656471 16,613 SRR24654107 16,637 SRR24654377 16,642 SRR24654489 16,645 SRR24654097 16,676 SRR24654156 16,677 SRR24655978 16,687 SRR24654734 16,695 SRR24656489 16,696 SRR24654299 16,697 SRR24654135 16,718 SRR24654205 16,736 SRR24654021 16,774 SRR24656483 16,783 SRR24654739 16,785 SRR24656365 16,788 SRR24655911 16,789 SRR24655745 16,791 SRR24654548 16,805 SRR24654341 16,819 SRR24656091 16,834 SRR24656300 16,841 SRR24654120 16,843 SRR24655982 16,845 SRR24654596 16,854 SRR24654145 16,868 SRR24654612 16,892 SRR24654631 16,894 SRR24656505 16,904 SRR24654618 16,925 SRR24654589 16,938 SRR24655771 16,957 SRR24654329 16,966 SRR24656158 16,966 SRR24655857 16,973 SRR24656333 16,987 SRR24656448 17,008 SRR24654152 17,008 SRR24655904 17,009 SRR24654306 17,010 SRR24654610 17,019 SRR24654303 17,027 SRR24654383 17,047 SRR24655762 17,052 SRR24655989 17,065 SRR24656461 17,067 SRR24655846 17,071 SRR24656119 17,078 SRR24654433 17,096 SRR24654266 17,117 SRR24654625 17,130 SRR24656466 17,133 SRR24654692 17,134 SRR24654645 17,138 SRR24654447 17,154 SRR24656232 17,155 SRR24654609 17,159 SRR24656462 17,179 SRR24654269 17,179 SRR24654223 17,183 SRR24655979 17,184 SRR24654292 17,186 SRR24656459 17,187 SRR24656412 17,188 SRR24654614 17,189 SRR24654736 17,226 SRR24656151 17,242 SRR24655818 17,242 SRR24656101 17,250 SRR24656238 17,265 SRR24654646 17,270 SRR24655839 17,291 SRR24656230 17,293 SRR24654529 17,312 SRR24654253 17,321 SRR24654334 17,333 SRR24654140 17,346 SRR24654584 17,357 SRR24655992 17,368 SRR24654313 17,376 SRR24654601 17,385 SRR24654280 17,388 SRR24654295 17,391 SRR24655747 17,410 SRR24654282 17,440 SRR24654709 17,462 SRR24654346 17,472 SRR24656141 17,474 SRR24654426 17,493 SRR24655784 17,500 SRR24654629 17,515 SRR24654136 17,524 SRR24654670 17,534 SRR24654362 17,552 SRR24654537 17,552 SRR24654623 17,555 SRR24655758 17,556 SRR24656402 17,558 SRR24654363 17,576 SRR24654116 17,585 SRR24654369 17,592 SRR24654287 17,595 SRR24654627 17,603 SRR24654482 17,614 SRR24654052 17,622 SRR24654630 17,628 SRR24654229 17,629 SRR24655741 17,632 SRR24654660 17,635 SRR24654536 17,636 SRR24654360 17,642 SRR24654760 17,645 SRR24654707 17,661 SRR24655886 17,663 SRR24654770 17,675 SRR24654417 17,686 SRR24654023 17,700 SRR24654606 17,716 SRR24654277 17,743 SRR24654161 17,768 SRR24654316 17,786 SRR24654203 17,804 SRR24654756 17,817 SRR24655853 17,822 SRR24654236 17,836 SRR24654669 17,836 SRR24654388 17,855 SRR24655832 17,866 SRR24655783 17,871 SRR24654222 17,876 SRR24655899 17,882 SRR24654427 17,883 SRR24656229 17,891 SRR24654730 17,893 SRR24655906 17,902 SRR24654138 17,904 SRR24656285 17,905 SRR24654476 17,911 SRR24654477 17,916 SRR24654342 17,924 SRR24656021 17,939 SRR24654572 17,946 SRR24655797 17,949 SRR24656162 17,953 SRR24656336 17,963 SRR24654475 17,963 SRR24655917 17,965 SRR24655871 17,986 SRR24654716 18,003 SRR24654382 18,012 SRR24654376 18,052 SRR24654149 18,054 SRR24654488 18,100 SRR24654487 18,108 SRR24655900 18,108 SRR24654090 18,110 SRR24654032 18,128 SRR24656324 18,138 SRR24654769 18,147 SRR24654733 18,169 SRR24654278 18,201 SRR24654676 18,204 SRR24654285 18,209 SRR24654123 18,214 SRR24654264 18,220 SRR24656313 18,242 SRR24656334 18,251 SRR24654180 18,254 SRR24654620 18,263 SRR24655957 18,287 SRR24654198 18,309 SRR24654740 18,310 SRR24654690 18,321 SRR24654359 18,343 SRR24656490 18,353 SRR24654289 18,354 SRR24656503 18,356 SRR24654276 18,357 SRR24656236 18,361 SRR24656160 18,367 SRR24654738 18,370 SRR24654296 18,384 SRR24655801 18,390 SRR24656284 18,403 SRR24654103 18,415 SRR24654324 18,422 SRR24655724 18,453 SRR24654182 18,454 SRR24654615 18,461 SRR24654593 18,463 SRR24655854 18,463 SRR24654649 18,472 SRR24654147 18,477 SRR24656173 18,481 SRR24654331 18,489 SRR24654408 18,511 SRR24654694 18,522 SRR24655947 18,530 SRR24655860 18,536 SRR24656420 18,538 SRR24654106 18,544 SRR24655869 18,548 SRR24654525 18,555 SRR24656226 18,562 SRR24656455 18,580 SRR24654449 18,590 SRR24654151 18,592 SRR24656225 18,596 SRR24656147 18,609 SRR24654466 18,622 SRR24654378 18,629 SRR24654504 18,631 SRR24656301 18,633 SRR24656079 18,635 SRR24656344 18,644 SRR24654191 18,645 SRR24654616 18,646 SRR24654216 18,663 SRR24656310 18,667 SRR24654432 18,683 SRR24655831 18,684 SRR24654143 18,697 SRR24656088 18,704 SRR24654515 18,717 SRR24654308 18,743 SRR24654227 18,746 SRR24654129 18,755 SRR24654207 18,771 SRR24656367 18,780 SRR24654747 18,785 SRR24654357 18,789 SRR24654469 18,800 SRR24654389 18,810 SRR24655896 18,819 SRR24656066 18,827 SRR24655959 18,827 SRR24654082 18,834 SRR24656167 18,834 SRR24654724 18,838 SRR24655735 18,841 SRR24656166 18,852 SRR24656228 18,859 SRR24654157 18,863 SRR24654683 18,873 SRR24656368 18,875 SRR24656452 18,902 SRR24654658 18,907 SRR24654196 18,911 SRR24654354 18,915 SRR24654122 18,931 SRR24654101 18,944 SRR24654069 18,950 SRR24656282 18,950 SRR24654208 18,956 SRR24656283 18,967 SRR24656453 18,969 SRR24656042 19,010 SRR24656149 19,016 SRR24654578 19,038 SRR24656338 19,060 SRR24656391 19,073 SRR24654353 19,104 SRR24654381 19,132 SRR24654307 19,134 SRR24654602 19,144 SRR24654465 19,160 SRR24654440 19,163 SRR24656450 19,175 SRR24654499 19,176 SRR24654648 19,184 SRR24654753 19,194 SRR24655840 19,199 SRR24654112 19,207 SRR24655830 19,209 SRR24654544 19,215 SRR24654673 19,225 SRR24655872 19,243 SRR24654467 19,245 SRR24655912 19,252 SRR24654429 19,258 SRR24655885 19,261 SRR24654281 19,289 SRR24654326 19,296 SRR24654268 19,298 SRR24655861 19,300 SRR24654474 19,305 SRR24654337 19,307 SRR24654063 19,320 SRR24656152 19,355 SRR24654461 19,359 SRR24654142 19,369 SRR24654684 19,376 SRR24654705 19,377 SRR24655709 19,381 SRR24655864 19,393 SRR24655804 19,407 SRR24656000 19,446 SRR24655948 19,457 SRR24654570 19,467 SRR24654675 19,479 SRR24654715 19,492 SRR24656499 19,496 SRR24656494 19,497 SRR24654364 19,501 SRR24654206 19,511 SRR24654093 19,519 SRR24655950 19,533 SRR24654165 19,548 SRR24655863 19,550 SRR24655770 19,563 SRR24656146 19,569 SRR24655814 19,572 SRR24656414 19,574 SRR24654241 19,589 SRR24655847 19,605 SRR24656143 19,607 SRR24655907 19,612 SRR24654100 19,612 SRR24654172 19,616 SRR24654549 19,622 SRR24654560 19,629 SRR24656299 19,629 SRR24654335 19,647 SRR24654517 19,684 SRR24654595 19,685 SRR24656020 19,712 SRR24655806 19,715 SRR24654304 19,715 SRR24656108 19,733 SRR24655733 19,739 SRR24654356 19,740 SRR24654367 19,744 SRR24656250 19,750 SRR24654653 19,751 SRR24654192 19,756 SRR24654603 19,756 SRR24656320 19,759 SRR24654092 19,762 SRR24654270 19,763 SRR24654697 19,765 SRR24655991 19,794 SRR24656235 19,813 SRR24656242 19,815 SRR24654607 19,823 SRR24654399 19,853 SRR24654186 19,855 SRR24654226 19,857 SRR24654454 19,864 SRR24655951 19,887 SRR24654279 19,887 SRR24656443 19,888 SRR24654045 19,891 SRR24654400 19,894 SRR24654632 19,896 SRR24654238 19,897 SRR24654215 19,915 SRR24654340 19,928 SRR24655752 19,954 SRR24654297 19,957 SRR24654706 19,991 SRR24655963 19,994 SRR24654403 20,002 SRR24654314 20,004 SRR24656308 20,004 SRR24654677 20,015 SRR24654115 20,022 SRR24655967 20,028 SRR24654720 20,031 SRR24654569 20,038 SRR24656260 20,047 SRR24654372 20,054 SRR24656218 20,063 SRR24656424 20,073 SRR24654288 20,093 SRR24654726 20,111 SRR24654712 20,118 SRR24654521 20,131 SRR24654605 20,140 SRR24656195 20,143 SRR24654442 20,156 SRR24656337 20,161 SRR24656168 20,161 SRR24654508 20,166 SRR24654179 20,170 SRR24654597 20,175 SRR24655910 20,194 SRR24656294 20,195 SRR24654405 20,236 SRR24656470 20,256 SRR24655744 20,265 SRR24654368 20,272 SRR24654765 20,298 SRR24654204 20,317 SRR24654302 20,317 SRR24656122 20,326 SRR24654375 20,341 SRR24655909 20,341 SRR24655844 20,341 SRR24656288 20,354 SRR24656476 20,355 SRR24656183 20,355 SRR24654384 20,366 SRR24654659 20,389 SRR24654678 20,404 SRR24655892 20,409 SRR24654050 20,410 SRR24655985 20,415 SRR24654497 20,424 SRR24654230 20,429 SRR24654355 20,429 SRR24656297 20,444 SRR24654380 20,452 SRR24654352 20,465 SRR24656469 20,473 SRR24655849 20,503 SRR24655764 20,503 SRR24655828 20,505 SRR24654175 20,509 SRR24654404 20,519 SRR24654551 20,522 SRR24654452 20,523 SRR24654622 20,555 SRR24656347 20,557 SRR24654439 20,560 SRR24655908 20,575 SRR24654325 20,576 SRR24655956 20,578 SRR24654410 20,579 SRR24654210 20,580 SRR24654647 20,581 SRR24656348 20,602 SRR24654494 20,602 SRR24654159 20,608 SRR24655935 20,611 SRR24656154 20,618 SRR24656262 20,620 SRR24654490 20,623 SRR24655769 20,627 SRR24654617 20,629 SRR24654099 20,644 SRR24654768 20,649 SRR24656128 20,653 SRR24654390 20,705 SRR24655766 20,734 SRR24656270 20,734 SRR24655742 20,747 SRR24655715 20,764 SRR24656359 20,772 SRR24654496 20,791 SRR24655829 20,794 SRR24654663 20,798 SRR24654493 20,799 SRR24656447 20,805 SRR24654651 20,830 SRR24654719 20,838 SRR24656209 20,839 SRR24655994 20,844 SRR24654600 20,859 SRR24655895 20,892 SRR24655836 20,901 SRR24656157 20,910 SRR24656121 20,920 SRR24655976 20,921 SRR24654109 20,933 SRR24654581 20,934 SRR24654771 20,939 SRR24654184 20,965 SRR24655941 20,971 SRR24656360 20,979 SRR24654249 20,982 SRR24656244 20,988 SRR24654170 21,005 SRR24654373 21,015 SRR24656290 21,015 SRR24655934 21,016 SRR24655953 21,019 SRR24654586 21,032 SRR24655865 21,034 SRR24656340 21,038 SRR24654752 21,041 SRR24656123 21,043 SRR24654519 21,050 SRR24656199 21,051 SRR24654656 21,054 SRR24654419 21,058 SRR24654248 21,059 SRR24656239 21,061 SRR24654393 21,070 SRR24654453 21,079 SRR24655848 21,085 SRR24655903 21,096 SRR24654562 21,097 SRR24654385 21,107 SRR24654178 21,109 SRR24654723 21,111 SRR24655943 21,129 SRR24656215 21,149 SRR24656172 21,154 SRR24654237 21,156 SRR24656410 21,165 SRR24654048 21,188 SRR24656135 21,190 SRR24654073 21,197 SRR24655827 21,204 SRR24654451 21,229 SRR24656038 21,247 SRR24654411 21,263 SRR24656327 21,264 SRR24654455 21,271 SRR24654402 21,283 SRR24654608 21,288 SRR24654633 21,294 SRR24654361 21,310 SRR24656364 21,320 SRR24656472 21,325 SRR24656370 21,325 SRR24654110 21,336 SRR24656386 21,352 SRR24656112 21,355 SRR24654114 21,355 SRR24656388 21,360 SRR24654479 21,362 SRR24654039 21,363 SRR24656125 21,366 SRR24654407 21,366 SRR24655913 21,369 SRR24654552 21,372 SRR24654228 21,377 SRR24654751 21,386 SRR24656186 21,392 SRR24655728 21,407 SRR24656069 21,416 SRR24656361 21,421 SRR24655960 21,433 SRR24655933 21,446 SRR24654173 21,453 SRR24656385 21,461 SRR24656473 21,469 SRR24654224 21,471 SRR24654343 21,484 SRR24654558 21,500 SRR24654498 21,505 SRR24654409 21,532 SRR24654233 21,532 SRR24654095 21,534 SRR24655901 21,549 SRR24654169 21,560 SRR24655754 21,567 SRR24656326 21,570 SRR24656493 21,586 SRR24656465 21,591 SRR24654727 21,601 SRR24654754 21,608 SRR24654750 21,622 SRR24656318 21,629 SRR24654655 21,637 SRR24654272 21,640 SRR24656502 21,659 SRR24654555 21,668 SRR24656184 21,686 SRR24654105 21,695 SRR24655821 21,715 SRR24656002 21,734 SRR24654418 21,739 SRR24656460 21,764 SRR24654682 21,768 SRR24655999 21,802 SRR24656109 21,820 SRR24654604 21,823 SRR24656342 21,824 SRR24654746 21,834 SRR24654575 21,839 SRR24656140 21,846 SRR24654729 21,847 SRR24656372 21,854 SRR24656265 21,859 SRR24656217 21,866 SRR24654576 21,866 SRR24655873 21,867 SRR24656090 21,872 SRR24655772 21,874 SRR24656305 21,884 SRR24655708 21,891 SRR24656153 21,906 SRR24655710 21,914 SRR24654245 21,916 SRR24656117 21,918 SRR24656456 21,922 SRR24656323 21,923 SRR24656036 21,929 SRR24655990 21,936 SRR24654415 21,941 SRR24656363 21,947 SRR24656504 21,967 SRR24654312 21,979 SRR24654743 21,989 SRR24655961 21,999 SRR24655767 22,006 SRR24654370 22,018 SRR24655841 22,032 SRR24656110 22,033 SRR24656247 22,040 SRR24656332 22,058 SRR24655850 22,061 SRR24654463 22,062 SRR24654162 22,077 SRR24655971 22,082 SRR24656052 22,099 SRR24656126 22,099 SRR24655942 22,126 SRR24654310 22,127 SRR24656026 22,137 SRR24656428 22,146 SRR24654543 22,151 SRR24654255 22,165 SRR24655826 22,179 SRR24654524 22,180 SRR24655855 22,182 SRR24656275 22,186 SRR24656325 22,189 SRR24654542 22,215 SRR24654160 22,220 SRR24656416 22,223 SRR24654240 22,242 SRR24656475 22,244 SRR24654513 22,252 SRR24655919 22,270 SRR24656446 22,273 SRR24656487 22,291 SRR24654728 22,295 SRR24654443 22,307 SRR24656411 22,315 SRR24655731 22,318 SRR24654547 22,322 SRR24655717 22,355 SRR24656220 22,373 SRR24656352 22,379 SRR24656306 22,383 SRR24654767 22,392 SRR24656204 22,404 SRR24654027 22,420 SRR24656351 22,430 SRR24654718 22,433 SRR24655882 22,447 SRR24656263 22,452 SRR24655988 22,465 SRR24655727 22,471 SRR24656317 22,481 SRR24655753 22,503 SRR24654041 22,509 SRR24656495 22,519 SRR24656319 22,520 SRR24655751 22,523 SRR24655962 22,523 SRR24654458 22,526 SRR24654392 22,527 SRR24654568 22,531 SRR24654171 22,612 SRR24654397 22,628 SRR24654535 22,629 SRR24656425 22,643 SRR24656221 22,657 SRR24654339 22,673 SRR24656145 22,677 SRR24656137 22,691 SRR24656418 22,696 SRR24654478 22,698 SRR24654480 22,710 SRR24656180 22,711 SRR24656207 22,727 SRR24656501 22,738 SRR24654158 22,740 SRR24654748 22,741 SRR24655843 22,767 SRR24655920 22,776 SRR24655916 22,777 SRR24654541 22,792 SRR24655969 22,794 SRR24656129 22,799 SRR24655968 22,823 SRR24654396 22,877 SRR24656255 22,881 SRR24654301 22,887 SRR24655964 22,911 SRR24655975 22,933 SRR24655889 22,938 SRR24656024 22,974 SRR24654181 22,977 SRR24654214 23,000 SRR24656138 23,003 SRR24656316 23,024 SRR24654062 23,030 SRR24656047 23,035 SRR24654358 23,036 SRR24655987 23,039 SRR24654732 23,041 SRR24656415 23,048 SRR24654183 23,083 SRR24654044 23,094 SRR24655874 23,098 SRR24656281 23,109 SRR24654256 23,121 SRR24654231 23,134 SRR24654030 23,139 SRR24654067 23,139 SRR24655838 23,158 SRR24654526 23,175 SRR24654220 23,186 SRR24654460 23,189 SRR24655937 23,198 SRR24654351 23,208 SRR24654049 23,221 SRR24654464 23,223 SRR24656216 23,229 SRR24654037 23,235 SRR24656307 23,236 SRR24656309 23,244 SRR24656302 23,245 SRR24654394 23,259 SRR24656419 23,269 SRR24654163 23,282 SRR24655958 23,283 SRR24656366 23,289 SRR24654176 23,299 SRR24654040 23,301 SRR24656433 23,310 SRR24654745 23,328 SRR24654164 23,343 SRR24655887 23,357 SRR24654588 23,360 SRR24656292 23,363 SRR24656003 23,365 SRR24656170 23,367 SRR24656293 23,378 SRR24655736 23,379 SRR24656343 23,382 SRR24654657 23,416 SRR24654557 23,439 SRR24656295 23,446 SRR24654243 23,451 SRR24655986 23,480 SRR24656421 23,556 SRR24654561 23,569 SRR24654667 23,579 SRR24655905 23,582 SRR24655835 23,594 SRR24656102 23,621 SRR24654662 23,627 SRR24655714 23,629 SRR24655763 23,637 SRR24654634 23,645 SRR24655723 23,648 SRR24656113 23,651 SRR24654046 23,671 SRR24654511 23,677 SRR24654505 23,685 SRR24654450 23,697 SRR24654520 23,712 SRR24656277 23,725 SRR24656268 23,729 SRR24656191 23,738 SRR24656072 23,745 SRR24656387 23,745 SRR24656211 23,751 SRR24654636 23,798 SRR24654638 23,856 SRR24655722 23,863 SRR24655893 23,873 SRR24654763 23,893 SRR24656179 23,911 SRR24656479 23,921 SRR24654689 23,926 SRR24656264 23,948 SRR24655876 23,950 SRR24654456 23,964 SRR24654401 23,965 SRR24654514 23,992 SRR24656381 23,995 SRR24656477 23,995 SRR24654624 24,006 SRR24654457 24,019 SRR24656177 24,024 SRR24655834 24,045 SRR24654773 24,059 SRR24656203 24,103 SRR24654695 24,109 SRR24656174 24,117 SRR24656054 24,123 SRR24654672 24,126 SRR24656124 24,127 SRR24655918 24,143 SRR24656120 24,152 SRR24656269 24,159 SRR24655729 24,169 SRR24655845 24,174 SRR24654371 24,185 SRR24656439 24,185 SRR24654034 24,193 SRR24656243 24,211 SRR24656273 24,265 SRR24654492 24,269 SRR24655970 24,272 SRR24656331 24,273 SRR24656259 24,290 SRR24656041 24,298 SRR24656114 24,309 SRR24656474 24,309 SRR24656274 24,320 SRR24656227 24,326 SRR24655726 24,358 SRR24654671 24,389 SRR24656248 24,399 SRR24656435 24,418 SRR24654668 24,419 SRR24654691 24,432 SRR24654685 24,473 SRR24656441 24,475 SRR24655980 24,501 SRR24656311 24,510 SRR24654710 24,519 SRR24654333 24,523 SRR24656252 24,536 SRR24656350 24,539 SRR24656040 24,539 SRR24654054 24,567 SRR24655902 24,581 SRR24655837 24,582 SRR24656176 24,582 SRR24656329 24,627 SRR24655739 24,645 SRR24656413 24,648 SRR24654398 24,673 SRR24655749 24,681 SRR24654725 24,682 SRR24654491 24,728 SRR24656289 24,729 SRR24656127 24,759 SRR24655930 24,760 SRR24656434 24,780 SRR24654510 24,792 SRR24655998 24,804 SRR24655808 24,812 SRR24656276 24,822 SRR24656389 24,829 SRR24655825 24,831 SRR24656051 24,854 SRR24655996 24,854 SRR24655812 24,892 SRR24655725 24,899 SRR24655737 24,913 SRR24656037 24,932 SRR24656482 24,946 SRR24654556 24,947 SRR24655973 24,953 SRR24655833 24,953 SRR24656468 24,960 SRR24655897 24,985 SRR24654687 25,027 SRR24654507 25,038 SRR24656303 25,043 SRR24656205 25,045 SRR24655877 25,061 SRR24656213 25,064 SRR24654564 25,065 SRR24654721 25,068 SRR24656029 25,088 SRR24654029 25,102 SRR24655938 25,104 SRR24656136 25,119 SRR24655977 25,128 SRR24655750 25,144 SRR24654448 25,146 SRR24654028 25,154 SRR24654764 25,163 SRR24656133 25,184 SRR24656025 25,187 SRR24655936 25,211 SRR24654545 25,252 SRR24654225 25,260 SRR24655939 25,261 SRR24654298 25,276 SRR24655765 25,277 SRR24654309 25,280 SRR24654731 25,305 SRR24654412 25,308 SRR24654483 25,335 SRR24656111 25,351 SRR24654242 25,352 SRR24656371 25,360 SRR24655926 25,394 SRR24656390 25,399 SRR24655972 25,411 SRR24656131 25,433 SRR24656261 25,443 SRR24655932 25,455 SRR24654043 25,501 SRR24654286 25,505 SRR24656266 25,506 SRR24655997 25,509 SRR24655810 25,526 SRR24654571 25,536 SRR24656362 25,542 SRR24656118 25,575 SRR24654565 25,614 SRR24655740 25,622 SRR24654674 25,624 SRR24656378 25,631 SRR24656206 25,648 SRR24656130 25,674 SRR24656354 25,679 SRR24654035 25,706 SRR24655974 25,709 SRR24656035 25,720 SRR24654322 25,736 SRR24654523 25,742 SRR24656116 25,745 SRR24654104 25,750 SRR24655881 25,758 SRR24654641 25,837 SRR24654713 25,846 SRR24654446 25,851 SRR24656335 25,872 SRR24654704 25,873 SRR24656253 25,882 SRR24654639 25,890 SRR24656431 25,947 SRR24656208 25,962 SRR24654518 25,971 SRR24654406 25,988 SRR24655759 26,015 SRR24654506 26,021 SRR24656454 26,033 SRR24655755 26,057 SRR24656063 26,063 SRR24656500 26,065 SRR24655878 26,073 SRR24656115 26,079 SRR24655823 26,102 SRR24656272 26,103 SRR24656053 26,121 SRR24654531 26,160 SRR24655815 26,163 SRR24655813 26,185 SRR24655721 26,188 SRR24655915 26,221 SRR24655879 26,224 SRR24654772 26,228 SRR24656201 26,229 SRR24654635 26,301 SRR24654554 26,320 SRR24655811 26,331 SRR24656023 26,337 SRR24655870 26,360 SRR24656219 26,403 SRR24654051 26,453 SRR24656027 26,530 SRR24656187 26,532 SRR24656039 26,535 SRR24656257 26,560 SRR24656200 26,597 SRR24654516 26,661 SRR24655883 26,669 SRR24656181 26,696 SRR24654577 26,739 SRR24656279 26,774 SRR24656345 26,792 SRR24656484 26,804 SRR24654559 26,838 SRR24654550 26,930 SRR24654528 26,936 SRR24654472 26,940 SRR24656048 26,944 SRR24656043 26,962 SRR24656073 27,006 SRR24656321 27,017 SRR24655807 27,035 SRR24655822 27,036 SRR24656059 27,044 SRR24656280 27,060 SRR24655852 27,075 SRR24656202 27,092 SRR24656485 27,102 SRR24654057 27,103 SRR24655890 27,105 SRR24654527 27,109 SRR24656478 27,112 SRR24656194 27,115 SRR24654056 27,146 SRR24656429 27,171 SRR24654167 27,171 SRR24654702 27,185 SRR24656355 27,193 SRR24655995 27,205 SRR24654250 27,206 SRR24655891 27,211 SRR24656214 27,306 SRR24656193 27,314 SRR24654058 27,327 SRR24656134 27,351 SRR24656438 27,359 SRR24656175 27,362 SRR24655842 27,363 SRR24654042 27,364 SRR24654033 27,369 SRR24656256 27,412 SRR24656437 27,439 SRR24656436 27,455 SRR24655983 27,484 SRR24656009 27,486 SRR24654688 27,510 SRR24654202 27,519 SRR24656077 27,536 SRR24655981 27,537 SRR24655738 27,579 SRR24656075 27,579 SRR24655819 27,581 SRR24656432 27,623 SRR24654246 27,666 SRR24656064 27,668 SRR24654221 27,687 SRR24656427 27,703 SRR24656055 27,712 SRR24655720 27,768 SRR24654031 27,789 SRR24654413 27,790 SRR24656349 27,795 SRR24655716 27,807 SRR24655922 27,831 SRR24655820 27,838 SRR24654703 27,860 SRR24656258 27,891 SRR24656480 27,895 SRR24654111 27,918 SRR24655888 27,946 SRR24654698 27,950 SRR24656278 28,002 SRR24656182 28,028 SRR24656049 28,036 SRR24656046 28,053 SRR24654501 28,080 SRR24656254 28,083 SRR24654036 28,175 SRR24654722 28,197 SRR24656050 28,215 SRR24656383 28,217 SRR24654509 28,221 SRR24656375 28,233 SRR24656267 28,277 SRR24656422 28,289 SRR24655923 28,326 SRR24656071 28,347 SRR24656491 28,376 SRR24656304 28,420 SRR24654244 28,434 SRR24654637 28,447 SRR24656353 28,482 SRR24656330 28,510 SRR24654247 28,546 SRR24656346 28,611 SRR24654686 28,616 SRR24656384 28,639 SRR24656185 28,677 SRR24656132 28,694 SRR24654762 28,707 SRR24655718 28,709 SRR24654643 28,786 SRR24654055 28,856 SRR24656496 28,866 SRR24654503 28,884 SRR24656015 28,890 SRR24656271 28,959 SRR24654441 28,969 SRR24654652 28,980 SRR24654699 28,995 SRR24654574 28,997 SRR24656062 29,007 SRR24656028 29,014 SRR24656197 29,040 SRR24655984 29,157 SRR24656001 29,198 SRR24654502 29,212 SRR24655757 29,243 SRR24654345 29,286 SRR24654500 29,326 SRR24656022 29,455 SRR24656379 29,464 SRR24655940 29,478 SRR24656070 29,512 SRR24656171 29,558 SRR24654421 29,589 SRR24656339 29,597 SRR24656060 29,682 SRR24656382 29,738 SRR24656067 29,786 SRR24654038 29,974 SRR24656298 29,989 SRR24656056 30,056 SRR24656013 30,134 SRR24656423 30,137 SRR24655711 30,147 SRR24655732 30,259 SRR24656192 30,306 SRR24656007 30,378 SRR24654599 30,585 SRR24656198 30,591 SRR24655734 30,618 SRR24656034 30,629 SRR24656178 30,636 SRR24656058 30,866 SRR24656011 30,906 SRR24656376 30,912 SRR24656426 30,930 SRR24656018 30,972 SRR24656373 31,035 SRR24656377 31,085 SRR24656212 31,153 SRR24656374 31,176 SRR24656190 31,208 SRR24656497 31,358 SRR24655817 31,463 SRR24656017 31,608 SRR24654701 31,967 SRR24656008 32,054 SRR24656498 32,204 SRR24654642 32,267 SRR24656061 32,317 SRR24656004 32,431 SRR24654761 32,455 SRR24654711 32,561 SRR24655713 32,722 SRR24655712 32,867 SRR24656019 32,896 SRR24656012 32,910 SRR24656068 32,964 SRR24655928 32,979 SRR24656006 32,998 SRR24655931 33,238 SRR24654700 33,377 SRR24655927 33,553 SRR24656357 33,666 SRR24656065 33,993 SRR24656014 34,208 SRR24655929 34,336 SRR24656196 34,987 SRR24656045 35,266 SRR24656057 35,658 SRR24656074 35,678 SRR24654348 35,970 SRR24654640 36,174 SRR24655880 36,548 SRR24656016 37,819 SRR24656005 37,911 SRR24654219 37,948 F12694.S254 55,651 F12694.S211 58,418 F12694.S248 61,635 F12694.S223 73,710 F12694.S255 74,714 F12694.S253 75,170 F12694.S260 75,479 F12694.S071 77,237 F12694.S256 78,337 F12694.S214 80,672 F12694.S213 81,646 F12694.S117 81,874 F12694.S252 82,468 F12694.S033 82,694 F12694.S199 83,408 F12694.S078 83,949 F12694.S011 84,343 F12694.S165 84,735 F12694.S194 84,785 F12694.S091 84,928 F12694.S220 84,954 F12694.S037 85,125 F12694.S084 85,660 F12694.S251 85,749 F12694.S245 85,806 F12694.S232 85,904 F12694.S219 86,364 F12694.S031 86,970 F12694.S125 87,109 F12694.S224 87,129 F12694.S172 87,672 F12694.S014 87,779 F12694.S039 88,557 F12694.S044 89,503 F12694.S018 89,527 F12694.S030 89,572 F12694.S259 90,202 F12694.S101 90,370 F12694.S141 90,811 F12694.S001 90,870 F12694.S127 91,011 F12694.S207 91,071 F12694.S181 91,258 F12694.S188 91,596 F12694.S247 91,713 F12694.S155 91,801 F12694.S157 92,048 F12694.S164 92,109 F12694.S040 92,424 F12694.S074 92,573 F12694.S205 92,579 F12694.S221 92,835 F12694.S077 92,887 F12694.S202 93,117 F12694.S234 93,291 F12694.S138 93,310 F12694.S169 93,724 F12694.S038 93,818 F12694.S238 93,932 F12694.S025 94,019 F12694.S262 94,365 F12694.S027 94,507 F12694.S135 94,575 F12694.S043 94,788 F12694.S110 95,232 F12694.S012 95,380 F12694.S079 95,506 F12694.S261 95,918 F12694.S095 96,240 F12694.S266 96,262 F12694.S059 96,539 F12694.S250 96,988 F12694.S060 96,997 F12694.S230 97,263 F12694.S066 97,403 F12694.S264 97,802 F12694.S085 97,931 F12694.S013 98,023 F12694.S076 98,268 F12694.S191 98,602 F12694.S064 98,622 F12694.S209 98,672 F12694.S216 98,697 F12694.S026 98,839 F12694.S052 98,988 F12694.S019 99,032 F12694.S159 99,207 F12694.S208 99,465 F12694.S246 99,603 F12694.S107 99,824 F12694.S187 99,895 F12694.S222 100,212 F12694.S133 100,237 F12694.S116 100,469 F12694.S051 100,638 F12694.S009 100,648 F12694.S042 100,648 F12694.S103 100,671 F12694.S032 100,705 F12694.S072 100,747 F12694.S197 100,972 F12694.S198 101,106 F12694.S151 101,136 F12694.S128 101,685 F12694.S093 101,743 F12694.S189 101,826 F12694.S035 101,863 F12694.S063 101,866 F12694.S124 101,939 F12694.S195 102,191 F12694.S080 102,431 F12694.S108 102,746 F12694.S054 102,865 F12694.S055 103,155 F12694.S204 103,214 F12694.S206 103,307 F12694.S024 103,380 F12694.S143 103,453 F12694.S111 103,510 F12694.S034 103,573 F12694.S020 103,840 F12694.S265 103,992 F12694.S142 104,235 F12694.S087 104,263 F12694.S267 104,594 F12694.S083 104,872 F12694.S217 104,926 F12694.S119 104,932 F12694.S045 105,055 F12694.S178 105,113 F12694.S196 105,141 F12694.S171 105,143 F12694.S005 105,155 F12694.S017 105,307 F12694.S226 106,339 F12694.S258 106,354 F12694.S061 106,387 F12694.S004 106,464 F12694.S109 106,604 F12694.S129 106,634 F12694.S023 106,957 F12694.S022 106,979 F12694.S048 107,554 F12694.S106 107,711 F12694.S006 107,802 F12694.S218 107,959 F12694.S126 108,126 F12694.S053 108,199 F12694.S212 108,222 F12694.S122 108,376 F12694.S162 108,606 F12694.S147 108,631 F12694.S099 108,649 F12694.S028 108,990 F12694.S160 109,010 F12694.S094 109,100 F12694.S149 109,132 F12694.S113 109,234 F12694.S121 109,253 F12694.S047 109,397 F12694.S105 109,540 F12694.S132 109,922 F12694.S046 109,941 F12694.S237 110,439 F12694.S140 110,501 F12694.S239 110,538 F12694.S263 110,571 F12694.S092 110,987 F12694.S173 111,131 F12694.S115 111,423 F12694.S144 111,458 F12694.S029 111,487 F12694.S166 111,877 F12694.S097 112,018 F12694.S150 112,112 F12694.S058 112,201 F12694.S062 112,297 F12694.S021 112,313 F12694.S075 112,697 F12694.S146 112,859 F12694.S148 113,246 F12694.S050 113,907 F12694.S086 114,017 F12694.S118 114,045 F12694.S170 114,476 F12694.S088 114,557 F12694.S114 114,713 F12694.S036 114,730 F12694.S003 114,885 F12694.S123 115,306 F12694.S167 115,478 F12694.S244 115,800 F12694.S104 115,814 F12694.S242 115,889 F12694.S227 115,906 F12694.S176 116,002 F12694.S010 116,233 F12694.S145 116,272 F12694.S193 116,408 F12694.S153 116,458 F12694.S102 116,537 F12694.S231 116,823 F12694.S098 117,033 F12694.S180 117,049 F12694.S090 117,228 F12694.S007 117,288 F12694.S177 117,409 F12694.S056 117,453 F12694.S096 117,874 F12694.S163 118,119 F12694.S130 118,433 F12694.S179 118,605 F12694.S156 118,750 F12694.S070 118,890 F12694.S175 118,993 F12694.S203 119,018 F12694.S184 119,160 F12694.S112 119,508 F12694.S100 119,529 F12694.S154 120,993 F12694.S152 121,007 F12694.S229 121,052 F12694.S016 121,135 F12694.S008 121,270 F12694.S168 121,667 F12694.S243 122,094 F12694.S235 122,105 F12694.S192 122,537 F12694.S131 123,046 F12694.S201 123,539 F12694.S215 123,547 F12694.S049 123,684 F12694.S015 123,698 F12694.S268 125,132 F12694.S041 125,382 F12694.S139 125,627 F12694.S067 125,869 F12694.S068 126,986 F12694.S236 127,036 F12694.S200 127,702 F12694.S134 128,443 F12694.S225 129,036 F12694.S158 129,361 F12694.S186 129,660 F12694.S183 129,818 F12694.S161 130,134 F12694.S057 130,290 F12694.S174 131,646 F12694.S120 132,171 F12694.S241 132,450 F12694.S081 134,131 F12694.S089 134,911 F12694.S182 135,199 F12694.S228 135,935 F12694.S240 138,290 F12694.S136 138,739 F12694.S233 140,234 F12694.S210 140,414 F12694.S185 141,119 F12694.S190 142,695 F12694.S257 143,671 F12694.S002 147,781 F12694.S082 148,212 F12694.S073 148,599 F12694.S249 150,400 F12694.S065 152,844 F12694.S137 199,081 F12694.S069 211,250
VII. Analysis - Read Taxonomy Assignment
Read Taxonomy Assignment - Methods
The species-level, open-reference 16S rRNA NGS reads taxonomy assignment pipeline
Version 20210310
1. Raw sequences reads in FASTA format were BLASTN-searched against a combined set of 16S rRNA reference sequences.
It consists of MOMD (version 0.1), the HOMD (version 15.2 http://www.homd.org/index.php?name=seqDownload&file&type=R ),
HOMD 16S rRNA RefSeq Extended Version 1.1 (EXT), GreenGene Gold (GG)
(http://greengenes.lbl.gov/Download/Sequence_Data/Fasta_data_files/gold_strains_gg16S_aligned.fasta.gz) ,
and the NCBI 16S rRNA reference sequence set (https://ftp.ncbi.nlm.nih.gov/blast/db/16S_ribosomal_RNA.tar.gz).
These sequences were screened and combined to remove short sequences (<1000nt), chimera, duplicated and sub-sequences,
as well as sequences with poor taxonomy annotation (e.g., without species information).
This process resulted in 1,015 from HOMD V15.22, 495 from EXT, 3,940 from GG and 18,044 from NCBI, a total of 25,120 sequences.
Altogether these sequence represent a total of 15,601 oral and non-oral microbial species.
The NCBI BLASTN version 2.7.1+ (Zhang et al, 2000) was used with the default parameters.
Reads with ≥ 98% sequence identity to the matched reference and ≥ 90% alignment length
(i.e., ≥ 90% of the read length that was aligned to the reference and was used to calculate
the sequence percent identity) were classified based on the taxonomy of the reference sequence
with highest sequence identity. If a read matched with reference sequences representing
more than one species with equal percent identity and alignment length, it was subject
to chimera checking with USEARCH program version v8.1.1861 (Edgar 2010). Non-chimeric reads with multi-species
best hits were considered valid and were assigned with a unique species
notation (e.g., spp) denoting unresolvable multiple species.
2. Unassigned reads (i.e., reads with < 98% identity or < 90% alignment length) were pooled together and reads < 200 bases were
removed. The remaining reads were subject to the de novo
operational taxonomy unit (OTU) calling and chimera checking using the USEARCH program version v8.1.1861 (Edgar 2010).
The de novo OTU calling and chimera checking was done using 98% as the sequence identity cutoff, i.e., the species-level OTU.
The output of this step produced species-level de novo clustered OTUs with 98% identity.
Representative reads from each of the OTUs/species were then BLASTN-searched
against the same reference sequence set again to determine the closest species for
these potential novel species. These potential novel species were pooled together with the reads that were signed to specie-level in
the previous step, for down-stream analyses.
Reference:
3. Designations used in the taxonomy:
1) Taxonomy levels are indicated by these prefixes:
k__: domain/kingdom
p__: phylum
c__: class
o__: order
f__: family
g__: genus
s__: species
Example:
k__Bacteria;p__Firmicutes;c__Clostridia;o__Clostridiales;f__Lachnospiraceae;g__Blautia;s__faecis
2) Unique level identified – known species:
k__Bacteria;p__Firmicutes;c__Clostridia;o__Clostridiales;f__Lachnospiraceae;g__Roseburia;s__hominis
The above example shows some reads match to a single species (all levels are unique)
3) Non-unique level identified – known species:
k__Bacteria;p__Firmicutes;c__Clostridia;o__Clostridiales;f__Lachnospiraceae;g__Roseburia;s__multispecies_spp123_3
The above example “s__multispecies_spp123_3” indicates certain reads equally match to 3 species of the
genus Roseburia; the “spp123” is a temporally assigned species ID.
k__Bacteria;p__Firmicutes;c__Clostridia;o__Clostridiales;f__Lachnospiraceae;g__multigenus;s__multispecies_spp234_5
The above example indicates certain reads match equally to 5 different species, which belong to multiple genera.;
the “spp234” is a temporally assigned species ID.
4) Unique level identified – unknown species, potential novel species:
k__Bacteria;p__Firmicutes;c__Clostridia;o__Clostridiales;f__Lachnospiraceae;g__Roseburia;s__ hominis_nov_97%
The above example indicates that some reads have no match to any of the reference sequences with
sequence identity ≥ 98% and percent coverage (alignment length) ≥ 98% as well. However this groups
of reads (actually the representative read from a de novo OTU) has 96% percent identity to
Roseburia hominis, thus this is a potential novel species, closest to Roseburia hominis.
(But they are not the same species).
5) Multiple level identified – unknown species, potential novel species:
k__Bacteria;p__Firmicutes;c__Clostridia;o__Clostridiales;f__Lachnospiraceae;g__Roseburia;s__ multispecies_sppn123_3_nov_96%
The above example indicates that some reads have no match to any of the reference sequences
with sequence identity ≥ 98% and percent coverage (alignment length) ≥ 98% as well.
However this groups of reads (actually the representative read from a de novo OTU)
has 96% percent identity equally to 3 species in Roseburia. Thus this is no single
closest species, instead this group of reads match equally to multiple species at 96%.
Since they have passed chimera check so they represent a novel species. “sppn123” is a
temporary ID for this potential novel species.
4. The taxonomy assignment algorithm is illustrated in this flow char below:
Read Taxonomy Assignment - Result Summary *
Code Category MPC=0% (>=1 read) MPC=0.01%(>=5690 reads) A Total reads 59,618,032 59,618,032 B Total assigned reads 56,900,194 56,900,194 C Assigned reads in species with read count < MPC 0 483,351 D Assigned reads in samples with read count < 500 2,201 2,498 E Total samples 1,824 1,824 F Samples with reads >= 500 1,798 1,797 G Samples with reads < 500 26 27 H Total assigned reads used for analysis (B-C-D) 56,897,993 56,414,345 I Reads assigned to single species 37,346,955 37,092,784 J Reads assigned to multiple species 18,530,315 18,396,086 K Reads assigned to novel species 1,020,723 925,475 L Total number of species 849 292 M Number of single species 466 189 N Number of multi-species 226 71 O Number of novel species 157 32 P Total unassigned reads 2,717,838 2,717,838 Q Chimeric reads 56,705 56,705 R Reads without BLASTN hits 3,939 3,939 S Others: short, low quality, singletons, etc. 2,657,194 2,657,194 A=B+P=C+D+H+Q+R+S E=F+G B=C+D+H H=I+J+K L=M+N+O P=Q+R+S
* MPC = Minimal percent (of all assigned reads) read count per species, species with read count < MPC were removed. * Samples with reads < 500 were removed from downstream analyses. * The assignment result from MPC=0.1% was used in the downstream analyses.
Read Taxonomy Assignment - ASV Species-Level Read Counts Table
This table shows the read counts for each sample (columns) and each species identified based on the ASV sequences.
The downstream analyses were based on this table.
SPID Taxonomy F12694.S001 F12694.S002 F12694.S003 F12694.S004 F12694.S005 F12694.S006 F12694.S007 F12694.S008 F12694.S009 F12694.S010 F12694.S011 F12694.S012 F12694.S013 F12694.S014 F12694.S015 F12694.S016 F12694.S017 F12694.S018 F12694.S019 F12694.S020 F12694.S021 F12694.S022 F12694.S023 F12694.S024 F12694.S025 F12694.S026 F12694.S027 F12694.S028 F12694.S029 F12694.S030 F12694.S031 F12694.S032 F12694.S033 F12694.S034 F12694.S035 F12694.S036 F12694.S037 F12694.S038 F12694.S039 F12694.S040 F12694.S041 F12694.S042 F12694.S043 F12694.S044 F12694.S045 F12694.S046 F12694.S047 F12694.S048 F12694.S049 F12694.S050 F12694.S051 F12694.S052 F12694.S053 F12694.S054 F12694.S055 F12694.S056 F12694.S057 F12694.S058 F12694.S059 F12694.S060 F12694.S061 F12694.S062 F12694.S063 F12694.S064 F12694.S065 F12694.S066 F12694.S067 F12694.S068 F12694.S069 F12694.S070 F12694.S071 F12694.S072 F12694.S073 F12694.S074 F12694.S075 F12694.S076 F12694.S077 F12694.S078 F12694.S079 F12694.S080 F12694.S081 F12694.S082 F12694.S083 F12694.S084 F12694.S085 F12694.S086 F12694.S087 F12694.S088 F12694.S089 F12694.S090 F12694.S091 F12694.S092 F12694.S093 F12694.S094 F12694.S095 F12694.S096 F12694.S097 F12694.S098 F12694.S099 F12694.S100 F12694.S101 F12694.S102 F12694.S103 F12694.S104 F12694.S105 F12694.S106 F12694.S107 F12694.S108 F12694.S109 F12694.S110 F12694.S111 F12694.S112 F12694.S113 F12694.S114 F12694.S115 F12694.S116 F12694.S117 F12694.S118 F12694.S119 F12694.S120 F12694.S121 F12694.S122 F12694.S123 F12694.S124 F12694.S125 F12694.S126 F12694.S127 F12694.S128 F12694.S129 F12694.S130 F12694.S131 F12694.S132 F12694.S133 F12694.S134 F12694.S135 F12694.S136 F12694.S137 F12694.S138 F12694.S139 F12694.S140 F12694.S141 F12694.S142 F12694.S143 F12694.S144 F12694.S145 F12694.S146 F12694.S147 F12694.S148 F12694.S149 F12694.S150 F12694.S151 F12694.S152 F12694.S153 F12694.S154 F12694.S155 F12694.S156 F12694.S157 F12694.S158 F12694.S159 F12694.S160 F12694.S161 F12694.S162 F12694.S163 F12694.S164 F12694.S165 F12694.S166 F12694.S167 F12694.S168 F12694.S169 F12694.S170 F12694.S171 F12694.S172 F12694.S173 F12694.S174 F12694.S175 F12694.S176 F12694.S177 F12694.S178 F12694.S179 F12694.S180 F12694.S181 F12694.S182 F12694.S183 F12694.S184 F12694.S185 F12694.S186 F12694.S187 F12694.S188 F12694.S189 F12694.S190 F12694.S191 F12694.S192 F12694.S193 F12694.S194 F12694.S195 F12694.S196 F12694.S197 F12694.S198 F12694.S199 F12694.S200 F12694.S201 F12694.S202 F12694.S203 F12694.S204 F12694.S205 F12694.S206 F12694.S207 F12694.S208 F12694.S209 F12694.S210 F12694.S211 F12694.S212 F12694.S213 F12694.S214 F12694.S215 F12694.S216 F12694.S217 F12694.S218 F12694.S219 F12694.S220 F12694.S221 F12694.S222 F12694.S223 F12694.S224 F12694.S225 F12694.S226 F12694.S227 F12694.S228 F12694.S229 F12694.S230 F12694.S231 F12694.S232 F12694.S233 F12694.S234 F12694.S235 F12694.S236 F12694.S237 F12694.S238 F12694.S239 F12694.S240 F12694.S241 F12694.S242 F12694.S243 F12694.S244 F12694.S245 F12694.S246 F12694.S247 F12694.S248 F12694.S249 F12694.S250 F12694.S251 F12694.S252 F12694.S253 F12694.S254 F12694.S255 F12694.S256 F12694.S257 F12694.S258 F12694.S259 F12694.S260 F12694.S261 F12694.S262 F12694.S263 F12694.S264 F12694.S265 F12694.S266 F12694.S267 F12694.S268 SRR24654017 SRR24654018 SRR24654019 SRR24654020 SRR24654021 SRR24654022 SRR24654023 SRR24654024 SRR24654025 SRR24654026 SRR24654027 SRR24654028 SRR24654029 SRR24654030 SRR24654031 SRR24654032 SRR24654033 SRR24654034 SRR24654035 SRR24654036 SRR24654037 SRR24654038 SRR24654039 SRR24654040 SRR24654041 SRR24654042 SRR24654043 SRR24654044 SRR24654045 SRR24654046 SRR24654047 SRR24654048 SRR24654049 SRR24654050 SRR24654051 SRR24654052 SRR24654053 SRR24654054 SRR24654055 SRR24654056 SRR24654057 SRR24654058 SRR24654059 SRR24654060 SRR24654061 SRR24654062 SRR24654063 SRR24654064 SRR24654065 SRR24654066 SRR24654067 SRR24654068 SRR24654069 SRR24654070 SRR24654071 SRR24654072 SRR24654073 SRR24654074 SRR24654075 SRR24654076 SRR24654077 SRR24654078 SRR24654079 SRR24654080 SRR24654081 SRR24654082 SRR24654083 SRR24654084 SRR24654085 SRR24654086 SRR24654087 SRR24654088 SRR24654089 SRR24654090 SRR24654091 SRR24654092 SRR24654093 SRR24654094 SRR24654095 SRR24654096 SRR24654097 SRR24654098 SRR24654099 SRR24654100 SRR24654101 SRR24654102 SRR24654103 SRR24654104 SRR24654105 SRR24654106 SRR24654107 SRR24654108 SRR24654109 SRR24654110 SRR24654111 SRR24654112 SRR24654113 SRR24654114 SRR24654115 SRR24654116 SRR24654117 SRR24654118 SRR24654119 SRR24654120 SRR24654121 SRR24654122 SRR24654123 SRR24654124 SRR24654125 SRR24654126 SRR24654127 SRR24654128 SRR24654129 SRR24654130 SRR24654131 SRR24654132 SRR24654133 SRR24654134 SRR24654135 SRR24654136 SRR24654137 SRR24654138 SRR24654139 SRR24654140 SRR24654141 SRR24654142 SRR24654143 SRR24654144 SRR24654145 SRR24654146 SRR24654147 SRR24654148 SRR24654149 SRR24654150 SRR24654151 SRR24654152 SRR24654153 SRR24654154 SRR24654155 SRR24654156 SRR24654157 SRR24654158 SRR24654159 SRR24654160 SRR24654161 SRR24654162 SRR24654163 SRR24654164 SRR24654165 SRR24654166 SRR24654167 SRR24654168 SRR24654169 SRR24654170 SRR24654171 SRR24654172 SRR24654173 SRR24654174 SRR24654175 SRR24654176 SRR24654177 SRR24654178 SRR24654179 SRR24654180 SRR24654181 SRR24654182 SRR24654183 SRR24654184 SRR24654185 SRR24654186 SRR24654187 SRR24654188 SRR24654189 SRR24654190 SRR24654191 SRR24654192 SRR24654193 SRR24654194 SRR24654195 SRR24654196 SRR24654197 SRR24654198 SRR24654199 SRR24654200 SRR24654201 SRR24654202 SRR24654203 SRR24654204 SRR24654205 SRR24654206 SRR24654207 SRR24654208 SRR24654209 SRR24654210 SRR24654211 SRR24654212 SRR24654213 SRR24654214 SRR24654215 SRR24654216 SRR24654217 SRR24654218 SRR24654219 SRR24654220 SRR24654221 SRR24654222 SRR24654223 SRR24654224 SRR24654225 SRR24654226 SRR24654227 SRR24654228 SRR24654229 SRR24654230 SRR24654231 SRR24654232 SRR24654233 SRR24654234 SRR24654235 SRR24654236 SRR24654237 SRR24654238 SRR24654239 SRR24654240 SRR24654241 SRR24654242 SRR24654243 SRR24654244 SRR24654245 SRR24654246 SRR24654247 SRR24654248 SRR24654249 SRR24654250 SRR24654251 SRR24654252 SRR24654253 SRR24654254 SRR24654255 SRR24654256 SRR24654257 SRR24654258 SRR24654259 SRR24654260 SRR24654261 SRR24654262 SRR24654263 SRR24654264 SRR24654265 SRR24654266 SRR24654267 SRR24654268 SRR24654269 SRR24654270 SRR24654271 SRR24654272 SRR24654273 SRR24654274 SRR24654275 SRR24654276 SRR24654277 SRR24654278 SRR24654279 SRR24654280 SRR24654281 SRR24654282 SRR24654283 SRR24654284 SRR24654285 SRR24654286 SRR24654287 SRR24654288 SRR24654289 SRR24654290 SRR24654291 SRR24654292 SRR24654293 SRR24654294 SRR24654295 SRR24654296 SRR24654297 SRR24654298 SRR24654299 SRR24654300 SRR24654301 SRR24654302 SRR24654303 SRR24654304 SRR24654305 SRR24654306 SRR24654307 SRR24654308 SRR24654309 SRR24654310 SRR24654311 SRR24654312 SRR24654313 SRR24654314 SRR24654315 SRR24654316 SRR24654317 SRR24654318 SRR24654319 SRR24654320 SRR24654321 SRR24654322 SRR24654323 SRR24654324 SRR24654325 SRR24654326 SRR24654327 SRR24654328 SRR24654329 SRR24654330 SRR24654331 SRR24654332 SRR24654333 SRR24654334 SRR24654335 SRR24654336 SRR24654337 SRR24654338 SRR24654339 SRR24654340 SRR24654341 SRR24654342 SRR24654343 SRR24654344 SRR24654345 SRR24654346 SRR24654347 SRR24654348 SRR24654349 SRR24654350 SRR24654351 SRR24654352 SRR24654353 SRR24654354 SRR24654355 SRR24654356 SRR24654357 SRR24654358 SRR24654359 SRR24654360 SRR24654361 SRR24654362 SRR24654363 SRR24654364 SRR24654365 SRR24654366 SRR24654367 SRR24654368 SRR24654369 SRR24654370 SRR24654371 SRR24654372 SRR24654373 SRR24654374 SRR24654375 SRR24654376 SRR24654377 SRR24654378 SRR24654379 SRR24654380 SRR24654381 SRR24654382 SRR24654383 SRR24654384 SRR24654385 SRR24654386 SRR24654387 SRR24654388 SRR24654389 SRR24654390 SRR24654391 SRR24654392 SRR24654393 SRR24654394 SRR24654395 SRR24654396 SRR24654397 SRR24654398 SRR24654399 SRR24654400 SRR24654401 SRR24654402 SRR24654403 SRR24654404 SRR24654405 SRR24654406 SRR24654407 SRR24654408 SRR24654409 SRR24654410 SRR24654411 SRR24654412 SRR24654413 SRR24654414 SRR24654415 SRR24654416 SRR24654417 SRR24654418 SRR24654419 SRR24654420 SRR24654421 SRR24654422 SRR24654423 SRR24654424 SRR24654425 SRR24654426 SRR24654427 SRR24654428 SRR24654429 SRR24654430 SRR24654431 SRR24654432 SRR24654433 SRR24654434 SRR24654435 SRR24654436 SRR24654437 SRR24654438 SRR24654439 SRR24654440 SRR24654441 SRR24654442 SRR24654443 SRR24654444 SRR24654445 SRR24654446 SRR24654447 SRR24654448 SRR24654449 SRR24654450 SRR24654451 SRR24654452 SRR24654453 SRR24654454 SRR24654455 SRR24654456 SRR24654457 SRR24654458 SRR24654459 SRR24654460 SRR24654461 SRR24654462 SRR24654463 SRR24654464 SRR24654465 SRR24654466 SRR24654467 SRR24654468 SRR24654469 SRR24654470 SRR24654471 SRR24654472 SRR24654473 SRR24654474 SRR24654475 SRR24654476 SRR24654477 SRR24654478 SRR24654479 SRR24654480 SRR24654481 SRR24654482 SRR24654483 SRR24654484 SRR24654485 SRR24654486 SRR24654487 SRR24654488 SRR24654489 SRR24654490 SRR24654491 SRR24654492 SRR24654493 SRR24654494 SRR24654495 SRR24654496 SRR24654497 SRR24654498 SRR24654499 SRR24654500 SRR24654501 SRR24654502 SRR24654503 SRR24654504 SRR24654505 SRR24654506 SRR24654507 SRR24654508 SRR24654509 SRR24654510 SRR24654511 SRR24654512 SRR24654513 SRR24654514 SRR24654515 SRR24654516 SRR24654517 SRR24654518 SRR24654519 SRR24654520 SRR24654521 SRR24654522 SRR24654523 SRR24654524 SRR24654525 SRR24654526 SRR24654527 SRR24654528 SRR24654529 SRR24654530 SRR24654531 SRR24654532 SRR24654533 SRR24654534 SRR24654535 SRR24654536 SRR24654537 SRR24654538 SRR24654539 SRR24654540 SRR24654541 SRR24654542 SRR24654543 SRR24654544 SRR24654545 SRR24654546 SRR24654547 SRR24654548 SRR24654549 SRR24654550 SRR24654551 SRR24654552 SRR24654553 SRR24654554 SRR24654555 SRR24654556 SRR24654557 SRR24654558 SRR24654559 SRR24654560 SRR24654561 SRR24654562 SRR24654563 SRR24654564 SRR24654565 SRR24654566 SRR24654567 SRR24654568 SRR24654569 SRR24654570 SRR24654571 SRR24654572 SRR24654573 SRR24654574 SRR24654575 SRR24654576 SRR24654577 SRR24654578 SRR24654579 SRR24654580 SRR24654581 SRR24654582 SRR24654583 SRR24654584 SRR24654585 SRR24654586 SRR24654587 SRR24654588 SRR24654589 SRR24654590 SRR24654591 SRR24654592 SRR24654593 SRR24654594 SRR24654595 SRR24654596 SRR24654597 SRR24654598 SRR24654599 SRR24654600 SRR24654601 SRR24654602 SRR24654603 SRR24654604 SRR24654605 SRR24654606 SRR24654607 SRR24654608 SRR24654609 SRR24654610 SRR24654611 SRR24654612 SRR24654613 SRR24654614 SRR24654615 SRR24654616 SRR24654617 SRR24654618 SRR24654619 SRR24654620 SRR24654621 SRR24654622 SRR24654623 SRR24654624 SRR24654625 SRR24654626 SRR24654627 SRR24654628 SRR24654629 SRR24654630 SRR24654631 SRR24654632 SRR24654633 SRR24654634 SRR24654635 SRR24654636 SRR24654637 SRR24654638 SRR24654639 SRR24654640 SRR24654641 SRR24654642 SRR24654643 SRR24654644 SRR24654645 SRR24654646 SRR24654647 SRR24654648 SRR24654649 SRR24654650 SRR24654651 SRR24654652 SRR24654653 SRR24654654 SRR24654655 SRR24654656 SRR24654657 SRR24654658 SRR24654659 SRR24654660 SRR24654661 SRR24654662 SRR24654663 SRR24654664 SRR24654665 SRR24654666 SRR24654667 SRR24654668 SRR24654669 SRR24654670 SRR24654671 SRR24654672 SRR24654673 SRR24654674 SRR24654675 SRR24654676 SRR24654677 SRR24654678 SRR24654679 SRR24654680 SRR24654681 SRR24654682 SRR24654683 SRR24654684 SRR24654685 SRR24654686 SRR24654687 SRR24654688 SRR24654689 SRR24654690 SRR24654691 SRR24654692 SRR24654693 SRR24654694 SRR24654695 SRR24654696 SRR24654697 SRR24654698 SRR24654699 SRR24654700 SRR24654701 SRR24654702 SRR24654703 SRR24654704 SRR24654705 SRR24654706 SRR24654707 SRR24654708 SRR24654709 SRR24654710 SRR24654711 SRR24654712 SRR24654713 SRR24654714 SRR24654715 SRR24654716 SRR24654717 SRR24654718 SRR24654719 SRR24654720 SRR24654721 SRR24654722 SRR24654723 SRR24654724 SRR24654725 SRR24654726 SRR24654727 SRR24654728 SRR24654729 SRR24654730 SRR24654731 SRR24654732 SRR24654733 SRR24654734 SRR24654735 SRR24654736 SRR24654737 SRR24654738 SRR24654739 SRR24654740 SRR24654741 SRR24654742 SRR24654743 SRR24654744 SRR24654745 SRR24654746 SRR24654747 SRR24654748 SRR24654749 SRR24654750 SRR24654751 SRR24654752 SRR24654753 SRR24654754 SRR24654755 SRR24654756 SRR24654757 SRR24654758 SRR24654759 SRR24654760 SRR24654761 SRR24654762 SRR24654763 SRR24654764 SRR24654765 SRR24654766 SRR24654767 SRR24654768 SRR24654769 SRR24654770 SRR24654771 SRR24654772 SRR24654773 SRR24654774 SRR24655708 SRR24655709 SRR24655710 SRR24655711 SRR24655712 SRR24655713 SRR24655714 SRR24655715 SRR24655716 SRR24655717 SRR24655718 SRR24655719 SRR24655720 SRR24655721 SRR24655722 SRR24655723 SRR24655724 SRR24655725 SRR24655726 SRR24655727 SRR24655728 SRR24655729 SRR24655730 SRR24655731 SRR24655732 SRR24655733 SRR24655734 SRR24655735 SRR24655736 SRR24655737 SRR24655738 SRR24655739 SRR24655740 SRR24655741 SRR24655742 SRR24655743 SRR24655744 SRR24655745 SRR24655746 SRR24655747 SRR24655748 SRR24655749 SRR24655750 SRR24655751 SRR24655752 SRR24655753 SRR24655754 SRR24655755 SRR24655756 SRR24655757 SRR24655758 SRR24655759 SRR24655760 SRR24655761 SRR24655762 SRR24655763 SRR24655764 SRR24655765 SRR24655766 SRR24655767 SRR24655768 SRR24655769 SRR24655770 SRR24655771 SRR24655772 SRR24655773 SRR24655774 SRR24655775 SRR24655776 SRR24655777 SRR24655778 SRR24655779 SRR24655780 SRR24655781 SRR24655782 SRR24655783 SRR24655784 SRR24655785 SRR24655786 SRR24655787 SRR24655788 SRR24655789 SRR24655790 SRR24655791 SRR24655792 SRR24655793 SRR24655794 SRR24655795 SRR24655796 SRR24655797 SRR24655798 SRR24655799 SRR24655800 SRR24655801 SRR24655802 SRR24655803 SRR24655804 SRR24655805 SRR24655806 SRR24655807 SRR24655808 SRR24655809 SRR24655810 SRR24655811 SRR24655812 SRR24655813 SRR24655814 SRR24655815 SRR24655816 SRR24655817 SRR24655818 SRR24655819 SRR24655820 SRR24655821 SRR24655822 SRR24655823 SRR24655824 SRR24655825 SRR24655826 SRR24655827 SRR24655828 SRR24655829 SRR24655830 SRR24655831 SRR24655832 SRR24655833 SRR24655834 SRR24655835 SRR24655836 SRR24655837 SRR24655838 SRR24655839 SRR24655840 SRR24655841 SRR24655842 SRR24655843 SRR24655844 SRR24655845 SRR24655846 SRR24655847 SRR24655848 SRR24655849 SRR24655850 SRR24655851 SRR24655852 SRR24655853 SRR24655854 SRR24655855 SRR24655856 SRR24655857 SRR24655858 SRR24655859 SRR24655860 SRR24655861 SRR24655862 SRR24655863 SRR24655864 SRR24655865 SRR24655866 SRR24655867 SRR24655868 SRR24655869 SRR24655870 SRR24655871 SRR24655872 SRR24655873 SRR24655874 SRR24655875 SRR24655876 SRR24655877 SRR24655878 SRR24655879 SRR24655880 SRR24655881 SRR24655882 SRR24655883 SRR24655884 SRR24655885 SRR24655886 SRR24655887 SRR24655888 SRR24655889 SRR24655890 SRR24655891 SRR24655892 SRR24655893 SRR24655894 SRR24655895 SRR24655896 SRR24655897 SRR24655898 SRR24655899 SRR24655900 SRR24655901 SRR24655902 SRR24655903 SRR24655904 SRR24655905 SRR24655906 SRR24655907 SRR24655908 SRR24655909 SRR24655910 SRR24655911 SRR24655912 SRR24655913 SRR24655914 SRR24655915 SRR24655916 SRR24655917 SRR24655918 SRR24655919 SRR24655920 SRR24655921 SRR24655922 SRR24655923 SRR24655924 SRR24655925 SRR24655926 SRR24655927 SRR24655928 SRR24655929 SRR24655930 SRR24655931 SRR24655932 SRR24655933 SRR24655934 SRR24655935 SRR24655936 SRR24655937 SRR24655938 SRR24655939 SRR24655940 SRR24655941 SRR24655942 SRR24655943 SRR24655944 SRR24655945 SRR24655946 SRR24655947 SRR24655948 SRR24655949 SRR24655950 SRR24655951 SRR24655952 SRR24655953 SRR24655954 SRR24655955 SRR24655956 SRR24655957 SRR24655958 SRR24655959 SRR24655960 SRR24655961 SRR24655962 SRR24655963 SRR24655964 SRR24655965 SRR24655966 SRR24655967 SRR24655968 SRR24655969 SRR24655970 SRR24655971 SRR24655972 SRR24655973 SRR24655974 SRR24655975 SRR24655976 SRR24655977 SRR24655978 SRR24655979 SRR24655980 SRR24655981 SRR24655982 SRR24655983 SRR24655984 SRR24655985 SRR24655986 SRR24655987 SRR24655988 SRR24655989 SRR24655990 SRR24655991 SRR24655992 SRR24655993 SRR24655994 SRR24655995 SRR24655996 SRR24655997 SRR24655998 SRR24655999 SRR24656000 SRR24656001 SRR24656002 SRR24656003 SRR24656004 SRR24656005 SRR24656006 SRR24656007 SRR24656008 SRR24656009 SRR24656010 SRR24656011 SRR24656012 SRR24656013 SRR24656014 SRR24656015 SRR24656016 SRR24656017 SRR24656018 SRR24656019 SRR24656020 SRR24656021 SRR24656022 SRR24656023 SRR24656024 SRR24656025 SRR24656026 SRR24656027 SRR24656028 SRR24656029 SRR24656030 SRR24656031 SRR24656032 SRR24656033 SRR24656034 SRR24656035 SRR24656036 SRR24656037 SRR24656038 SRR24656039 SRR24656040 SRR24656041 SRR24656042 SRR24656043 SRR24656044 SRR24656045 SRR24656046 SRR24656047 SRR24656048 SRR24656049 SRR24656050 SRR24656051 SRR24656052 SRR24656053 SRR24656054 SRR24656055 SRR24656056 SRR24656057 SRR24656058 SRR24656059 SRR24656060 SRR24656061 SRR24656062 SRR24656063 SRR24656064 SRR24656065 SRR24656066 SRR24656067 SRR24656068 SRR24656069 SRR24656070 SRR24656071 SRR24656072 SRR24656073 SRR24656074 SRR24656075 SRR24656076 SRR24656077 SRR24656078 SRR24656079 SRR24656080 SRR24656081 SRR24656082 SRR24656083 SRR24656084 SRR24656085 SRR24656086 SRR24656087 SRR24656088 SRR24656089 SRR24656090 SRR24656091 SRR24656092 SRR24656093 SRR24656094 SRR24656095 SRR24656096 SRR24656097 SRR24656098 SRR24656099 SRR24656100 SRR24656101 SRR24656102 SRR24656103 SRR24656104 SRR24656105 SRR24656106 SRR24656107 SRR24656108 SRR24656109 SRR24656110 SRR24656111 SRR24656112 SRR24656113 SRR24656114 SRR24656115 SRR24656116 SRR24656117 SRR24656118 SRR24656119 SRR24656120 SRR24656121 SRR24656122 SRR24656123 SRR24656124 SRR24656125 SRR24656126 SRR24656127 SRR24656128 SRR24656129 SRR24656130 SRR24656131 SRR24656132 SRR24656133 SRR24656134 SRR24656135 SRR24656136 SRR24656137 SRR24656138 SRR24656139 SRR24656140 SRR24656141 SRR24656142 SRR24656143 SRR24656144 SRR24656145 SRR24656146 SRR24656147 SRR24656148 SRR24656149 SRR24656150 SRR24656151 SRR24656152 SRR24656153 SRR24656154 SRR24656155 SRR24656156 SRR24656157 SRR24656158 SRR24656159 SRR24656160 SRR24656161 SRR24656162 SRR24656163 SRR24656164 SRR24656165 SRR24656166 SRR24656167 SRR24656168 SRR24656169 SRR24656170 SRR24656171 SRR24656172 SRR24656173 SRR24656174 SRR24656175 SRR24656176 SRR24656177 SRR24656178 SRR24656179 SRR24656180 SRR24656181 SRR24656182 SRR24656183 SRR24656184 SRR24656185 SRR24656186 SRR24656187 SRR24656188 SRR24656189 SRR24656190 SRR24656191 SRR24656192 SRR24656193 SRR24656194 SRR24656195 SRR24656196 SRR24656197 SRR24656198 SRR24656199 SRR24656200 SRR24656201 SRR24656202 SRR24656203 SRR24656204 SRR24656205 SRR24656206 SRR24656207 SRR24656208 SRR24656209 SRR24656210 SRR24656211 SRR24656212 SRR24656213 SRR24656214 SRR24656215 SRR24656216 SRR24656217 SRR24656218 SRR24656219 SRR24656220 SRR24656221 SRR24656222 SRR24656223 SRR24656224 SRR24656225 SRR24656226 SRR24656227 SRR24656228 SRR24656229 SRR24656230 SRR24656231 SRR24656232 SRR24656233 SRR24656234 SRR24656235 SRR24656236 SRR24656237 SRR24656238 SRR24656239 SRR24656240 SRR24656241 SRR24656242 SRR24656243 SRR24656244 SRR24656245 SRR24656246 SRR24656247 SRR24656248 SRR24656249 SRR24656250 SRR24656251 SRR24656252 SRR24656253 SRR24656254 SRR24656255 SRR24656256 SRR24656257 SRR24656258 SRR24656259 SRR24656260 SRR24656261 SRR24656262 SRR24656263 SRR24656264 SRR24656265 SRR24656266 SRR24656267 SRR24656268 SRR24656269 SRR24656270 SRR24656271 SRR24656272 SRR24656273 SRR24656274 SRR24656275 SRR24656276 SRR24656277 SRR24656278 SRR24656279 SRR24656280 SRR24656281 SRR24656282 SRR24656283 SRR24656284 SRR24656285 SRR24656286 SRR24656287 SRR24656288 SRR24656289 SRR24656290 SRR24656291 SRR24656292 SRR24656293 SRR24656294 SRR24656295 SRR24656296 SRR24656297 SRR24656298 SRR24656299 SRR24656300 SRR24656301 SRR24656302 SRR24656303 SRR24656304 SRR24656305 SRR24656306 SRR24656307 SRR24656308 SRR24656309 SRR24656310 SRR24656311 SRR24656312 SRR24656313 SRR24656314 SRR24656315 SRR24656316 SRR24656317 SRR24656318 SRR24656319 SRR24656320 SRR24656321 SRR24656322 SRR24656323 SRR24656324 SRR24656325 SRR24656326 SRR24656327 SRR24656328 SRR24656329 SRR24656330 SRR24656331 SRR24656332 SRR24656333 SRR24656334 SRR24656335 SRR24656336 SRR24656337 SRR24656338 SRR24656339 SRR24656340 SRR24656341 SRR24656342 SRR24656343 SRR24656344 SRR24656345 SRR24656346 SRR24656347 SRR24656348 SRR24656349 SRR24656350 SRR24656351 SRR24656352 SRR24656353 SRR24656354 SRR24656355 SRR24656356 SRR24656357 SRR24656358 SRR24656359 SRR24656360 SRR24656361 SRR24656362 SRR24656363 SRR24656364 SRR24656365 SRR24656366 SRR24656367 SRR24656368 SRR24656369 SRR24656370 SRR24656371 SRR24656372 SRR24656373 SRR24656374 SRR24656375 SRR24656376 SRR24656377 SRR24656378 SRR24656379 SRR24656380 SRR24656381 SRR24656382 SRR24656383 SRR24656384 SRR24656385 SRR24656386 SRR24656387 SRR24656388 SRR24656389 SRR24656390 SRR24656391 SRR24656392 SRR24656393 SRR24656394 SRR24656395 SRR24656396 SRR24656397 SRR24656398 SRR24656399 SRR24656400 SRR24656401 SRR24656402 SRR24656403 SRR24656404 SRR24656405 SRR24656406 SRR24656407 SRR24656408 SRR24656409 SRR24656410 SRR24656411 SRR24656412 SRR24656413 SRR24656414 SRR24656415 SRR24656416 SRR24656417 SRR24656418 SRR24656419 SRR24656420 SRR24656421 SRR24656422 SRR24656423 SRR24656424 SRR24656425 SRR24656426 SRR24656427 SRR24656428 SRR24656429 SRR24656430 SRR24656431 SRR24656432 SRR24656433 SRR24656434 SRR24656435 SRR24656436 SRR24656437 SRR24656438 SRR24656439 SRR24656440 SRR24656441 SRR24656442 SRR24656443 SRR24656444 SRR24656445 SRR24656446 SRR24656447 SRR24656448 SRR24656449 SRR24656450 SRR24656451 SRR24656452 SRR24656453 SRR24656454 SRR24656455 SRR24656456 SRR24656457 SRR24656458 SRR24656459 SRR24656460 SRR24656461 SRR24656462 SRR24656463 SRR24656464 SRR24656465 SRR24656466 SRR24656467 SRR24656468 SRR24656469 SRR24656470 SRR24656471 SRR24656472 SRR24656473 SRR24656474 SRR24656475 SRR24656476 SRR24656477 SRR24656478 SRR24656479 SRR24656480 SRR24656481 SRR24656482 SRR24656483 SRR24656484 SRR24656485 SRR24656486 SRR24656487 SRR24656488 SRR24656489 SRR24656490 SRR24656491 SRR24656492 SRR24656493 SRR24656494 SRR24656495 SRR24656496 SRR24656497 SRR24656498 SRR24656499 SRR24656500 SRR24656501 SRR24656502 SRR24656503 SRR24656504 SRR24656505 SP1 Bacteria;Fusobacteria;Fusobacteriia;Fusobacteriales;Leptotrichiaceae;Leptotrichia;sp. HMT498 0 0 0 0 0 0 0 3 2 10 0 11 0 0 29 0 17 0 0 0 0 0 0 0 0 0 0 0 159 7 0 0 0 0 0 0 0 0 0 0 0 0 0 0 0 0 0 0 4 0 0 1 0 18 0 0 14 0 0 0 0 0 0 0 0 0 10 1 293 0 0 7 0 2 0 0 0 0 1 4 0 0 1 2 0 0 0 3 0 2 1 0 57 0 0 0 0 0 0 1 2 51 0 0 0 0 0 0 0 0 0 7 10 0 0 0 0 0 0 0 0 1 0 0 0 0 1 0 1 0 0 3 0 0 0 0 0 9 0 0 0 0 0 0 0 1 11 7 0 0 0 0 11 0 0 0 0 0 0 0 0 0 0 9 0 0 0 0 0 0 0 0 0 0 0 0 0 0 0 0 0 0 0 1 0 0 0 0 0 0 0 0 1 0 2 0 0 0 0 0 2 0 1 0 0 0 0 0 1 0 0 0 0 1 0 0 0 0 0 0 1 5 0 0 0 0 0 0 0 24 0 0 0 0 0 0 1 2 0 28 0 0 0 0 0 1 0 0 0 0 0 0 0 20 0 0 0 0 0 0 4 0 0 0 0 0 0 0 0 0 1 0 0 0 0 0 67 0 46 0 150 568 0 0 27 0 0 0 0 0 3 0 0 0 0 1 5 1984 0 37 70 0 398 312 19 0 283 1 0 0 0 0 0 0 1 6 0 0 5 0 0 2 14 0 0 0 4 0 0 0 0 31 0 0 0 0 0 0 0 0 0 0 0 0 0 0 0 0 0 0 0 0 0 0 0 0 0 0 0 0 0 0 0 0 0 0 0 0 0 0 0 0 0 0 0 0 0 0 0 0 0 0 0 0 0 0 0 0 0 0 0 0 0 0 0 0 0 0 0 0 0 0 0 0 10 0 0 0 0 0 0 602 0 0 0 0 0 0 5 0 0 0 0 0 0 0 0 0 0 0 0 0 71 2 0 0 0 0 0 0 99 0 0 0 0 0 0 0 59 27 0 0 123 0 0 0 0 0 0 1 0 0 0 0 0 29 0 462 0 0 0 0 1 0 0 0 0 0 0 0 0 0 0 0 0 0 0 0 0 139 746 0 0 0 7 0 0 0 0 107 54 0 0 0 0 0 1 0 0 35 12 4 0 0 0 0 0 5 0 0 0 65 0 0 0 0 1 0 0 68 0 0 0 0 0 0 0 1 0 0 0 121 0 0 0 0 329 387 0 0 23 7 0 0 1 0 0 0 0 459 0 1389 0 2074 828 837 0 0 0 0 0 0 0 0 0 0 0 0 0 0 0 0 0 0 0 0 0 0 0 0 0 0 0 0 0 209 0 0 0 0 0 0 0 0 0 0 0 0 0 0 0 0 0 0 0 0 0 0 0 0 0 0 0 0 0 0 0 0 0 0 0 0 0 0 0 0 0 0 3 0 0 0 0 0 0 0 0 0 0 27 0 0 0 0 0 47 433 0 0 0 1 0 1 422 0 0 47 0 1 0 0 0 0 0 0 0 0 0 0 0 0 0 0 0 0 0 0 0 0 0 0 0 0 0 0 8 0 0 0 0 22 0 0 351 0 0 59 0 0 0 0 0 202 411 0 0 0 0 0 699 0 0 7 0 0 260 0 0 33 1 96 0 0 21 0 21 2 5 576 14 0 1191 163 0 0 0 0 0 0 0 0 0 0 0 0 0 0 0 0 0 0 0 0 0 0 0 0 0 0 1659 0 0 247 0 0 0 2 0 0 0 0 0 1 0 82 0 2 0 0 1 0 0 0 0 0 0 14 0 0 0 0 0 0 0 0 0 0 0 0 0 0 0 0 0 0 0 0 0 0 1 0 0 2 0 0 0 0 0 0 0 0 0 0 0 0 0 0 0 0 0 0 0 5 0 0 0 0 0 8 0 0 1 0 0 0 0 0 0 0 0 0 0 0 0 0 0 0 0 0 0 0 0 0 0 2644 0 0 32 0 0 7 18 0 362 0 0 0 1 7 0 0 0 0 0 0 0 0 0 0 0 0 0 0 0 0 0 0 0 0 0 0 0 0 0 0 0 0 7 218 0 0 0 0 0 0 2 0 27 0 0 0 0 643 0 0 0 0 0 16 0 20 0 0 0 0 12 181 0 193 0 33 0 909 146 0 1 6 1 0 0 0 0 0 0 0 0 0 0 0 0 0 0 0 476 0 0 126 152 0 0 0 0 0 0 0 44 0 950 0 0 0 0 10 1 0 0 2 1 0 0 0 0 0 0 1 286 0 0 0 0 0 0 0 0 0 0 2 0 0 0 0 0 0 0 29 0 53 4 1223 0 0 48 0 14 163 0 0 0 79 0 0 0 0 0 0 0 0 0 0 0 0 0 0 0 0 0 0 0 0 0 1 1 0 0 49 651 0 0 1 0 1 6 0 1 0 125 0 0 0 0 0 0 0 0 0 0 0 0 54 65 1 245 0 0 0 0 0 0 0 0 0 0 0 0 0 0 0 0 0 0 0 0 0 0 0 0 0 0 0 0 0 0 0 1 0 0 0 0 0 0 0 0 0 0 0 0 0 0 0 0 0 0 0 1 0 0 0 0 0 0 188 0 0 1 0 0 0 0 0 0 0 0 0 0 0 0 0 0 1 0 0 7 106 0 0 0 0 0 3 0 0 76 0 0 26 0 0 0 0 17 0 0 75 0 19 0 0 0 0 48 2 0 12 0 0 0 0 62 20 0 9 1 0 10 2 0 1 4 12 0 0 4 1 0 23 0 0 0 0 56 0 17 76 0 0 29 0 0 0 0 0 0 0 0 0 0 0 0 0 0 0 1 0 0 0 0 113 29 0 3 0 0 0 0 1 0 9 67 0 0 0 0 0 0 0 0 0 0 0 0 0 0 0 0 15 0 0 0 0 0 1 4 0 387 0 1 143 0 0 0 11 0 0 0 0 0 0 0 0 0 0 0 0 9 6 0 0 0 0 0 0 0 0 0 0 0 0 0 0 0 1 0 609 20 7 2 0 0 0 0 0 0 269 0 0 0 0 0 0 0 0 0 0 0 0 0 0 0 0 0 0 0 0 0 0 0 0 0 8 0 0 0 0 0 0 1 0 0 0 0 0 0 0 0 0 0 0 0 0 0 0 0 0 0 0 0 29 0 0 0 1 1 0 39 0 0 0 0 0 0 0 0 0 0 0 0 0 0 0 0 0 0 0 0 0 0 0 0 0 0 0 1 1 0 0 10 0 0 0 0 125 3 0 0 3 0 0 0 69 0 0 327 0 0 0 0 0 0 394 0 0 0 1 0 0 73 4 0 0 1 0 0 0 1 0 0 0 0 0 0 0 1 4 0 0 0 0 0 0 0 0 0 0 0 0 3 0 0 0 0 0 0 0 0 0 238 0 0 0 0 0 0 0 0 0 55 7 0 0 0 0 0 3 50 0 61 0 0 0 19 5 0 0 0 0 0 0 0 0 0 0 0 0 0 0 3 0 0 0 0 0 0 0 0 0 0 0 0 3 0 34 0 0 0 130 0 0 0 98 0 0 0 0 0 0 0 22 3062 0 0 1 0 0 0 0 0 1 42 28 0 0 0 0 1 26 0 61 20 0 0 16 35 0 0 0 0 0 0 0 0 349 0 0 3 0 0 0 0 9 0 0 0 0 0 0 0 0 0 1 0 0 0 0 56 0 0 0 0 0 0 0 0 0 0 0 1 0 0 0 0 4 0 0 0 0 0 0 0 0 0 0 2 0 0 13 0 0 71 0 0 0 0 0 0 0 0 0 19 0 0 0 0 0 0 0 0 14 0 0 0 0 0 0 0 0 0 0 14 1 0 1 1 0 0 0 0 0 0 0 0 1 18 0 95 9 2 0 0 0 0 123 0 0 0 0 0 0 0 46 0 1 679 30 0 9 0 7 0 113 39 0 110 0 0 0 0 0 0 0 0 0 0 0 0 8 0 0 0 61 0 0 0 0 158 85 0 0 0 0 0 0 0 12 0 765 0 0 0 0 0 0 0 0 0 0 0 0 0 0 0 204 0 0 0 0 0 2 1 0 0 0 0 0 0 0 0 0 0 0 2 0 0 0 0 0 0 0 0 0 0 0 1 2 0 SP10 Bacteria;Proteobacteria;Betaproteobacteria;Neisseriales;Neisseriaceae;Neisseria;flavescens 3 44 60 11 0 2651 14 27 31 209 4 4678 3004 48 33 169 132 264 6843 9225 85 0 332 0 341 3 287 114 760 377 6 12 534 12700 261 282 1 32 1565 322 435 293 388 123 1967 13634 5497 1 0 1000 133 1 2 91 5972 110 16 1306 223 2086 394 941 2961 430 11787 208 8 594 1117 7286 67 288 12251 0 0 9810 1265 411 264 21 16139 111 0 385 6476 6 247 448 1 6 673 0 415 42 45 469 1 1201 81 396 0 1892 1558 518 21 602 1931 4 545 0 2 148 23 666 106 1573 1317 58 462 18566 312 7483 7499 706 3901 383 351 22 585 0 7875 18 0 230 1658 3221 1562 163 34 4588 5 583 256 3111 127 35 702 6943 2827 4487 95 9402 472 8 15 32 1685 3 17523 761 3500 4257 2017 28 244 5 770 6137 459 3 17 233 574 4818 22 1 297 236 544 1743 505 578 91 138 46 4715 820 3058 5737 8352 4056 344 6940 525 76 5 3194 1225 932 3371 0 192 2442 17131 23291 0 1 5 66 5 5297 6181 7129 37 2871 6784 4792 14 2 3014 17 3177 92 6019 3611 9574 11622 1980 1 17 811 1106 69 655 59 10895 6879 1738 5239 29673 2513 5299 838 257 40 29 2495 3951 15854 28 258 5233 253 168 153 236 1488 3 24 110 78 369 114 1150 92 7 2559 0 0 0 0 0 0 0 0 0 0 0 0 0 0 0 0 0 0 0 0 0 0 0 0 0 0 0 0 0 0 0 0 0 0 0 0 0 0 0 0 0 0 0 0 0 0 0 0 0 0 0 0 0 0 0 0 0 0 0 0 0 0 0 0 0 0 0 0 0 0 0 0 0 0 0 0 0 0 0 0 0 0 0 0 0 0 0 0 0 0 0 0 0 0 0 0 0 0 0 0 0 0 0 0 0 0 0 0 0 0 0 0 0 0 0 0 0 0 0 0 0 0 0 0 0 0 0 0 0 0 0 0 0 0 0 0 0 0 0 0 0 0 0 0 0 0 0 0 0 0 0 0 0 0 0 0 0 0 0 0 0 0 0 0 0 0 0 0 0 0 0 0 0 0 0 0 0 0 0 0 0 0 0 0 0 0 0 0 0 0 0 0 0 0 0 0 0 0 0 0 0 0 0 0 0 0 0 0 0 0 0 0 0 0 0 0 0 0 0 0 0 0 0 0 0 0 0 0 0 0 0 0 0 0 0 0 0 0 0 0 0 0 0 0 0 0 0 0 0 0 0 0 0 0 0 0 0 0 0 0 0 0 0 0 0 0 0 0 0 0 0 0 0 0 0 0 0 0 0 0 0 0 0 0 0 0 0 0 0 0 0 0 0 0 0 0 0 0 0 0 0 0 0 0 0 0 0 0 0 0 0 0 0 0 0 0 0 0 0 0 0 0 0 0 0 0 0 0 0 0 0 0 0 0 0 0 0 0 0 0 0 0 0 0 0 0 0 0 0 0 0 0 0 0 0 0 0 0 0 0 0 0 0 0 0 0 0 0 0 0 0 0 0 0 0 0 0 0 0 0 0 0 0 0 0 0 0 0 0 0 0 0 0 0 0 0 0 0 0 0 0 0 0 0 0 0 0 0 0 0 0 0 0 0 0 0 0 0 0 0 0 0 0 0 0 0 0 0 0 0 0 0 0 0 0 0 0 0 0 0 0 0 0 0 0 0 0 0 0 0 0 0 0 0 0 0 0 0 0 0 0 0 0 0 0 0 0 0 0 0 0 0 0 0 0 0 0 0 0 0 0 0 0 0 0 0 0 0 0 0 0 0 0 0 0 0 0 0 0 0 0 0 0 0 0 0 0 0 0 0 0 0 0 0 0 0 0 0 0 0 0 0 0 0 0 0 0 0 0 0 0 0 0 0 0 0 0 0 0 0 0 0 0 0 0 0 0 0 0 0 0 0 0 0 0 0 0 0 0 0 0 0 0 0 0 0 0 0 0 0 0 0 0 0 0 0 0 0 0 0 0 0 0 0 0 0 0 0 0 0 0 0 0 0 0 0 0 0 0 0 0 0 0 0 0 0 0 0 0 0 0 0 0 0 0 0 0 0 0 0 0 0 0 0 0 0 0 0 0 0 0 0 0 0 0 0 0 0 0 0 0 0 0 0 0 0 0 0 0 0 0 0 0 0 0 0 0 0 0 0 0 0 0 0 0 0 0 0 0 0 0 0 0 0 0 0 0 0 0 0 0 0 0 0 0 0 0 0 0 0 0 0 0 0 0 0 0 0 0 0 0 0 0 0 0 0 0 0 0 0 0 0 0 0 0 0 0 0 0 0 0 0 0 0 0 0 0 0 0 0 0 0 0 0 0 0 0 0 0 0 0 0 0 0 0 0 0 0 0 0 0 0 0 0 0 0 0 0 0 0 0 0 0 0 0 0 0 0 0 0 0 0 0 0 0 0 0 0 0 0 0 0 0 0 0 0 0 0 0 0 0 0 0 0 0 0 0 0 0 0 0 0 0 0 0 0 0 0 0 0 0 0 0 0 0 0 0 0 0 0 0 0 0 0 0 0 0 0 0 0 0 0 0 0 0 0 0 0 0 0 0 0 0 0 0 0 0 0 0 0 0 0 0 0 0 0 0 0 0 0 0 0 0 0 0 0 0 0 0 0 0 0 0 0 0 0 0 0 0 0 0 0 0 0 0 0 0 0 0 0 0 0 0 0 0 0 0 0 0 0 0 0 0 0 0 0 0 0 0 0 0 0 0 0 0 0 0 0 0 0 0 0 0 0 0 0 0 0 0 0 0 0 0 0 0 0 0 0 0 0 0 0 0 0 0 0 0 0 0 0 0 0 0 0 0 0 0 0 0 0 0 0 0 0 0 0 0 0 0 0 0 0 0 0 0 0 0 0 0 0 0 0 0 0 0 0 0 0 0 0 0 0 0 0 0 0 0 0 0 0 0 0 0 0 0 0 0 0 0 0 0 0 0 0 0 0 0 0 0 0 0 0 0 0 0 0 0 0 0 0 0 0 0 0 0 0 0 0 0 0 0 0 0 0 0 0 0 0 0 0 0 0 0 0 0 0 0 0 0 0 0 0 0 0 0 0 0 0 0 0 0 0 0 0 0 0 0 0 0 0 0 0 0 0 0 0 0 0 0 0 0 0 0 0 0 0 0 0 0 0 0 0 0 0 0 0 0 0 0 0 0 0 0 0 0 0 0 0 0 0 0 0 0 0 0 0 0 0 0 0 0 0 0 0 0 0 0 0 0 0 0 0 0 0 0 0 0 0 0 0 0 0 0 0 0 0 0 0 0 0 0 0 0 0 0 0 0 0 0 0 0 0 0 0 0 0 0 0 0 0 0 0 0 0 0 0 0 0 0 0 0 0 0 0 0 0 0 0 0 0 0 0 0 0 0 0 0 0 0 0 0 0 0 0 0 0 0 0 0 0 0 0 0 0 0 0 0 0 0 0 0 0 0 0 0 0 0 0 0 0 0 0 0 0 0 0 0 0 0 0 0 0 0 0 0 0 0 0 0 0 0 0 0 0 0 0 0 0 0 0 0 0 0 0 0 0 0 0 0 0 0 0 0 0 0 0 0 0 0 0 0 0 0 0 0 0 0 0 0 0 0 0 0 0 0 0 0 0 0 0 0 0 0 0 0 0 0 0 0 0 0 0 0 0 0 0 0 0 0 0 0 0 0 0 0 0 0 0 0 0 0 0 0 0 0 0 0 0 0 0 0 0 0 0 0 0 0 0 0 0 0 0 0 0 0 0 0 0 0 0 0 0 0 0 0 0 0 0 0 0 0 0 0 0 0 0 0 0 0 0 0 0 0 0 0 0 0 0 0 0 0 0 0 0 0 0 0 0 0 0 0 0 0 0 0 0 0 0 0 0 0 0 0 0 0 0 0 0 0 0 0 0 0 0 0 0 0 0 0 0 0 0 0 0 0 0 0 0 0 0 0 0 0 0 0 0 0 0 0 0 0 0 0 0 0 0 0 0 0 0 0 0 0 0 0 0 0 0 0 0 0 0 0 0 0 0 0 0 0 0 0 0 0 0 0 0 0 0 0 0 0 0 0 0 0 0 0 0 0 0 0 0 0 0 0 0 0 0 0 0 0 0 0 0 0 0 0 0 0 0 0 0 0 0 0 0 0 0 0 0 0 0 0 0 0 0 0 0 0 0 0 0 0 0 0 0 0 SP101 Bacteria;Bacteroidetes;Bacteroidia;Bacteroidales;Prevotellaceae;Alloprevotella;sp. HMT308 0 18 2 0 2 16 0 0 0 0 106 4 3 0 0 47 0 1 79 394 33 0 1 10 5 0 3 1 0 0 0 3 0 1274 420 6 75 0 0 0 535 11 8 253 2 7 2 0 24 0 123 7 208 0 292 0 87 46 3 163 0 0 5 6 0 0 0 8472 38 0 41 46 1 0 1 0 3 42 0 8 100 8 0 5 354 1 0 37 2 4501 0 27 1 0 10 0 0 2 2 36 0 2 4 0 0 5 51 2 0 3 0 0 263 308 547 1 422 753 1524 1 8 1448 4 86 329 29 73 2 416 0 0 0 0 8 191 3 2226 84 2 0 6 0 4 0 0 136 2081 750 183 0 401 0 52 11 28 1 1158 25 63 1 1 0 7 0 0 1 0 39 1 3 0 1 0 0 7 2 7 12 16 0 0 0 0 840 146 0 53 202 0 449 58 0 62 0 108 27 273 321 26 3 0 59 745 250 12 246 0 0 0 0 362 0 31 1 2 42 0 18 0 0 8 283 8 4 839 86 469 6 4 877 2 0 6 0 0 3 272 150 198 0 0 147 1688 0 2 91 62 0 1098 1 10 0 0 28 0 0 4 1 3 87 6 122 0 186 809 0 13 16 0 0 0 0 0 0 0 0 0 0 2 0 7 1 18 0 6 1 0 20 0 12 2 0 1 7 0 8 0 0 0 11 4 3 6 2 2 0 4 1 0 0 0 0 0 0 0 0 0 2 0 0 0 0 10 0 0 0 2 0 0 0 0 0 0 0 0 0 0 1 0 0 0 1 0 0 0 0 17 0 0 0 24 0 0 0 0 1 0 0 8 0 0 0 0 0 0 0 0 0 0 0 4 0 0 0 0 0 0 2 2 0 0 0 0 1 1 0 0 0 0 9 0 0 0 0 1 1 0 0 0 1 2 0 0 0 0 0 0 2 0 0 7 0 2 1 2 0 0 0 14 0 0 0 2 0 1 0 17 0 1 0 0 0 4 0 0 0 0 23 11 0 1 1 10 0 0 4 0 22 1 0 2 0 2 0 0 0 0 1 5 0 5 0 0 0 0 0 0 1 0 0 2 1 0 0 0 0 11 6 0 0 0 0 6 0 5 40 0 0 0 3 0 0 1 1 0 0 0 0 11 0 25 8 0 0 0 0 0 0 0 0 4 22 1 2 0 0 1 0 0 0 0 0 0 0 0 0 0 0 0 0 0 0 0 0 0 0 0 0 2 1 0 0 0 8 0 0 3 22 0 0 10 2 0 0 0 0 0 0 0 7 0 3 20 7 8 3 0 3 1 0 24 0 0 2 0 0 0 0 0 0 0 0 0 0 0 0 0 0 0 0 9 0 2 21 0 0 4 0 0 0 0 0 0 0 0 0 0 1 0 1 0 0 0 0 1 2 0 0 14 0 0 0 0 0 0 0 7 0 0 1 0 0 0 0 0 0 5 0 0 0 0 0 0 3 0 1 0 2 1 0 1 2 0 1 1 4 6 1 0 1 0 0 0 0 0 0 0 0 0 2 0 0 0 1 2 0 0 0 1 0 1 1 0 0 0 0 0 0 0 0 0 1 4 2 48 0 0 0 0 1 0 0 0 1 0 1 1 0 2 0 2 0 0 1 0 0 0 0 0 0 0 0 1 0 0 1 0 4 0 0 0 5 0 4 0 0 9 0 9 0 0 0 5 0 0 0 0 0 3 1 41 0 3 0 0 1 1 0 0 0 0 1 0 0 1 0 0 0 0 11 0 0 0 0 0 1 1 0 1 3 0 0 0 0 0 2 0 0 0 0 1 0 0 1 13 0 0 0 7 2 0 4 0 0 7 0 0 0 1 0 0 0 0 0 0 0 0 0 0 0 1 0 0 1 0 0 0 1 0 0 0 0 0 0 1 1 0 4 0 0 0 0 0 0 1 0 0 0 0 0 2 2 0 1 0 4 0 0 0 0 0 0 0 7 1 0 3 0 0 0 4 11 0 0 1 0 0 1 0 19 0 8 3 0 0 13 0 0 0 0 5 3 0 0 0 4 0 0 1 0 0 1 0 0 0 0 2 0 0 0 0 0 0 0 0 0 0 0 0 0 0 0 5 0 0 0 1 0 0 1 0 0 0 0 0 0 0 12 0 0 0 0 2 0 0 0 1 0 0 6 0 0 1 0 0 4 1 3 1 0 5 0 5 5 0 0 3 0 0 4 0 1 2 19 0 0 24 3 0 1 0 0 9 3 0 0 0 0 0 0 0 2 0 0 0 1 4 0 0 3 0 0 0 0 3 0 0 0 5 0 0 0 0 2 1 0 0 0 3 3 0 0 0 1 0 0 5 0 0 13 23 114 10 12 15 150 5 0 5 0 2 1 22 7 0 0 54 49 4 14 5 5 4 21 3 30 45 144 0 10 0 1 2 1 3 28 7 25 5 1 5 6 1 8 0 0 0 0 5 0 43 3 40 0 3 36 0 1 1 0 0 5 19 0 2 6 2 0 23 40 1 14 0 0 8 0 2 2 1 0 3 12 5 38 7 2 74 20 0 10 0 0 0 0 0 37 5 11 0 0 161 26 33 2 0 3 125 3 77 24 9 22 0 8 1 12 1 0 0 0 6 0 0 92 387 96 0 0 0 1 21 0 0 0 0 0 0 0 0 0 191 1 0 7 2 0 12 0 1 18 2 0 1 0 1 1 0 2 16 0 3 6 47 0 6 10 3 16 0 1 0 9 0 2 0 11 6 48 6 15 39 1 1 13 0 2 2 8 2 0 110 16 2 49 32 3 7 3 43 9 7 8 2 11 5 23 23 3 1 43 0 82 4 2 0 26 9 9 20 67 0 9 12 5 0 2 19 1 1 0 2 95 3 1 0 13 0 11 22 10 38 4 5 7 20 0 4 3 0 4 0 0 3 5 40 17 16 0 5 0 9 0 1 8 5 11 1 0 0 26 1 60 11 0 0 0 2 1 39 1 3 6 10 30 37 73 21 5 0 0 2 335 0 1 0 0 5 1 0 80 60 0 2 56 7 2 1 23 0 1 28 0 0 16 52 0 0 2 0 0 0 1 0 0 28 1 7 0 0 0 7 5 0 25 44 10 168 2 0 0 0 0 2 6 0 1 7 32 0 3 2 67 37 0 3 0 81 5 1 32 1 4 7 10 0 4 3 6 0 2 10 61 20 0 12 0 39 16 2 1 22 1 0 0 8 0 66 7 0 0 6 3 0 0 8 42 56 60 1 36 103 13 0 531 2 39 1 3 1 20 18 19 22 62 12 0 5 321 32 2 0 0 0 13 1 12 19 3 14 3 0 60 11 1 202 0 1 39 55 44 4 19 4 0 84 0 4 0 0 2 1 0 4 0 30 0 0 1 25 0 0 121 26 8 22 2 0 0 0 0 0 43 0 88 0 0 1 40 1 5 29 178 7 10 0 4 7 6 0 13 1 19 69 7 15 28 30 0 9 11 1 0 3 10 2 25 2 4 41 69 3 0 2 0 9 4 101 8 0 0 9 1 3 0 2 18 0 0 1 14 0 0 3 0 0 0 40 4 11 7 14 0 0 6 0 0 6 3 2 3 17 8 0 8 11 40 2 6 5 0 4 6 0 2 1 7 9 1 7 179 13 2 0 2 0 0 0 1 6 2 5 0 2 39 1 9 10 8 9 16 7 38 95 109 1 14 45 0 0 52 0 5 5 29 0 0 2 3 0 0 37 4 19 45 8 108 43 71 23 20 12 17 28 168 0 0 0 0 1 117 0 151 5 4 3 1 1 2 2 10 8 19 19 0 0 0 5 25 7 0 1 0 0 0 17 0 27 3 25 3 0 0 0 0 7 105 142 24 7 2 0 0 0 6 0 0 1 6 1 1 4 2 29 0 30 20 0 1 1 4 1 93 0 0 4 0 6 0 8 50 34 0 0 0 150 5 0 96 10 219 100 2 1 5 93 5 0 0 2 0 30 0 15 21 1 8 5 2 6 1 0 0 7 61 61 8 1 1 0 1 8 14 2 0 32 4 3 0 2 23 2 5 11 39 15 0 0 1 6 26 0 10 179 26 1 2 5 7 0 1 4 54 0 6 67 47 1 7 73 6 0 3 213 2 3 0 5 1 1 16 2 2 4 0 SP109 Bacteria;Bacteroidetes;Flavobacteriia;Flavobacteriales;Flavobacteriaceae;Bergeyella;sp. HMT931 0 12 0 0 1 0 0 0 4 12 0 20 6 0 1 0 37 6 0 0 0 0 6 7 1 1 0 0 179 36 8 1 19 1 0 4 4 61 0 89 0 12 0 23 3 0 8 0 40 3 7 0 0 0 10 1 0 6 4 2 2 26 1 99 2 12 118 2 75 6 10 10 11 2 3 1 5 0 8 0 13 5 0 29 0 16 0 7 7 0 70 1 11 8 2 9 4 0 3 20 4 1 0 1 1 5 4 56 11 8 7 3 0 2 3 41 0 2 0 8 15 1 0 5 12 6 0 0 1 46 6 0 0 4 1 48 1 0 6 1 49 12 2 15 0 0 0 14 1 6 0 0 0 0 1 0 5 10 0 8 4 1 1 37 1 0 27 1 5 4 4 0 12 2 0 4 0 0 4 3 0 1 4 1 2 5 6 1 0 0 0 0 18 0 0 13 0 6 1 1 87 1 1 7 0 0 3 0 8 0 0 5 0 0 0 1 59 1 6 0 69 5 0 1 0 0 4 1 0 0 0 3 0 19 0 0 0 3 6 25 3 0 0 6 4 0 0 0 9 0 0 3 0 0 0 0 1 0 1 0 0 0 0 0 10 0 0 0 1 0 0 35 0 0 0 5 2 0 0 3 1 0 0 0 0 0 0 3 0 0 1 0 0 0 0 1 0 0 0 3 3 0 0 1 4 0 0 0 0 0 0 2 0 0 0 0 1 0 1 0 1 1 0 0 0 0 0 0 1 0 0 0 0 0 0 0 1 3 0 0 0 0 0 0 0 0 3 0 0 0 1 0 0 1 0 0 1 0 2 1 0 0 1 0 0 0 0 0 0 0 0 0 0 0 10 0 1 0 4 2 0 0 0 0 1 0 0 1 0 1 0 0 0 0 1 0 0 0 1 8 1 0 0 0 0 0 0 0 0 0 2 0 1 0 0 5 0 0 0 0 0 0 0 0 1 0 2 4 0 0 19 0 1 8 0 0 0 1 0 1 0 0 0 0 1 0 0 7 0 4 0 0 0 1 0 1 0 23 1 0 1 0 0 0 0 0 0 0 0 0 1 1 3 0 0 1 0 0 0 0 0 0 0 0 3 1 2 2 4 1 0 0 0 2 15 0 0 0 130 0 0 1 0 0 0 0 1 0 2 0 0 0 0 0 5 1 0 0 0 0 9 0 1 0 1 0 0 0 1 0 0 0 0 0 1 0 4 0 0 1 0 0 0 0 0 2 0 3 1 0 0 0 0 0 0 0 2 0 0 0 3 0 0 0 0 0 0 1 0 0 0 0 0 1 1 0 0 10 0 0 0 0 0 2 0 2 0 97 0 0 0 0 0 13 0 0 2 1 1 1 0 0 0 0 0 2 0 0 2 0 3 0 1 0 1 1 0 0 0 1 2 0 1 0 1 0 0 1 0 0 0 0 0 1 0 0 0 2 0 0 2 5 0 0 0 1 0 0 0 3 0 1 0 0 5 0 1 0 1 0 0 1 0 1 21 1 0 0 0 1 0 0 0 0 2 0 0 0 1 1 1 1 1 1 11 0 0 3 0 0 0 34 1 1 0 0 0 1 0 5 0 0 0 0 0 2 2 1 0 0 0 0 0 0 3 0 0 0 0 0 0 0 0 0 0 10 5 2 0 1 0 0 0 0 0 0 0 0 0 1 0 0 0 0 1 0 0 0 0 0 8 1 0 2 1 0 1 5 1 1 1 0 0 0 0 0 0 0 2 0 1 0 0 2 4 0 0 0 1 0 0 0 0 0 0 0 0 0 1 0 3 0 1 0 2 0 0 0 0 0 0 1 0 0 4 9 6 0 0 0 1 0 0 0 0 0 0 0 0 2 0 0 0 0 0 0 0 0 0 2 0 0 0 0 0 0 0 0 1 0 0 0 0 0 0 0 0 1 7 0 0 0 1 0 0 0 3 0 0 0 0 0 0 0 0 4 0 1 19 5 0 3 4 2 1 0 1 0 0 0 0 0 3 0 0 1 0 0 3 0 0 0 11 0 1 0 1 6 0 0 0 2 0 0 1 0 1 0 3 0 0 0 0 0 0 1 0 0 8 0 0 0 0 1 0 0 2 0 0 1 0 0 0 0 0 0 13 1 2 0 0 0 3 0 0 1 1 1 0 0 1 0 1 3 3 0 0 0 1 2 0 0 9 0 0 0 0 0 0 13 0 0 0 0 1 0 0 0 0 0 1 0 1 0 0 0 0 0 0 0 5 2 1 1 0 0 0 7 0 0 0 0 1 0 0 0 0 0 2 0 0 1 0 0 0 9 0 0 0 0 1 0 0 1 0 1 0 35 3 42 84 75 33 44 7 23 17 1 18 46 22 7 80 0 16 77 125 31 52 5 1 9 151 0 7 35 10 25 57 38 7 14 10 21 9 2 18 59 23 10 25 3 13 33 3 0 5 10 23 0 15 1 7 3 27 13 1 27 0 1 75 2 11 6 1 11 1 68 14 2 2 24 0 8 4 28 9 11 9 12 6 11 0 7 4 0 3 19 0 10 4 14 1 11 27 34 1 0 102 14 7 22 0 11 2 83 0 1 15 66 0 36 1 11 36 4 5 0 5 51 3 197 29 4 8 2 142 21 17 17 6 47 16 14 7 5 62 7 60 12 50 3 59 33 0 0 5 13 0 26 1 1 1 28 8 5 59 2 116 2 3 32 0 4 14 220 133 14 80 0 46 156 3 2 16 1 29 0 22 225 15 4 16 16 12 33 30 11 8 87 44 2 3 20 94 11 4 1 117 6 59 65 1 18 2 22 71 7 1 7 77 9 0 12 49 2 93 3 1 11 30 0 4 10 20 32 22 0 111 2 49 34 0 5 2 19 29 0 29 9 23 41 6 8 50 6 7 6 34 5 19 15 131 6 0 21 7 29 21 1 16 1 105 1 7 66 17 14 43 172 8 4 1 7 74 244 51 23 10 10 12 1 23 37 4 0 11 4 61 2 3 8 0 33 37 12 106 14 13 0 8 223 4 16 5 0 67 86 88 9 37 33 2 10 2 7 14 51 56 0 0 9 95 30 10 30 7 54 61 15 22 19 0 0 4 5 1 0 17 6 10 9 34 14 14 85 112 209 0 0 79 20 82 208 1 28 40 23 72 22 71 5 5 119 7 8 2 7 36 2 14 29 45 5 0 20 5 8 30 25 1 4 2 7 0 1 10 2 32 55 75 13 21 14 13 9 4 6 2 3 0 0 11 1 81 11 110 5 17 1 4 4 98 22 6 2 11 0 10 105 32 27 120 23 17 253 10 18 2 4 17 5 0 0 93 18 7 15 2 23 33 5 60 1 16 31 70 40 3 1 28 0 6 7 155 18 17 7 1 4 26 11 0 54 54 34 71 5 6 116 15 3 1 4 12 1 2 2 21 1 43 5 0 13 128 15 84 12 1 0 4 18 28 10 42 6 4 3 8 21 118 22 2 22 134 11 3 8 6 26 0 8 0 18 44 12 18 28 2 24 9 0 2 28 34 3 0 59 3 2 0 1 37 7 0 27 41 44 2 20 0 3 24 2 10 7 2 12 8 41 23 8 13 25 2 21 1 1 1 70 13 4 85 15 9 43 0 29 126 1 1 17 15 72 7 22 3 1 0 12 15 47 15 4 5 30 93 17 0 1 13 12 151 6 8 61 42 111 2 29 0 4 6 1 0 1 6 51 25 243 19 34 1 31 0 21 12 7 9 12 25 70 1 20 2 0 25 3 8 12 0 16 3 11 2 1 14 1 3 16 0 6 7 0 0 19 0 1 4 30 18 38 90 5 11 16 0 3 73 33 53 3 32 1 1 0 2 7 13 172 10 1 32 22 1 35 11 54 15 59 0 1 8 0 0 17 9 4 4 23 18 11 9 6 0 0 0 1 4 14 30 0 2 0 0 6 1 8 0 1 37 64 4 1 23 14 30 42 1 0 25 14 42 37 0 2 76 96 0 61 20 72 13 10 31 1 15 15 68 7 7 18 5 21 0 16 0 69 102 5 27 5 26 13 33 3 1 2 64 10 2 22 0 1 23 35 38 2 0 66 0 6 0 99 2 54 8 1 0 69 0 8 1 2 6 42 60 9 5 41 45 1 52 74 SP11 Bacteria;Bacteroidetes;Bacteroidia;Bacteroidales;Porphyromonadaceae;Porphyromonas;pasteri 82 2871 25 127 4 2199 32 2794 26 456 402 1812 551 1677 216 787 537 2274 13107 6720 1133 57 495 1349 793 255 0 23 692 594 14171 7773 6865 6352 6753 1036 209 2701 4584 2641 23778 1679 7976 868 473 3230 12223 39 1714 1105 282 11 133 683 3230 24907 64 1357 2006 5386 1192 507 4733 1643 16429 12366 3241 1066 6621 12274 437 4320 13206 103 56 3625 3958 1567 413 380 20210 10425 422 2503 7341 3640 2551 572 649 242 9540 5 8854 2837 795 7218 3276 17273 19596 1366 1413 17641 5690 5274 87 2370 2938 2525 9954 2123 51 394 87 9489 1152 15953 10551 2819 3391 6303 2634 11248 2808 2387 1802 1298 393 153 2315 179 17301 16064 5 16385 2656 26482 23240 751 389 16077 250 140 165 2217 226 1758 3112 13398 514 10368 274 12739 3594 1935 432 1301 3703 499 8896 7346 16593 19048 43358 26 1536 289 471 6428 4502 1465 1054 861 5115 10667 6308 457 3677 2978 2819 751 207 10034 7099 9765 475 5999 15849 8258 25621 23087 4135 1228 10626 1345 952 348 3999 572 1768 9526 5177 20496 8217 18812 20105 132 116 13 2227 683 952 8478 2624 547 17248 12981 3664 778 391 9191 513 5874 207 3567 1569 5004 15843 11114 11505 296 11337 3012 1457 2157 291 10196 19160 1475 19331 21081 25970 34690 796 501 93 128 3609 11984 12929 5 2010 12634 17263 1161 153 712 4870 321 102 942 606 302 448 2050 3773 68 406 272 0 0 0 0 0 0 0 0 0 0 0 0 0 0 0 0 0 0 0 0 0 0 0 0 0 0 0 0 0 0 0 0 0 0 0 0 0 0 0 0 0 0 0 0 0 0 0 0 0 0 0 0 0 0 0 0 0 0 0 0 0 0 0 0 0 0 0 0 0 0 0 0 0 0 0 0 0 0 0 0 0 0 0 0 0 0 0 0 0 0 0 0 0 0 0 0 0 0 0 0 0 0 0 0 0 0 0 0 0 0 0 0 0 0 0 0 0 0 0 0 0 0 0 0 0 0 0 0 0 0 0 0 0 0 0 0 0 0 0 0 0 0 0 0 0 0 0 0 0 0 0 0 0 0 0 0 0 0 0 0 0 0 0 0 0 0 0 0 0 0 0 0 0 0 0 0 0 0 0 0 0 0 0 0 0 0 0 0 0 0 0 0 0 0 0 0 0 0 0 0 0 0 0 0 0 0 0 0 0 0 0 0 0 0 0 0 0 0 0 0 0 0 0 0 0 0 0 0 0 0 0 0 0 0 0 0 0 0 0 0 0 0 0 0 0 0 0 0 0 0 0 0 0 0 0 0 0 0 0 0 0 0 0 0 0 0 0 0 0 0 0 0 0 0 0 0 0 0 0 0 0 0 0 0 0 0 0 0 0 0 0 0 0 0 0 0 0 0 0 0 0 0 0 0 0 0 0 0 0 0 0 0 0 0 0 0 0 0 0 0 0 0 0 0 0 0 0 0 0 0 0 0 0 0 0 0 0 0 0 0 0 0 0 0 0 0 0 0 0 0 0 0 0 0 0 0 0 0 0 0 0 0 0 0 0 0 0 0 0 0 0 0 0 0 0 0 0 0 0 0 0 0 0 0 0 0 0 0 0 0 0 0 0 0 0 0 0 0 0 0 0 0 0 0 0 0 0 0 0 0 0 0 0 0 0 0 0 0 0 0 0 0 0 0 0 0 0 0 0 0 0 0 0 0 0 0 0 0 0 0 0 0 0 0 0 0 0 0 0 0 0 0 0 0 0 0 0 0 0 0 0 0 0 0 0 0 0 0 0 0 0 0 0 0 0 0 0 0 0 0 0 0 0 0 0 0 0 0 0 0 0 0 0 0 0 0 0 0 0 0 0 0 0 0 0 0 0 0 0 0 0 0 0 0 0 0 0 0 0 0 0 0 0 0 0 0 0 0 0 0 0 0 0 0 0 0 0 0 0 0 0 0 0 0 0 0 0 0 0 0 0 0 0 0 0 0 0 0 0 0 0 0 0 0 0 0 0 0 0 0 0 0 0 0 0 0 0 0 0 0 0 0 0 0 0 0 0 0 0 0 0 0 0 0 0 0 0 0 0 0 0 0 0 0 0 0 0 0 0 0 0 0 0 0 0 0 0 0 0 0 0 0 0 0 0 0 0 0 0 0 0 0 0 0 0 0 0 0 0 0 0 0 0 0 0 0 0 0 0 0 0 0 0 0 0 0 0 0 0 0 0 0 0 0 0 0 0 0 0 0 0 0 0 0 0 0 0 0 0 0 0 0 0 0 0 0 0 0 0 0 0 0 0 0 0 0 0 0 0 0 0 0 0 0 0 0 0 0 0 0 0 0 0 0 0 0 0 0 0 0 0 0 0 0 0 0 0 0 0 0 0 0 0 0 0 0 0 0 0 0 0 0 0 0 0 0 0 0 0 0 0 0 0 0 0 0 0 0 0 0 0 0 0 0 0 0 0 0 0 0 0 0 0 0 0 0 0 0 0 0 0 0 0 0 0 0 0 0 0 0 0 0 0 0 0 0 0 0 0 0 0 0 0 0 0 0 0 0 0 0 0 0 0 0 0 0 0 0 0 0 0 0 0 0 0 0 0 0 0 0 0 0 0 0 0 0 0 0 0 0 0 0 0 0 0 0 0 0 0 0 0 0 0 0 0 0 0 0 0 0 0 0 0 0 0 0 0 0 0 0 0 0 0 0 0 0 0 0 0 0 0 0 0 0 0 0 0 0 0 0 0 0 0 0 0 0 0 0 0 0 0 0 0 0 0 0 0 0 0 0 0 0 0 0 0 0 0 0 0 0 0 0 0 0 0 0 0 0 0 0 0 0 0 0 0 0 0 0 0 0 0 0 0 0 0 0 0 0 0 0 0 0 0 0 0 0 0 0 0 0 0 0 0 0 0 0 0 0 0 0 0 0 0 0 0 0 0 0 0 0 0 0 0 0 0 0 0 0 0 0 0 0 0 0 0 0 0 0 0 0 0 0 0 0 0 0 0 0 0 0 0 0 0 0 0 0 0 0 0 0 0 0 0 0 0 0 0 0 0 0 0 0 0 0 0 0 0 0 0 0 0 0 0 0 0 0 0 0 0 0 0 0 0 0 0 0 0 0 0 0 0 0 0 0 0 0 0 0 0 0 0 0 0 0 0 0 0 0 0 0 0 0 0 0 0 0 0 0 0 0 0 0 0 0 0 0 0 0 0 0 0 0 0 0 0 0 0 0 0 0 0 0 0 0 0 0 0 0 0 0 0 0 0 0 0 0 0 0 0 0 0 0 0 0 0 0 0 0 0 0 0 0 0 0 0 0 0 0 0 0 0 0 0 0 0 0 0 0 0 0 0 0 0 0 0 0 0 0 0 0 0 0 0 0 0 0 0 0 0 0 0 0 0 0 0 0 0 0 0 0 0 0 0 0 0 0 0 0 0 0 0 0 0 0 0 0 0 0 0 0 0 0 0 0 0 0 0 0 0 0 0 0 0 0 0 0 0 0 0 0 0 0 0 0 0 0 0 0 0 0 0 0 0 0 0 0 0 0 0 0 0 0 0 0 0 0 0 0 0 0 0 0 0 0 0 0 0 0 0 0 0 0 0 0 0 0 0 0 0 0 0 0 0 0 0 0 0 0 0 0 0 0 0 0 0 0 0 0 0 0 0 0 0 0 0 0 0 0 0 0 0 0 0 0 0 0 0 0 0 0 0 0 0 0 0 0 0 0 0 0 0 0 0 0 0 0 0 0 0 0 0 0 0 0 0 0 0 0 0 0 0 0 0 0 0 0 0 0 0 0 0 0 0 0 0 0 0 0 0 0 0 0 0 0 0 0 0 0 0 0 0 0 0 0 0 0 0 0 0 0 0 0 0 0 0 0 0 0 0 0 0 0 0 0 0 0 0 0 0 0 0 0 0 0 0 0 0 0 0 0 0 0 0 0 0 0 0 0 0 0 0 0 0 0 0 0 0 0 0 0 0 0 0 0 0 0 0 0 0 0 0 0 0 0 0 0 0 0 0 0 0 0 0 0 0 0 0 0 0 0 0 0 0 0 0 0 0 0 0 0 0 0 0 0 0 0 0 0 0 0 0 0 0 0 0 0 0 0 0 0 0 0 0 0 0 0 0 0 0 0 0 0 0 0 0 0 0 0 0 0 0 0 0 0 0 0 0 0 0 0 0 0 0 0 0 0 0 0 0 0 0 0 0 0 0 0 0 0 0 0 0 0 0 0 0 0 SP110 Bacteria;Firmicutes;Clostridia;Clostridiales;Lachnospiraceae_[XIV];Catonella;morbi 7 24 4 10 23 231 0 156 2 35 23 27 120 3 28 93 12 0 36 30 28 3 18 22 22 99 0 20 22 7 77 88 27 171 78 72 92 10 51 21 112 19 31 60 5 181 5 6 1 13 27 42 34 16 47 121 33 6 3 45 8 0 7 24 237 0 1 244 52 132 75 17 10 3 0 12 87 22 2 30 536 37 4 11 144 252 65 131 22 83 4 11 4 22 17 45 2 3 9 76 19 10 29 38 12 6 16 12 240 12 0 96 10 53 102 16 29 120 194 57 61 61 16 70 131 45 47 31 145 15 108 50 6 5 35 23 327 440 169 23 6 5 10 44 15 107 48 71 61 19 132 113 49 91 14 665 140 1 11 498 21 9 20 36 4 35 12 29 10 10 0 22 11 56 22 80 72 53 1 4 5 4 46 150 61 40 17 52 11 88 225 1 55 68 26 27 75 93 13 8 3 57 321 20 5 57 1 7 4 1 109 1 59 16 5 40 6 156 0 12 81 71 3 17 266 24 151 17 1 371 149 3 12 5 30 703 75 17 52 2 2 22 234 3 6 23 9 5 234 1 46 5 18 27 5 16 90 0 3 128 5 4 3 29 27 28 159 219 0 0 1 0 0 0 0 0 1 0 0 0 0 0 0 1 0 0 0 0 0 0 0 0 0 0 0 0 0 0 0 0 0 0 0 0 0 0 0 0 0 0 0 0 0 0 0 0 0 0 0 0 0 0 0 0 0 0 0 0 0 0 0 0 0 0 0 0 0 0 0 0 0 1 0 0 0 1 0 0 0 0 0 0 0 0 0 0 0 0 0 0 0 0 0 0 0 0 0 0 0 0 1 0 0 0 0 0 0 0 0 0 0 0 0 0 0 0 0 0 0 0 0 0 0 0 0 0 0 0 1 0 0 0 0 0 0 0 0 0 0 0 0 0 0 0 0 0 0 0 0 0 0 0 1 0 0 0 0 0 0 0 0 0 0 0 0 0 0 0 0 0 0 0 0 0 0 0 0 0 0 0 0 0 0 0 0 0 0 0 1 0 0 0 0 1 0 0 0 0 0 0 0 0 0 1 0 0 0 0 0 0 0 0 0 0 1 0 0 0 0 0 0 0 0 0 0 0 0 0 1 0 1 0 0 0 0 0 0 0 0 0 0 0 0 0 0 0 0 0 0 0 0 0 0 0 0 0 0 0 0 0 0 0 0 0 0 0 0 0 0 0 0 0 0 1 1 0 0 0 0 0 0 0 0 0 1 0 0 0 0 0 0 0 1 0 0 0 0 0 0 0 0 0 0 0 0 0 0 0 0 0 0 0 0 0 0 0 0 0 0 0 0 0 0 0 0 0 1 0 0 0 0 0 0 0 0 0 0 2 0 0 0 0 0 0 0 0 0 0 0 0 0 0 0 0 0 0 0 0 0 0 0 0 0 0 0 0 0 0 0 0 0 0 0 0 0 0 0 0 0 0 0 0 0 0 0 0 0 0 0 1 0 0 1 0 0 0 0 0 0 0 0 1 0 0 0 0 0 0 0 0 0 0 0 0 0 0 0 0 0 0 0 0 0 0 0 0 0 0 0 0 0 0 0 0 0 0 0 0 0 0 0 0 0 0 0 0 0 0 0 0 0 0 0 0 0 1 0 0 0 2 0 0 0 0 0 0 0 0 0 0 0 0 0 0 0 0 0 0 0 0 0 0 0 0 0 0 0 0 0 0 0 0 0 0 0 0 0 0 0 0 0 0 0 0 0 0 0 0 0 0 1 0 0 0 0 0 0 0 0 0 0 0 0 0 0 0 0 0 0 0 0 0 0 0 0 0 0 0 0 0 0 0 0 0 0 0 0 0 0 0 0 0 0 0 0 0 0 0 0 2 8 0 0 0 0 0 0 1 0 0 0 0 0 0 0 0 0 0 0 0 0 0 0 0 0 0 0 0 0 0 0 0 0 0 0 0 0 0 0 0 0 0 0 0 0 0 0 0 0 0 0 0 0 0 0 0 0 0 0 0 0 0 0 0 0 0 0 0 1 0 2 0 1 0 0 0 0 0 0 0 0 0 0 0 0 0 0 0 0 0 0 0 0 0 0 0 0 0 0 0 1 0 0 0 0 0 0 0 1 0 0 0 0 0 0 0 0 0 0 0 0 0 1 0 0 0 0 0 0 0 0 0 0 0 0 0 0 0 0 0 0 0 0 0 0 0 0 0 0 0 0 0 0 0 0 0 0 0 0 0 0 0 0 0 0 0 0 0 0 0 0 0 0 0 0 0 0 0 0 0 0 0 0 0 1 0 0 0 0 2 0 0 0 0 0 0 0 1 0 0 2 2 0 6 0 5 0 1 0 0 0 0 4 1 0 0 3 8 0 0 0 0 0 0 0 0 6 3 0 0 2 1 1 0 0 0 0 1 0 0 4 2 0 8 0 0 1 0 2 0 3 0 3 0 0 5 0 0 0 0 0 0 3 0 0 2 0 0 4 0 0 0 0 0 3 0 0 0 1 0 1 1 1 6 0 0 2 1 0 3 0 0 2 0 0 3 2 3 0 1 0 3 1 0 0 0 3 0 0 0 21 0 0 0 0 5 0 0 0 0 0 1 0 6 36 2 1 0 0 0 1 0 0 0 14 0 0 7 0 0 0 0 0 0 0 0 1 0 0 4 0 1 2 2 0 2 0 0 0 2 1 0 1 0 0 0 1 2 1 1 2 0 0 1 0 0 0 2 2 0 2 0 0 1 0 1 0 1 1 0 1 0 0 5 2 0 12 3 2 0 0 0 1 0 7 5 3 0 0 2 0 0 0 0 0 0 7 2 0 2 0 5 2 0 0 0 0 0 0 3 1 2 0 1 1 1 1 1 0 6 1 0 0 0 0 0 0 0 0 2 0 3 1 1 0 1 4 1 4 1 1 0 1 0 0 1 0 0 0 0 0 1 0 2 1 0 6 0 0 1 1 0 0 4 2 14 1 0 0 3 3 9 0 1 0 0 0 1 0 6 1 0 0 2 0 0 1 0 0 0 2 1 1 3 4 4 2 4 0 3 0 1 0 1 0 2 3 0 0 1 3 3 0 0 1 1 9 0 0 0 0 1 0 3 1 1 1 0 0 12 0 7 1 0 0 6 0 5 0 2 0 2 1 0 0 0 0 1 0 3 2 2 0 0 0 0 0 4 0 0 0 1 0 4 0 0 2 0 1 0 0 0 0 0 1 0 6 19 3 1 0 0 0 37 1 0 0 2 0 2 1 2 3 21 2 0 1 28 0 0 0 0 0 1 1 10 4 8 3 0 1 4 0 0 13 0 0 0 1 0 0 0 0 0 4 1 0 0 0 6 2 0 0 0 0 4 0 0 1 0 0 7 2 1 2 0 0 3 2 0 1 6 1 0 0 7 0 5 0 1 2 21 0 0 0 1 1 0 3 3 0 1 2 0 1 2 7 0 1 4 1 0 0 3 0 9 0 0 5 10 0 0 1 2 2 1 0 0 20 0 0 2 0 0 1 1 0 1 1 3 1 0 1 0 1 1 1 1 0 0 5 0 1 3 2 0 4 0 0 0 2 0 0 3 1 0 0 1 2 0 0 0 0 0 0 0 0 0 0 6 4 1 2 1 1 0 0 2 0 0 0 0 0 4 0 0 0 0 0 0 2 1 3 1 0 0 0 0 2 1 0 0 0 0 1 5 7 6 0 3 0 0 1 0 3 0 15 8 3 1 5 3 0 0 1 0 2 2 0 0 2 10 0 1 0 1 0 0 1 1 7 0 4 0 0 0 0 0 0 4 1 0 1 1 0 0 6 0 2 0 1 4 1 4 0 0 2 1 0 1 0 0 0 0 2 0 2 0 0 1 3 2 4 0 1 0 0 0 1 0 1 8 0 1 0 0 0 0 11 16 0 0 1 0 15 0 0 2 4 8 0 3 2 0 1 0 1 0 0 1 6 0 1 0 0 3 0 1 0 1 0 0 0 0 0 4 0 0 0 0 2 0 1 0 0 0 0 0 0 1 0 0 1 0 0 0 0 0 0 0 0 0 3 5 1 0 0 1 0 0 1 2 0 1 2 7 4 1 0 0 0 0 15 3 2 1 0 1 2 1 3 0 0 0 SP111 Bacteria;Actinobacteria;Actinomycetia;Actinomycetales;Actinomycetaceae;Actinomyces;massiliensis 7 3 57 6 20 8 0 6 91 16 0 15 520 22 102 7 42 44 0 3 8 22 18 94 7 11 52 4 51 182 1 1 46 3 40 6 7 227 9 59 1 15 4 1 2 1 12 18 84 32 1 31 1 10 2 9 13 11 5 22 11 52 12 0 0 16 13 5 69 2 24 7 10 6 47 14 3 0 40 71 8 1 15 1 1 9 18 14 30 0 48 2 28 138 0 21 52 19 30 6 26 17 0 1 43 24 4 56 2 64 8 128 2 10 5 3 0 12 2 9 12 11 1 21 2 15 0 7 0 370 0 12 3 24 6 37 0 9 18 0 37 20 205 5 4 0 13 0 5 10 28 4 54 3 2 21 5 12 4 14 3 17 0 19 14 41 7 17 77 9 24 1 6 21 4 6 9 8 3 31 2 16 20 11 0 10 3 10 0 4 12 13 1 14 0 7 0 4 2 32 26 13 0 0 0 1 13 44 59 21 5 0 5 5 14 9 26 10 50 0 2 0 20 22 0 12 0 8 45 0 16 8 37 5 4 5 2 5 4 21 9 0 3 25 118 34 1 0 1 2 3 8 10 6 4 12 19 4 1 0 12 0 54 1 2 31 2 81 0 95 114 0 17 205 228 0 1577 235 227 0 219 294 0 476 164 29 63 2 1 169 246 0 48 1 230 318 165 95 0 264 302 0 301 110 15 105 239 1 553 0 1 40 12 1 54 389 1 5 23 1 6 16 1 0 40 0 10 0 75 0 94 87 0 6 88 0 12 0 0 0 4 3 0 256 253 342 0 67 58 0 51 105 0 94 0 37 0 74 66 0 2 68 0 207 82 0 0 127 47 0 173 1 0 205 0 290 0 0 1 195 1 0 57 22 0 16 0 37 0 15 0 0 0 7 25 241 94 0 65 9 0 1 525 61 185 0 0 29 85 1 202 1172 0 534 315 0 99 0 886 0 515 2 23 403 1 227 8 0 4 35 11 0 68 225 0 61 333 1 0 152 40 40 1 1 1 345 692 0 38 134 0 282 672 0 286 94 90 14 0 245 307 0 0 35 0 132 0 538 0 14 25 148 0 259 0 0 451 313 0 48 3 32 52 37 649 107 160 96 0 60 64 4 820 126 72 0 373 668 0 423 219 10 1 3 29 0 4 0 24 0 275 20 0 5 9 0 1 38 0 0 1 44 0 1 264 125 0 490 2 124 0 1026 30 1 10 0 22 345 8 114 0 306 491 0 41 65 77 230 0 72 106 269 0 0 1 256 8 0 0 84 0 263 1 62 434 11 0 61 0 46 636 0 20 110 51 14 270 0 36 0 0 36 22 0 85 113 355 1 0 8 364 0 105 0 0 188 0 24 1 0 0 648 0 108 19 1 0 6 30 80 0 316 21 0 61 68 373 0 53 74 0 2 392 0 73 113 238 0 67 144 1 29 144 14 67 445 290 0 369 41 1 361 31 1217 343 1 0 94 3 0 112 30 0 399 1066 41 198 18 0 22 27 0 873 1457 149 92 442 0 429 46 0 107 0 164 0 90 172 0 51 28 0 291 60 1 0 272 365 0 74 83 7 0 2 548 1 17 3 6 0 201 1303 1 164 115 0 24 436 0 45 47 198 0 327 110 0 9 0 0 535 470 1 14 70 23 0 300 194 32 109 47 215 74 29 141 1 170 231 528 93 279 1 311 300 7 43 0 0 188 542 19 191 1 3 0 135 60 169 16 0 98 7 337 0 45 69 0 151 847 0 234 260 1 88 3 0 82 153 0 181 65 932 4 0 1 402 0 107 102 7 0 57 95 203 164 0 22 113 0 0 2 0 0 7 20 0 2 1 0 209 169 32 0 0 0 0 110 0 17 647 0 170 12 97 16 0 17 0 26 8 0 106 356 0 0 93 217 0 25 53 7 1 117 322 0 34 27 0 21 174 0 4 37 23 0 47 201 20 113 31 0 6 0 92 0 236 344 0 50 35 2 1072 970 0 52 380 297 9 173 125 0 208 390 0 434 0 0 37 16 258 0 328 11 0 2 6 0 138 0 143 0 534 1 408 0 6 0 0 184 278 0 61 56 0 0 114 49 0 76 1115 0 12 4 0 363 99 37 0 140 108 0 99 0 76 396 1 168 296 244 515 234 152 280 92 91 0 69 831 0 258 16 430 0 257 411 0 121 313 503 396 0 12 138 0 254 0 122 0 213 332 0 12 22 0 162 512 0 129 270 77 368 159 0 361 213 0 445 0 307 2 343 583 0 21 165 0 59 3 265 818 0 15 129 67 0 7 110 0 0 2 0 0 87 0 0 657 471 0 0 2 0 37 44 6 114 35 0 27 11 7 0 1 15 0 21 6 0 23 2 15 0 24 5 0 44 1 0 5 12 4 0 8 0 0 1 18 0 62 6 0 1 31 1 0 0 23 14 0 0 1 0 26 8 1 22 0 12 16 0 30 0 0 54 0 0 4 17 0 0 11 0 0 9 2 0 0 1 17 0 0 0 0 0 3 0 0 4 0 0 1 3 0 0 41 276 0 0 1 0 10 150 22 0 4 4 5 0 52 16 0 9 1 0 3 0 38 0 1 9 0 6 0 0 0 23 0 0 0 65 2 0 11 1 0 0 3 0 4 0 0 2 0 1 7 0 2 0 0 1 0 21 0 12 147 0 5 0 0 3 1 0 0 24 18 0 35 4 0 3 0 20 2 0 10 7 14 0 18 18 0 30 21 0 11 11 0 2 0 7 12 0 22 117 0 8 5 0 0 6 9 0 0 1 7 0 14 82 0 1 1 16 0 1 25 0 55 8 0 0 0 1 0 2 11 0 1 0 0 13 40 0 0 1 0 7 10 0 4 9 0 13 1 0 2 10 4 0 3 16 0 33 3 0 0 0 84 0 6 9 0 8 0 0 5 4 0 0 30 94 0 0 10 1 0 10 0 1 26 17 0 4 8 5 0 148 0 0 43 10 0 126 171 0 0 1 36 0 2 7 0 0 10 0 0 16 1 40 3 0 0 178 0 0 84 8 0 67 2 0 50 11 2 0 67 50 0 32 2 0 0 2 2 0 2 2 25 0 2 0 0 16 51 0 48 0 20 2 0 2 86 0 82 12 0 0 91 9 0 1 12 0 3 8 0 5 118 9 0 0 5 12 0 23 19 0 0 0 10 33 0 0 1 0 0 22 45 0 4 0 0 0 0 3 20 0 31 11 0 49 1 0 48 109 0 2 6 0 0 0 26 0 16 2 0 0 0 2 0 10 26 0 12 0 0 6 2 0 0 0 29 0 24 98 0 0 15 0 11 14 150 0 0 12 14 92 0 14 4 0 0 23 0 78 5 2 0 11 2 0 1 25 0 4 21 0 0 22 1 0 2 14 0 0 44 0 0 0 1 0 3 0 0 29 73 3 0 8 7 0 2 3 17 0 0 14 0 12 13 0 1 33 3 0 28 27 0 5 5 0 0 7 0 0 1 0 0 28 14 0 0 0 4 0 7 0 7 24 0 0 1 1 0 11 7 6 0 9 58 0 12 2 18 34 0 0 7 11 0 2 24 0 2 21 1 26 11 0 5 16 42 0 0 0 0 9 15 0 14 4 5 0 2 16 0 3 96 0 10 28 0 0 14 3 0 0 1 4 0 6 63 0 6 0 0 1 39 0 0 2 20 0 6 0 0 2 42 1 0 6 5 0 0 0 0 32 36 5 0 52 7 0 0 12 145 0 5 5 0 8 39 0 3 3 0 0 39 1 0 57 0 0 2 1 4 0 40 60 0 8 7 0 0 10 0 0 0 0 0 13 9 0 24 0 0 95 0 0 30 15 5 39 0 4 18 0 12 4 0 10 7 0 30 4 0 0 0 31 1 0 0 0 1 1 0 3 6 0 34 3 0 5 64 10 0 3 14 0 32 1 2 0 0 63 165 0 1 19 19 0 4 1 0 16 0 5 2 0 0 0 0 0 0 4 1 0 24 0 0 11 1 10 59 0 0 1 8 12 15 4 0 41 22 0 5 7 58 0 4 17 0 4 4 0 0 10 9 0 1 8 0 0 11 0 0 1 0 0 1 3 0 0 0 3 0 16 2 0 0 16 0 0 16 9 0 0 1 0 9 0 0 1 11 4 2 0 SP114 Bacteria;Proteobacteria;Betaproteobacteria;Neisseriales;Neisseriaceae;Eikenella;corrodens 1 6 11 3 1 4 4 7 1 23 3 8 12 4 2942 0 6 98 54 27 11 4 3 5 11 0 11 2 216 104 223 26 216 60 14 10 4 24 20 6 25 10 56 2 8 47 30 3 6 38 7 5 3 6 8 42 4 42 26 32 2 2 3 165 217 360 73 3 1018 61 3 53 167 0 13 13 0 0 3 11 373 130 18 22 9 891 56 7 2 25 247 21 249 129 0 148 525 158 95 0 70 189 70 207 1 65 55 46 52 135 0 29 4 44 0 7 15 13 5 3 174 125 21 3 6 3 0 11 25 76 45 31 2 305 25 376 15 5 0 160 1 27 34 18 18 4 17 12 2 8 4 85 88 5 0 6 10 0 151 302 712 588 30 1 8 1 91 188 100 7 2 2 1 4 104 0 3 6 40 29 1 2 156 112 6 11 143 58 280 258 1 28 0 3 9 7 5 66 18 326 377 228 163 37 86 2 1 0 415 692 15 91 15 8 167 87 1 0 62 124 40 20 4 106 12 92 55 142 125 3 186 53 113 134 535 23 318 23 43 173 234 35 4 1 8 3 29 17 44 0 29 40 312 3 0 5 5 0 1 9 10 2 6 18 20 5 0 15 0 17 6 0 10 6 14 0 17 5 19 1 50 12 0 22 6 15 3 0 0 31 28 54 32 6 57 50 11 4 0 2 1 0 49 16 104 0 12 0 86 0 2 16 1 0 1 3 0 16 0 0 10 16 3 0 4 0 0 0 1 0 0 0 21 0 0 0 0 0 0 0 7 9 0 7 46 13 0 1 0 2 5 8 1 12 44 21 6 13 0 0 2 2 1 10 2 143 0 9 13 0 10 0 1 36 14 2 2 0 0 37 0 0 0 0 0 10 74 6 0 0 0 1 0 38 16 9 37 0 6 10 31 0 27 1 9 3 0 28 4 0 4 21 0 0 7 8 37 0 23 0 0 6 15 2 0 33 0 3 10 0 0 3 29 19 0 2 8 0 0 0 12 2 13 0 1 12 0 0 14 10 5 0 9 6 0 1 0 0 0 8 1 8 0 27 1 17 0 27 0 2 28 18 3 19 86 3 12 1 0 28 38 0 1 0 25 13 36 16 0 13 8 0 0 35 52 0 7 21 0 37 61 98 0 2 5 0 5 8 0 0 13 7 15 1 0 0 1 13 24 16 0 14 3 8 3 6 111 26 0 7 1 46 15 1 27 0 9 50 0 6 0 2 19 12 10 6 29 32 0 2 11 0 0 1 9 0 0 4 0 4 0 28 31 22 18 3 0 20 0 3 7 0 0 0 3 1 17 16 1 0 0 2 6 145 1 21 36 3 0 0 1 0 20 27 0 28 5 6 0 42 0 0 0 22 12 0 0 1 0 7 5 4 39 6 11 2 2 0 4 11 0 2 3 1 0 7 16 0 22 33 17 14 0 0 22 24 0 8 7 0 0 8 0 0 0 0 0 35 30 0 2 4 9 1 2 1 5 4 0 8 1 0 14 7 22 7 3 0 5 5 0 24 0 31 0 4 15 58 9 0 0 0 69 0 6 21 25 0 13 8 89 0 0 21 9 8 0 0 0 3 22 9 11 2 6 3 0 47 1 23 0 3 0 0 0 10 0 0 19 2 0 26 26 13 0 4 25 12 15 26 18 12 0 3 27 0 5 18 29 12 1 27 26 1 2 0 0 128 50 38 68 1 3 0 14 18 8 34 311 26 7 7 75 0 81 0 22 22 0 49 10 0 18 7 0 0 0 9 25 5 10 26 0 8 1 0 6 16 19 5 5 9 1 2 0 5 25 0 1 15 4 0 1 0 0 16 0 0 13 9 62 0 6 1 19 40 25 0 3 2 1 1 0 2 0 1 0 0 9 5 2 1 0 0 1 11 5 26 0 3 14 0 0 0 3 0 0 0 2 0 0 13 1 0 11 2 119 28 5 0 1 0 21 0 3 3 0 30 15 20 1 9 40 28 3 0 114 0 15 0 8 10 54 5 0 1 0 2 5 0 7 3 0 4 6 0 0 24 43 0 16 0 52 0 0 0 5 30 37 37 52 12 0 119 79 0 0 1 3 31 0 0 2 115 27 0 0 30 11 10 68 0 11 23 1 12 10 36 0 26 40 0 38 14 0 6 14 1 6 4 2 1 12 21 0 9 9 3 5 5 3 18 0 17 3 1 0 17 25 9 0 0 0 8 12 0 43 2 0 7 3 0 11 3 1 8 0 6 6 20 26 0 7 40 2 22 16 2 0 0 5 26 12 0 1 20 0 0 0 0 0 0 0 1 8 2 6 0 1 1 0 0 21 14 4 0 59 30 3 0 1 0 0 16 8 1 2 1 6 0 4 1 0 39 19 0 2 3 1 0 3 10 0 0 1 0 9 4 0 1 50 3 0 0 8 8 0 0 2 0 0 0 0 3 2 0 1 0 11 0 0 12 20 0 1 7 2 0 7 5 0 6 6 7 0 0 0 0 0 0 0 0 6 0 0 3 2 0 4 1 7 0 0 12 0 1 1 0 1 9 0 0 1 0 3 0 0 0 0 17 1 0 1 11 9 0 0 11 0 0 0 0 0 3 2 0 0 23 6 0 10 2 0 0 9 0 0 6 18 2 0 2 5 2 1 0 3 0 0 90 0 0 1 1 0 0 0 6 0 0 0 7 0 7 2 14 0 1 0 1 6 0 21 7 0 0 5 3 2 62 38 0 4 6 3 2 0 24 0 0 11 10 0 5 5 0 1 7 8 2 0 0 4 0 1 11 2 10 0 3 0 7 8 0 8 5 0 0 1 0 0 2 9 10 5 8 0 19 20 0 0 7 0 12 8 0 1 8 0 10 17 0 5 9 7 0 10 20 0 16 28 0 0 2 6 0 4 10 0 2 1 0 1 6 3 0 6 1 0 1 24 11 0 12 1 0 1 4 0 0 4 4 1 50 1 1 41 11 0 20 11 0 0 0 0 0 2 13 3 0 10 3 8 7 0 26 0 78 0 31 0 0 40 1 56 17 4 0 15 4 1 0 4 0 1 21 25 0 0 0 0 0 2 10 5 0 2 3 1 22 7 0 0 0 8 30 0 5 3 0 1 3 0 0 23 25 3 0 1 1 1 0 0 6 22 15 0 0 1 0 0 6 2 0 0 1 0 0 44 0 3 1 0 10 4 1 0 2 0 0 0 1 38 0 3 32 0 11 2 0 0 1 1 0 1 0 0 0 0 0 38 7 0 0 11 0 1 2 0 0 3 3 0 1 1 0 0 0 4 0 1 12 0 2 6 0 2 0 45 19 1 2 7 0 0 2 3 2 0 1 0 3 1 1 0 1 0 0 0 5 0 5 4 2 0 3 0 0 0 3 1 4 23 7 0 4 3 0 14 14 1 22 1 0 12 21 8 0 0 1 1 16 0 2 0 2 12 0 1 1 0 0 1 0 2 3 0 0 0 4 0 0 51 2 0 10 67 0 10 0 6 44 15 8 3 1 0 0 4 1 0 10 11 54 0 5 31 0 8 0 0 31 0 0 11 37 0 0 45 0 2 8 0 41 20 0 1 0 5 0 3 0 0 1 9 0 35 49 1 0 8 27 0 3 1 0 3 1 0 0 5 2 9 0 0 9 0 49 11 0 6 0 0 3 10 1 0 0 0 1 1 0 0 3 11 0 0 1 8 0 0 0 0 12 19 9 0 1 36 0 1 1 4 0 12 9 0 8 3 0 8 0 0 0 3 2 0 14 1 0 9 4 4 0 16 12 3 32 4 0 0 22 1 43 1 0 0 3 1 13 15 1 0 4 0 0 1 4 0 2 5 5 29 12 6 11 1 6 0 0 7 4 0 6 2 0 4 0 0 0 3 4 0 0 2 2 1 0 2 7 6 2 0 3 0 0 2 0 1 1 0 16 0 0 0 1 19 1 5 1 0 16 3 1 8 0 0 0 1 6 0 0 0 0 20 8 0 11 0 19 2 0 0 11 2 0 0 0 0 2 2 0 12 0 18 0 4 5 0 1 25 0 2 1 2 0 1 21 0 5 0 0 0 0 4 0 15 21 0 0 1 2 0 3 0 0 1 2 0 4 7 2 0 1 0 0 9 0 1 1 11 0 1 0 SP115 Bacteria;Proteobacteria;Betaproteobacteria;Neisseriales;Neisseriaceae;Neisseria;perflava 54 39 0 1513 45 17 0 3899 8 3 416 2 747 884 9318 0 341 64 0 0 2250 46 3 43 509 416 0 0 84 467 1327 680 0 1 3140 3 98 22 0 289 2 4 982 0 0 3 421 115 0 5400 137 33 166 2 3528 2016 414 138 2 10 0 0 80 84 16 494 476 2231 25 0 410 6599 2 94 5 1 3 1163 39 359 25 8268 29 733 11 59 1558 135 18 128 0 5 0 15726 416 1817 104 788 5188 74 130 1541 1 0 6 455 458 247 4125 66 450 3 5 933 901 515 132 2231 1563 5 0 514 9106 7224 7 0 961 3608 56 35 3330 2326 0 1861 5713 1 2 2 0 1068 311 212 12 1160 22 708 214 1 174 0 0 1 0 1026 12 0 0 1541 1 164 527 3 866 63 175 1349 7 7 0 75 1742 25 0 2 4336 12 2 0 0 0 0 1 2828 2860 6693 4 1125 2 0 3 1410 15 3 0 66 132 920 1531 0 3646 74 6340 0 1 1184 77 36 2 1 629 0 14 18 7291 15 18 2 1064 0 3639 2261 1 308 12 321 908 17 869 263 2707 0 384 958 9 484 185 9 2 303 21 1 3739 5 13 3 561 0 1 9 0 0 2 0 0 0 0 0 60 9 444 0 616 0 424 77 0 1 38 0 0 0 0 0 0 0 0 0 0 0 0 0 0 0 0 0 0 0 0 0 0 0 0 0 0 0 0 0 0 0 0 0 0 0 0 0 0 0 0 0 0 0 0 0 0 0 0 0 0 0 0 0 0 0 0 0 0 0 0 0 0 0 0 0 0 0 0 0 0 0 0 0 0 0 0 0 0 0 0 0 0 0 0 0 0 0 0 0 0 0 0 0 0 0 0 0 0 0 0 0 0 0 0 0 0 0 0 0 0 0 0 0 0 0 0 0 0 0 0 0 0 0 0 0 0 0 0 0 0 0 0 0 0 0 0 0 0 0 0 0 0 0 0 0 0 0 0 0 0 0 0 0 0 0 0 0 0 0 0 0 0 0 0 0 0 0 0 0 0 0 0 0 0 0 0 0 0 0 0 0 0 0 0 0 0 0 0 0 0 0 0 0 0 0 0 0 0 0 0 0 0 0 0 0 0 0 0 0 0 0 0 0 0 0 0 0 0 0 0 0 0 0 0 0 0 0 0 0 0 0 0 0 0 0 0 0 0 0 0 0 0 0 0 0 0 0 0 0 0 0 0 0 0 0 0 0 0 0 0 0 0 0 0 0 0 0 0 0 0 0 0 0 0 0 0 0 0 0 0 0 0 0 0 0 0 0 0 0 0 0 0 0 0 0 0 0 0 0 0 0 0 0 0 0 0 0 0 0 0 0 0 0 0 0 0 0 0 0 0 0 0 0 0 0 0 0 0 0 0 0 0 0 0 0 0 0 0 0 0 0 0 0 0 0 0 0 0 0 0 0 0 0 0 0 0 0 0 0 0 0 0 0 0 0 0 0 0 0 0 0 0 0 0 0 0 0 0 0 0 0 0 0 0 0 0 0 0 0 0 0 0 0 0 0 0 0 0 0 0 0 0 0 0 0 0 0 0 0 0 0 0 0 0 0 0 0 0 0 0 0 0 0 0 0 0 0 0 0 0 0 0 0 0 0 0 0 0 0 0 0 0 0 0 0 0 0 0 0 0 0 0 0 0 0 0 0 0 0 0 0 0 0 0 0 0 0 0 0 0 0 0 0 0 0 0 0 0 0 0 0 0 0 0 0 0 0 0 0 0 0 0 0 0 0 0 0 0 0 0 0 0 0 0 0 0 0 0 0 0 0 0 0 0 0 0 0 0 0 0 0 0 0 0 0 0 0 0 0 0 0 0 0 0 0 0 0 0 0 0 0 0 0 0 0 0 0 0 0 0 0 0 0 0 0 0 0 0 0 0 0 0 0 0 0 0 0 0 0 0 0 0 0 0 0 0 0 0 0 0 0 0 0 0 0 0 0 0 0 0 0 0 0 0 0 0 0 0 0 0 0 0 0 0 0 0 0 0 0 0 0 0 0 0 0 0 0 0 0 0 0 0 0 0 0 0 0 0 0 0 0 0 0 0 0 0 0 0 0 0 0 0 0 0 0 0 0 0 0 0 0 0 0 0 0 0 0 0 0 0 0 0 0 0 0 0 0 0 0 0 0 0 0 0 0 0 0 0 0 0 0 0 0 0 0 0 0 0 0 0 0 0 0 0 0 0 0 0 0 0 0 0 0 0 0 0 0 0 0 0 0 0 0 0 0 0 0 0 0 0 0 0 0 0 0 0 0 0 0 0 0 0 0 0 0 0 0 0 0 0 0 0 0 0 0 0 0 0 0 0 0 0 0 0 0 0 0 0 0 0 0 0 0 0 0 0 0 0 0 0 0 0 0 0 0 0 0 0 0 0 0 0 0 0 0 0 0 0 0 0 0 0 0 0 0 0 0 0 0 0 0 0 0 0 0 0 0 0 0 0 0 0 0 0 0 0 0 0 0 0 0 0 0 0 0 0 0 0 0 0 0 0 0 0 0 0 0 0 0 0 0 0 0 0 0 0 0 0 0 0 0 0 0 0 0 0 0 0 0 0 0 0 0 0 0 0 0 0 0 0 0 0 0 0 0 0 0 0 0 0 0 0 0 0 0 0 0 0 0 0 0 0 0 0 0 0 0 0 0 0 0 0 0 0 0 0 0 0 0 0 0 0 0 0 0 0 0 0 0 0 0 0 0 0 0 0 0 0 0 0 0 0 0 0 0 0 0 0 0 0 0 0 0 0 0 0 0 0 0 0 0 0 0 0 0 0 0 0 0 0 0 0 0 0 0 0 0 0 0 0 0 0 0 0 0 0 0 0 0 0 0 0 0 0 0 0 0 0 0 0 0 0 0 0 0 0 0 0 0 0 0 0 0 0 0 0 0 0 0 0 0 0 0 0 0 0 0 0 0 0 0 0 0 0 0 0 0 0 0 0 0 0 0 0 0 0 0 0 0 0 0 0 0 0 0 0 0 0 0 0 0 0 0 0 0 0 0 0 0 0 0 0 0 0 0 0 0 0 0 0 0 0 0 0 0 0 0 0 0 0 0 0 0 0 0 0 0 0 0 0 0 0 0 0 0 0 0 0 0 0 0 0 0 0 0 0 0 0 0 0 0 0 0 0 0 0 0 0 0 0 0 0 0 0 0 0 0 0 0 0 0 0 0 0 0 0 0 0 0 0 0 0 0 0 0 0 0 0 0 0 0 0 0 0 0 0 0 0 0 0 0 0 0 0 0 0 0 0 0 0 0 0 0 0 0 0 0 0 0 0 0 0 0 0 0 0 0 0 0 0 0 0 0 0 0 0 0 0 0 0 0 0 0 0 0 0 0 0 0 0 0 0 0 0 0 0 0 0 0 0 0 0 0 0 0 0 0 0 0 0 0 0 0 0 0 0 0 0 0 0 0 0 0 0 0 0 0 0 0 0 0 0 0 0 0 0 0 0 0 0 0 0 0 0 0 0 0 0 0 0 0 0 0 0 0 0 0 0 0 0 0 0 0 0 0 0 0 0 0 0 0 0 0 0 0 0 0 0 0 0 0 0 0 0 0 0 0 0 0 0 0 0 0 0 0 0 0 0 0 0 0 0 0 0 0 0 0 0 0 0 0 0 0 0 0 0 0 0 0 0 0 0 0 0 0 0 0 0 0 0 0 0 0 0 0 0 0 0 0 0 0 0 0 0 0 0 0 0 0 0 0 0 0 0 0 0 0 0 0 0 0 0 0 0 0 0 0 0 0 0 0 0 0 0 0 0 0 0 0 0 0 0 0 0 0 0 0 0 0 0 0 0 0 0 0 0 0 0 0 0 0 0 0 0 0 0 0 0 0 0 0 0 0 0 0 0 0 0 0 0 0 0 0 0 0 0 0 0 0 0 0 0 0 0 0 0 0 0 0 0 0 0 0 0 0 0 0 0 0 0 0 0 0 0 0 0 0 0 0 0 0 0 0 0 0 0 0 0 0 0 0 0 0 0 0 0 0 0 0 0 0 0 0 0 0 0 0 0 0 0 0 0 0 0 0 0 0 0 0 0 0 0 0 0 0 0 0 0 0 0 0 0 0 0 0 0 0 0 0 0 0 0 0 0 0 0 0 0 0 0 0 0 0 0 0 0 SP117 Bacteria;Proteobacteria;Betaproteobacteria;Neisseriales;Neisseriaceae;Kingella;sp. HMT012 0 5 6 1 0 1 0 0 2 4 0 0 2 0 0 0 1 3 1 0 0 0 0 0 0 0 11 0 0 31 0 0 0 0 0 0 2 0 5 1 0 5 0 0 9 0 9 2 0 0 1 0 0 3 0 0 0 62 4 32 0 4 0 0 1 8 12 0 0 0 0 8 5 0 9 0 0 0 0 1 0 0 0 0 0 0 1 7 0 5 1 0 7 0 0 0 0 8 0 4 0 1 0 0 3 0 0 0 0 0 2 0 8 2 1 0 0 0 1 0 0 3 0 1 1 0 0 0 0 0 1 3 0 0 2 4 0 0 0 0 4 1 0 10 4 0 2 1 0 0 0 0 0 0 0 0 0 0 0 0 1 0 0 0 0 0 0 0 0 0 0 0 0 1 0 0 0 0 0 16 0 0 1 0 2 0 0 0 0 4 1 0 0 0 0 0 0 0 0 4 1 0 0 0 1 0 0 0 0 0 0 0 0 0 0 0 2 0 0 0 4 0 0 0 0 0 0 14 0 0 0 0 1 0 2 0 0 0 5 3 0 0 0 0 2 0 0 0 0 0 0 0 0 0 0 0 0 0 0 0 0 0 0 0 1 0 0 0 58 119 46 0 39 0 32 0 6 37 166 189 72 89 12 21 92 11 3 11 149 37 154 85 34 0 203 165 20 22 1 67 43 247 5 44 16 2 45 43 28 21 28 27 6 26 6 21 2 394 39 239 6 26 54 0 8 0 0 0 8 0 0 89 14 48 10 0 0 0 13 789 1 3 0 217 20 34 1081 2 35 512 24 36 117 36 3 27 3 28 107 0 42 151 483 6 9 31 240 22 66 0 44 10 252 54 697 13 10 33 2 15 15 0 84 79 368 40 36 13 1 14 43 35 0 170 8 8 24 41 86 53 5 1741 1 12 339 505 0 148 103 126 105 28 1082 1359 28 45 40 0 17 0 85 51 132 4 0 22 157 62 16 54 12 103 266 53 3 99 79 156 3 0 7 15 74 1 107 1 1 9 98 34 1 114 33 314 2 17 0 7 0 99 6 14 0 20 9 198 0 47 0 64 210 49 1309 0 58 171 6 23 654 135 154 81 6 24 34 23 22 114 1597 253 72 160 83 17 39 3 3 20 0 45 32 77 1 21 206 2 20 94 3 0 24 18 70 46 1 150 645 97 2 332 0 20 60 66 89 45 38 60 7 241 89 76 45 1277 40 0 16 1 12 5 5 8 33 5 6 14 38 8 241 5 54 5 169 263 371 30 0 12 0 51 57 115 56 12 2 4 0 47 2 32 2 0 189 76 30 44 211 288 15 0 0 37 40 359 20 62 12 3 169 0 2 46 4 5 50 50 102 29 0 283 0 6 4 110 279 356 286 11 83 138 143 22 11 1 7 313 157 43 182 119 60 33 44 1886 11 10 77 30 31 275 17 16 51 692 18 42 85 0 0 0 229 23 16 47 75 159 0 4 1 1195 61 4 167 25 153 1 42 30 713 16 279 0 69 59 83 95 1 0 3 23 209 105 2 16 847 58 71 171 4 2 2 36 6 0 0 19 1 39 192 150 54 0 5 45 3032 41 0 1 0 13 0 81 14 1 59 23 9 76 34 191 30 43 2 43 0 11 69 1 3 4 23 40 23 19 0 0 50 97 26 60 80 4 52 3 371 27 12 9 12 65 43 8 17 0 90 10 47 52 18 15 35 264 344 196 7 20 28 55 316 32 152 38 8 154 201 130 7 181 814 11 116 33 72 46 304 27 63 4 377 182 2 37 453 34 0 97 46 4 80 32 0 54 1 405 713 114 180 1 0 60 109 6 10 75 12 165 240 228 2 41 66 0 255 1288 0 243 363 0 2 350 2 16 366 32 0 2 14 154 116 13 0 6 53 2 1 8 47 33 4 12 19 1 3 52 34 5 127 142 9 9 4 73 121 457 209 110 16 6 18 31 13 1122 16 6 4 34 61 9 102 7 5 0 8 86 2 0 10 0 35 474 18 3 17 13 15 356 9 81 410 50 163 0 0 0 15 1065 3 2 117 355 5 0 6 2 329 0 31 52 18 60 43 11 0 55 20 207 0 37 12 155 17 565 298 18 49 0 496 43 85 108 16 35 10 103 1 7 7 129 225 41 91 52 12 42 15 467 43 444 136 158 75 468 59 61 1 79 19 5 34 38 64 18 309 16 248 5 141 34 13 0 192 234 39 9 106 55 9 5 1 66 6 17 137 228 258 19 0 78 2 13 86 1515 0 47 88 125 16 4 0 0 0 1122 2 44 3 2 0 4 0 1 0 285 2 51 0 26 1 0 6 2 1 34 155 57 73 17 77 25 44 0 49 26 2 4 39 0 2 21 44 2 56 25 9 1 50 5 8 31 123 873 23 55 0 3 36 0 64 5 0 6 30 16 51 0 75 2 0 0 11 0 4 25 0 6 33 343 31 0 25 0 1 0 32 0 224 172 11 1 46 44 1 0 113 3 0 2 212 3 1 10 4 0 27 110 0 24 22 1 0 1 9 0 2 27 0 15 4 1 34 32 18 14 2 237 79 0 354 12 0 158 25 0 1 215 27 0 1 249 0 23 6 1 0 21 18 0 0 47 9 0 259 9 1 8 23 0 4 6 6 0 0 1 37 0 0 1 15 1 72 6 0 19 10 15 43 83 13 16 2 6 0 2 28 6 3 55 4 114 2 30 2 1 27 32 62 1 44 167 1 86 34 1 32 2 14 0 4 35 58 1 60 103 0 11 26 1 1 25 18 0 0 31 6 0 29 34 5 3 2 239 36 32 71 1 87 83 0 3 10 0 2 25 47 32 2 1 0 159 39 0 0 51 0 13 64 56 155 28 2 23 11 0 0 1 9 0 105 56 0 9 19 0 72 165 12 46 20 51 0 20 6 0 2 15 1 0 16 4 0 1 102 70 1 48 27 0 16 7 0 34 527 41 0 3 0 0 12 62 2 78 33 15 0 3 1 1 10 7 0 0 9 5 93 93 0 9 10 58 2 11 7 0 105 22 839 23 103 0 0 5 2 0 51 176 12 4 20 1 13 4 10 3 87 314 38 1 91 2 1 38 100 4 71 1 124 141 10 14 23 346 13 136 1 8 109 125 0 3 132 131 3 8 0 32 63 43 0 0 33 167 1 50 176 70 38 25 2 199 46 11 7 5 0 112 18 0 0 1 1 5 2 6 10 0 73 7 2 2 15 1 12 9 20 71 109 0 0 2 64 158 5 2 11 0 0 48 1 55 178 0 63 16 8 50 20 0 0 1 13 0 33 5 0 26 23 0 7 14 1 87 3 1 8 4 0 18 67 3 82 55 1 6 35 125 0 62 8 0 7 54 0 26 7 1 0 47 45 0 1 550 17 0 6 21 1 32 21 41 2 77 0 10 32 0 14 18 31 0 0 14 15 113 11 2 0 5 5 4 9 9 8 0 2 16 2 174 407 0 0 4 3 7 32 55 24 13 119 26 7 0 68 2 50 0 2 0 0 0 53 6 0 9 9 13 0 2 35 0 147 52 2 137 0 0 12 59 2 1 18 0 1 87 25 11 9 9 1 36 254 0 3 44 0 1 57 0 45 67 301 36 71 54 0 296 15 9 82 31 0 0 5 52 0 1 63 44 0 9 162 41 14 11 1 27 90 40 1 2 64 0 49 120 4 68 12 0 15 13 98 0 18 122 0 3 50 6 0 5 44 0 1 0 160 12 31 21 0 0 50 0 28 27 31 14 211 84 0 18 18 0 80 2 58 0 331 191 17 85 27 0 1 16 1 28 30 9 0 36 14 0 15 17 0 46 369 0 93 36 36 64 3 1 4 0 14 267 2 30 26 15 56 4 4 175 165 12 5 1 0 0 40 76 0 22 3 8 3 30 24 2 1 0 0 0 354 0 1 54 2 0 0 101 131 76 0 94 8 4 18 4 1 15 79 39 0 0 0 0 0 17 152 29 44 0 66 1 61 103 1 91 10 0 0 6 38 1 16 1 0 66 110 0 148 104 24 3 86 44 1 7 6 1 26 29 0 0 0 65 0 160 128 0 0 0 17 0 1 71 0 0 17 23 0 15 11 0 5 177 0 8 11 41 0 11 312 0 70 32 4 13 58 11 13 2 SP118 Bacteria;Firmicutes;Clostridia;Clostridiales;Lachnospiraceae_[XIV];Stomatobaculum;sp. HMT097 1 74 1 17 0 113 2 492 0 19 176 1 161 18 16 401 30 6 689 369 66 0 0 77 0 8 0 18 1 0 23 660 29 0 330 13 0 2 21 7 3046 46 555 83 5 471 0 0 0 72 42 0 2 3 399 7 130 173 4 58 0 8 0 0 335 14 0 1041 39 354 1 181 0 1 0 156 269 171 78 16 0 220 0 179 607 116 755 34 48 74 5 1 1 33 0 431 5 7 15 66 29 18 0 56 1 6 291 25 983 18 0 5 36 199 106 27 154 967 225 69 8 0 71 194 128 133 3 25 0 0 589 328 12 11 0 336 2344 332 32 664 28 2 5 21 0 429 179 357 487 1 267 42 1 66 32 181 379 0 0 834 146 8 128 6 4 2 59 420 4 8 0 3 41 15 27 0 45 25 31 6 26 7 83 1647 0 60 353 286 716 26 12 4 439 473 51 99 0 1293 162 31 3 627 257 10 98 55 2 0 1 2 31 55 38 1 69 440 0 32 0 90 163 0 0 26 0 492 372 14 0 99 1001 4 138 1 0 495 91 57 201 36 2 213 2874 3 3 144 66 103 0 2 178 22 3 96 0 1 84 9 0 371 13 0 22 0 0 44 137 51 0 0 1 0 0 0 0 0 0 0 0 0 1 0 0 0 3 0 0 0 0 0 3 0 0 0 0 0 0 0 0 0 0 0 9 4 0 0 5 0 0 0 0 0 1 0 0 1 0 0 0 0 0 0 0 0 0 0 0 0 0 0 0 0 0 0 0 0 0 0 0 0 1 0 0 0 1 0 0 0 0 0 1 0 0 0 3 0 0 0 0 0 2 0 0 0 0 0 0 0 0 0 0 0 0 0 0 1 0 0 0 0 0 0 0 0 0 0 0 0 0 0 1 2 0 0 0 0 0 0 0 0 0 0 0 0 0 0 0 0 0 0 0 0 0 0 0 0 0 0 0 3 0 0 0 0 0 0 3 0 0 0 0 0 0 0 0 0 0 0 0 0 0 0 0 1 0 0 0 5 0 0 0 0 0 0 0 0 0 0 0 0 0 0 2 0 0 0 0 0 0 0 0 0 0 0 0 0 0 0 0 0 0 0 0 0 0 0 1 0 0 0 0 0 0 1 1 0 0 0 1 0 1 0 0 0 0 0 0 0 1 0 0 0 0 0 0 0 5 1 0 0 0 0 0 0 0 0 0 0 0 0 0 0 0 0 0 0 0 0 0 1 4 3 2 0 0 0 0 0 0 0 0 0 0 0 0 0 0 0 0 0 0 0 0 0 0 0 0 0 0 0 0 0 0 0 0 0 0 0 0 0 0 0 0 0 0 0 0 0 0 0 0 0 0 2 0 0 0 0 0 0 0 0 0 0 1 0 0 0 0 0 0 0 0 0 0 0 0 0 0 1 0 0 0 0 0 0 0 0 1 0 0 0 0 0 0 0 0 0 0 1 0 0 0 0 0 0 0 0 0 0 0 0 0 0 0 1 0 0 0 0 0 0 0 0 0 0 0 0 0 0 0 0 0 0 0 0 0 0 0 1 0 2 0 0 0 0 0 0 2 0 0 3 0 0 0 0 0 2 0 0 0 0 0 0 0 0 0 0 0 0 0 0 0 0 0 0 0 0 0 0 0 0 0 0 0 0 0 1 1 2 0 0 0 0 0 0 0 0 0 0 0 0 0 0 0 0 0 0 0 1 0 0 0 0 0 0 0 0 0 0 2 1 1 0 0 0 0 0 0 0 0 0 0 0 0 0 0 0 0 0 0 0 0 2 0 0 0 0 0 0 0 0 0 0 0 0 0 0 0 0 0 0 2 0 0 0 0 0 0 0 0 0 0 0 0 0 1 0 0 0 0 0 0 0 0 0 0 1 0 0 11 0 1 0 0 1 0 0 0 0 0 0 0 0 0 0 0 0 0 0 0 0 0 0 0 0 0 0 0 0 0 0 1 0 0 0 0 0 0 0 0 0 0 1 0 0 0 0 2 4 0 0 0 0 0 0 3 0 0 0 0 0 0 0 0 9 0 0 0 0 2 0 1 0 0 0 0 0 0 0 0 0 0 2 1 0 0 0 0 0 0 0 0 0 0 0 0 0 0 0 0 0 0 0 0 0 0 0 0 0 0 0 7 0 0 1 0 0 0 0 0 0 0 0 0 0 0 0 0 0 0 0 0 0 0 0 0 0 0 0 0 0 0 0 0 0 2 0 0 0 0 0 1 1 0 0 0 0 0 0 0 0 0 0 1 0 0 0 0 0 1 0 0 3 0 0 0 0 1 0 0 0 0 0 0 0 0 0 0 0 0 0 0 0 0 0 1 28 0 0 0 0 0 2 1 9 0 0 3 0 0 1 6 9 0 0 0 0 0 0 0 0 0 0 0 0 2 0 0 0 0 0 28 0 1 2 0 3 0 0 1 0 3 0 1 0 0 0 4 0 0 0 1 0 1 13 0 0 0 1 0 0 2 14 1 0 0 0 10 1 5 1 1 2 3 0 1 0 0 0 2 0 5 0 0 0 0 4 0 0 0 0 0 0 0 0 0 0 0 1 0 16 0 0 1 0 0 0 0 0 12 1 0 0 0 0 0 1 0 1 0 0 0 0 0 1 0 0 1 0 3 0 0 0 7 0 0 20 0 0 0 0 0 0 0 0 0 0 0 0 2 1 1 2 4 1 0 0 3 0 0 0 0 0 0 0 0 11 2 0 41 4 0 0 1 0 0 0 0 0 3 0 0 5 0 2 0 1 1 1 2 0 0 0 1 0 1 1 0 0 0 0 0 0 2 6 0 0 0 0 0 0 1 0 0 0 0 1 0 28 0 6 13 5 0 0 0 0 0 12 1 0 0 0 0 1 0 0 1 0 2 0 0 0 1 0 1 0 0 0 0 0 1 0 0 0 0 3 1 0 5 2 0 2 0 2 1 1 0 0 0 6 1 0 3 2 1 1 3 0 5 0 0 6 0 6 0 0 0 6 0 43 4 0 0 1 5 1 0 0 4 0 0 0 0 0 1 0 1 0 6 5 5 20 1 0 0 0 0 0 0 0 0 1 0 1 2 0 0 0 1 4 0 0 0 0 8 0 0 0 0 0 9 0 2 0 0 0 0 62 0 35 0 5 1 0 0 7 0 0 0 1 0 0 0 4 0 0 0 0 0 0 0 0 0 0 2 3 3 1 0 2 0 0 0 0 3 1 0 0 0 17 7 0 1 0 0 3 0 0 0 0 0 18 1 0 2 4 0 20 0 0 1 0 0 0 0 0 0 0 0 0 0 0 1 10 1 4 0 0 0 15 0 1 151 0 0 0 0 0 0 0 0 0 0 0 0 0 0 0 6 0 0 0 1 0 0 0 9 0 0 1 0 1 18 0 0 2 4 0 0 0 0 0 0 1 0 2 0 0 0 1 0 0 1 0 2 0 0 0 0 0 0 0 0 0 0 0 0 3 0 0 0 0 0 18 2 1 0 0 0 0 0 0 1 0 0 3 6 0 0 0 0 0 1 1 0 0 1 0 0 0 0 0 0 0 0 0 0 0 0 1 1 6 11 1 6 0 3 0 1 0 3 4 2 11 0 0 0 0 2 1 0 0 0 6 0 0 1 0 3 0 1 0 1 0 7 0 0 0 0 0 0 6 0 0 0 0 0 0 0 0 1 0 0 0 0 0 0 0 0 0 0 0 2 0 6 0 0 0 0 0 1 0 2 0 2 1 1 0 4 4 0 0 1 0 1 0 0 0 2 30 0 7 0 0 0 1 0 2 0 2 22 0 0 0 0 0 0 20 11 1 15 0 0 0 0 0 1 0 0 2 2 1 0 0 3 0 0 0 0 0 0 0 0 0 0 0 0 0 0 1 0 1 0 0 1 9 11 0 0 28 1 0 0 0 0 0 2 48 0 0 0 0 167 3 10 13 0 10 0 0 0 1 0 0 13 0 0 0 5 0 0 0 1 22 0 3 0 1 0 0 0 1 0 0 0 0 0 0 2 0 0 0 0 0 2 0 0 4 2 2 2 5 0 2 1 2 0 0 0 0 3 19 1 0 0 4 0 0 0 7 0 0 2 4 0 0 0 1 2 0 0 11 0 0 0 0 6 1 0 0 0 0 SP12 Bacteria;Bacteroidetes;Bacteroidia;Bacteroidales;Prevotellaceae;Prevotella;salivae 2 4 0 546 1 29 1 192 3 56 802 2 58 0 4 7 91 1 68 116 36 6 24 53 45 34 0 0 3 0 9 72 0 373 69 28 99 15 4 2 152 0 2 614 22 39 14 19 28 0 2191 150 1064 8 757 5 736 54 1 133 0 7 6 8 275 1 1 1132 25 32 202 28 2 44 34 1 196 18 14 7 18 198 0 3 1491 47 41 281 3 1715 1 2517 17 0 19 0 0 1 2 154 1 59 10 1 0 3 154 0 89 1 95 0 1825 468 3788 0 174 1525 2550 4 30 807 871 63 1616 65 1975 245 3339 2 125 31 4 33 552 1 815 49 3 0 19 1 1 10 1 593 188 165 435 0 1727 12 56 1 9 3 541 0 142 8 1 0 8 0 2 30 0 17 0 7 40 0 1 2 131 18 6 6 4 8 3 0 1 221 1165 0 30 2 3 1447 158 0 181 15 125 36 182 154 11 28 0 2 1121 97 5 2183 0 1 1 0 755 3 52 10 13 600 18 179 0 46 11 48 16 14 3156 199 554 2 1 916 192 0 0 0 1 744 446 267 144 2 10 2 1527 0 2 122 55 8 1740 4 958 0 1 34 0 3 5 0 44 322 23 1111 9 1546 296 38 1449 501 0 0 0 0 0 8 7 0 0 0 83 0 6 34 652 28 1 1 12 0 39 2 5 0 0 2 0 8 0 15 0 2 0 28 55 57 5 0 7 0 0 0 0 0 4 0 2 0 1 0 0 0 0 4 17 0 7 0 0 0 0 0 0 4 0 0 0 0 0 2 0 0 0 3 0 0 0 0 2 1 0 0 0 0 0 1 0 0 0 0 0 0 0 0 0 2 0 0 0 1 0 0 0 0 153 0 0 0 0 2 0 9 0 0 0 0 0 0 0 2 0 0 0 0 0 0 0 0 0 0 0 0 0 0 8 0 0 0 0 5 0 0 0 2 1 0 0 0 0 0 173 0 0 58 40 140 0 0 0 0 0 0 0 0 3 0 0 1 16 4 1 0 49 0 0 0 0 0 0 0 3 0 19 2 2 0 2 0 0 0 2 1 3 0 0 0 0 0 67 1 0 0 3 0 0 0 0 0 2 8 0 0 1 38 19 193 2 2 0 1 0 0 30 0 80 4 4 0 0 0 0 1 68 0 0 0 0 0 0 0 0 24 0 60 0 0 0 1 0 2 0 0 0 0 0 0 0 1 0 0 0 2 0 0 0 0 0 0 0 0 0 0 0 1 67 1 0 0 0 107 0 4 2 0 0 0 0 0 0 0 0 8 0 81 0 46 126 93 0 0 0 0 0 0 0 0 0 0 0 0 0 0 0 0 0 0 0 6 0 0 0 1 215 0 0 0 0 25 14 6 0 0 0 15 1 0 0 0 0 0 2 0 0 0 0 0 0 0 2 0 0 0 0 0 0 0 0 0 45 0 0 0 0 0 0 0 0 0 173 0 1 0 0 0 0 2 0 0 0 2 51 1 0 0 0 0 1 317 107 0 1 172 5 0 1 7 0 0 1 0 0 0 0 0 0 0 0 0 0 0 1 0 2 0 0 0 0 0 0 0 0 0 0 0 1 2 0 15 0 0 0 0 0 0 2 2 0 0 8 0 121 2 0 0 6 3 0 0 0 0 0 2 0 0 22 0 0 25 0 0 1 0 58 108 0 0 0 5 0 0 0 1 0 16 36 0 0 0 0 0 1 0 25 0 1 1 587 1 0 0 0 0 0 0 4 0 1 0 0 0 0 42 0 0 4 0 0 0 2 0 0 9 172 0 0 5 0 0 17 0 1 0 2 0 2 4 0 3 0 0 9 0 0 0 0 0 0 0 0 0 1 0 0 0 0 0 0 0 0 0 0 0 1 1 0 1 0 0 2 0 0 2 5 0 0 0 0 0 0 6 1 0 100 0 0 0 0 0 0 0 0 0 0 0 0 0 0 0 6 0 1 0 0 0 0 95 0 0 11 0 0 0 0 0 0 0 107 0 0 3 1 1 0 1 0 4 5 0 12 0 0 0 1 0 0 0 0 0 0 0 4 2 2 0 0 0 0 0 0 0 0 2 0 2 0 0 0 0 0 227 0 0 0 0 0 0 0 0 0 0 1 0 0 0 25 4 16 0 0 55 0 9 7 0 0 0 0 0 26 0 0 0 0 0 69 3 0 0 4 0 0 2 0 24 0 5 0 0 0 0 0 0 9 0 0 11 0 0 45 1 14 1 0 0 2 0 0 1 0 75 5 0 1 0 0 0 0 0 1 0 9 0 0 0 0 32 0 12 0 0 1 0 0 1 0 0 12 0 0 0 0 15 0 0 0 0 3 0 0 0 15 2 5 11 14 9 16 15 9 1 1 0 3 0 8 1 1 0 3 44 16 2 16 3 5 145 16 50 1 5 0 0 0 2 15 2 1 174 3 0 0 2 7 0 2 0 0 2 0 0 6 0 23 3 0 1 0 30 0 0 1 13 8 42 1 0 0 0 0 0 20 3 0 3 0 0 0 0 0 1 0 0 0 11 0 9 0 0 40 28 2 1 0 0 10 0 1 110 0 0 0 0 4 74 5 2 0 0 26 9 64 3 118 0 0 2 1 7 2 0 0 2 15 0 0 106 233 15 0 0 0 1 10 1 0 0 0 0 0 34 0 0 13 74 1 18 1 1 6 0 11 10 4 11 1 0 4 0 0 4 1 1 44 2 3 6 14 12 1 0 2 3 1 1 1 46 0 1 6 5 9 14 2 0 0 7 1 0 1 12 2 0 24 4 25 14 110 2 100 4 2 103 0 7 7 5 44 17 22 0 10 2 0 12 7 0 0 4 0 1 0 13 0 9 0 2 0 1 5 0 0 1 2 2 1 0 0 1 1 6 2 2 1 8 0 1 1 1 93 4 0 0 0 0 0 1 13 20 4 0 38 0 9 1 2 4 5 8 0 0 2 0 0 9 8 0 0 0 2 0 45 0 0 0 0 13 13 28 10 1 0 0 1 11 0 0 0 3 0 2 0 46 10 0 0 0 10 0 0 2 0 1 23 2 1 2 7 0 0 0 0 1 0 1 0 0 3 0 3 0 0 0 0 1 16 0 5 5 119 1 0 0 0 2 2 2 2 0 0 1 3 19 0 14 8 0 3 0 1 0 0 11 4 13 1 0 0 29 12 3 0 5 4 17 6 1 7 0 1 0 1 0 24 0 13 22 61 0 0 0 0 0 2 2 4 0 0 0 63 60 0 0 28 1 0 603 0 21 0 6 0 33 310 28 4 108 33 0 0 76 128 3 0 12 0 0 0 1 2 8 19 0 2 10 2 0 11 1 0 61 17 13 0 13 0 14 18 0 0 0 0 0 5 0 1 0 4 0 0 0 53 34 0 40 1 2 2 0 0 0 0 0 0 8 0 2 1 71 0 8 0 8 1 0 1 1 1 0 0 1 9 2 0 5 13 17 0 18 4 0 0 3 0 0 3 1 0 3 0 0 14 6 0 0 0 2 4 2 67 3 0 0 0 9 0 0 1 1 0 2 0 1 1 0 1 0 0 1 10 3 107 0 1 0 0 2 15 2 2 9 3 27 4 5 2 27 28 12 7 10 0 0 0 12 0 1 14 6 35 1 0 67 10 0 0 1 0 1 0 1 1 4 10 1 0 95 0 26 16 3 8 0 6 6 9 9 0 0 11 0 0 2 1 6 0 10 1 2 3 4 0 1 3 1 81 5 3 6 36 4 9 2 3 3 1 35 0 0 0 3 0 1 0 60 3 1 22 3 0 0 1 2 19 4 32 1 6 13 3 16 0 10 5 0 0 0 1 0 43 1 3 0 0 0 14 0 0 1 26 28 2 7 0 1 23 0 0 1 1 0 3 0 3 1 12 3 7 2 0 2 0 6 3 33 0 0 0 8 19 4 11 138 0 27 0 0 359 4 4 37 2 72 1 5 0 0 0 3 0 0 0 0 1 3 1 8 4 74 2 0 0 0 1 9 0 18 44 4 0 0 0 2 3 0 2 0 94 4 4 0 0 5 3 4 1 0 0 2 13 4 1 1 4 4 254 7 3 0 1 2 1 0 0 33 0 5 10 16 11 1 50 3 1 3 823 0 10 2 0 0 0 1 0 1 0 0 SP120 Bacteria;Firmicutes;Bacilli;Lactobacillales;Streptococcaceae;Streptococcus;mutans 5 229 9 78 5 16 0 0 945 1789 0 0 18 28 0 5 103 0 0 3 6 73 93 63 0 261 0 0 0 0 4 0 0 147 0 2 78 6 0 0 0 0 0 0 26 0 1894 622 740 0 17 13 53 2 0 0 1 1 2 2 5 0 4 0 1 15 0 0 0 0 92 0 0 71 110 0 0 1 6 0 0 0 1 0 0 0 0 0 0 18 2 21 131 0 26 0 0 0 0 103 152 0 0 0 10 0 0 0 0 2 18 46 8 0 0 0 2 7 1 0 16 4 0 2 0 0 0 0 0 0 0 0 4 0 0 0 0 5 0 0 154 0 4 1 1 1 13 0 1 0 0 3 0 143 8 0 0 0 32 0 0 0 0 0 0 111 13 2 6 31 129 0 0 2 57 25 0 0 0 0 0 0 0 13 0 0 0 3 0 13 0 4 0 8 0 0 0 0 0 0 0 2 26 0 0 0 0 71 31 0 0 0 5 12 8 0 18 5 0 0 2 0 4 0 1 0 0 0 0 8 15 0 0 9 0 0 24 13 0 0 0 0 0 0 0 26 1 7 0 17 0 0 12 2 0 0 0 2 22 7 35 7 17 0 33 55 6 0 0 0 0 0 1 577 115 0 0 0 397 2 3 1 1 1 0 58 7886 0 2 60 42 1 0 0 0 0 0 0 0 9 0 0 0 0 0 28 492 0 0 0 0 0 0 0 445 307 0 14 181 1 0 0 0 0 0 0 0 0 0 0 2 350 0 0 0 0 0 0 0 0 0 0 0 0 0 0 0 461 0 0 0 0 0 0 0 0 0 0 0 0 0 0 0 0 0 0 0 0 0 0 1 1 0 0 0 0 0 0 0 0 0 1 0 0 0 412 0 0 0 0 0 0 0 0 0 0 0 0 0 0 0 0 0 0 338 0 0 0 1 0 0 0 0 0 0 0 0 0 0 0 102 917 71 1 0 11 0 0 0 0 0 0 0 0 0 0 0 0 0 0 0 0 0 0 0 0 0 0 1 0 0 0 0 0 2 0 0 203 0 0 0 0 0 0 0 0 0 0 0 0 0 0 0 0 0 0 0 515 0 48 942 78 4216 2551 0 0 0 0 0 6 0 0 1472 0 0 0 0 0 0 0 0 0 0 0 0 0 636 0 45 6471 0 17 0 0 0 0 0 0 0 0 0 0 0 0 1 153 0 0 0 5 0 0 0 0 0 0 0 1 1 0 0 0 0 0 1 0 0 0 0 0 0 0 0 0 0 0 0 0 0 9 0 1097 0 0 0 0 0 0 0 0 0 0 0 11 0 0 0 1 1 1 0 1 1 0 0 1 0 0 0 0 0 0 0 0 0 1 0 0 1 0 0 0 1 0 0 0 0 0 0 0 0 0 0 0 0 0 0 0 0 0 0 0 0 0 0 0 0 0 0 0 0 0 0 0 0 0 0 0 0 0 0 0 0 0 0 0 0 0 0 0 6 0 0 0 0 7 1 41 0 0 0 0 21 71 0 0 0 0 0 0 0 0 1 0 0 0 0 0 0 0 0 0 0 0 0 0 0 0 0 0 0 0 0 0 0 0 0 0 0 0 0 0 0 1 1 4 5 0 0 1 10 0 34 3188 1 0 0 0 0 959 1 0 0 0 0 0 0 0 0 0 8 1560 0 1989 0 1797 1598 30 0 3 0 0 0 0 0 0 0 0 0 0 0 0 0 0 0 0 0 0 0 0 0 0 0 0 0 1 0 0 0 0 0 1 0 0 0 14 1099 0 0 0 0 0 0 0 70 0 0 0 0 0 0 0 0 0 0 2 31 0 2 0 0 0 0 0 0 0 0 0 0 0 0 0 0 0 0 0 0 0 0 0 595 1280 6590 0 0 1 10 0 0 0 0 0 0 15 0 0 0 0 0 0 0 157 1754 0 109 4 4593 0 1 0 0 0 0 1 1 274 0 1 1 0 0 0 0 0 1 0 0 0 0 0 0 0 0 0 0 1 0 0 0 0 0 0 0 0 0 0 0 0 0 0 0 0 0 0 0 0 102 0 1 0 0 0 0 0 0 0 0 0 0 0 0 0 0 0 0 0 0 125 14 0 0 0 0 0 0 0 0 0 0 1 0 0 296 0 0 0 0 0 0 600 77 1 0 323 0 0 0 0 0 1 0 0 0 0 1 8 4575 23 598 0 0 0 0 0 0 0 0 0 0 0 0 0 0 1 15 0 17 4550 0 6 8380 2 0 3 0 0 0 88 0 0 0 1 3 0 0 0 0 0 0 0 0 0 0 0 3 1 0 0 0 0 0 0 0 0 0 2 0 0 0 0 0 3857 0 424 166 0 0 0 1 0 6 0 0 0 0 0 17 0 78 0 0 0 0 0 0 0 0 36 62 0 126 280 0 1547 1101 0 0 0 0 12 0 0 0 0 0 0 0 0 0 0 22 105 0 0 0 112 0 0 0 0 0 0 0 0 0 0 0 0 503 2 83 81 222 0 0 0 0 0 1 0 0 0 0 0 0 0 0 0 0 0 0 0 0 0 0 0 0 0 1 0 0 0 4 76 0 0 0 0 0 0 0 0 8 10 0 0 9 0 0 350 0 0 1 0 0 0 0 0 0 0 0 0 0 1 0 0 0 0 0 0 0 0 0 1 0 0 0 0 0 0 0 40 29 0 1 0 0 0 0 0 0 0 0 0 0 0 0 0 0 9 326 0 432 0 42 0 0 0 0 0 0 0 5 344 0 0 0 468 59 0 208 1 0 0 0 0 0 0 0 0 0 3 4177 1 26 2043 1 0 0 146 1 5 0 1 0 0 0 0 5862 0 0 24 47 0 0 0 0 0 0 0 0 0 0 0 0 0 0 1 0 1 0 0 0 0 0 0 0 0 0 2 0 0 0 0 0 0 0 0 0 0 0 0 0 0 0 0 0 0 0 0 0 0 0 1 0 0 0 0 0 12 0 21 0 0 0 0 0 0 0 0 0 0 0 0 21 0 0 0 0 0 0 0 0 0 0 0 0 0 0 0 0 0 0 0 0 1 0 0 1 0 0 0 0 0 0 0 0 1 2 0 0 0 0 0 0 0 0 0 0 0 0 0 0 0 0 0 0 0 0 0 0 0 0 1 0 0 0 0 0 0 0 0 0 0 0 0 0 0 0 0 0 1661 0 0 36 21 0 0 0 0 0 0 0 0 8 0 0 0 0 0 0 0 0 1 0 0 0 0 0 0 0 0 0 3 0 1 0 0 0 0 0 0 0 1 0 0 0 0 0 0 9 0 0 0 1 0 0 4 7 0 0 0 0 0 0 0 4 0 0 0 0 0 0 0 0 0 0 0 0 0 0 12 7 0 0 0 0 0 0 0 0 0 0 0 0 0 0 0 0 0 0 0 0 0 0 3 0 0 0 0 0 0 0 0 0 0 0 3 0 0 0 0 0 0 0 0 0 0 0 0 0 0 77 10 0 8 2 0 0 29 10 0 0 0 0 0 0 0 0 0 0 0 0 0 0 0 0 0 0 0 0 0 0 0 0 0 0 0 0 0 865 6 0 0 0 0 0 0 0 0 0 0 0 0 0 0 98 0 0 0 0 0 0 0 0 0 58 10 0 0 0 957 0 0 0 0 0 0 0 0 8 0 0 1 0 0 0 0 0 0 0 0 0 0 125 0 1 1 469 0 1 0 0 0 0 0 0 0 1 0 0 0 0 0 0 0 0 0 0 0 0 24 0 0 5 15 0 0 0 0 0 0 0 0 0 0 0 0 0 0 5 0 0 0 0 0 0 0 0 0 0 9 0 1 8 0 0 0 0 0 0 0 0 0 0 0 0 0 0 0 0 0 0 0 0 0 0 0 0 0 0 0 0 0 0 0 0 0 0 0 2 2 0 0 0 0 0 0 0 0 0 0 0 372 691 2 643 4 0 0 0 0 0 0 0 0 0 0 0 0 0 2 0 0 0 0 0 0 0 0 0 33 0 0 0 0 0 0 0 0 0 0 0 2 2823 4 72 1982 0 0 0 0 0 27 12 0 0 0 0 4 0 0 0 0 0 0 126 11 0 74 1611 0 0 0 0 0 3 0 0 0 0 0 0 0 0 0 0 0 0 0 214 0 0 3 40 0 4 0 0 0 0 3 74 0 SP121 Bacteria;Bacteroidetes;Bacteroidia;Bacteroidales;Prevotellaceae;Prevotella;sp. HMT309 8 0 0 15 0 0 0 0 0 11 277 0 9 0 0 1 28 0 324 42 0 1 14 8 4 5 0 0 0 0 1 25 0 41 3 14 17 0 6 0 189 0 2 23 1 0 0 0 0 0 71 24 89 0 166 0 67 25 0 0 1 0 6 0 17 0 0 515 7 30 0 1 1 6 0 0 7 5 5 0 120 0 0 4 82 3 1 16 0 374 0 131 0 0 19 0 0 0 0 34 4 18 0 21 0 0 0 0 0 3 0 1 420 0 122 0 4 251 86 0 2 27 0 32 14 0 225 13 109 0 0 0 0 0 98 0 0 5 0 1 0 0 0 0 0 27 3 18 74 0 52 0 15 0 1 0 34 0 0 0 0 0 1 0 0 23 1 1 0 0 0 0 0 0 15 0 0 1 0 0 1 0 0 0 57 0 0 0 5 20 0 0 17 0 48 3 18 0 1 2 0 1 113 17 0 143 0 0 1 0 57 0 8 0 0 6 5 14 0 0 2 60 7 1 193 1 0 0 0 134 0 0 1 0 0 9 9 5 39 0 1 0 332 0 0 1 17 0 0 0 163 0 0 9 0 0 9 0 0 43 8 100 0 249 0 0 7 22 0 0 0 0 0 1 0 0 0 0 6 0 2 6 64 1 1 0 4 0 0 0 0 0 0 0 0 0 0 1 0 1 0 0 20 23 1 0 3 0 0 0 0 0 2 0 7 0 5 0 0 4 0 0 3 0 5 0 0 0 0 0 0 1 0 0 0 0 0 0 0 0 0 0 0 0 0 0 0 0 0 0 0 0 0 0 0 0 0 0 0 0 0 0 0 0 0 0 0 0 0 0 0 0 2 0 0 0 0 0 0 0 0 0 0 0 0 0 0 1 0 0 0 0 0 0 0 0 0 0 0 0 0 0 0 0 0 0 0 0 0 0 0 0 0 0 0 0 0 0 23 0 0 1 1 4 0 0 0 0 0 0 0 0 0 0 0 0 0 0 0 0 2 0 0 0 0 0 0 0 0 0 42 4 1 0 0 0 0 0 0 3 0 0 0 0 33 0 0 1 0 0 0 0 0 0 0 0 1 1 0 0 0 0 5 3 0 14 0 0 0 0 2 0 10 3 1 0 0 0 0 0 6 0 0 0 0 0 0 0 0 5 6 42 0 0 0 0 1 0 0 0 0 0 0 0 0 0 0 0 0 0 0 0 0 0 0 0 0 0 0 0 0 0 3 1 0 0 0 8 0 15 3 0 0 0 0 0 0 0 93 0 0 13 3 2 8 2 0 0 0 0 0 0 0 0 0 0 0 0 0 0 0 0 0 0 0 0 0 0 0 0 54 0 2 0 0 1 0 0 0 0 0 3 0 0 0 0 0 0 0 0 0 0 0 0 0 0 0 0 0 0 0 0 0 0 0 1 0 0 0 0 0 0 0 0 0 2 1 0 0 0 0 0 0 2 0 0 0 6 2 2 0 0 0 0 0 31 14 0 0 2 7 0 0 4 2 0 1 0 0 0 0 0 0 0 0 0 0 0 0 0 0 0 0 0 0 0 0 0 0 0 0 0 0 0 0 0 0 0 2 0 0 0 0 0 0 0 1 0 4 1 0 0 1 0 0 0 0 0 0 2 0 0 0 0 0 4 0 0 0 0 8 9 0 0 0 0 0 0 0 0 0 2 2 0 0 0 0 0 0 0 0 0 0 0 0 0 0 0 0 0 1 0 0 0 0 0 0 0 0 23 0 0 1 1 0 0 0 0 0 1 0 0 0 3 0 0 0 0 0 0 0 0 0 0 0 0 0 0 125 0 0 0 0 0 0 0 0 0 2 0 0 0 0 0 0 0 0 0 0 0 0 2 0 1 0 0 5 0 0 0 0 0 0 0 0 0 0 0 0 0 0 0 0 0 0 0 0 0 0 0 0 1 0 3 0 0 7 0 0 0 0 0 0 35 0 0 1 0 0 0 0 0 0 0 6 0 1 0 0 0 0 0 0 0 10 0 0 0 0 0 0 3 0 0 0 0 0 0 1 0 0 0 0 0 0 0 0 0 1 1 0 0 0 0 0 0 0 0 0 1 0 0 0 0 0 0 0 0 0 0 0 0 3 3 0 1 0 5 0 2 1 0 0 0 0 0 13 0 0 0 6 0 41 0 0 0 0 0 0 0 0 0 0 5 0 0 0 0 0 0 14 1 0 2 0 0 4 2 4 4 0 0 1 0 0 0 0 11 4 0 0 0 2 0 0 0 7 0 0 0 0 0 0 7 0 4 0 0 0 0 0 0 0 0 0 0 0 0 0 0 0 0 0 0 0 0 0 0 4 1 1 0 0 0 3 96 0 0 1 0 0 0 2 0 0 0 0 14 0 2 0 0 6 14 0 4 0 1 0 0 0 0 1 0 0 59 0 1 0 0 1 1 0 0 0 0 0 0 0 0 5 0 0 0 0 0 0 0 0 2 0 10 1 0 2 0 0 0 14 0 0 0 0 0 0 0 0 0 0 0 0 3 1 0 0 0 5 10 0 1 0 0 3 0 1 0 3 4 0 0 0 0 3 0 0 4 2 0 0 1 0 0 0 0 1 1 0 0 0 0 4 0 0 11 32 0 1 0 0 0 0 0 0 0 0 0 0 5 0 0 1 2 1 9 0 0 1 0 1 0 0 2 0 0 0 0 0 1 0 1 9 1 4 0 0 0 0 1 0 0 0 0 0 6 0 2 1 1 0 1 4 0 1 0 0 0 0 2 0 0 11 4 10 1 9 0 72 1 0 13 0 0 0 2 8 0 5 2 10 0 1 0 0 0 0 1 0 0 0 11 0 0 0 1 0 0 0 0 0 0 1 0 0 0 0 0 0 0 0 1 0 2 0 0 2 0 1 0 0 0 0 0 0 0 5 22 0 0 3 0 0 1 2 7 1 1 1 0 0 10 0 5 1 0 0 0 0 0 22 0 0 0 0 4 2 20 0 1 0 0 0 0 0 0 0 7 0 0 0 1 3 0 1 2 0 1 1 5 2 0 4 0 2 2 9 0 0 0 0 0 0 0 0 0 2 0 0 0 0 1 0 0 1 2 3 0 14 0 0 0 0 0 0 0 2 0 0 0 0 1 0 4 1 0 1 0 0 1 0 1 0 0 0 0 0 0 1 0 0 0 1 5 27 0 0 0 0 0 0 0 2 0 0 7 19 0 2 0 0 0 0 0 0 0 0 0 2 9 0 0 16 0 0 104 0 1 0 2 0 0 20 0 0 2 11 0 0 3 9 1 0 8 0 0 0 0 0 0 20 0 0 1 5 0 7 0 0 21 20 1 0 1 0 0 0 0 0 0 0 0 15 0 0 0 0 0 0 2 21 85 0 0 2 1 1 0 0 0 0 0 0 4 3 2 0 29 1 0 0 0 0 0 0 0 1 1 2 0 1 7 0 0 10 0 0 15 0 0 1 1 1 0 4 0 0 5 0 0 2 0 0 0 0 0 0 0 1 2 0 0 0 21 0 0 0 0 0 0 0 0 1 0 0 0 0 0 0 0 10 0 0 0 0 0 0 0 1 15 5 0 2 2 2 0 0 1 1 0 1 0 0 1 0 0 2 0 6 1 0 1 0 0 0 0 0 0 0 0 0 0 0 0 0 28 0 1 2 0 2 0 0 7 0 1 0 0 0 0 0 0 0 0 0 9 0 0 0 0 0 0 0 0 9 1 1 0 1 1 1 0 0 0 0 0 0 0 0 0 0 0 0 6 0 0 4 1 0 0 0 0 9 1 51 0 3 0 0 20 0 8 0 0 0 0 0 0 5 2 0 0 0 0 1 0 0 0 1 7 0 0 0 0 0 4 0 0 1 0 2 0 0 0 2 2 0 0 0 4 1 0 2 11 0 0 0 0 0 0 0 34 0 17 0 0 63 4 4 3 0 20 0 0 0 0 1 0 0 9 0 0 0 11 0 0 3 34 1 0 0 0 0 0 0 21 8 1 0 0 0 8 3 0 1 0 37 1 4 0 0 5 1 0 0 0 1 0 8 0 6 1 0 2 324 7 0 0 0 0 0 0 0 0 0 0 0 2 0 1 0 0 0 0 0 0 3 1 0 1 0 0 0 0 0 0 SP122 Bacteria;Actinobacteria;Actinomycetia;Actinomycetales;Actinomycetaceae;Actinomyces;naeslundii 27 57 157 29 46 89 894 69 529 689 14 966 159 121 14 27 27 22 7 19 19 7 4 595 37 245 560 174 443 333 2 64 40 42 100 11 49 453 12 1 11 71 0 410 65 0 367 691 0 97 14 215 126 537 8 11 33 52 9 271 15 92 9 102 9 16 9 23 40 1 96 33 17 54 79 23 7 19 94 183 138 42 245 31 1 7 63 34 11 6 45 26 32 66 26 10 84 92 10 46 95 37 228 158 15 49 0 24 22 25 1444 170 105 42 13 3 5 19 22 9 89 12 7 454 6 22 9 38 95 364 27 39 51 318 1 28 0 194 1 4 219 45 1374 76 414 24 32 19 2 6 19 9 56 58 29 16 4 78 87 64 77 30 18 135 16 10 58 11 752 151 133 31 23 85 18 95 15 12 1 72 61 24 50 61 15 24 14 20 3 23 14 51 20 112 7 12 3 4 16 6 140 14 9 62 3 13 7 95 158 236 9 14 5 133 56 14 92 119 4 28 7 23 173 123 105 13 1 10 20 21 256 5 107 5 94 5 18 12 10 396 0 0 4 33 405 297 9 5 3 121 5 5 7 65 3 10 52 120 26 23 192 0 32 0 22 219 29 158 0 0 0 0 0 0 0 0 0 0 0 0 0 0 0 0 0 0 0 0 0 0 0 0 0 0 0 0 0 0 0 0 0 0 0 0 0 0 0 0 0 0 0 0 0 0 0 0 0 0 0 0 0 0 0 0 0 0 0 0 0 0 0 0 0 0 0 0 0 0 0 0 0 0 0 0 0 0 0 0 0 0 0 0 0 0 0 0 0 0 0 0 0 0 0 0 0 0 0 0 0 0 0 0 0 0 0 0 0 0 0 0 0 0 0 0 0 0 0 0 0 0 0 0 0 0 0 0 0 0 0 0 0 0 0 0 0 0 0 0 0 0 0 0 0 0 0 0 0 0 0 0 0 0 0 0 0 0 0 0 0 0 0 0 0 0 0 0 0 0 0 0 0 0 0 0 0 0 0 0 0 0 0 0 0 0 0 0 0 0 0 0 0 0 0 0 0 0 0 0 0 0 0 0 0 0 0 0 0 0 0 0 0 0 0 0 0 0 0 0 0 0 0 0 0 0 0 0 0 0 0 0 0 0 0 0 0 0 0 0 0 0 0 0 0 0 0 0 0 0 0 0 0 0 0 0 0 0 0 0 0 0 0 0 0 0 0 0 0 0 0 0 0 0 0 0 0 0 0 0 0 0 0 0 0 0 0 0 0 0 0 0 0 0 0 0 0 0 0 0 0 0 0 0 0 0 0 0 0 0 0 0 0 0 0 0 0 0 0 0 0 0 0 0 0 0 0 0 0 0 0 0 0 0 0 0 0 0 0 0 0 0 0 0 0 0 0 0 0 0 0 0 0 0 0 0 0 0 0 0 0 0 0 0 0 0 0 0 0 0 0 0 0 0 0 0 0 0 0 0 0 0 0 0 0 0 0 0 0 0 0 0 0 0 0 0 0 0 0 0 0 0 0 0 0 0 0 0 0 0 0 0 0 0 0 0 0 0 0 0 0 0 0 0 0 0 0 0 0 0 0 0 0 0 0 0 0 0 0 0 0 0 0 0 0 0 0 0 0 0 0 0 0 0 0 0 0 0 0 0 0 0 0 0 0 0 0 0 0 0 0 0 0 0 0 0 0 0 0 0 0 0 0 0 0 0 0 0 0 0 0 0 0 0 0 0 0 0 0 0 0 0 0 0 0 0 0 0 0 0 0 0 0 0 0 0 0 0 0 0 0 0 0 0 0 0 0 0 0 0 0 0 0 0 0 0 0 0 0 0 0 0 0 0 0 0 0 0 0 0 0 0 0 0 0 0 0 0 0 0 0 0 0 0 0 0 0 0 0 0 0 0 0 0 0 0 0 0 0 0 0 0 0 0 0 0 0 0 0 0 0 0 0 0 0 0 0 0 0 0 0 0 0 0 0 0 0 0 0 0 0 0 0 0 0 0 0 0 0 0 0 0 0 0 0 0 0 0 0 0 0 0 0 0 0 0 0 0 0 0 0 0 0 0 0 0 0 0 0 0 0 0 0 0 0 0 0 0 0 0 0 0 0 0 0 0 0 0 0 0 0 0 0 0 0 0 0 0 0 0 0 0 0 0 0 0 0 0 0 0 0 0 0 0 0 0 0 0 0 0 0 0 0 0 0 0 0 0 0 0 0 0 0 0 0 0 0 0 0 0 0 0 0 0 0 0 0 0 0 0 0 0 0 0 0 0 0 0 0 0 0 0 0 0 0 0 0 0 0 0 0 0 0 0 0 0 0 0 0 0 0 0 0 0 0 0 0 0 0 0 0 0 0 0 0 0 0 0 0 0 0 0 0 0 0 0 0 0 0 0 0 0 0 0 0 0 0 0 0 0 0 0 0 0 0 0 0 0 0 0 0 0 0 0 0 0 0 0 0 0 0 0 0 0 0 0 0 0 0 0 0 0 0 0 0 0 0 0 0 0 0 0 0 0 0 0 0 0 0 0 0 0 0 0 0 0 0 0 0 0 0 0 0 0 0 0 0 0 0 0 0 0 0 0 0 0 0 0 0 0 0 0 0 0 0 0 0 0 0 0 0 0 0 0 0 0 0 0 0 0 0 0 0 0 0 0 0 0 0 0 0 0 0 0 0 0 0 0 0 0 0 0 0 0 0 0 0 0 0 0 0 0 0 0 0 0 0 0 0 0 0 0 0 0 0 0 0 0 0 0 0 0 0 0 0 0 0 0 0 0 0 0 0 0 0 0 0 0 0 0 0 0 0 0 0 0 0 0 0 0 0 0 0 0 0 0 0 0 0 0 0 0 0 0 0 0 0 0 0 0 0 0 0 0 0 0 0 0 0 0 0 0 0 0 0 0 0 0 0 0 0 0 0 0 0 0 0 0 0 0 0 0 0 0 0 0 0 0 0 0 0 0 0 0 0 0 0 0 0 0 0 0 0 0 0 0 0 0 0 0 0 0 0 0 0 0 0 0 0 0 0 0 0 0 0 0 0 0 0 0 0 0 0 0 0 0 0 0 0 0 0 0 0 0 0 0 0 0 0 0 0 0 0 0 0 0 0 0 0 0 0 0 0 0 0 0 0 0 0 0 0 0 0 0 0 0 0 0 0 0 0 0 0 0 0 0 0 0 0 0 0 0 0 0 0 0 0 0 0 0 0 0 0 0 0 0 0 0 0 0 0 0 0 0 0 0 0 0 0 0 0 0 0 0 0 0 0 0 0 0 0 0 0 0 0 0 0 0 0 0 0 0 0 0 0 0 0 0 0 0 0 0 0 0 0 0 0 0 0 0 0 0 0 0 0 0 0 0 0 0 0 0 0 0 0 0 0 0 0 0 0 0 0 0 0 0 0 0 0 0 0 0 0 0 0 0 0 0 0 0 0 0 0 0 0 0 0 0 0 0 0 0 0 0 0 0 0 0 0 0 0 0 0 0 0 0 0 0 0 0 0 0 0 0 0 0 0 0 0 0 0 0 0 0 0 0 0 0 0 0 0 0 0 0 0 0 0 0 0 0 0 0 0 0 0 0 0 0 0 0 0 0 0 0 0 0 0 0 0 0 0 0 0 0 0 0 0 0 0 0 0 0 0 0 0 0 0 0 0 0 0 0 0 0 0 0 0 0 0 0 0 0 0 0 0 0 0 0 0 0 0 0 0 0 0 0 0 0 0 0 0 0 0 0 0 0 0 0 0 0 0 0 0 0 0 0 0 0 0 0 0 0 0 0 0 0 0 0 0 0 0 0 0 0 0 0 0 0 0 0 0 0 0 0 0 0 0 0 0 0 0 0 0 0 0 0 0 0 0 0 0 0 0 0 0 0 0 0 0 0 0 0 0 0 0 0 0 0 0 0 0 0 0 0 0 0 0 0 0 0 0 0 0 0 0 0 0 0 0 0 0 0 0 0 0 0 0 0 0 0 0 0 0 0 0 0 0 0 0 0 0 0 0 0 0 0 0 0 0 0 0 0 0 0 0 0 0 0 0 0 0 0 0 0 0 0 0 0 0 0 0 0 0 0 0 0 0 0 0 0 0 0 0 0 0 0 0 0 0 0 0 0 0 0 0 0 SP123 Bacteria;Firmicutes;Bacilli;Bacillales;Gemellaceae;Gemella;haemolysans 88 4879 217 863 107 5365 5179 1254 678 3861 1202 2996 725 2978 442 492 2389 3588 496 225 406 326 3432 1909 1263 222 2125 350 876 1630 1158 202 2656 224 1514 1022 513 3900 293 2282 1274 5261 408 1492 1797 1642 2522 236 8823 1017 931 458 438 111 2293 1035 828 1618 3038 2309 2717 2385 241 10517 562 4331 3501 316 5567 678 1730 3925 2758 819 1035 2192 1979 405 8764 3794 756 5085 1751 7470 280 930 244 834 8948 193 4172 628 5676 1856 970 745 9339 554 1395 2790 1422 2151 1753 337 9296 1346 2660 7071 1041 1264 3221 1162 1324 4680 3413 3233 620 2377 2815 3420 294 1373 264 999 657 2609 1103 1704 1557 9063 426 560 91 1335 881 7004 591 1479 128 1398 2586 9961 1784 3825 6028 3700 434 3032 1021 295 403 128 164 1189 1915 1659 1863 3180 605 1814 2269 4701 362 719 1360 1151 2109 2884 391 1094 3888 1750 2417 2153 55 123 1125 1057 1014 5602 1276 1691 2180 757 1562 657 1605 208 115 269 1179 331 2379 228 639 6801 194 2219 7038 352 4676 1037 769 1578 280 208 4528 282 1695 410 595 6739 195 311 356 918 4550 1564 7040 227 3294 6037 2460 1324 575 732 856 2946 2605 107 446 6413 1098 436 31 115 559 849 3492 1240 1255 305 365 887 3328 627 163 500 1420 894 235 376 135 134 54 68 436 60 2559 451 681 441 482 376 2309 22 624 65 0 0 0 0 0 0 0 0 0 0 0 0 0 0 0 0 0 0 0 0 0 0 0 0 0 0 0 0 0 0 0 0 0 0 0 0 0 0 0 0 0 0 0 0 0 0 0 0 0 0 0 0 0 0 0 0 0 0 0 0 0 0 0 0 0 0 0 0 0 0 0 0 0 0 0 0 0 0 0 0 0 0 0 0 0 0 0 0 0 0 0 0 0 0 0 0 0 0 0 0 0 0 0 0 0 0 0 0 0 0 0 0 0 0 0 0 0 0 0 0 0 0 0 0 0 0 0 0 0 0 0 0 0 0 0 0 0 0 0 0 0 0 0 0 0 0 0 0 0 0 0 0 0 0 0 0 0 0 0 0 0 0 0 0 0 0 0 0 0 0 0 0 0 0 0 0 0 0 0 0 0 0 0 0 0 0 0 0 0 0 0 0 0 0 0 0 0 0 0 0 0 0 0 0 0 0 0 0 0 0 0 0 0 0 0 0 0 0 0 0 0 0 0 0 0 0 0 0 0 0 0 0 0 0 0 0 0 0 0 0 0 0 0 0 0 0 0 0 0 0 0 0 0 0 0 0 0 0 0 0 0 0 0 0 0 0 0 0 0 0 0 0 0 0 0 0 0 0 0 0 0 0 0 0 0 0 0 0 0 0 0 0 0 0 0 0 0 0 0 0 0 0 0 0 0 0 0 0 0 0 0 0 0 0 0 0 0 0 0 0 0 0 0 0 0 0 0 0 0 0 0 0 0 0 0 0 0 0 0 0 0 0 0 0 0 0 0 0 0 0 0 0 0 0 0 0 0 0 0 0 0 0 0 0 0 0 0 0 0 0 0 0 0 0 0 0 0 0 0 0 0 0 0 0 0 0 0 0 0 0 0 0 0 0 0 0 0 0 0 0 0 0 0 0 0 0 0 0 0 0 0 0 0 0 0 0 0 0 0 0 0 0 0 0 0 0 0 0 0 0 0 0 0 0 0 0 0 0 0 0 0 0 0 0 0 0 0 0 0 0 0 0 0 0 0 0 0 0 0 0 0 0 0 0 0 0 0 0 0 0 0 0 0 0 0 0 0 0 0 0 0 0 0 0 0 0 0 0 0 0 0 0 0 0 0 0 0 0 0 0 0 0 0 0 0 0 0 0 0 0 0 0 0 0 0 0 0 0 0 0 0 0 0 0 0 0 0 0 0 0 0 0 0 0 0 0 0 0 0 0 0 0 0 0 0 0 0 0 0 0 0 0 0 0 0 0 0 0 0 0 0 0 0 0 0 0 0 0 0 0 0 0 0 0 0 0 0 0 0 0 0 0 0 0 0 0 0 0 0 0 0 0 0 0 0 0 0 0 0 0 0 0 0 0 0 0 0 0 0 0 0 0 0 0 0 0 0 0 0 0 0 0 0 0 0 0 0 0 0 0 0 0 0 0 0 0 0 0 0 0 0 0 0 0 0 0 0 0 0 0 0 0 0 0 0 0 0 0 0 0 0 0 0 0 0 0 0 0 0 0 0 0 0 0 0 0 0 0 0 0 0 0 0 0 0 0 0 0 0 0 0 0 0 0 0 0 0 0 0 0 0 0 0 0 0 0 0 0 0 0 0 0 0 0 0 0 0 0 0 0 0 0 0 0 0 0 0 0 0 0 0 0 0 0 0 0 0 0 0 0 0 0 0 0 0 0 0 0 0 0 0 0 0 0 0 0 0 0 0 0 0 0 0 0 0 0 0 0 0 0 0 0 0 0 0 0 0 0 0 0 0 0 0 0 0 0 0 0 0 0 0 0 0 0 0 0 0 0 0 0 0 0 0 0 0 0 0 0 0 0 0 0 0 0 0 0 0 0 0 0 0 0 0 0 0 0 0 0 0 0 0 0 0 0 0 0 0 0 0 0 0 0 0 0 0 0 0 0 0 0 0 0 0 0 0 0 0 0 0 0 0 0 0 0 0 0 0 0 0 0 0 0 0 0 0 0 0 0 0 0 0 0 0 0 0 0 0 0 0 0 0 0 0 0 0 0 0 0 0 0 0 0 0 0 0 0 0 0 0 0 0 0 0 0 0 0 0 0 0 0 0 0 0 0 0 0 0 0 0 0 0 0 0 0 0 0 0 0 0 0 0 0 0 0 0 0 0 0 0 0 0 0 0 0 0 0 0 0 0 0 0 0 0 0 0 0 0 0 0 0 0 0 0 0 0 0 0 0 0 0 0 0 0 0 0 0 0 0 0 0 0 0 0 0 0 0 0 0 0 0 0 0 0 0 0 0 0 0 0 0 0 0 0 0 0 0 0 0 0 0 0 0 0 0 0 0 0 0 0 0 0 0 0 0 0 0 0 0 0 0 0 0 0 0 0 0 0 0 0 0 0 0 0 0 0 0 0 0 0 0 0 0 0 0 0 0 0 0 0 0 0 0 0 0 0 0 0 0 0 0 0 0 0 0 0 0 0 0 0 0 0 0 0 0 0 0 0 0 0 0 0 0 0 0 0 0 0 0 0 0 0 0 0 0 0 0 0 0 0 0 0 0 0 0 0 0 0 0 0 0 0 0 0 0 0 0 0 0 0 0 0 0 0 0 0 0 0 0 0 0 0 0 0 0 0 0 0 0 0 0 0 0 0 0 0 0 0 0 0 0 0 0 0 0 0 0 0 0 0 0 0 0 0 0 0 0 0 0 0 0 0 0 0 0 0 0 0 0 0 0 0 0 0 0 0 0 0 0 0 0 0 0 0 0 0 0 0 0 0 0 0 0 0 0 0 0 0 0 0 0 0 0 0 0 0 0 0 0 0 0 0 0 0 0 0 0 0 0 0 0 0 0 0 0 0 0 0 0 0 0 0 0 0 0 0 0 0 0 0 0 0 0 0 0 0 0 0 0 0 0 0 0 0 0 0 0 0 0 0 0 0 0 0 0 0 0 0 0 0 0 0 0 0 0 0 0 0 0 0 0 0 0 0 0 0 0 0 0 0 0 0 0 0 0 0 0 0 0 0 0 0 0 0 0 0 0 0 0 0 0 0 0 0 0 0 0 0 0 0 0 0 0 0 0 0 0 0 0 0 0 0 0 0 0 0 0 0 0 0 0 0 0 0 0 0 0 0 0 0 0 0 0 0 0 0 0 0 0 0 0 0 0 0 0 0 0 0 0 0 0 0 0 0 0 0 0 0 0 0 0 0 0 0 0 0 0 0 0 0 0 0 0 0 0 0 0 0 0 0 0 0 0 0 0 0 0 0 0 0 0 0 0 0 0 0 0 0 0 0 0 0 0 0 0 0 0 0 0 0 0 0 0 0 0 0 0 0 0 0 0 0 0 0 0 0 0 0 0 0 0 0 0 0 0 0 0 0 0 0 0 0 0 0 0 0 0 0 0 0 0 0 0 0 0 0 0 0 0 0 0 0 0 0 0 0 0 0 0 0 0 0 0 0 0 0 0 0 0 0 0 0 0 0 0 0 0 0 0 0 0 0 0 0 0 0 0 0 0 0 0 0 0 0 0 0 0 SP124 Bacteria;Firmicutes;Negativicutes;Selenomonadales;Selenomonadaceae;Selenomonas;sp. HMT136 18 1 11 16 1 38 0 118 7 15 46 2 46 0 1 8 17 0 30 72 65 2 15 2 54 12 0 48 0 0 20 27 0 35 38 28 39 1 8 0 43 2 6 59 27 47 18 11 2 4 270 274 135 1 88 11 165 9 0 12 0 0 0 0 275 1 0 362 18 18 6 7 6 2 20 0 28 62 2 2 5 28 1 5 40 44 10 34 0 502 2 7 0 0 8 0 0 0 0 32 2 22 13 16 0 0 54 0 7 2 0 4 35 15 131 0 68 153 131 4 187 4 67 27 136 0 152 112 159 8 26 75 5 4 16 9 1408 35 9 0 1 0 1 2 0 65 76 31 104 1 270 6 25 2 0 20 465 4 14 16 0 0 37 1 1 12 0 20 1 1 4 0 1 5 82 14 6 7 0 0 57 0 10 48 110 5 70 3 3 108 0 2 39 0 53 1 79 132 7 5 0 9 549 6 12 343 0 0 0 0 61 2 8 2 0 46 3 16 0 5 14 18 21 5 530 1 281 0 0 556 72 0 24 1 45 165 107 57 7 11 9 1 511 0 1 54 45 4 205 5 195 0 5 13 3 10 19 3 3 2 8 110 11 43 8 64 186 101 0 0 0 0 0 0 0 0 0 0 0 0 0 0 0 0 0 0 0 0 0 0 0 0 0 0 0 0 0 0 0 0 0 0 0 0 0 0 0 0 0 0 0 0 0 0 0 0 0 0 0 0 0 0 0 0 0 0 0 0 0 0 0 0 0 0 0 0 0 0 0 0 0 0 0 0 0 0 0 0 0 0 0 0 0 0 0 0 0 0 0 0 0 0 0 0 0 0 0 0 0 0 0 0 0 0 0 0 0 0 0 0 0 0 0 0 0 0 0 0 0 0 0 0 0 0 0 0 0 0 0 0 0 0 0 0 0 0 0 0 0 0 0 0 0 0 0 0 0 0 0 0 0 0 0 0 0 0 0 0 0 0 0 0 0 0 0 0 0 0 0 0 0 0 0 0 0 0 0 0 0 0 0 0 0 0 0 0 0 0 0 0 0 0 0 0 0 0 0 0 0 0 0 0 0 0 0 0 0 0 0 0 0 0 0 0 0 0 0 0 0 0 0 0 0 0 0 0 0 0 0 0 0 0 0 0 0 0 0 0 0 0 0 0 0 0 0 0 0 0 0 0 0 0 0 0 0 0 0 0 0 0 0 0 0 0 0 0 0 0 0 0 0 0 0 0 0 0 0 0 0 0 0 0 0 0 0 0 0 0 0 0 0 0 0 0 0 0 0 0 0 0 0 0 0 0 0 0 0 0 0 0 0 0 0 0 0 0 0 0 0 0 0 0 0 0 0 0 0 0 0 0 0 0 0 0 0 0 0 0 0 0 0 0 0 0 0 0 0 0 0 0 0 0 0 0 0 0 0 0 0 0 0 0 0 0 0 0 0 0 0 0 0 0 0 0 0 0 0 0 0 0 0 0 0 0 0 0 0 0 0 0 0 0 0 0 0 0 0 0 0 0 0 0 0 0 0 0 0 0 0 0 0 0 0 0 0 0 0 0 0 0 0 0 0 0 0 0 0 0 0 0 0 0 0 0 0 0 0 0 0 0 0 0 0 0 0 0 0 0 0 0 0 0 0 0 0 0 0 0 0 0 0 0 0 0 0 0 0 0 0 0 0 0 0 0 0 0 0 0 0 0 0 0 0 0 0 0 0 0 0 0 0 0 0 0 0 0 0 0 0 0 0 0 0 0 0 0 0 0 0 0 0 0 0 0 0 0 0 0 0 0 0 0 0 0 0 0 0 0 0 0 0 0 0 0 0 0 0 0 0 0 0 0 0 0 0 0 0 0 0 0 0 0 0 0 0 0 0 0 0 0 0 0 0 0 0 0 0 0 0 0 0 0 0 0 0 0 0 0 0 0 0 0 0 0 0 0 0 0 0 0 0 0 0 0 0 0 0 0 0 0 0 0 0 0 0 0 0 0 0 0 0 0 0 0 0 0 0 0 0 0 0 0 0 0 0 0 0 0 0 0 0 0 0 0 0 0 0 0 0 0 0 0 0 0 0 0 0 0 0 0 0 0 0 0 0 0 0 0 0 0 0 0 0 0 0 0 0 0 0 0 0 0 0 0 0 0 0 0 0 0 0 0 0 0 0 0 0 0 0 0 0 0 0 0 0 0 0 0 0 0 0 0 0 0 0 0 0 0 0 0 0 0 0 0 0 0 0 0 0 0 0 0 0 0 0 0 0 0 0 0 0 0 0 0 0 0 0 0 0 0 0 0 0 0 0 0 0 0 0 0 0 0 0 0 0 0 0 0 0 0 0 0 0 0 0 0 0 0 0 0 0 0 0 0 0 0 0 0 0 0 0 0 0 0 0 0 0 0 0 0 0 0 0 0 0 0 0 0 0 0 0 0 0 0 0 0 0 0 0 0 0 0 0 0 0 0 0 0 0 0 0 0 0 0 0 0 0 0 0 0 0 0 0 0 0 0 0 0 0 0 0 0 0 0 0 0 0 0 0 0 0 0 0 0 0 0 0 0 0 0 0 0 0 0 0 0 0 0 0 0 0 0 0 0 0 0 0 0 0 0 0 0 0 0 0 0 0 0 0 0 0 0 0 0 0 0 0 0 0 0 0 0 0 0 0 0 0 0 0 0 0 0 0 0 0 0 0 0 0 0 0 0 0 0 0 0 0 0 0 0 0 0 0 0 0 0 0 0 0 0 0 0 0 0 0 0 0 0 0 0 0 0 0 0 0 0 0 0 0 0 0 0 0 0 0 0 0 0 0 0 0 0 0 0 0 0 0 0 0 0 0 0 0 0 0 0 0 0 0 0 0 0 0 0 0 0 0 0 0 0 0 0 0 0 0 0 0 0 0 0 0 0 0 0 0 0 0 0 0 0 0 0 0 0 0 0 0 0 0 0 0 0 0 0 0 0 0 0 0 0 0 0 0 0 0 0 0 0 0 0 0 0 0 0 0 0 0 0 0 0 0 0 0 0 0 0 0 0 0 0 0 0 0 0 0 0 0 0 0 0 0 0 0 0 0 0 0 0 0 0 0 0 0 0 0 0 0 0 0 0 0 0 0 0 0 0 0 0 0 0 0 0 0 0 0 0 0 0 0 0 0 0 0 0 0 0 0 0 0 0 0 0 0 0 0 0 0 0 0 0 0 0 0 0 0 0 0 0 0 0 0 0 0 0 0 0 0 0 0 0 0 0 0 0 0 0 0 0 0 0 0 0 0 0 0 0 0 0 0 0 0 0 0 0 0 0 0 0 0 0 0 0 0 0 0 0 0 0 0 0 0 0 0 0 0 0 0 0 0 0 0 0 0 0 0 0 0 0 0 0 0 0 0 0 0 0 0 0 0 0 0 0 0 0 0 0 0 0 0 0 0 0 0 0 0 0 0 0 0 0 0 0 0 0 0 0 0 0 0 0 0 0 0 0 0 0 0 0 0 0 0 0 0 0 0 0 0 0 0 0 0 0 0 0 0 0 0 0 0 0 0 0 0 0 0 0 0 0 0 0 0 0 0 0 0 0 0 0 0 0 0 0 0 0 0 0 0 0 0 0 0 0 0 0 0 0 0 0 0 0 0 0 0 0 0 0 0 0 0 0 0 0 0 0 0 0 0 0 0 0 0 0 0 0 0 0 0 0 0 0 0 0 0 0 0 0 0 0 0 0 0 0 0 0 0 0 0 0 0 0 0 0 0 0 0 0 0 0 0 0 0 0 0 0 0 0 0 0 0 0 0 0 0 0 0 0 0 0 0 0 0 0 0 0 0 0 0 0 0 0 0 0 0 0 0 0 0 0 0 0 0 0 0 0 0 0 0 0 0 0 0 0 0 0 0 0 0 0 0 0 0 0 0 0 0 0 0 0 0 0 0 0 0 0 0 0 0 0 0 0 0 0 0 0 0 0 0 0 0 0 0 0 0 0 0 0 0 0 0 0 0 0 0 0 0 0 0 0 0 0 0 0 0 0 0 0 0 0 0 0 0 0 0 0 0 0 0 0 0 0 0 0 0 0 0 0 0 0 0 0 0 0 0 0 0 0 0 0 0 0 0 0 0 0 0 0 0 0 0 0 0 0 0 0 SP125 Bacteria;Firmicutes;Clostridia;Negativicutes;Veillonellaceae;Veillonella;sp. HMT780 1 91 0 9 1 19 18 8 164 219 12 560 38 15 8 13 70 0 0 5 4 0 14 1 24 6 0 1 35 173 81 14 50 3 12 10 110 43 0 325 0 204 0 45 6 19 243 4 418 0 27 1 11 4 2 27 38 146 33 15 4 100 2 469 14 48 20 7 21 0 83 9 3 83 2 22 237 1 67 0 9 101 3 75 2 12 9 45 9 7 39 10 135 97 16 1 113 41 117 88 74 73 15 6 69 30 20 0 0 0 7 5 10 0 16 173 5 1 21 12 9 20 3 124 1 3 13 1 3 1 1 0 2 13 82 100 9 15 68 0 867 33 1 8 1 27 88 64 9 0 0 0 0 1 1 5 2 34 0 0 0 35 56 84 6 18 0 2 144 58 0 2 21 23 0 0 3 3 24 71 0 5 29 19 5 42 55 1 2 5 95 6 286 0 133 76 1 10 32 16 19 28 13 17 4 27 18 0 15 54 9 19 6 1 2 3 120 2 108 0 160 41 111 3 35 1 28 175 0 0 9 6 19 0 1 0 25 35 9 194 21 0 0 6 1 14 18 0 15 0 2 4 0 1 0 1 3 0 0 3 27 3 2 6 702 3 26 11 2 7 12 631 16 0 13 38 18 12 18 40 17 0 22 34 13 20 58 31 7 20 56 0 13 0 5 8 0 10 0 6 42 31 87 96 63 0 17 4 7 3 2 15 3 12 23 6 29 14 22 17 5 0 52 0 0 0 10 0 5 0 12 5 74 2 3 9 1 6 5 4 8 71 0 0 21 28 90 0 3 1 3 6 4 19 22 25 26 7 0 0 0 5 12 20 9 20 0 0 1 1 2 5 56 141 64 21 4 152 25 69 0 0 2 3 12 12 17 8 0 0 9 3 0 2 38 4 14 8 5 11 6 5 9 65 0 2 1 1 8 8 26 18 31 3 8 298 2 0 6 3 0 4 13 1 632 37 78 19 17 0 57 4 20 78 3 1 1 221 18 25 3 4 1 0 23 10 0 0 1 193 6 0 126 101 4 165 0 269 52 9 7 8 70 18 26 3 0 4 15 2 5 8 3 0 1 5 86 23 6 0 8 1 121 7 151 41 2 4 19 57 0 84 8 61 107 1629 1 64 256 8 44 19 75 0 8 30 3 41 7 0 3 2 15 3 309 9 0 3 12 11 171 55 7 3 24 12 3 1 5 3 0 4 15 7 2 0 41 4 18 27 24 3 13 58 0 4 7 16 5 24 3 2 14 5 15 6 34 54 65 5 0 30 2 2 0 37 0 26 5 1 1 3 8 8 11 0 8 88 14 0 69 1 2 422 7 10 4 741 8 0 5 107 0 117 0 13 609 7 0 1 0 3 181 1 10 28 0 5 30 5 30 129 5 2 10 3 0 0 1 3 62 0 60 3 130 14 23 15 2 7 4 2 32 167 13 23 6 53 36 153 82 31 26 0 1 3 0 1 27 38 12 412 18 69 186 6 9 51 8 0 0 1 8 10 539 3 18 0 1 6 2 0 0 5 9 2 39 2 5 55 207 63 23 5 128 2 4 62 1 20 0 602 21 21 53 0 20 44 25 18 90 8 17 48 89 0 9 22 13 17 9 27 39 2 409 0 8 15 0 2 5 0 6 1 2 250 80 34 0 12 0 5 6 2 4 30 78 3 10 10 0 1 88 0 0 7 5 1 9 1 48 3 5 3 38 2 5 63 75 4 26 39 108 0 9 4 1 2 38 21 12 4 34 9 523 0 109 0 97 103 15 0 7 14 4 4 3 0 0 52 25 17 3 8 8 0 12 0 18 5 6 3 17 1 113 10 27 52 48 3 23 5 22 16 5 40 1 0 17 133 18 12 14 15 1 0 140 1 6 2 2 21 3 2 2 0 40 1 15 0 11 1 3 17 2 4 68 4 166 12 1 27 13 14 23 3 99 25 5 4 2 3 8 4 75 62 17 13 51 184 14 14 110 4 50 7 33 0 9 304 2 25 31 0 0 19 21 0 10 40 11 0 1229 0 10 63 7 85 10 31 18 155 10 41 6 2 86 7 35 70 0 9 0 36 1 4 0 3 39 63 1 0 43 59 4 0 28 2 12 3 10 4 1 13 35 32 165 16 16 8 24 4 49 4 83 4 18 100 1 48 16 48 16 61 97 132 15 4 44 169 1 17 15 25 2 5 1 0 13 601 0 1 15 19 54 3 33 51 4 22 4 8 18 0 9 12 0 7 44 11 61 22 13 2 2 3 55 342 4 9 8 2 8 50 2 2 1 0 14 0 1 11 3 2 215 111 47 0 11 3 3 48 11 25 1 60 20 276 700 1242 95 721 123 277 2335 262 93 22 213 829 18 744 46 0 10 253 7 103 22 104 2 232 1543 124 646 3862 163 486 2445 1499 242 122 1503 2890 101 24 1094 164 341 1214 581 178 570 223 0 0 64 772 22 0 1450 426 321 3691 130 166 51 282 339 9 294 468 45 17 7 149 17 6 119 0 183 783 20 31 32 878 304 284 64 18 4 235 19 9 823 2 8 65 7 127 70 4 15 12 12 680 10 108 1782 3 32 63 6 10 63 772 43 82 252 959 1 950 0 6 143 76 1505 7 4 1034 119 942 31 21 99 1455 521 65 30 955 879 141 279 571 55 324 539 54 50 79 786 124 104 36 238 8 26 52 1 242 82 1 1 74 13 32 84 44 259 4 124 945 0 34 307 2734 45 446 281 26 328 250 5 108 943 9 1176 4 398 2720 239 46 865 245 266 46 191 103 152 678 1577 1370 204 780 15 64 3002 17 396 138 1423 160 46 2166 225 431 1678 461 239 83 2577 57 81 182 52 0 1206 29 204 1108 42 0 4 63 100 14 519 2 3795 65 694 2090 0 12 73 1088 27 52 1244 37 310 2385 103 70 783 11 64 19 2274 2 8 525 35 238 1104 1576 23 396 831 2372 35 209 1422 17 17 2260 41 74 1000 1484 58 2848 3537 6 116 876 171 99 100 20 60 68 2343 449 685 252 60 195 182 6 305 157 0 1225 100 881 583 283 296 2 17 546 0 37 1617 30 81 1754 294 79 422 432 0 23 551 14 6 341 3 0 4 34 369 127 166 956 28 565 1715 110 151 108 0 9 14 135 111 1 175 112 238 116 156 165 74 846 7 5 9 35 275 162 1338 380 0 106 879 739 286 430 48 0 92 447 395 58 40 57 121 48 22 103 122 10 6 100 4 3 197 546 56 48 105 311 1 28 95 7 38 5 6 1 192 61 87 106 252 1 22 2 0 3 163 12 138 207 708 177 340 90 237 29 82 1 24 2 652 9 249 666 670 478 154 9 136 193 350 196 76 56 374 197 0 2 3 52 63 350 21 352 120 23 274 18 551 76 353 410 84 141 431 29 391 49 1949 191 812 385 4 22 1124 97 3 4 55 40 347 209 23 276 2065 4 36 6 106 2 17 29 1550 39 389 70 1 15 2730 30 40 1495 26 2 1430 715 81 80 1142 58 49 179 115 294 3779 1014 0 76 978 3 91 5 44 83 7 21 5 182 203 94 903 355 45 195 299 150 52 110 744 3 36 145 62 36 2 44 284 16 14 117 1193 534 27 415 3 38 245 24 212 131 194 560 324 1774 60 1851 1711 417 288 2690 29 57 586 1765 94 55 1386 137 165 966 12 586 2327 163 150 71 493 375 2 28 20 4 25 431 120 1407 627 144 44 71 4364 6 421 11 409 1114 368 160 80 105 29 168 54 2043 0 8 365 22 10 3 743 288 127 104 278 15 138 688 3 742 139 3 183 289 575 1 672 811 4 28 74 173 166 590 0 130 581 171 22 169 533 16 370 244 554 199 336 1 1 1828 71 81 403 82 6 602 301 72 144 31 2 187 184 96 101 1 311 12 9 6 12 57 294 2148 187 19 241 312 56 1000 92 770 442 8 0 33 49 3 0 153 2 1 285 6 52 36 346 12 336 31 3 1 63 252 194 3 2 6 0 182 9 293 4 25 586 293 28 6 3 1026 560 21 3 2 661 17 589 560 4 124 921 287 1 61 115 484 1205 122 418 299 345 104 1920 128 0 106 46 314 64 957 2 482 400 20 65 355 82 572 20 75 173 321 1276 201 151 590 606 84 861 1276 352 55 3 1085 9 21 224 776 60 47 152 12 49 83 21 141 352 52 280 2717 787 179 67 180 265 1632 322 1831 SP128 Bacteria;Actinobacteria;Actinomycetia;Actinomycetales;Actinomycetaceae;Actinomyces;graevenitzii 197 0 12 974 12 1808 0 10747 24 65 351 153 189 12 38 419 0 4 1246 3809 189 450 62 544 615 1750 0 906 25 5 39 1470 1 44 1063 411 710 80 983 31 265 6 28 432 31 255 39 10 88 26 402 2539 149 3 374 10 820 80 10 217 227 23 0 2 556 10 0 346 37 143 1192 220 28 5360 9 17 116 179 565 88 1584 52 30 60 264 378 297 903 105 1005 0 82 1 11 8848 397 1 0 3 1094 197 13 23 21 0 18 95 7 828 35 2 55 147 70 967 3 27 145 989 183 368 653 44 615 100 457 936 399 3969 1 18 20 137 29 93 4 491 2704 33 65 256 12 162 0 6 1812 202 209 7534 1 7860 157 260 334 243 370 2765 188 24 1204 21 4 9 79 61 124 4 34 12 212 2 23 58 65 442 425 121 102 1 196 1 41 156 376 827 46 238 76 0 169 708 140 255 373 160 34 0 303 160 25 1 66 0 44 203 1635 3 2 8 1 355 35 97 23 33 29 6 253 1 6 2522 0 3 29 335 54 30 34 50 769 1917 0 38 2 97 1810 69 91 208 62 88 31 1281 0 11 507 453 90 256 0 175 1 85 3817 9 25 5978 224 162 347 389 90 43 83 49 167 54 5478 0 0 0 0 0 0 0 0 0 0 0 1 0 0 0 0 1 0 1 0 0 0 0 0 0 0 0 0 0 0 0 0 0 22 0 0 1 0 0 0 0 0 0 0 0 0 0 0 0 0 0 0 0 0 0 0 0 0 0 0 0 0 0 1 0 0 0 0 0 1 0 0 0 0 0 0 0 0 0 1 0 0 0 0 0 1 12 0 0 0 0 0 0 0 0 0 0 0 0 1 0 0 0 0 0 0 0 0 2 0 1 0 0 0 0 0 0 0 0 0 0 0 0 1 0 0 0 0 0 0 1 0 1 0 0 1 0 0 0 0 0 0 0 0 1 0 0 0 0 0 0 2 0 0 0 1 0 0 0 1 0 0 0 0 0 0 0 0 0 1 0 1 0 0 0 0 0 0 0 7 0 0 0 0 0 0 0 0 0 1 1 0 0 0 1 0 1 0 0 0 0 0 1 0 1 0 0 0 0 1 0 0 0 0 0 3 0 0 1 0 0 0 0 0 0 0 0 0 0 0 3 0 0 1 0 0 0 0 2 0 1 0 0 0 0 0 1 0 0 0 0 0 2 0 0 0 0 0 0 0 0 0 0 1 3 0 0 0 0 0 0 1 0 0 0 0 0 0 0 0 0 0 0 0 0 0 0 0 0 0 0 1 0 0 0 0 0 0 0 0 0 0 0 0 0 3 0 0 0 0 0 0 0 1 0 0 0 0 0 0 0 2 0 0 0 0 1 0 0 0 0 0 0 0 0 0 0 0 0 1 0 0 0 0 0 0 0 0 0 0 0 0 1 0 0 0 0 0 0 0 0 0 0 1 0 0 0 0 0 0 1 4 0 0 0 0 0 0 0 2 0 0 0 0 0 1 0 0 0 0 0 2 5 0 4 0 0 0 1 0 0 0 0 1 0 0 0 0 0 0 0 1 3 2 0 2 2 0 0 0 0 0 0 7 0 0 0 1 0 0 1 0 0 0 0 0 0 0 0 0 0 0 6 0 1 0 0 0 0 0 0 0 0 0 0 0 0 3 0 0 0 0 0 0 0 0 0 2 0 0 0 0 0 0 1 0 0 0 0 0 0 0 0 0 0 0 0 0 0 0 1 0 0 0 0 0 0 0 0 0 0 0 0 0 0 0 1 0 0 0 0 1 0 1 0 3 0 0 0 0 0 0 10 0 0 0 0 0 0 0 0 0 0 1 0 0 4 0 0 0 0 0 0 0 0 1 0 0 0 0 0 0 0 0 1 1 0 0 0 0 0 0 0 0 0 0 0 3 0 0 0 0 0 0 1 0 0 0 0 0 0 0 0 0 0 3 0 0 2 0 0 0 0 0 0 0 0 0 0 0 0 0 0 0 0 0 0 0 0 1 0 1 1 5 1 0 0 0 0 0 0 0 0 1 5 0 0 0 0 0 0 0 0 0 0 0 0 0 0 0 0 0 0 0 0 0 2 0 0 0 0 0 0 0 0 0 0 0 0 0 0 1 0 0 1 0 0 0 0 0 0 0 0 0 0 0 0 0 0 1 0 0 0 0 0 0 1 0 0 5 1 0 0 0 2 0 0 0 1 0 0 0 2 0 7 0 0 0 0 1 0 0 1 0 0 0 0 0 0 0 0 0 0 0 0 0 0 0 0 0 0 1 2 0 0 0 0 0 0 0 10 0 0 0 0 1 0 0 0 0 0 1 0 2 0 0 0 0 2 2 1 2 0 0 3 0 1 28 0 1 0 1 5 0 2 0 0 0 4 1 0 3 19 0 0 0 16 7 0 1 0 0 0 0 35 3 0 1 1 2 1 5 3 2 0 0 0 1 0 0 5 0 0 0 1 0 0 2 0 0 3 2 1 3 0 0 1 0 0 1 4 1 0 17 0 0 6 1 0 0 1 0 0 3 0 0 0 1 0 2 1 3 0 0 1 0 0 56 0 2 0 0 0 31 0 0 5 5 2 0 17 0 52 1 0 0 0 3 0 0 0 0 0 0 1 114 24 5 7 0 0 1 3 2 3 1 1 0 0 69 1 0 10 50 2 2 1 0 2 0 0 0 0 1 1 7 0 0 2 2 0 0 1 0 1 0 8 20 0 0 1 4 3 0 2 4 0 3 1 2 3 23 0 11 2 1 0 0 2 1 0 0 0 1 0 1 25 0 4 0 1 1 8 0 0 1 0 3 2 0 0 0 0 0 0 0 1 0 3 2 2 14 0 1 27 3 1 0 0 0 1 1 0 7 0 0 0 0 2 2 0 8 1 17 0 1 0 0 0 0 8 2 0 9 0 0 0 21 0 13 2 1 0 1 5 3 3 20 1 0 3 5 0 1 1 0 0 0 1 18 4 0 4 0 0 9 7 2 2 4 0 0 7 452 0 0 0 0 1 1 8 20 20 0 0 3 0 1 0 0 0 0 5 0 0 36 13 0 0 13 0 0 0 0 0 0 2 0 4 0 0 0 0 0 0 0 2 0 13 4 0 1 1 0 0 2 1 5 0 2 0 25 0 14 0 7 0 0 1 0 0 0 0 3 0 0 0 0 0 0 0 0 1 9 27 0 1 0 1 0 0 0 16 1 0 3 0 0 0 1 0 0 0 0 0 0 0 1 16 14 0 1 4 0 1 136 0 1 0 1 0 116 1 1 0 10 15 0 13 50 4 0 1 0 0 0 1 4 1 3 0 0 0 1 0 4 105 0 0 31 18 5 0 6 2 0 3 0 0 1 0 0 3 0 0 0 0 0 0 5 234 3 0 13 6 1 0 0 0 1 0 0 2 3 0 2 0 0 0 3 0 0 2 2 10 5 16 0 0 0 0 1 0 3 0 0 0 1 13 17 0 2 0 0 3 0 0 0 1 2 3 8 0 0 0 0 0 1 126 4 0 0 0 0 0 0 1 1 0 0 2 0 2 1 1 0 0 1 0 1 0 0 3 0 0 0 0 0 8 1 4 0 7 14 2 0 0 0 0 0 1 0 1 2 0 0 0 1 0 1 0 37 2 2 1 2 1 1 0 1 0 2 2 0 6 3 2 2 0 0 1 0 0 3 8 0 0 2 0 0 0 0 0 0 2 0 1 0 2 7 0 0 3 0 0 2 2 1 1 0 3 5 0 2 0 17 0 0 0 0 0 1 0 4 7 4 4 2 0 0 0 3 2 1 8 0 0 8 0 1 0 0 1 0 1 0 0 0 1 0 1 0 0 0 0 0 1 0 6 0 1 9 0 0 0 4 1 0 1 0 0 1 3 1 0 1 7 0 0 4 4 0 0 1 0 0 1 0 1 2 5 9 4 0 0 0 48 0 1 1 0 22 0 2 3 1 0 1 0 33 5 0 0 0 3 7 3 8 0 0 2 0 1 0 1 0 0 0 0 0 0 0 3 2 1 0 1 2 3 0 1 0 0 0 1 1 9 1 0 1 0 4 0 2 37 17 0 0 0 4 0 0 0 3 0 0 9 11 0 0 4 0 0 0 4 1 38 1 0 0 6 0 0 0 0 0 SP129 Bacteria;Fusobacteria;Fusobacteria;Fusobacteriales;Fusobacteriaceae;Fusobacterium;periodonticum 54 2832 19 23 18 76 2 139 6 95 257 399 2197 135 2732 93 133 121 1234 237 1457 80 27 150 2249 298 8 348 355 265 3454 1419 56 5065 1200 904 111 90 3350 181 11627 394 6246 293 1 23101 615 2 26 498 77 33 20 36 1463 3169 55 74 9 688 82 192 991 25 3657 238 42 1111 2082 9727 21 6952 7856 33 3 329 123 28 834 13 5925 4481 4 408 24 419 804 21 7 1602 2648 76 48 3571 316 41 28 7351 7417 300 19 100 5 5732 32 32 3012 72 2273 1287 0 94 18 2668 1284 449 2820 1060 3855 5762 2020 2687 209 754 649 10 919 2961 1784 142 4208 3411 1 77 1123 6989 12706 179 0 4073 45 9 25 141 23 940 104 1553 165 77 321 2979 4693 101 24 14 143 126 1332 27 167 77 826 179 57 3 29 11 19 17 0 4 78 569 86 0 112 90 1446 163 70 16 382 1843 1131 514 2164 1938 926 5495 129 7 63 67 39 21 346 682 17 5410 32 1956 4567 3771 906 231 68 8 33 86 700 1274 2153 5236 7802 1142 12 16 0 1292 987 1995 57 191 472 318 6419 2794 0 1268 108 17 150 171 5671 1875 98 70 7228 1586 5192 8847 6659 28 30 21 881 3802 3238 1 4729 1146 363 31 1 9 71 4 4 15 11 2 6 113 6 6 646 1 0 33 24 8 11 0 0 0 13 3 1 2 116 6 2 25 34 1 0 11 0 26 35 2 192 0 10 3 20 2 0 47 2 5 209 9 13 1 133 1 15 0 4 1 9 0 23 9 3 2 0 0 1 1 1 0 0 0 1 1 3 0 1 4 4 4 1 0 7 10 0 5 0 5 0 18 6 25 10 2 0 1 18 6 16 1 12 0 13 3 0 11 30 2 0 6 1 0 0 5 6 0 124 3 0 102 278 9 0 0 2 6 6 0 113 7 5 2 3 0 0 1 11 30 0 5 5 7 19 1 5 42 8 0 96 10 0 0 0 7 1 0 28 5 0 2 5 4 38 0 9 0 0 0 12 0 12 8 2 2 1 1 1 3 30 13 1 1 0 4 8 1 1 4 6 0 0 20 0 0 234 23 3 1 2 1 0 17 0 2 2 3 7 0 23 11 7 1 0 10 3 1 7 4 5 0 7 0 13 10 1 0 1 0 0 0 383 49 27 3 0 7 1 0 0 299 11 3 0 6 39 89 217 11 0 2 2 2 1 0 11 0 7 1 0 8 18 4 5 0 9 2 1 1 1 2 2 0 0 285 8 0 0 3 8 2 12 0 57 0 8 6 7 46 15 33 3 2 6 0 0 0 3 1 1 1 2 0 4 0 0 93 28 6 98 34 6 44 5 2 0 2 6 0 0 85 0 5 5 4 13 0 1 1 1 0 0 13 5 9 12 8 0 0 1 30 30 3 5 2 2 1 0 1 11 2 15 6 0 4 31 5 21 61 22 51 2 10 4 0 3 0 1 1 0 2 1 8 4 0 4 101 7 0 3 22 4 2 1 1 0 5 0 17 30 7 1 7 0 0 3 1 1 18 3 1 8 0 0 0 1 10 2 2 2 1 1 0 0 0 49 35 1 1 38 2 0 0 53 2 2 6 0 12 9 17 3 10 4 77 3 2 4 230 1 3 6 0 0 0 1 17 7 0 1 0 0 5 0 5 2 1 21 0 11 0 0 2 3 0 21 0 0 0 6 4 1 2 64 99 13 27 2 0 0 20 9 2 42 1 71 44 1 0 83 6 7 0 5 8 57 106 16 4 5 8 7 2 22 16 8 5 24 10 10 15 25 0 11 15 0 10 3 1 4 0 0 17 0 0 21 23 1 3 0 2 0 3 2 2 1 2 21 12 0 1 10 6 3 0 2 4 3 1 8 0 8 3 1 7 5 3 4 0 0 10 230 15 187 3 4 18 0 0 0 0 0 0 2 0 2 75 60 23 7 0 9 4 15 10 22 39 7 0 1 1 0 1 1 0 0 1 0 26 4 6 32 1 1 12 15 2 13 4 6 1 36 84 4 14 4 7 2 24 3 49 5 5 23 21 17 63 0 4 8 4 1 2 41 1 7 8 4 0 1 1 5 6 0 13 2 6 23 0 8 0 9 1 19 0 4 9 1 5 0 16 15 6 0 0 2 0 0 0 6 3 2 0 2 161 10 0 4 3 3 5 0 2 7 47 1 0 0 0 63 1 0 7 1 2 2 1 0 2 23 38 1 1 3 6 0 3 11 23 15 64 0 1 0 39 3 10 0 0 0 11 4 0 82 2 0 3 0 0 24 0 0 5 0 0 3 2 3 0 18 23 45 9 91 4 0 0 9 1 2 12 2 7 0 0 16 0 1 15 0 61 7 13 3 0 1 0 0 0 3 15 0 0 124 394 11 6 116 122 21 323 28 763 6 127 189 1 72 9 252 0 76 0 325 138 1 19 25 9 1 1 0 0 640 840 0 11 117 247 162 0 36 136 13 163 32 0 86 66 329 51 59 2 44 116 144 0 240 99 160 1 75 223 32 114 5 14 0 17 26 371 20 73 3 14 186 29 75 10 8 70 626 7 31 5 657 22 62 111 52 103 53 19 79 191 27 242 0 1 229 0 6 174 37 50 55 500 385 0 38 1 19 243 265 2 264 82 217 27 15 43 58 210 47 10 7 181 100 18 19 164 381 233 9 208 194 0 285 48 92 194 180 4 41 1090 35 12 139 1 7 33 36 11 93 11 0 86 352 849 267 365 486 429 417 394 13 10 3 0 219 36 46 3 57 111 264 163 460 7 6 3 131 17 3 256 62 2 312 88 88 114 29 39 1 16 35 135 42 25 0 562 99 18 140 307 73 13 19 117 45 22 151 163 35 2 0 20 0 49 159 50 56 0 340 86 32 662 3 298 553 254 53 77 109 1 13 215 48 152 134 76 63 13 406 247 72 265 76 4 13 15 70 53 56 12 204 107 23 602 14 74 5 16 169 115 430 194 147 172 2 41 11 53 48 18 0 46 12 4 18 153 159 187 96 72 179 69 162 3 7 12 45 715 115 7 9 1000 283 328 602 12 0 81 14 82 96 303 583 122 29 996 0 33 162 42 178 8 345 112 178 232 100 243 1183 128 0 493 153 528 502 369 2 386 302 30 0 131 55 603 19 63 400 48 344 30 26 8 16 202 515 230 105 109 201 15 242 3947 22 180 39 247 18 106 26 135 4 7 66 22 1 62 3 41 11 10 196 74 484 68 216 88 44 0 167 222 383 73 5 98 4 513 24 2 171 80 35 300 59 70 48 124 35 166 9 1439 141 1237 137 222 2 134 328 9 108 170 32 1813 7 76 274 849 46 0 211 1176 27 66 5 0 12 672 100 1073 160 329 201 21 306 510 1 53 0 98 3 344 16 19 24 15 35 0 241 152 19 94 13 68 539 7 4 74 5 423 16 0 285 0 1 12 48 169 1795 21 4 819 1093 7 287 424 272 63 419 837 38 573 3 10 48 1032 540 316 2 70 159 7 311 139 4 4 132 5 113 89 80 2 6 159 5 0 1 25 14 871 8 2 502 218 41 92 122 328 20 20 0 243 894 31 61 258 27 18 39 294 84 1031 119 88 2 0 134 9 264 66 327 24 3 104 108 234 170 310 140 90 150 2 21 0 72 15 295 59 91 293 7 17 10 3 70 21 1 13 0 82 411 8 194 1159 156 110 223 37 64 134 2 151 38 0 23 29 2 102 3 2 2 21 6 0 140 384 389 325 77 13 24 24 3 51 0 12 0 37 334 242 423 218 49 77 14 0 10 62 384 65 3 1159 147 375 209 191 45 314 61 23 110 369 562 14 167 352 15 1454 38 22 83 112 807 450 50 59 122 0 0 0 10 77 16 1436 550 179 221 103 203 35 207 95 97 19 1305 917 115 3156 44 1354 816 217 8 51 1 1 19 27 109 5 664 44 26 204 606 68 401 218 273 207 44 105 197 48 77 851 18 1 12 151 20 5 385 1524 5 21 280 44 679 140 195 832 161 1461 270 35 18 51 23 21 1306 92 26 109 394 0 58 40 17 373 2 209 21 76 8 0 9 37 15 2 3 0 0 9 23 67 39 1 3 13 41 12 2 22 38 7 33 59 6 258 16 66 132 25 0 1 274 544 112 32 98 132 0 0 10 377 53 117 462 1328 143 23 1137 39 90 3 0 67 1 1 19 32 1987 150 364 8 5 0 SP13 Bacteria;Fusobacteria;Fusobacteriia;Fusobacteriales;Leptotrichiaceae;Leptotrichia;sp. HMT221 216 2 0 34 4 0 0 0 12 82 606 19 16 15 27 1 72 3 9 49 171 17 44 75 94 0 4 154 0 0 6 2 0 40 1 223 2 12 33 2 0 0 3 0 0 0 18 0 0 0 155 169 109 2 199 53 1366 868 3 90 3 0 2 0 49 86 16 648 3 1 61 6 3 158 13 0 50 191 35 0 0 0 15 4 0 43 5 0 3 242 1 30 0 8 266 0 0 0 6 5 22 96 0 0 15 3 1 0 0 12 0 0 67 11 4 6 93 10 37 0 6 204 31 56 18 0 344 98 5 0 0 2 4 3 32 1 0 0 0 0 5 1 0 0 6 12 30 571 4 0 0 0 1 2 0 0 0 3 0 2 0 0 7 0 0 10 0 0 6 10 18 0 11 0 1 1 0 0 0 0 216 0 0 0 0 0 52 0 0 0 3 7 92 24 168 26 0 280 44 2 1 2 13 0 0 619 0 0 7 0 0 0 0 4 0 11 4 15 0 2 5 0 9 1 0 0 77 2 0 513 0 0 0 0 0 0 4 14 9 2 1 0 0 0 0 51 2 4 3 24 33 0 0 0 3 0 19 19 8 3 6 45 5 28 2 3 3 0 0 0 1 0 1 0 0 1 0 0 9 0 365 397 210 0 1 0 0 0 0 4 0 0 0 0 0 0 0 1 0 59 8 524 135 9 13 3 231 5 0 2 0 0 0 0 207 4 2 0 0 271 0 0 6 0 0 0 0 0 5 0 0 4 0 0 0 0 0 3 0 0 0 0 0 0 1 1 10 0 0 0 4 0 0 3 0 0 8 0 0 0 0 0 0 7 2 1 1 2 0 0 2 0 25 0 0 0 0 8 0 1 0 0 0 0 5 2 0 1 0 0 0 0 0 0 7 3 0 0 0 9 9 0 0 0 1 0 0 0 0 0 0 3 0 0 0 0 0 0 15 0 0 0 0 0 5 0 16 0 0 0 0 0 1 0 0 0 21 22 5 4 7 0 0 1 0 0 0 0 1 3 7 2 3 0 0 0 0 3 0 0 2 0 0 0 32 0 0 31 0 1 0 2 0 0 0 0 1 0 0 9 4 6 203 0 0 0 1 0 0 12 0 2 4 0 0 0 0 0 0 0 93 0 0 0 0 0 35 0 19 0 2 70 0 0 0 26 291 476 0 0 0 19 0 0 0 7 0 5 0 2 0 0 0 8 0 0 1 0 2 3 0 14 5 43 0 0 0 0 1 7 4 5 0 0 0 1 0 0 0 4 1 24 2 39 4 11 0 0 0 8 40 0 0 0 0 0 0 0 0 0 0 0 3 3 7 0 0 0 0 29 96 0 0 0 0 0 77 0 0 0 0 0 21 0 1 0 0 2 0 0 0 2 0 0 0 0 3 0 0 0 0 0 2 1 0 0 0 0 0 0 0 0 0 0 1 0 34 0 3 0 0 0 0 0 1 0 0 1 0 21 0 1 3 1 0 0 1 5 0 0 1 0 1 11 0 0 0 0 0 10 0 1 2 4 4 0 0 0 1 4 38 0 0 0 3 0 0 2 2 2 0 0 0 0 1 0 0 2 18 4 0 6 54 0 0 0 0 0 78 28 47 4 20 4 0 0 0 7 4 0 4 0 0 0 0 3 0 0 0 0 0 126 6 0 0 0 4 0 0 1 0 8 2 0 0 0 0 0 20 0 11 2 0 0 0 0 0 0 0 0 3 1 0 0 0 0 0 3 5 61 0 0 1 0 10 35 1 0 3 16 0 0 1 9 1 17 93 0 0 0 0 1 0 0 14 0 0 0 189 0 0 0 1 0 2 0 0 0 0 0 0 19 0 1 0 0 7 0 0 15 0 1 11 29 0 0 9 1 0 0 0 0 3 0 0 0 0 0 0 3 0 0 0 0 0 0 5 1 0 0 1 6 3 25 0 3 14 1 0 0 0 1 0 15 4 3 56 0 0 0 6 9 0 7 0 1 2 1 0 5 0 4 8 10 2 0 255 0 0 0 6 0 20 0 0 0 0 0 1 5 1 2 0 3 2 0 0 0 0 0 0 1 0 0 1 0 0 0 0 0 2 0 3 0 0 0 0 0 1 0 0 0 301 5 142 0 0 0 0 0 1 0 1 0 0 0 0 0 23 0 142 3 2 0 0 1 19 4 2 1 0 2 0 0 0 0 2 1 0 0 2 2 12 1 10 0 4 1 0 6 0 0 23 30 0 2 0 14 381 1 0 0 56 3 1 7 3 5 1 7 12 2 1 176 4 6 0 0 4 0 0 1 0 9 15 0 0 0 0 12 0 1 0 9 4 0 8 0 6 48 3 20 97 12 6 406 2 9 113 16 1 0 4 0 0 0 0 13 0 1 93 9 371 112 0 72 1 0 0 3 0 0 789 0 0 38 0 7 26 0 3 4 19 0 1 14 0 0 6 0 1 0 0 0 0 2 2 0 6 10 1 14 4 0 557 6 5 0 0 0 0 359 0 13 551 2 0 0 0 0 5 163 0 5 0 8 310 828 6 1 0 0 0 4 2 1 0 0 0 0 24 0 0 0 1 55 3 0 289 0 0 4 0 10 0 142 89 0 0 0 0 0 1 800 3259 347 0 0 1 0 0 0 0 0 25 1 0 14 0 0 239 0 0 0 9 0 128 0 0 0 93 0 6 0 3 5 0 1 0 0 37 34 0 0 26 0 1 0 0 8 0 0 0 40 0 3 35 3 29 0 3 10 0 2 2 0 0 12 0 0 61 4 15 39 8 36 61 1 0 28 23 8 32 35 0 3 0 1 0 0 0 2 9 0 0 0 0 5 4 0 0 0 0 3 2 23 14 2 259 0 0 0 0 1 2 0 0 1 0 97 25 199 7 0 16 0 0 0 63 1 0 0 0 0 3 45 0 0 405 0 6 6 71 6 1 182 0 0 1 2 19 39 309 2 0 11 1 0 1026 0 1 3 106 28 8 987 44 0 0 0 49 0 0 0 0 0 17 51 124 14 5 0 6 7 1 0 0 151 0 0 46 0 0 9 163 2 0 148 22 7 1 0 0 0 33 164 10 27 14 1 0 22 2 262 0 0 0 0 0 3 0 0 0 16 0 0 0 0 5 0 4 7 0 0 2 3 36 246 0 0 0 0 0 13 4 13 0 20 0 6 44 40 587 0 20 42 0 1 26 7 276 0 1 13 0 0 13 9 1 0 0 1 0 0 0 37 426 29 6 0 0 0 39 66 1 17 23 7 3 434 0 5 2 0 10 0 14 176 27 0 4 0 0 0 3 0 0 0 12 0 17 0 0 4 0 3 0 426 30 3 0 0 2 0 2 0 7 2 0 4 68 0 0 0 0 24 0 82 848 161 19 461 0 0 43 0 0 81 0 0 0 41 1 10 20 7 2 0 0 2 2 13 0 1 5 5 4 6 48 11 0 40 4 0 63 82 58 72 23 8 1 0 0 1 13 1 0 18 34 173 1 0 2 4 2 29 550 0 0 1 0 0 0 0 24 0 0 86 154 8 18 0 13 5 0 1 69 7 1 118 0 0 0 0 0 0 88 0 19 67 7 8 5 0 1 110 0 4 1 92 1 1 0 1 4 10 3 6 155 70 4 4 0 0 0 0 1 1 2 79 11 1 628 20 0 4 142 21 12 0 3 121 16 12 5 0 69 1 1 0 1 8 32 4 0 5 15 0 0 3 71 1 1 62 16 0 44 0 33 417 3 0 0 28 2 0 0 0 3 1103 0 135 37 0 39 10 7 0 2 89 0 13 1127 0 0 70 5 1 0 0 3 0 20 0 4 3 45 3 0 0 0 2 0 0 2 10 0 4 1 312 0 0 4 1 0 37 2 0 0 18 7 35 10 4 34 22 0 0 0 0 13 0 0 0 1 1 14 6 1 652 12 0 0 0 80 17 1 32 14 320 115 1 0 0 0 122 0 345 0 0 0 0 21 1 23 0 0 0 4 1 6 25 0 3 2 0 4 0 0 25 56 0 3 0 2 49 1 2 0 1 2 2 3 0 0 0 16 4 154 1 0 45 673 85 3 8 1 3 0 0 0 83 0 0 80 38 32 1 148 6 3 0 165 0 138 24 13 0 107 0 0 3 2 1 SP133 Bacteria;Actinobacteria;Actinobacteria;Actinomycetales;Actinomycetaceae;Schaalia;odontolytica 1968 855 414 366 403 1856 6 16038 243 351 170 776 678 1816 180 2473 686 166 1085 1317 517 224 549 69 594 614 66 173 66 1453 1189 3531 386 75 2338 1443 1088 876 628 66 175 76 1024 1444 231 537 526 172 47 2280 1095 259 9 696 512 172 68 321 332 1591 320 620 534 295 39 177 12 5511 438 853 319 1158 372 1103 103 1789 460 1644 100 628 77 721 728 40 65 802 264 363 388 1607 47 60 88 100 168 3978 159 71 328 248 862 632 1199 1244 38 335 557 194 905 128 1 321 40 852 2130 289 863 670 259 43 731 136 46 2702 956 1130 80 306 1857 569 1349 1045 1100 897 152 868 1747 1133 399 370 139 27 759 1047 85 475 1890 1225 106 1388 1299 1495 852 978 129 1211 3922 841 219 1912 834 403 621 171 1379 183 190 1964 1245 95 8 160 945 1983 925 868 955 674 208 293 431 953 432 348 594 2108 659 388 191 846 2043 455 1531 733 848 208 208 679 96 141 62 462 576 325 92 1673 102 65 198 11 174 421 877 9 776 661 111 276 137 591 463 157 93 138 11 431 365 425 51 1960 515 50 2011 307 1091 1315 1385 990 1097 360 54 98 694 232 140 1931 536 184 1389 3174 766 127 572 290 4 588 4382 1372 210 757 629 68 1573 724 86 2132 760 122 0 0 0 0 0 0 0 0 0 0 0 0 0 0 0 0 0 0 0 0 0 0 0 0 0 0 0 0 0 0 0 0 0 0 0 0 0 0 0 0 0 0 0 0 0 0 0 0 0 0 0 0 0 0 0 0 0 0 0 0 0 0 0 0 0 0 0 0 0 0 0 0 0 0 0 0 0 0 0 0 0 0 0 0 0 0 0 0 0 0 0 0 0 0 0 0 0 0 0 0 0 0 0 0 0 0 0 0 0 0 0 0 0 0 0 0 0 0 0 0 0 0 0 0 0 0 0 0 0 0 0 0 0 0 0 0 0 0 0 0 0 0 0 0 0 0 0 0 0 0 0 0 0 0 0 0 0 0 0 0 0 0 0 0 0 0 0 0 0 0 0 0 0 0 0 0 0 0 0 0 0 0 0 0 0 0 0 0 0 0 0 0 0 0 0 0 0 0 0 0 0 0 0 0 0 0 0 0 0 0 0 0 0 0 0 0 0 0 0 0 0 0 0 0 0 0 0 0 0 0 0 0 0 0 0 0 0 0 0 0 0 0 0 0 0 0 0 0 0 0 0 0 0 0 0 0 0 0 0 0 0 0 0 0 0 0 0 0 0 0 0 0 0 0 0 0 0 0 0 0 0 0 0 0 0 0 0 0 0 0 0 0 0 0 0 0 0 0 0 0 0 0 0 0 0 0 0 0 0 0 0 0 0 0 0 0 0 0 0 0 0 0 0 0 0 0 0 0 0 0 0 0 0 0 0 0 0 0 0 0 0 0 0 0 0 0 0 0 0 0 0 0 0 0 0 0 0 0 0 0 0 0 0 0 0 0 0 0 0 0 0 0 0 0 0 0 0 0 0 0 0 0 0 0 0 0 0 0 0 0 0 0 0 0 0 0 0 0 0 0 0 0 0 0 0 0 0 0 0 0 0 0 0 0 0 0 0 0 0 0 0 0 0 0 0 0 0 0 0 0 0 0 0 0 0 0 0 0 0 0 0 0 0 0 0 0 0 0 0 0 0 0 0 0 0 0 0 0 0 0 0 0 0 0 0 0 0 0 0 0 0 0 0 0 0 0 0 0 0 0 0 0 0 0 0 0 0 0 0 0 0 0 0 0 0 0 0 0 0 0 0 0 0 0 0 0 0 0 0 0 0 0 0 0 0 0 0 0 0 0 0 0 0 0 0 0 0 0 0 0 0 0 0 0 0 0 0 0 0 0 0 0 0 0 0 0 0 0 0 0 0 0 0 0 0 0 0 0 0 0 0 0 0 0 0 0 0 0 0 0 0 0 0 0 0 0 0 0 0 0 0 0 0 0 0 0 0 0 0 0 0 0 0 0 0 0 0 0 0 0 0 0 0 0 0 0 0 0 0 0 0 0 0 0 0 0 0 0 0 0 0 0 0 0 0 0 0 0 0 0 0 0 0 0 0 0 0 0 0 0 0 0 0 0 0 0 0 0 0 0 0 0 0 0 0 0 0 0 0 0 0 0 0 0 0 0 0 0 0 0 0 0 0 0 0 0 0 0 0 0 0 0 0 0 0 0 0 0 0 0 0 0 0 0 0 0 0 0 0 0 0 0 0 0 0 0 0 0 0 0 0 0 0 0 0 0 0 0 0 0 0 0 0 0 0 0 0 0 0 0 0 0 0 0 0 0 0 0 0 0 0 0 0 0 0 0 0 0 0 0 0 0 0 0 0 0 0 0 0 0 0 0 0 0 0 0 0 0 0 0 0 0 0 0 0 0 0 0 0 0 0 0 0 0 0 0 0 0 0 0 0 0 0 0 0 0 0 0 0 0 0 0 0 0 0 0 0 0 0 0 0 0 0 0 0 0 0 0 0 0 0 0 0 0 0 0 0 0 0 0 0 0 0 0 0 0 0 0 0 0 0 0 0 0 0 0 0 0 0 0 0 0 0 0 0 0 0 0 0 0 0 0 0 0 0 0 0 0 0 0 0 0 0 0 0 0 0 0 0 0 0 0 0 0 0 0 0 0 0 0 0 0 0 0 0 0 0 0 0 0 0 0 0 0 0 0 0 0 0 0 0 0 0 0 0 0 0 0 0 0 0 0 0 0 0 0 0 0 0 0 0 0 0 0 0 0 0 0 0 0 0 0 0 0 0 0 0 0 0 0 0 0 0 0 0 0 0 0 0 0 0 0 0 0 0 0 0 0 0 0 0 0 0 0 0 0 0 0 0 0 0 0 0 0 0 0 0 0 0 0 0 0 0 0 0 0 0 0 0 0 0 0 0 0 0 0 0 0 0 0 0 0 0 0 0 0 0 0 0 0 0 0 0 0 0 0 0 0 0 0 0 0 0 0 0 0 0 0 0 0 0 0 0 0 0 0 0 0 0 0 0 0 0 0 0 0 0 0 0 0 0 0 0 0 0 0 0 0 0 0 0 0 0 0 0 0 0 0 0 0 0 0 0 0 0 0 0 0 0 0 0 0 0 0 0 0 0 0 0 0 0 0 0 0 0 0 0 0 0 0 0 0 0 0 0 0 0 0 0 0 0 0 0 0 0 0 0 0 0 0 0 0 0 0 0 0 0 0 0 0 0 0 0 0 0 0 0 0 0 0 0 0 0 0 0 0 0 0 0 0 0 0 0 0 0 0 0 0 0 0 0 0 0 0 0 0 0 0 0 0 0 0 0 0 0 0 0 0 0 0 0 0 0 0 0 0 0 0 0 0 0 0 0 0 0 0 0 0 0 0 0 0 0 0 0 0 0 0 0 0 0 0 0 0 0 0 0 0 0 0 0 0 0 0 0 0 0 0 0 0 0 0 0 0 0 0 0 0 0 0 0 0 0 0 0 0 0 0 0 0 0 0 0 0 0 0 0 0 0 0 0 0 0 0 0 0 0 0 0 0 0 0 0 0 0 0 0 0 0 0 0 0 0 0 0 0 0 0 0 0 0 0 0 0 0 0 0 0 0 0 0 0 0 0 0 0 0 0 0 0 0 0 0 0 0 0 0 0 0 0 0 0 0 0 0 0 0 0 0 0 0 0 0 0 0 0 0 0 0 0 0 0 0 0 0 0 0 0 0 0 0 0 0 0 0 0 0 0 0 0 0 0 0 0 0 0 0 0 0 0 0 0 0 0 0 0 0 0 0 0 0 0 0 0 0 0 0 0 0 0 0 0 0 0 0 0 0 0 0 0 0 0 0 0 0 0 0 0 0 0 0 0 0 0 0 0 0 0 0 0 0 0 0 0 0 0 0 0 0 0 0 0 0 0 0 0 0 0 0 0 0 0 0 0 0 0 0 0 0 0 0 0 0 0 0 0 0 0 0 0 0 0 0 0 0 0 0 0 0 0 0 0 0 0 0 0 0 0 0 0 0 0 0 0 0 0 0 0 0 0 0 0 0 0 0 0 0 0 0 0 0 0 0 0 0 0 0 0 0 0 0 0 0 0 0 0 0 0 0 0 0 0 0 0 0 0 0 0 0 0 0 0 0 0 0 0 0 0 0 0 0 0 0 0 0 0 SP134 Bacteria;Firmicutes;Bacilli;Lactobacillales;Streptococcaceae;Streptococcus;pseudopneumoniae 8 49 12 6 7 85 27 3 17 28 3 62 4 19 13 5 49 26 14 5 16 15 16 52 14 1 99 6 90 101 12 4 12 5 4 26 10 71 10 33 6 40 5 54 39 11 36 23 172 15 4 4 5 60 7 16 7 38 49 8 9 11 6 8570 6 17 7 8 79 3 24 7 20 2 36 44 5 3 121 20 57 5 33 80 2 27 11 4 68 3 249 11 47 86 14 16 112 5 39 38 20 95 41 0 69 17 5 44 8 8 29 3 37 42 128 90 11 25 18 17 1 5 12 2 15 18 11 5 11 179 9 7 3 70 22 96 5 6 12 3 99 52 154 20 55 33 18 31 5 9 1 11 14 7 41 37 6 31 7 8 30 55 7 53 36 11 8 49 44 11 27 11 104 87 1 14 21 9 5 15 2 40 39 8 19 3 11 7 2 4 17 0 7 0 4 47 2 10 29 3 119 14 3 11 5 0 19 11 38 105 9 5 1 19 34 10 313 22 139 16 21 10 27 30 5 6 5 21 207 1 7 103 11 13 2 1 15 41 26 7 142 13 4 9 123 10 0 12 10 10 1 2 1 4 0 4 90 0 14 4 5 2 62 1 9 1 8 2 0 0 0 0 0 0 0 0 0 0 0 0 0 0 0 0 0 0 0 0 0 0 0 0 0 0 0 0 0 0 0 0 0 0 0 0 0 0 0 0 0 0 0 0 0 0 0 0 0 0 0 0 0 0 0 0 0 0 0 0 0 0 0 0 0 0 0 0 0 0 0 0 0 0 0 0 0 0 0 0 0 0 0 0 0 0 0 0 0 0 0 0 0 0 0 0 0 0 0 0 0 0 0 0 0 0 0 0 0 0 0 0 0 0 0 0 0 0 0 0 0 0 0 0 0 0 0 0 0 0 0 0 0 0 0 0 0 0 0 0 0 0 0 0 0 0 0 0 0 0 0 0 0 0 0 0 0 0 0 0 0 0 0 0 0 0 0 0 0 0 0 0 0 0 0 0 0 0 0 0 0 0 0 0 0 0 0 0 0 0 0 0 0 0 0 0 0 0 0 0 0 0 0 0 0 0 0 0 0 0 0 0 0 0 0 0 0 0 0 0 0 0 0 0 0 0 0 0 0 0 0 0 0 0 0 0 0 0 0 0 0 0 0 0 0 0 0 0 0 0 0 0 0 0 0 0 0 0 0 0 0 0 0 0 0 0 0 0 0 0 0 0 0 0 0 0 0 0 0 0 0 0 0 0 0 0 0 0 0 0 0 0 0 0 0 0 0 0 0 0 0 0 0 0 0 0 0 0 0 0 0 0 0 0 0 0 0 0 0 0 0 0 0 0 0 0 0 0 0 0 0 0 0 0 0 0 0 0 0 0 0 0 0 0 0 0 0 0 0 0 0 0 0 0 0 0 0 0 0 0 0 0 0 0 0 0 0 0 0 0 0 0 0 0 0 0 0 0 0 0 0 0 0 0 0 0 0 0 0 0 0 0 0 0 0 0 0 0 0 0 0 0 0 0 0 0 0 0 0 0 0 0 0 0 0 0 0 0 0 0 0 0 0 0 0 0 0 0 0 0 0 0 0 0 0 0 0 0 0 0 0 0 0 0 0 0 0 0 0 0 0 0 0 0 0 0 0 0 0 0 0 0 0 0 0 0 0 0 0 0 0 0 0 0 0 0 0 0 0 0 0 0 0 0 0 0 0 0 0 0 0 0 0 0 0 0 0 0 0 0 0 0 0 0 0 0 0 0 0 0 0 0 0 0 0 0 0 0 0 0 0 0 0 0 0 0 0 0 0 0 0 0 0 0 0 0 0 0 0 0 0 0 0 0 0 0 0 0 0 0 0 0 0 0 0 0 0 0 0 0 0 0 0 0 0 0 0 0 0 0 0 0 0 0 0 0 0 0 0 0 0 0 0 0 0 0 0 0 0 0 0 0 0 0 0 0 0 0 0 0 0 0 0 0 0 0 0 0 0 0 0 0 0 0 0 0 0 0 0 0 0 0 0 0 0 0 0 0 0 0 0 0 0 0 0 0 0 0 0 0 0 0 0 0 0 0 0 0 0 0 0 0 0 0 0 0 0 0 0 0 0 0 0 0 0 0 0 0 0 0 0 0 0 0 0 0 0 0 0 0 0 0 0 0 0 0 0 0 0 0 0 0 0 0 0 0 0 0 0 0 0 0 0 0 0 0 0 0 0 0 0 0 0 0 0 0 0 0 0 0 0 0 0 0 0 0 0 0 0 0 0 0 0 0 0 0 0 0 0 0 0 0 0 0 0 0 0 0 0 0 0 0 0 0 0 0 0 0 0 0 0 0 0 0 0 0 0 0 0 0 0 0 0 0 0 0 0 0 0 0 0 0 0 0 0 0 0 0 0 0 0 0 0 0 0 0 0 0 0 0 0 0 0 0 0 0 0 0 0 0 0 0 0 0 0 0 0 0 0 0 0 0 0 0 0 0 0 0 0 0 0 0 0 0 0 0 0 0 0 0 0 0 0 0 0 0 0 0 0 0 0 0 0 0 0 0 0 0 0 0 0 0 0 0 0 0 0 0 0 0 0 0 0 0 0 0 0 0 0 0 0 0 0 0 0 0 0 0 0 0 0 0 0 0 0 0 0 0 0 0 0 0 0 0 0 0 0 0 0 0 0 0 0 0 0 0 0 0 0 0 0 0 0 0 0 0 0 0 0 0 0 0 0 0 0 0 0 0 0 0 0 0 0 0 0 0 0 0 0 0 0 0 0 0 0 0 0 0 0 0 0 0 0 0 0 0 0 0 0 0 0 0 0 0 0 0 0 0 0 0 0 0 0 0 0 0 0 0 0 0 0 0 0 0 0 0 0 0 0 0 0 0 0 0 0 0 0 0 0 0 0 0 0 0 0 0 0 0 0 0 0 0 0 0 0 0 0 0 0 0 0 0 0 0 0 0 0 0 0 0 0 0 0 0 0 0 0 0 0 0 0 0 0 0 0 0 0 0 0 0 0 0 0 0 0 0 0 0 0 0 0 0 0 0 0 0 0 0 0 0 0 0 0 0 0 0 0 0 0 0 0 0 0 0 0 0 0 0 0 0 0 0 0 0 0 0 0 0 0 0 0 0 0 0 0 0 0 0 0 0 0 0 0 0 0 0 0 0 0 0 0 0 0 0 0 0 0 0 0 0 0 0 0 0 0 0 0 0 0 0 0 0 0 0 0 0 0 0 0 0 0 0 0 0 0 0 0 0 0 0 0 0 0 0 0 0 0 0 0 0 0 0 0 0 0 0 0 0 0 0 0 0 0 0 0 0 0 0 0 0 0 0 0 0 0 0 0 0 0 0 0 0 0 0 0 0 0 0 0 0 0 0 0 0 0 0 0 0 0 0 0 0 0 0 0 0 0 0 0 0 0 0 0 0 0 0 0 0 0 0 0 0 0 0 0 0 0 0 0 0 0 0 0 0 0 0 0 0 0 0 0 0 0 0 0 0 0 0 0 0 0 0 0 0 0 0 0 0 0 0 0 0 0 0 0 0 0 0 0 0 0 0 0 0 0 0 0 0 0 0 0 0 0 0 0 0 0 0 0 0 0 0 0 0 0 0 0 0 0 0 0 0 0 0 0 0 0 0 0 0 0 0 0 0 0 0 0 0 0 0 0 0 0 0 0 0 0 0 0 0 0 0 0 0 0 0 0 0 0 0 0 0 0 0 0 0 0 0 0 0 0 0 0 0 0 0 0 0 0 0 0 0 0 0 0 0 0 0 0 0 0 0 0 0 0 0 0 0 0 0 0 0 0 0 0 0 0 0 0 0 0 0 0 0 0 0 0 0 0 0 0 0 0 0 0 0 0 0 0 0 0 0 0 0 0 0 0 0 0 0 0 0 0 0 0 0 0 0 0 0 0 0 0 0 0 0 0 0 0 0 0 0 0 0 0 0 0 0 0 0 0 0 0 0 0 0 0 0 0 0 0 0 0 0 0 0 0 0 0 0 0 0 0 0 0 0 0 0 0 0 0 0 0 0 0 0 0 0 0 0 0 0 0 0 0 0 0 0 0 0 0 0 0 0 0 0 0 0 0 0 0 0 0 0 0 0 0 0 0 0 0 0 0 0 0 0 SP139 Bacteria;Proteobacteria;Betaproteobacteria;Neisseriales;Neisseriaceae;Neisseria;cinerea 0 144 1 6 1 17 0 0 3 249 2 862 936 0 0 0 4 14 0 0 0 0 1 0 2 0 1 1 76 12 7 1 2 0 20 0 109 6 0 684 4 59 1 0 56 2 0 2 238 0 7 0 0 20 0 2 16 31 31 4 2 846 2 71 0 22 416 0 2 0 216 19 111 0 0 0 1 1 3 0 8 0 0 114 0 5 3 1 0 0 21 0 43 6 0 0 14 0 56 67 3 7 0 1 0 363 0 0 0 0 0 5 0 0 54 11 0 0 3 15 0 1 0 120 0 0 1 0 0 41 1 0 0 0 59 56 0 7 1 0 1674 21 1 397 68 17 4 1 0 3 0 0 0 0 0 0 0 0 0 0 0 0 0 0 1 0 2 0 7 1 0 0 4 45 0 0 0 0 2 16 0 4 6 6 1 0 0 0 0 82 0 2 1 0 0 0 0 0 6 2 0 7 0 0 0 0 85 1 7 0 0 0 0 0 0 1 1 1 0 1 196 3 1 32 39 0 4 32 0 0 0 12 2 5 0 0 0 0 2 3 0 0 0 424 0 0 0 0 0 0 1 0 0 0 0 0 0 0 0 0 3 1 0 0 69 0 1 0 0 0 0 0 0 0 0 0 0 0 0 0 0 0 0 0 0 0 0 0 0 0 0 0 0 0 0 0 0 0 0 0 0 0 0 0 0 0 0 0 0 0 0 0 0 0 0 0 0 0 0 0 0 0 0 0 0 0 0 0 0 0 0 0 0 0 0 0 0 0 0 0 0 0 0 0 0 0 0 0 0 0 0 0 0 0 0 0 0 0 0 0 0 0 0 0 0 0 0 0 0 0 0 0 0 0 0 0 0 0 0 0 0 0 0 0 0 0 0 0 0 0 0 0 0 0 0 0 0 0 0 0 0 0 0 0 0 0 0 0 0 0 0 0 0 0 0 0 0 0 0 0 0 0 0 0 0 0 0 0 0 0 0 0 0 0 0 0 0 0 0 0 0 0 0 0 0 0 0 0 0 0 0 0 0 0 0 0 0 0 0 0 0 0 0 0 0 0 0 0 0 0 0 0 0 0 0 0 0 0 0 0 0 0 0 0 0 0 0 0 0 0 0 0 0 0 0 0 0 0 0 0 0 0 0 0 0 0 0 0 0 0 0 0 0 0 0 0 0 0 0 0 0 0 0 0 0 0 0 0 0 0 0 0 0 0 0 0 0 0 0 0 0 0 0 0 0 0 0 0 0 0 0 0 0 0 0 0 0 0 0 0 0 0 0 0 0 0 0 0 0 0 0 0 0 0 0 0 0 0 0 0 0 0 0 0 0 0 0 0 0 0 0 0 0 0 0 0 0 0 0 0 0 0 0 0 0 0 0 0 0 0 0 0 0 0 0 0 0 0 0 0 0 0 0 0 0 0 0 0 0 0 0 0 0 0 0 0 0 0 0 0 0 0 0 0 0 0 0 0 0 0 0 0 0 0 0 0 0 0 0 0 0 0 0 0 0 0 0 0 0 0 0 0 0 0 0 0 0 0 0 0 0 0 0 0 0 0 0 0 0 0 0 0 0 0 0 0 0 0 0 0 0 0 0 0 0 0 0 0 0 0 0 0 0 0 0 0 0 0 0 0 0 0 0 0 0 0 0 0 0 0 0 0 0 0 0 0 0 0 0 0 0 0 0 0 0 0 0 0 0 0 0 0 0 0 0 0 0 0 0 0 0 0 0 0 0 0 0 0 0 0 0 0 0 0 0 0 0 0 0 0 0 0 0 0 0 0 0 0 0 0 0 0 0 0 0 0 0 0 0 0 0 0 0 0 0 0 0 0 0 0 0 0 0 0 0 0 0 0 0 0 0 0 0 0 0 0 0 0 0 0 0 0 0 0 0 0 0 0 0 0 0 0 0 0 0 0 0 0 0 0 0 0 0 0 0 0 0 0 0 0 0 0 0 0 0 0 0 0 0 0 0 0 0 0 0 0 0 0 0 0 0 0 0 0 0 0 0 0 0 0 0 0 0 0 0 0 0 0 0 0 0 0 0 0 0 0 0 0 0 0 0 0 0 0 0 0 0 0 0 0 0 0 0 0 0 0 0 0 0 0 0 0 0 0 0 0 0 0 0 0 0 0 0 0 0 0 0 0 0 0 0 0 0 0 0 0 0 0 0 0 0 0 0 0 0 0 0 0 0 0 0 0 0 0 0 0 0 0 0 0 0 0 0 0 0 0 0 0 0 0 0 0 0 0 0 0 0 0 0 0 0 0 0 0 0 0 0 0 0 0 0 0 0 0 0 0 0 0 0 0 0 0 0 0 0 0 0 0 0 0 0 0 0 0 0 0 0 0 0 0 0 0 0 0 0 0 0 0 0 0 0 0 0 0 0 0 0 0 0 0 0 0 0 0 0 0 0 0 0 0 0 0 0 0 0 0 0 0 0 0 0 0 0 0 0 0 0 0 0 0 0 0 0 0 0 0 0 0 0 0 0 0 0 0 0 0 0 0 0 0 0 0 0 0 0 0 0 0 0 0 0 0 0 0 0 0 0 0 0 0 0 0 0 0 0 0 0 0 0 0 0 0 0 0 0 0 0 0 0 0 0 0 0 0 0 0 0 0 0 0 0 0 0 0 0 0 0 0 0 0 0 0 0 0 0 0 0 0 0 0 0 0 0 0 0 0 0 0 0 0 0 0 0 0 0 0 0 0 0 0 0 0 0 0 0 0 0 0 0 0 0 0 0 0 0 0 0 0 0 0 0 0 0 0 0 0 0 0 0 0 0 0 0 0 0 0 0 0 0 0 0 0 0 0 0 0 0 0 0 0 0 0 0 0 0 0 0 0 0 0 0 0 0 0 0 0 0 0 0 0 0 0 0 0 0 0 0 0 0 0 0 0 0 0 0 0 0 0 0 0 0 0 0 0 0 0 0 0 0 0 0 0 0 0 0 0 0 0 0 0 0 0 0 0 0 0 0 0 0 0 0 0 0 0 0 0 0 0 0 0 0 0 0 0 0 0 0 0 0 0 0 0 0 0 0 0 0 0 0 0 0 0 0 0 0 0 0 0 0 0 0 0 0 0 0 0 0 0 0 0 0 0 0 0 0 0 0 0 0 0 0 0 0 0 0 0 0 0 0 0 0 0 0 0 0 0 0 0 0 0 0 0 0 0 0 0 0 0 0 0 0 0 0 0 0 0 0 0 0 0 0 0 0 0 0 0 0 0 0 0 0 0 0 0 0 0 0 0 0 0 0 0 0 0 0 0 0 0 0 0 0 0 0 0 0 0 0 0 0 0 0 0 0 0 0 0 0 0 0 0 0 0 0 0 0 0 0 0 0 0 0 0 0 0 0 0 0 0 0 0 0 0 0 0 0 0 0 0 0 0 0 0 0 0 0 0 0 0 0 0 0 0 0 0 0 0 0 0 0 0 0 0 0 0 0 0 0 0 0 0 0 0 0 0 0 0 0 0 0 0 0 0 0 0 0 0 0 0 0 0 0 0 0 0 0 0 0 0 0 0 0 0 0 0 0 0 0 0 0 0 0 0 0 0 0 0 0 0 0 0 0 0 0 0 0 0 0 0 0 0 0 0 0 0 0 0 0 0 0 0 0 0 0 0 0 0 0 0 0 0 0 0 0 0 0 0 0 0 0 0 0 0 0 0 0 0 0 0 0 0 0 0 0 0 0 0 0 0 0 0 0 0 0 0 0 0 0 0 0 0 0 0 0 0 0 0 0 0 0 0 0 0 0 0 0 0 0 0 0 0 0 0 0 0 0 0 0 0 0 0 0 0 0 0 0 0 0 0 0 0 0 0 0 0 0 0 0 0 0 0 0 0 0 0 0 0 0 0 0 0 0 0 0 0 0 0 0 0 0 0 0 0 0 0 0 0 0 0 0 0 0 0 0 0 0 0 0 0 0 0 0 0 0 0 0 0 0 0 0 0 0 0 0 0 0 0 0 0 0 0 0 0 0 0 0 0 0 0 0 0 0 0 0 0 0 0 0 0 0 0 0 0 0 0 0 0 0 0 0 0 0 0 0 0 0 0 0 0 0 0 0 0 0 0 0 0 0 0 0 0 0 0 0 0 0 0 0 0 0 0 0 0 0 0 SP14 Bacteria;Bacteroidetes;Bacteroidia;Bacteroidales;Prevotellaceae;Prevotella;sp. HMT317 0 0 5 0 0 25 4 2 3 5 0 29 25 0 8 0 1 8 0 7 3 2 1 132 6 0 1 0 61 21 1 0 33 27 8 2 10 0 0 6 0 0 4 0 1 0 1 0 80 1 2 1 1 6 1 0 4 0 2 0 0 0 0 20 0 1 3 2 29 2 3 0 5 0 3 0 0 0 7 7 0 0 0 8 0 1 0 6 0 9 14 1 23 47 0 0 7 51 5 3 0 0 2 7 0 7 1 86 2 1 32 14 19 16 1 0 0 1 7 0 0 43 0 4 4 2 1 4 5 13 2 0 0 3 6 2 17 2 0 0 11 0 91 31 2 2 18 3 1 0 0 0 1 0 0 1 1 0 0 0 3 0 0 8 0 0 0 1 0 0 0 0 0 5 0 0 0 0 0 0 0 0 5 7 0 3 0 0 2 3 0 0 5 0 5 4 0 0 2 1 1 0 14 2 0 1 1 16 1 24 26 0 0 0 2 2 12 0 0 0 3 20 0 6 3 0 1 0 3 9 0 0 7 1 0 0 5 0 0 5 0 0 1 6 20 4 1 2 0 0 2 0 0 1 0 0 2 0 0 0 0 1 0 3 20 0 0 2 0 166 2 0 4 0 167 1 85 34 548 0 209 297 0 214 63 33 92 1 0 146 1302 0 0 0 619 157 96 885 0 215 118 159 409 137 1 0 78 0 74 0 86 0 11 0 17 8 0 27 1 0 0 23 0 0 87 1 0 0 0 0 0 9 0 1 0 0 0 0 1 0 0 147 0 25 41 0 0 0 0 0 0 0 0 51 0 0 0 1 0 0 0 7 0 24 0 0 0 0 32 0 0 0 68 292 0 0 0 0 0 0 0 0 57 30 0 0 15 19 0 1 0 0 0 22 2 148 45 0 0 29 0 0 0 150 8 0 0 53 0 0 4 824 0 0 0 0 13 0 0 0 31 0 92 66 0 608 62 0 0 0 0 0 409 395 0 0 223 1 0 2 59 0 0 0 0 37 0 0 42 107 21 0 47 0 21 112 0 345 0 689 471 0 0 0 0 4 0 492 0 0 9 180 0 158 0 0 170 7 39 160 29 4 5 0 514 55 19 25 0 65 70 0 7 86 2 0 4 0 0 69 169 0 0 0 67 1 0 0 0 0 18 28 0 0 0 0 0 1 0 0 0 66 0 0 4 37 0 61 0 0 0 0 0 0 0 0 0 90 0 163 0 38 503 0 2 0 97 398 0 6 208 12 0 0 0 0 0 0 0 305 0 252 0 319 314 603 0 0 0 45 1 0 0 2 9 0 254 0 2 0 0 14 22 0 0 0 161 0 0 0 263 0 97 0 0 133 0 9 0 0 0 0 1 283 0 0 0 0 10 48 0 9 1 0 0 0 223 0 10 8 0 0 12 0 1 210 5 0 0 16 80 11 21 0 50 53 660 0 20 32 0 31 55 0 2 0 0 2 1 0 21 0 0 37 0 68 307 2 0 39 8 0 430 261 0 2 31 0 32 2 0 0 0 0 0 0 33 0 8 0 0 130 72 0 0 24 187 0 15 96 0 2 1 150 0 330 0 2 0 1 520 0 152 33 0 0 17 0 1 149 20 0 280 77 0 75 0 0 0 300 0 0 236 1 0 292 196 59 210 0 579 69 0 25 0 66 24 169 404 25 0 446 457 0 23 0 0 3 35 0 49 0 123 0 775 308 0 10 0 67 9 69 1 0 0 0 120 183 0 615 99 1 448 118 0 0 339 0 334 58 0 1 0 12 0 0 6 0 0 0 0 0 0 54 0 36 52 0 0 0 0 0 1 0 0 1 0 0 1 0 8 0 0 0 0 3 0 1 8 0 0 11 0 0 1 0 0 0 32 0 3 0 0 0 1 1 0 2 1 0 0 23 54 0 1 0 0 2 6 0 0 1 0 0 57 0 0 509 30 0 1 0 69 0 0 2 0 89 25 0 8 28 0 0 816 0 58 0 29 0 0 266 0 218 52 0 0 0 36 0 109 0 0 0 0 0 0 0 118 0 143 0 489 0 0 0 0 0 0 0 6 20 0 0 77 0 0 1 0 0 1 0 0 32 44 0 0 2 15 0 100 0 138 781 0 118 5 478 24 574 323 0 48 27 0 45 165 0 156 524 11 0 500 240 0 49 92 0 49 0 0 0 0 83 0 86 0 1 82 0 190 65 0 19 380 0 336 145 173 111 3 0 3 14 0 365 0 194 347 67 194 0 53 172 0 13 0 0 17 0 0 54 0 5 0 417 0 0 0 1 0 3 0 0 0 5 0 0 0 0 1 0 0 7 35 0 47 14 154 0 9 125 0 38 39 0 48 0 60 0 187 8 0 530 1 0 7 0 21 1 30 23 0 13 0 0 212 35 0 1 1 4 4 0 139 148 0 6 9 0 19 7 0 4 4 215 2 1 143 0 2 8 3 0 2 63 0 0 21 10 1 53 0 4 0 0 0 0 0 2 0 0 41 0 0 13 0 0 1 1 0 0 0 0 0 34 0 0 5 112 11 3 472 6 11 0 0 2 0 36 0 0 52 0 0 0 5 10 0 13 0 0 0 78 3 0 0 310 0 2 336 9 0 0 7 2 0 0 6 0 0 0 0 1 1 0 0 36 3 15 0 0 0 0 3 0 0 9 2 0 0 5 2 5 178 30 0 0 0 23 92 0 223 0 16 0 39 73 5 86 12 0 22 88 0 0 0 250 29 0 61 34 0 48 3 3 2 8 34 0 0 26 29 0 6 56 0 0 14 335 0 43 50 0 15 93 0 8 74 0 1 0 1271 0 0 0 0 43 173 0 0 14 0 21 8 1 40 16 0 32 1 0 0 3 6 0 42 53 0 18 0 0 5 29 11 0 71 107 0 0 8 0 0 3 40 0 299 48 3 0 24 83 0 88 22 0 147 1 0 10 4 24 0 12 0 1 108 4 0 0 3 0 0 19 16 0 6 0 10 1 7 0 0 41 0 2 0 0 0 60 0 0 148 0 132 359 5 0 525 31 8 0 135 18 0 29 2 0 0 0 2 0 2 2 2 2 19 2 0 131 0 2 361 0 53 81 0 0 9 0 12 71 0 0 280 14 35 35 246 0 0 2 0 11 769 2 0 0 20 34 0 1 0 0 0 226 20 5 0 0 12 0 0 117 1 0 1 2 0 0 0 0 0 0 386 173 0 0 0 0 6 38 0 22 3 0 0 0 2 0 57 23 0 2 2 74 0 21 0 0 261 21 1 47 0 0 0 0 16 1 1 480 0 4 2 5 8 0 176 0 2 20 0 8 1 33 24 0 2 12 0 203 7 14 0 23 5 0 1 0 1 34 67 0 0 0 0 0 12 590 4 0 163 1 3 1 1 0 3 8 2 3 30 2 2 134 14 15 0 102 44 0 12 4 0 87 71 0 1 73 11 0 84 3 0 115 71 0 0 24 3 0 253 10 0 360 346 0 1 6 50 0 127 0 14 0 0 0 1 4 0 141 4 12 2 22 45 3 7 1 14 515 0 0 272 5 0 1 177 0 0 38 2 8 22 2 46 243 85 0 3 4 4 8 137 0 186 371 303 0 32 167 0 1 138 0 43 0 0 0 14 44 2 0 0 1 0 21 4 0 56 1 0 49 13 5 0 5 226 0 4 0 0 1 65 0 0 5 2 0 6 6 0 74 6 1 0 17 111 4 0 0 360 1 20 11 0 3 76 0 0 4 0 0 1 1 2 0 0 0 2 12 3 1 40 35 0 249 54 0 0 58 0 306 135 0 0 58 5 0 3 1 2 0 0 0 6 0 2 48 0 2 0 2 0 2 4 24 15 0 8 0 2 131 0 0 16 0 0 0 8 8 1 25 5 0 6 1 0 29 129 6 0 5 46 0 20 23 27 0 0 60 163 0 0 0 86 0 77 20 0 82 0 6 0 0 0 0 0 0 1 22 6 0 4 459 0 20 13 50 158 0 0 106 121 4 13 1 0 3 30 1 18 1 140 0 13 51 0 31 86 0 0 22 3 0 36 3 0 32 31 0 0 0 0 0 23 95 0 0 0 8 0 7 4 3 2 2 0 4 8 2 0 3 6 0 11 1 1 0 3 2 15 0 SP140 Bacteria;Bacteroidetes;Bacteroidia;Bacteroidales;Prevotellaceae;Alloprevotella;sp. HMT914 0 0 1 0 0 38 0 72 0 0 48 42 4 3 0 0 0 0 107 226 0 0 0 1 4 2 0 0 0 0 94 1 1 26 2 0 1 0 1 0 118 7 0 0 0 0 1 0 0 0 0 0 0 0 12 4 0 0 0 31 1 0 0 10 310 0 0 8 0 78 0 28 0 0 0 13 5 0 0 0 2 36 0 5 8 1 14 4 0 3 4 0 0 4 0 293 0 0 0 0 0 0 0 1 0 8 0 0 578 0 0 0 123 96 3 56 6 26 34 43 0 0 63 31 2 0 11 0 0 2 73 86 0 0 76 296 1196 0 1 0 0 0 0 6 0 7 38 75 0 2 0 11 2 0 0 2 64 0 0 0 1 1 4 0 0 0 0 3 0 0 0 0 2 4 0 0 10 11 0 0 0 0 7 179 0 73 19 7 47 0 24 1 83 0 0 0 0 95 1 0 0 19 79 479 1 0 0 0 0 0 88 0 5 4 0 31 0 0 2 0 1 2 0 0 0 29 212 6 0 0 0 0 0 0 0 20 0 2 121 1 0 39 11 1 1 0 14 46 0 0 21 2 0 0 0 1 9 0 0 0 0 1 1 9 4 0 0 0 0 9 11 8 80 0 0 7 6 4 0 0 4 7 0 1 42 0 0 18 2 2 3 0 3 0 0 0 57 2 0 3 0 0 31 0 0 0 0 0 7 0 0 0 0 0 0 0 1 0 0 0 1 0 0 0 0 0 0 0 0 0 1 0 1 1 0 0 0 1 0 16 0 0 0 1 0 0 0 0 0 0 11 4 13 0 0 0 7 0 0 0 0 0 0 0 0 0 0 0 4 0 0 0 0 1 86 0 0 1 1 0 0 0 1 2 0 0 0 0 0 0 5 242 0 1 0 0 2 1 4 1 10 0 103 21 0 0 0 4 0 1 0 11 0 14 0 2 2 0 0 0 0 0 3 0 0 1 0 17 8 0 0 0 1 2 0 0 1 4 0 0 3 0 2 0 1 0 0 44 9 89 255 0 0 0 0 1 0 0 0 37 1 3 2 1 0 2 0 18 12 0 0 1 1 1 0 1 0 0 0 0 0 0 0 0 95 38 38 26 1 6 0 0 0 183 21 10 0 2 0 7 34 3 0 2 2 8 0 8 0 0 0 0 0 1 57 0 0 0 1 0 0 0 0 1 0 0 0 26 1 0 0 1 4 0 1 0 6 0 0 0 2 1 1 0 0 2 3 4 0 0 2 0 7 0 0 0 10 12 1 1 8 0 5 2 0 7 0 0 0 2 5 0 0 1 0 0 0 1 1 1 7 3 1 0 0 0 0 0 2 0 0 0 0 26 6 6 0 4 0 0 0 0 56 1 0 3 2 0 0 6 31 12 5 8 0 0 1 0 0 0 1 0 16 0 8 1 26 0 4 64 0 0 0 1 0 0 0 0 0 1 2 0 5 0 0 0 0 1 0 14 2 0 18 28 16 2 10 0 4 0 0 5 1 0 0 0 1 0 1 1 0 0 0 0 0 3 72 4 0 7 2 3 8 14 55 4 13 44 6 0 0 450 50 3 2 0 0 0 0 2 1 1 2 4 0 0 0 0 0 0 2 0 34 6 0 0 11 0 0 0 0 0 0 1 1 3 16 0 0 1 1 0 0 1 4 0 24 0 40 3 0 0 37 0 2 0 0 1 0 79 17 1 32 4 0 0 1 6 21 21 30 0 67 0 5 0 36 1 5 2 3 1 20 0 0 0 0 0 17 76 0 0 0 1 0 0 6 0 0 0 0 55 0 0 0 7 1 0 0 0 0 0 0 1 1 0 0 5 0 0 11 0 7 7 52 81 12 0 0 70 0 0 0 0 0 0 0 0 3 45 28 4 1 0 0 0 1 1 0 12 1 0 0 4 0 0 6 0 0 0 2 58 0 0 62 0 22 0 0 0 0 2 0 1 0 4 13 8 24 0 0 0 20 0 0 2 0 0 0 19 0 1 0 0 0 0 0 2 1 0 0 1 8 0 0 0 0 7 0 0 0 0 0 0 0 0 14 0 0 0 1 8 0 26 0 8 0 0 0 0 0 0 7 63 2 0 2 4 6 1 5 0 0 0 1 0 0 7 0 0 0 0 11 0 0 1 13 98 0 0 0 0 1 32 0 0 0 0 0 0 0 1 0 14 0 0 0 0 0 0 0 0 0 7 72 0 47 6 0 0 0 0 19 6 0 0 0 0 0 7 0 0 1 1 0 0 85 1 0 0 0 0 1 65 0 9 0 0 0 0 1 6 0 20 0 0 13 0 0 1 0 0 0 0 0 0 8 30 154 11 68 9 4 42 24 7 0 18 12 1 21 0 3 15 8 232 0 0 0 71 2 1 0 3 0 1 51 44 0 0 4 28 14 0 0 5 1 23 5 0 4 0 18 8 0 2 73 48 18 0 941 6 0 0 33 50 0 552 0 0 0 1 0 7 4 10 0 4 6 0 37 0 0 0 0 0 3 1 176 100 1 167 0 0 0 1 24 2 1 3 1 2 161 0 2 0 37 1 3 57 1 0 2 10 3 0 1 37 0 3 19 512 0 10 11 81 1601 0 1 368 11 2 7 5 425 47 0 16 4 4 6 4 17 12 5 19 417 111 54 16 293 2 0 0 0 0 12 3 0 9 12 49 13 57 53 5 56 10 0 0 0 1 25 1 0 0 46 6 74 1 30 0 0 0 440 0 1 14 0 0 121 1 1 16 6 84 37 23 53 37 2 0 0 19 0 0 1 0 2 0 2 12 3 3 1 37 0 25 0 65 275 2 0 61 2 0 4 7 1 16 1 123 22 18 70 26 25 0 8 52 22 82 0 88 7 2 92 34 24 1 149 91 0 18 423 7 0 0 0 29 13 238 6 0 0 0 36 36 58 6 15 23 0 6 2 1 26 27 0 0 0 0 0 25 174 94 18 42 35 1 19 34 0 4 5 3 37 1 15 25 0 0 6 29 0 0 0 92 0 0 18 15 0 13 0 3 9 0 21 0 18 19 15 28 3 3 35 77 0 0 15 53 12 155 36 161 32 28 6 0 5 30 13 0 7 2 1 0 16 3 27 61 116 1 56 183 3 0 7 269 1 67 33 11 0 4 3 84 0 1 23 0 11 3 8 0 0 25 3 0 207 0 4 13 0 6 0 0 140 137 0 3 1 125 0 0 1 0 8 10 2 6 2 10 5 0 0 260 11 1 51 0 32 1 34 60 303 128 17 70 3 23 36 0 1 5 0 42 38 81 0 14 0 25 10 548 3 23 0 9 93 2 0 2 939 12 27 96 3 1 0 0 0 1 0 20 16 20 9 24 39 3 3 27 0 2 170 10 43 0 0 0 1 9 203 7 7 160 31 97 0 38 3 1 108 15 0 99 0 15 67 7 3 3 1 82 47 0 109 75 5 0 4 5 0 0 0 0 0 13 1 0 0 4 0 16 0 0 16 16 36 6 53 86 2 7 112 15 47 20 6 20 47 188 1106 20 12 54 13 8 7 0 72 4 21 282 11 0 17 3 0 39 6 13 27 21 36 0 4 113 0 0 48 5 97 1 0 0 0 0 12 44 0 3 19 414 0 0 0 0 26 24 121 220 3 26 0 10 5 42 6 234 632 12 0 3 1 0 0 0 163 67 0 8 3 3 0 1 8 0 0 0 0 19 3 4 76 44 45 9 0 2 0 1 9 41 0 9 59 10 3 25 21 27 11 5 31 37 258 1 5 16 2 263 0 0 723 14 1 63 0 25 2 0 0 0 0 0 61 203 91 146 25 6 124 29 0 0 3 309 758 43 11 134 0 0 620 20 0 135 4 0 102 1 0 0 36 71 1169 291 10 0 2 4 1 259 9 5 6 3 21 0 8 0 0 48 0 0 6 10 2 4 30 1 23 2 7 187 25 85 8 22 6 3 40 1 112 3 3 0 12 0 0 0 0 9 26 0 13 8 122 0 0 31 47 0 40 41 0 59 11 0 0 0 1 0 58 1 0 1 10 10 0 0 0 0 0 11 122 0 0 70 7 50 1050 523 9 93 0 0 0 21 0 19 62 219 8 3 126 6 0 1 0 1 0 0 4 59 121 125 222 0 14 0 SP141 Bacteria;Firmicutes;Bacilli;Lactobacillales;Streptococcaceae;Streptococcus;gordonii 4 599 3 193 0 4 0 5 17 140 15 143 0 6 39 16 114 0 13 6 60 29 166 1140 116 70 808 16 0 0 10 0 105 27 108 5 108 23 0 0 0 0 137 2 2 5 26 20 3285 0 23 30 119 1 3 0 63 3 4 253 167 1 0 0 1 0 6 2 44 4 347 15 24 13 43 10 11 0 6 165 31 0 25 119 0 2 16 60 21 23 24 21 15 223 0 34 201 27 1 46 9 9 43 5 1 5 0 10 31 0 92 9 71 95 9 2 1 37 2 0 173 2 15 20 3 27 47 0 25 22 6 0 71 10 0 0 0 82 1 1 31 2 8 323 11 36 19 16 0 1 22 0 164 55 545 17 27 0 55 12 4 53 4 0 0 134 529 43 184 22 1 496 0 0 32 98 1 3 19 2 0 0 15 119 0 2 0 23 0 0 0 16 4 0 37 59 0 73 74 10 221 0 0 0 15 0 3 221 236 1 13 1 77 2 11 2 11 9 0 47 31 10 22 5 96 8 0 6 438 3 323 1 243 37 0 0 18 210 3 314 26 4 17 3 0 5 0 17 0 1 27 0 0 42 3 0 101 4 81 25 1228 10 18 21 348 198 1 184 0 0 0 0 0 0 0 0 0 0 0 0 0 0 0 0 0 0 0 0 0 0 0 0 0 0 0 0 0 0 0 0 0 0 0 0 0 0 0 0 0 0 0 0 0 0 0 0 0 0 0 0 0 0 0 0 0 0 0 0 0 0 0 0 0 0 0 0 0 0 0 0 0 0 0 0 0 0 0 0 0 0 0 0 0 0 0 0 0 0 0 0 0 0 0 0 0 0 0 0 0 0 0 0 0 0 0 0 0 0 0 0 0 0 0 0 0 0 0 0 0 0 0 0 0 0 0 0 0 0 0 0 0 0 0 0 0 0 0 0 0 0 0 0 0 0 0 0 0 0 0 0 0 0 0 0 0 0 0 0 0 0 0 0 0 0 0 0 0 0 0 0 0 0 0 0 0 0 0 0 0 0 0 0 0 0 0 0 0 0 0 0 0 0 0 0 0 0 0 0 0 0 0 0 0 0 0 0 0 0 0 0 0 0 0 0 0 0 0 0 0 0 0 0 0 0 0 0 0 0 0 0 0 0 0 0 0 0 0 0 0 0 0 0 0 0 0 0 0 0 0 0 0 0 0 0 0 0 0 0 0 0 0 0 0 0 0 0 0 0 0 0 0 0 0 0 0 0 0 0 0 0 0 0 0 0 0 0 0 0 0 0 0 0 0 0 0 0 0 0 0 0 0 0 0 0 0 0 0 0 0 0 0 0 0 0 0 0 0 0 0 0 0 0 0 0 0 0 0 0 0 0 0 0 0 0 0 0 0 0 0 0 0 0 0 0 0 0 0 0 0 0 0 0 0 0 0 0 0 0 0 0 0 0 0 0 0 0 0 0 0 0 0 0 0 0 0 0 0 0 0 0 0 0 0 0 0 0 0 0 0 0 0 0 0 0 0 0 0 0 0 0 0 0 0 0 0 0 0 0 0 0 0 0 0 0 0 0 0 0 0 0 0 0 0 0 0 0 0 0 0 0 0 0 0 0 0 0 0 0 0 0 0 0 0 0 0 0 0 0 0 0 0 0 0 0 0 0 0 0 0 0 0 0 0 0 0 0 0 0 0 0 0 0 0 0 0 0 0 0 0 0 0 0 0 0 0 0 0 0 0 0 0 0 0 0 0 0 0 0 0 0 0 0 0 0 0 0 0 0 0 0 0 0 0 0 0 0 0 0 0 0 0 0 0 0 0 0 0 0 0 0 0 0 0 0 0 0 0 0 0 0 0 0 0 0 0 0 0 0 0 0 0 0 0 0 0 0 0 0 0 0 0 0 0 0 0 0 0 0 0 0 0 0 0 0 0 0 0 0 0 0 0 0 0 0 0 0 0 0 0 0 0 0 0 0 0 0 0 0 0 0 0 0 0 0 0 0 0 0 0 0 0 0 0 0 0 0 0 0 0 0 0 0 0 0 0 0 0 0 0 0 0 0 0 0 0 0 0 0 0 0 0 0 0 0 0 0 0 0 0 0 0 0 0 0 0 0 0 0 0 0 0 0 0 0 0 0 0 0 0 0 0 0 0 0 0 0 0 0 0 0 0 0 0 0 0 0 0 0 0 0 0 0 0 0 0 0 0 0 0 0 0 0 0 0 0 0 0 0 0 0 0 0 0 0 0 0 0 0 0 0 0 0 0 0 0 0 0 0 0 0 0 0 0 0 0 0 0 0 0 0 0 0 0 0 0 0 0 0 0 0 0 0 0 0 0 0 0 0 0 0 0 0 0 0 0 0 0 0 0 0 0 0 0 0 0 0 0 0 0 0 0 0 0 0 0 0 0 0 0 0 0 0 0 0 0 0 0 0 0 0 0 0 0 0 0 0 0 0 0 0 0 0 0 0 0 0 0 0 0 0 0 0 0 0 0 0 0 0 0 0 0 0 0 0 0 0 0 0 0 0 0 0 0 0 0 0 0 0 0 0 0 0 0 0 0 0 0 0 0 0 0 0 0 0 0 0 0 0 0 0 0 0 0 0 0 0 0 0 0 0 0 0 0 0 0 0 0 0 0 0 0 0 0 0 0 0 0 0 0 0 0 0 0 0 0 0 0 0 0 0 0 0 0 0 0 0 0 0 0 0 0 0 0 0 0 0 0 0 0 0 0 0 0 0 0 0 0 0 0 0 0 0 0 0 0 0 0 0 0 0 0 0 0 0 0 0 0 0 0 0 0 0 0 0 0 0 0 0 0 0 0 0 0 0 0 0 0 0 0 0 0 0 0 0 0 0 0 0 0 0 0 0 0 0 0 0 0 0 0 0 0 0 0 0 0 0 0 0 0 0 0 0 0 0 0 0 0 0 0 0 0 0 0 0 0 0 0 0 0 0 0 0 0 0 0 0 0 0 0 0 0 0 0 0 0 0 0 0 0 0 0 0 0 0 0 0 0 0 0 0 0 0 0 0 0 0 0 0 0 0 0 0 0 0 0 0 0 0 0 0 0 0 0 0 0 0 0 0 0 0 0 0 0 0 0 0 0 0 0 0 0 0 0 0 0 0 0 0 0 0 0 0 0 0 0 0 0 0 0 0 0 0 0 0 0 0 0 0 0 0 0 0 0 0 0 0 0 0 0 0 0 0 0 0 0 0 0 0 0 0 0 0 0 0 0 0 0 0 0 0 0 0 0 0 0 0 0 0 0 0 0 0 0 0 0 0 0 0 0 0 0 0 0 0 0 0 0 0 0 0 0 0 0 0 0 0 0 0 0 0 0 0 0 0 0 0 0 0 0 0 0 0 0 0 0 0 0 0 0 0 0 0 0 0 0 0 0 0 0 0 0 0 0 0 0 0 0 0 0 0 0 0 0 0 0 0 0 0 0 0 0 0 0 0 0 0 0 0 0 0 0 0 0 0 0 0 0 0 0 0 0 0 0 0 0 0 0 0 0 0 0 0 0 0 0 0 0 0 0 0 0 0 0 0 0 0 0 0 0 0 0 0 0 0 0 0 0 0 0 0 0 0 0 0 0 0 0 0 0 0 0 0 0 0 0 0 0 0 0 0 0 0 0 0 0 0 0 0 0 0 0 0 0 0 0 0 0 0 0 0 0 0 0 0 0 0 0 0 0 0 0 0 0 0 0 0 0 0 0 0 0 0 0 0 0 0 0 0 0 0 0 0 0 0 0 0 0 0 0 0 0 0 0 0 0 0 0 0 0 0 0 0 0 0 0 0 0 0 0 0 0 0 0 0 0 0 0 0 0 0 0 0 0 0 0 0 0 0 0 0 0 0 0 0 0 0 0 0 0 0 0 0 0 0 0 0 0 0 0 0 0 0 0 0 0 0 0 0 0 0 0 0 0 0 0 0 0 0 0 0 0 0 0 0 0 0 0 0 0 0 0 0 0 0 0 0 0 0 0 0 0 0 0 0 0 0 0 0 0 0 0 0 0 0 0 0 0 0 0 0 0 0 0 0 0 0 0 0 0 0 0 0 0 0 0 0 0 0 0 0 0 0 0 0 0 0 0 0 0 0 0 0 0 0 0 0 0 0 0 0 0 0 0 0 SP142 Bacteria;Proteobacteria;Betaproteobacteria;Neisseriales;Neisseriaceae;Neisseria;elongata 0 4 10 1 0 21 5 29 777 45 4 463 49 3 10113 0 2 7 7 7 0 0 0 10 3 3 113 1 150 3679 0 0 8 1881 25 1 2 0 4 22 39 31 31 4 220 1 0 0 0 7 5 4 0 2 1 130 1 95 3 28 74 8 0 14 13 11 12 14 141 13 115 76 7 1 0 3 0 2 2 14 52 2 2 2 2 5 4 5 0 16 3 0 44 87 0 3 4421 955 920 4 0 2 26 107 0 25 3 0 11 1 0 30 5 34 9 0 8 3 16 47 287 0 3 38 1 1 10 1 26 768 40 5 0 19 168 265 0 15 0 3324 12 40 1 137 19 27 10 16 4 0 18 0 381 0 0 2 3 1 105 0 8 145 0 0 4 1 6 3 450 313 0 1 0 0 35 2 5 6 301 18 2 3 4 2 11 51 26 10 78 334 1 1 0 3 6 2 0 6 1 9 3 992 71 659 42 4 3 6 4 5 3 593 270 5 0 65 8 0 0 59 103 6 2 2 30 13431 14 8740 88 16 40 0 1 4 0 0 104 7 0 2466 1792 19 34 0 5 1 60 14 27 1 1 8 1 1 0 1 3 0 0 5 0 5 4 80 2 6 13 14 0 0 0 0 0 0 0 0 0 0 0 0 0 0 0 0 0 0 0 0 0 0 0 0 0 0 0 0 0 0 0 0 0 0 0 0 0 0 0 0 0 0 0 0 0 0 0 0 0 0 0 0 0 0 0 0 0 0 0 0 0 0 0 0 0 0 0 0 0 0 0 0 0 0 0 0 0 0 0 0 0 0 0 0 0 0 0 0 0 0 0 0 0 0 0 0 0 0 0 0 0 0 0 0 0 0 0 0 0 0 0 0 0 0 0 0 0 0 0 0 0 0 0 0 0 0 0 0 0 0 0 0 0 0 0 0 0 0 0 0 0 0 0 0 0 0 0 0 0 0 0 0 0 0 0 0 0 0 0 0 0 0 0 0 0 0 0 0 0 0 0 0 0 0 0 0 0 0 0 0 0 0 0 0 0 0 0 0 0 0 0 0 0 0 0 0 0 0 0 0 0 0 0 0 0 0 0 0 0 0 0 0 0 0 0 0 0 0 0 0 0 0 0 0 0 0 0 0 0 0 0 0 0 0 0 0 0 0 0 0 0 0 0 0 0 0 0 0 0 0 0 0 0 0 0 0 0 0 0 0 0 0 0 0 0 0 0 0 0 0 0 0 0 0 0 0 0 0 0 0 0 0 0 0 0 0 0 0 0 0 0 0 0 0 0 0 0 0 0 0 0 0 0 0 0 0 0 0 0 0 0 0 0 0 0 0 0 0 0 0 0 0 0 0 0 0 0 0 0 0 0 0 0 0 0 0 0 0 0 0 0 0 0 0 0 0 0 0 0 0 0 0 0 0 0 0 0 0 0 0 0 0 0 0 0 0 0 0 0 0 0 0 0 0 0 0 0 0 0 0 0 0 0 0 0 0 0 0 0 0 0 0 0 0 0 0 0 0 0 0 0 0 0 0 0 0 0 0 0 0 0 0 0 0 0 0 0 0 0 0 0 0 0 0 0 0 0 0 0 0 0 0 0 0 0 0 0 0 0 0 0 0 0 0 0 0 0 0 0 0 0 0 0 0 0 0 0 0 0 0 0 0 0 0 0 0 0 0 0 0 0 0 0 0 0 0 0 0 0 0 0 0 0 0 0 0 0 0 0 0 0 0 0 0 0 0 0 0 0 0 0 0 0 0 0 0 0 0 0 0 0 0 0 0 0 0 0 0 0 0 0 0 0 0 0 0 0 0 0 0 0 0 0 0 0 0 0 0 0 0 0 0 0 0 0 0 0 0 0 0 0 0 0 0 0 0 0 0 0 0 0 0 0 0 0 0 0 0 0 0 0 0 0 0 0 0 0 0 0 0 0 0 0 0 0 0 0 0 0 0 0 0 0 0 0 0 0 0 0 0 0 0 0 0 0 0 0 0 0 0 0 0 0 0 0 0 0 0 0 0 0 0 0 0 0 0 0 0 0 0 0 0 0 0 0 0 0 0 0 0 0 0 0 0 0 0 0 0 0 0 0 0 0 0 0 0 0 0 0 0 0 0 0 0 0 0 0 0 0 0 0 0 0 0 0 0 0 0 0 0 0 0 0 0 0 0 0 0 0 0 0 0 0 0 0 0 0 0 0 0 0 0 0 0 0 0 0 0 0 0 0 0 0 0 0 0 0 0 0 0 0 0 0 0 0 0 0 0 0 0 0 0 0 0 0 0 0 0 0 0 0 0 0 0 0 0 0 0 0 0 0 0 0 0 0 0 0 0 0 0 0 0 0 0 0 0 0 0 0 0 0 0 0 0 0 0 0 0 0 0 0 0 0 0 0 0 0 0 0 0 0 0 0 0 0 0 0 0 0 0 0 0 0 0 0 0 0 0 0 0 0 0 0 0 0 0 0 0 0 0 0 0 0 0 0 0 0 0 0 0 0 0 0 0 0 0 0 0 0 0 0 0 0 0 0 0 0 0 0 0 0 0 0 0 0 0 0 0 0 0 0 0 0 0 0 0 0 0 0 0 0 0 0 0 0 0 0 0 0 0 0 0 0 0 0 0 0 0 0 0 0 0 0 0 0 0 0 0 0 0 0 0 0 0 0 0 0 0 0 0 0 0 0 0 0 0 0 0 0 0 0 0 0 0 0 0 0 0 0 0 0 0 0 0 0 0 0 0 0 0 0 0 0 0 0 0 0 0 0 0 0 0 0 0 0 0 0 0 0 0 0 0 0 0 0 0 0 0 0 0 0 0 0 0 0 0 0 0 0 0 0 0 0 0 0 0 0 0 0 0 0 0 0 0 0 0 0 0 0 0 0 0 0 0 0 0 0 0 0 0 0 0 0 0 0 0 0 0 0 0 0 0 0 0 0 0 0 0 0 0 0 0 0 0 0 0 0 0 0 0 0 0 0 0 0 0 0 0 0 0 0 0 0 0 0 0 0 0 0 0 0 0 0 0 0 0 0 0 0 0 0 0 0 0 0 0 0 0 0 0 0 0 0 0 0 0 0 0 0 0 0 0 0 0 0 0 0 0 0 0 0 0 0 0 0 0 0 0 0 0 0 0 0 0 0 0 0 0 0 0 0 0 0 0 0 0 0 0 0 0 0 0 0 0 0 0 0 0 0 0 0 0 0 0 0 0 0 0 0 0 0 0 0 0 0 0 0 0 0 0 0 0 0 0 0 0 0 0 0 0 0 0 0 0 0 0 0 0 0 0 0 0 0 0 0 0 0 0 0 0 0 0 0 0 0 0 0 0 0 0 0 0 0 0 0 0 0 0 0 0 0 0 0 0 0 0 0 0 0 0 0 0 0 0 0 0 0 0 0 0 0 0 0 0 0 0 0 0 0 0 0 0 0 0 0 0 0 0 0 0 0 0 0 0 0 0 0 0 0 0 0 0 0 0 0 0 0 0 0 0 0 0 0 0 0 0 0 0 0 0 0 0 0 0 0 0 0 0 0 0 0 0 0 0 0 0 0 0 0 0 0 0 0 0 0 0 0 0 0 0 0 0 0 0 0 0 0 0 0 0 0 0 0 0 0 0 0 0 0 0 0 0 0 0 0 0 0 0 0 0 0 0 0 0 0 0 0 0 0 0 0 0 0 0 0 0 0 0 0 0 0 0 0 0 0 0 0 0 0 0 0 0 0 0 0 0 0 0 0 0 0 0 0 0 0 0 0 0 0 0 0 0 0 0 0 0 0 0 0 0 0 0 0 0 0 0 0 0 0 0 0 0 0 0 0 0 0 0 0 0 0 0 0 0 0 0 0 0 0 0 0 0 0 0 0 0 0 0 0 0 0 0 0 0 0 0 0 0 0 0 0 0 0 0 0 0 0 0 0 0 0 0 0 0 0 0 0 0 0 0 0 0 0 0 0 0 0 0 0 0 0 0 0 0 0 0 0 0 0 0 0 0 0 0 0 0 0 0 0 0 0 0 0 0 0 0 0 0 0 0 0 0 0 0 0 0 0 0 0 0 0 0 0 0 0 0 0 0 0 0 0 0 0 0 0 0 0 0 0 0 0 0 0 0 0 0 0 0 0 0 0 0 0 0 0 0 SP147 Bacteria;Proteobacteria;Gammaproteobacteria;Pasteurellales;Pasteurellaceae;Haemophilus;parainfluenzae 24 1904 187 158 5040 323 362 516 65 826 49 1170 8363 365 9918 265 733 1110 1115 821 1363 2155 812 359 2112 383 404 743 2769 1250 939 1380 327 3076 2542 7567 381 322 2775 566 3726 916 2621 749 678 2085 1739 2442 22 381 249 15 543 1343 2224 767 119 938 413 1018 1433 451 3829 2460 4520 593 384 1139 1770 5113 1464 1584 3582 370 164 227 94 115 687 872 728 5137 168 990 541 19 5198 295 40 1833 209 962 842 1158 477 410 761 4033 582 125 20 249 493 1237 21 1989 1398 287 2915 677 1094 203 42 1496 1441 1515 1669 2493 1380 1105 4745 1417 1517 3781 4283 260 1682 2630 2765 509 1760 8236 8 5477 1935 3543 10089 510 17 6158 265 507 227 604 922 370 739 3230 83 1018 1229 1470 4520 590 196 79 457 60 3719 110 294 224 2937 377 98 64 42 83 215 16 7136 74 151 1019 93 23 122 89 1143 499 789 526 1713 2833 1158 2279 925 10526 737 1804 403 344 172 194 548 296 9464 797 228 4181 1332 769 1706 1437 283 459 255 8 525 210 76 3636 1161 1109 3067 1196 65 12 43 477 2366 382 77 243 2495 1604 5061 2128 1627 2581 1159 109 1272 2173 5203 764 604 172 1481 1212 143 6304 2350 160 27 298 81 1264 1373 2247 371 262 138 12 5 12 52 9 61 105 194 485 31 358 1186 13 1321 656 1 315 18 304 385 1 57 83 48 118 22 273 223 199 12 41 2442 1946 99 518 17 2602 160 487 73 5602 258 138 2279 438 0 540 572 87 390 101 516 735 1208 338 838 1368 1 1170 39 524 1604 515 552 136 364 3 1593 341 10 0 425 6 13 0 8 6 24 81 128 24 8 5 74 104 76 188 309 30 1 102 386 79 73 67 64 149 1857 1862 1140 174 143 64 1435 64 287 200 1269 357 0 326 259 46 0 337 32 0 316 2771 5 428 410 155 11 21 1573 93 588 0 139 341 27 401 201 310 1 1123 178 2701 0 221 296 364 404 4 570 576 1317 13 13 226 4 0 0 208 72 4 715 48 11 7 25 45 1396 0 53 120 364 29 138 4 70 23 113 7 228 594 782 80 399 194 149 456 166 173 99 75 5 189 1681 8 9 993 7 0 238 155 0 227 61 8 2 814 265 247 2 57 804 68 1141 530 15 567 1 203 3 35 140 745 1349 43 1897 30 1945 216 33 474 195 158 164 27 174 1343 83 185 23 687 983 21 5 590 351 2554 879 2211 7523 1197 195 2284 6 278 4 48 1380 2959 99 0 262 2 25 177 48 19 26 56 4 229 1242 337 1574 1376 66 1 107 21 577 182 902 19 19 4 60 0 1556 100 366 353 340 537 43 149 13 89 125 30 192 14 28 68 794 61 35 0 52 98 68 294 325 75 255 80 14 31 76 1215 397 535 367 1 150 383 439 1302 102 982 31 1 468 1956 665 1 17 83 564 409 194 13 9 2 35 215 57 251 77 345 2 23 1 108 305 3 27 603 5 145 1797 291 9 1690 205 13 240 361 25 471 456 256 788 67 266 1 293 130 88 12 192 104 25 673 1351 64 78 124 67 117 170 660 26 616 566 20 162 1923 0 225 431 155 14 839 14 88 142 2 21 896 12 20 47 6 131 29 127 0 8 454 744 2634 1581 14 48 130 162 475 362 107 125 134 1 56 119 3599 119 1841 149 33 6 8 973 498 1797 149 277 151 14 709 0 1882 1022 542 102 37 2288 228 26 124 31 95 666 2833 51 55 44 185 84 28 3678 42 28 1357 191 32 38 89 247 116 376 2269 31 120 46 1058 74 107 272 279 207 380 501 11 93 10321 23 655 111 1440 259 971 340 838 633 110 37 25 1483 398 177 180 24 674 479 86 120 641 2440 1991 100 259 118 36 263 6 77 2681 179 5280 61 678 3 59 1 21 16 317 148 29 523 15 73 1224 247 16 25 1473 317 1 2 679 2006 3204 1242 5 187 85 12 9 118 56 28 4 1249 71 120 302 594 13 37 99 47 16 134 50 1546 3536 37 225 290 571 305 39 950 2 13 610 875 42 1208 611 6 32 199 516 196 16 17 489 551 93 1466 102 415 1 161 788 160 266 946 21 753 26 735 6 857 323 29 462 110 140 11 1531 46 1247 48 97 349 267 257 710 122 74 62 159 16 2 11 1622 49 384 162 2642 1907 4483 3161 140 324 66 14 21 21 12 3 0 23 1189 472 83 52 133 245 349 0 20 265 33 0 10 140 5 254 139 1935 38 816 25 10 918 781 289 104 151 82 35 0 1142 327 2036 49 677 224 47 1541 684 552 1275 246 10 181 607 804 23 191 47 2537 1146 368 379 221 99 200 1798 9 75 32 8 466 395 328 244 1 116 3176 900 162 614 1182 348 2 201 110 17 761 384 43 179 1 28 16 859 355 52 273 559 2226 95 128 397 21 9 46 59 15 107 531 8 0 6640 115 1 16 21 2 1424 423 513 8 0 642 5 116 36 35 680 130 0 1368 633 1308 102 1807 1344 355 1526 1220 460 635 1075 1421 31 556 659 746 528 4177 271 1583 1067 18 805 2819 351 3 1233 215 2 2234 2170 2 366 672 543 103 0 196 519 102 753 151 59 582 368 1444 449 464 346 393 470 737 2 601 804 1486 178 584 1388 269 2669 392 835 67 148 296 612 341 645 54 2283 648 2013 1016 0 70 683 1790 81 204 153 465 394 1013 458 1341 1165 3008 1146 1986 727 635 510 160 201 413 4 560 1042 294 224 510 2056 5897 6623 2746 595 89 714 2885 1016 3406 1038 1471 471 37 673 926 1640 384 107 58 293 274 1245 440 466 406 833 274 1900 784 3197 1808 603 1847 1796 2545 171 334 1777 209 845 896 496 1025 777 945 3299 1169 542 2366 751 1883 1724 5868 1369 619 2666 1114 818 201 416 408 31 5147 409 1998 498 478 474 2106 1639 669 196 304 398 520 627 37 4992 2395 562 1673 2087 468 3119 778 562 219 1340 299 896 24 1663 1145 869 144 242 248 3991 292 152 554 1048 451 70 954 1461 108 2436 363 695 29 1650 237 320 119 8717 1051 638 648 511 78 3410 733 584 990 919 703 988 2 759 1181 386 3580 198 2429 1900 738 1213 341 2325 892 6 1226 1117 137 122 534 146 385 2880 1029 1453 138 712 1015 29 2518 304 802 416 587 706 10 668 102 128 547 1020 313 1436 284 354 93 232 1700 795 285 192 799 551 456 250 237 2312 1360 1590 1047 355 401 4081 2244 1303 5590 2190 3 538 588 1540 555 5276 1924 324 612 3347 737 1404 974 294 383 68 1169 2242 649 1792 1066 1610 2699 598 2 1471 530 2135 1142 496 834 2049 927 685 3 2738 515 2115 594 1340 1989 1375 4394 879 819 781 1192 1036 2202 697 1608 607 2651 1735 4308 4515 155 593 770 1340 65 458 654 153 294 2227 2848 2750 1768 1307 49 449 496 313 859 1588 744 386 20 240 777 0 6189 1093 722 651 25 1219 224 266 386 997 984 558 424 1483 233 554 543 545 932 1630 199 3221 836 2016 218 3550 4344 1025 2629 1099 1756 769 188 1178 454 1389 765 2874 1215 36 1438 1890 1689 1449 128 54 2465 2075 1539 1215 983 614 706 2105 646 2106 77 260 0 223 430 839 1950 657 309 516 686 19 292 636 726 440 532 861 1346 125 449 745 316 1435 60 2 5241 752 71 199 867 1476 2810 1534 1746 1303 1591 206 1725 2469 869 5418 623 1519 474 3390 1158 2759 943 1816 7855 4022 3 978 2148 465 3961 1950 5091 2172 872 761 1068 1208 1669 15 60 1259 605 842 960 1920 308 1656 72 1 3400 1137 1177 537 536 1537 771 99 3 1844 1496 152 1406 654 859 467 344 1714 1532 1925 734 2667 122 233 800 289 1017 344 2109 1653 302 1041 8897 1367 1198 1424 704 1727 396 653 256 1 1752 2638 3772 445 1130 34 2169 952 2011 183 2660 899 63 3928 251 463 5191 3159 1519 957 1734 232 409 495 285 1894 763 2064 2561 1949 1921 447 55 805 523 41 3 1039 315 2202 910 1848 303 1653 1111 1289 220 497 321 104 24 425 112 332 1849 4185 774 204 383 393 28 1284 164 204 3567 944 5 2440 1260 3434 2408 766 454 536 788 1230 1355 1877 2867 385 1426 1513 304 2079 2553 578 3552 1029 3960 1827 1730 3382 2241 2765 2167 349 250 996 1666 702 4850 1273 591 245 2737 1296 1441 931 1525 884 1580 5353 646 4836 2674 2978 2287 2183 74 460 627 103 2071 424 1003 114 2736 545 1405 837 1566 441 424 1221 995 613 109 81 1536 84 219 1157 69 662 118 686 188 45 3404 1705 289 303 722 1677 523 185 1093 2323 544 3252 2562 328 416 1168 1741 1502 2222 202 1555 5877 1682 1708 615 8 694 2168 1184 1004 693 565 150 1 5 1308 502 130 346 87 5 241 504 415 2729 1066 62 339 1106 2790 14 1757 2383 726 606 956 870 1028 912 1177 778 914 549 18 147 4612 636 2221 2020 1581 9 0 5157 1784 2182 1696 1201 1651 1098 156 745 1439 840 637 282 3138 1257 2355 846 2005 3104 366 1846 3187 170 7 SP15 Bacteria;Actinobacteria;Actinomycetia;Actinomycetales;Actinomycetaceae;Actinomyces;sp. HMT175 17 2 304 94 121 9 195 137 178 320 1 4 26 43 8 9 1 6 22 4 15 84 34 30 91 62 187 2 0 0 17 3 54 21 8 6 36 283 0 3 5 3 10 224 3 3 429 376 864 10 4 114 32 205 39 0 13 63 102 33 46 141 102 0 0 60 2 54 21 18 221 39 2 1 93 3 5 47 47 93 3 12 45 15 0 0 44 18 60 11 26 38 6 75 478 94 29 102 4 28 189 352 0 67 13 21 2 17 4 79 530 112 179 82 1 0 8 13 269 132 0 8 5 115 30 9 4 20 0 544 31 6 19 32 0 77 0 35 0 5 81 100 638 33 235 76 16 15 15 10 33 4 37 100 53 14 4 411 44 82 2 8 0 0 0 12 295 16 1980 250 94 104 0 42 1 105 32 21 42 411 7 57 44 41 12 6 4 8 0 0 60 31 7 3 5 148 8 30 40 4 127 5 7 35 9 5 2 25 187 236 10 75 12 16 92 96 2 100 43 24 23 0 1 26 0 7 2 11 79 1 107 23 58 12 14 6 18 35 1 243 11 1 15 16 440 68 3 25 2 9 11 3 3 60 16 11 0 0 85 2 114 21 222 5 61 315 7 0 0 0 0 0 0 0 0 0 0 0 0 0 0 0 0 0 0 0 0 0 0 0 0 0 0 0 0 0 0 0 0 0 0 0 0 0 0 0 0 0 0 0 0 0 0 0 0 0 0 0 0 0 0 0 0 0 0 0 0 0 0 0 0 0 0 0 0 0 0 0 0 0 0 0 0 0 0 0 0 0 0 0 0 0 0 0 0 0 0 0 0 0 0 0 0 0 0 0 0 0 0 0 0 0 0 0 0 0 0 0 0 0 0 0 0 0 0 0 0 0 0 0 0 0 0 0 0 0 0 0 0 0 0 0 0 0 0 0 0 0 0 0 0 0 0 0 0 0 0 0 0 0 0 0 0 0 0 0 0 0 0 0 0 0 0 0 0 0 0 0 0 0 0 0 0 0 0 0 0 0 0 0 0 0 0 0 0 0 0 0 0 0 0 0 0 0 0 0 0 0 0 0 0 0 0 0 0 0 0 0 0 0 0 0 0 0 0 0 0 0 0 0 0 0 0 0 0 0 0 0 0 0 0 0 0 0 0 0 0 0 0 0 0 0 0 0 0 0 0 0 0 0 0 0 0 0 0 0 0 0 0 0 0 0 0 0 0 0 0 0 0 0 0 0 0 0 0 0 0 0 0 0 0 0 0 0 0 0 0 0 0 0 0 0 0 0 0 0 0 0 0 0 0 0 0 0 0 0 0 0 0 0 0 0 0 0 0 0 0 0 0 0 0 0 0 0 0 0 0 0 0 0 0 0 0 0 0 0 0 0 0 0 0 0 0 0 0 0 0 0 0 0 0 0 0 0 0 0 0 0 0 0 0 0 0 0 0 0 0 0 0 0 0 0 0 0 0 0 0 0 0 0 0 0 0 0 0 0 0 0 0 0 0 0 0 0 0 0 0 0 0 0 0 0 0 0 0 0 0 0 0 0 0 0 0 0 0 0 0 0 0 0 0 0 0 0 0 0 0 0 0 0 0 0 0 0 0 0 0 0 0 0 0 0 0 0 0 0 0 0 0 0 0 0 0 0 0 0 0 0 0 0 0 0 0 0 0 0 0 0 0 0 0 0 0 0 0 0 0 0 0 0 0 0 0 0 0 0 0 0 0 0 0 0 0 0 0 0 0 0 0 0 0 0 0 0 0 0 0 0 0 0 0 0 0 0 0 0 0 0 0 0 0 0 0 0 0 0 0 0 0 0 0 0 0 0 0 0 0 0 0 0 0 0 0 0 0 0 0 0 0 0 0 0 0 0 0 0 0 0 0 0 0 0 0 0 0 0 0 0 0 0 0 0 0 0 0 0 0 0 0 0 0 0 0 0 0 0 0 0 0 0 0 0 0 0 0 0 0 0 0 0 0 0 0 0 0 0 0 0 0 0 0 0 0 0 0 0 0 0 0 0 0 0 0 0 0 0 0 0 0 0 0 0 0 0 0 0 0 0 0 0 0 0 0 0 0 0 0 0 0 0 0 0 0 0 0 0 0 0 0 0 0 0 0 0 0 0 0 0 0 0 0 0 0 0 0 0 0 0 0 0 0 0 0 0 0 0 0 0 0 0 0 0 0 0 0 0 0 0 0 0 0 0 0 0 0 0 0 0 0 0 0 0 0 0 0 0 0 0 0 0 0 0 0 0 0 0 0 0 0 0 0 0 0 0 0 0 0 0 0 0 0 0 0 0 0 0 0 0 0 0 0 0 0 0 0 0 0 0 0 0 0 0 0 0 0 0 0 0 0 0 0 0 0 0 0 0 0 0 0 0 0 0 0 0 0 0 0 0 0 0 0 0 0 0 0 0 0 0 0 0 0 0 0 0 0 0 0 0 0 0 0 0 0 0 0 0 0 0 0 0 0 0 0 0 0 0 0 0 0 0 0 0 0 0 0 0 0 0 0 0 0 0 0 0 0 0 0 0 0 0 0 0 0 0 0 0 0 0 0 0 0 0 0 0 0 0 0 0 0 0 0 0 0 0 0 0 0 0 0 0 0 0 0 0 0 0 0 0 0 0 0 0 0 0 0 0 0 0 0 0 0 0 0 0 0 0 0 0 0 0 0 0 0 0 0 0 0 0 0 0 0 0 0 0 0 0 0 0 0 0 0 0 0 0 0 0 0 0 0 0 0 0 0 0 0 0 0 0 0 0 0 0 0 0 0 0 0 0 0 0 0 0 0 0 0 0 0 0 0 0 0 0 0 0 0 0 0 0 0 0 0 0 0 0 0 0 0 0 0 0 0 0 0 0 0 0 0 0 0 0 0 0 0 0 0 0 0 0 0 0 0 0 0 0 0 0 0 0 0 0 0 0 0 0 0 0 0 0 0 0 0 0 0 0 0 0 0 0 0 0 0 0 0 0 0 0 0 0 0 0 0 0 0 0 0 0 0 0 0 0 0 0 0 0 0 0 0 0 0 0 0 0 0 0 0 0 0 0 0 0 0 0 0 0 0 0 0 0 0 0 0 0 0 0 0 0 0 0 0 0 0 0 0 0 0 0 0 0 0 0 0 0 0 0 0 0 0 0 0 0 0 0 0 0 0 0 0 0 0 0 0 0 0 0 0 0 0 0 0 0 0 0 0 0 0 0 0 0 0 0 0 0 0 0 0 0 0 0 0 0 0 0 0 0 0 0 0 0 0 0 0 0 0 0 0 0 0 0 0 0 0 0 0 0 0 0 0 0 0 0 0 0 0 0 0 0 0 0 0 0 0 0 0 0 0 0 0 0 0 0 0 0 0 0 0 0 0 0 0 0 0 0 0 0 0 0 0 0 0 0 0 0 0 0 0 0 0 0 0 0 0 0 0 0 0 0 0 0 0 0 0 0 0 0 0 0 0 0 0 0 0 0 0 0 0 0 0 0 0 0 0 0 0 0 0 0 0 0 0 0 0 0 0 0 0 0 0 0 0 0 0 0 0 0 0 0 0 0 0 0 0 0 0 0 0 0 0 0 0 0 0 0 0 0 0 0 0 0 0 0 0 0 0 0 0 0 0 0 0 0 0 0 0 0 0 0 0 0 0 0 0 0 0 0 0 0 0 0 0 0 0 0 0 0 0 0 0 0 0 0 0 0 0 0 0 0 0 0 0 0 0 0 0 0 0 0 0 0 0 0 0 0 0 0 0 0 0 0 0 0 0 0 0 0 0 0 0 0 0 0 0 0 0 0 0 0 0 0 0 0 0 0 0 0 0 0 0 0 0 0 0 0 0 0 0 0 0 0 0 0 0 0 0 0 0 0 0 0 0 0 0 0 0 0 0 0 0 0 0 0 0 0 0 0 0 0 0 0 0 0 0 0 0 0 0 0 0 0 0 0 0 0 0 0 0 0 0 0 0 0 0 0 0 0 0 0 0 0 0 0 0 0 0 0 0 0 0 0 0 0 0 0 0 0 0 0 0 0 0 0 0 0 0 0 0 0 0 0 0 0 0 0 0 0 0 0 0 0 0 0 0 0 0 0 0 0 0 0 0 0 0 0 0 0 0 0 0 0 0 0 0 0 0 0 SP150 Bacteria;Firmicutes;Bacilli;Lactobacillales;Streptococcaceae;Streptococcus;infantis_clade_431 3482 1232 94 545 144 837 1499 3066 2356 417 8669 1784 1521 1612 336 1282 1423 314 2801 2966 1099 7601 3470 409 2171 6570 251 4243 357 798 1256 1690 433 1657 1351 3613 642 510 1836 1063 781 1306 1204 2963 3203 379 2828 717 1147 2472 2007 3947 3353 3914 1855 3851 5893 3773 1872 4430 1333 1017 899 485 2330 370 546 6664 3438 2720 140 1004 1388 870 1274 6247 1826 1401 418 883 919 1420 7045 2445 1522 856 1302 3554 3342 5105 696 1502 218 903 848 890 451 1437 3862 1430 600 1253 1913 1041 501 729 4962 147 834 976 39 1087 1138 2362 4702 2964 5020 5671 1373 871 1757 4242 3305 3496 643 2397 1752 3167 2692 163 3083 3525 3379 1390 1813 244 14410 1797 1367 2158 1247 882 2736 4012 84 2708 4537 4103 2735 2967 1420 3285 2079 5213 2562 6401 3627 2208 1825 3272 1136 910 1255 208 2125 1217 995 1579 293 1551 113 2901 1469 1786 1643 1993 1846 1794 2214 400 636 1045 1051 3171 799 2809 1697 770 3422 1784 1236 758 3227 917 1302 2485 1747 7714 3794 639 757 1919 5955 1977 1073 724 318 1837 804 1116 476 1160 1318 648 900 1486 671 2168 168 2134 346 2098 1294 3514 3336 430 4592 1241 453 1554 830 1710 1653 2253 2449 3783 3942 8842 1259 597 496 2032 896 401 343 3732 1535 772 254 1836 1210 980 1960 613 1850 1863 2232 4340 2491 3263 1432 2074 5286 1512 1659 1244 1995 996 0 0 0 0 0 0 0 0 0 0 0 0 0 0 0 0 0 0 0 0 0 0 0 0 0 0 0 0 0 0 0 0 0 0 0 0 0 0 0 0 0 0 0 0 0 0 0 0 0 0 0 0 0 0 0 0 0 0 0 0 0 0 0 0 0 0 0 0 0 0 0 0 0 0 0 0 0 0 0 0 0 0 0 0 0 0 0 0 0 0 0 0 0 0 0 0 0 0 0 0 0 0 0 0 0 0 0 0 0 0 0 0 0 0 0 0 0 0 0 0 0 0 0 0 0 0 0 0 0 0 0 0 0 0 0 0 0 0 0 0 0 0 0 0 0 0 0 0 0 0 0 0 0 0 0 0 0 0 0 0 0 0 0 0 0 0 0 0 0 0 0 0 0 0 0 0 0 0 0 0 0 0 0 0 0 0 0 0 0 0 0 0 0 0 0 0 0 0 0 0 0 0 0 0 0 0 0 0 0 0 0 0 0 0 0 0 0 0 0 0 0 0 0 0 0 0 0 0 0 0 0 0 0 0 0 0 0 0 0 0 0 0 0 0 0 0 0 0 0 0 0 0 0 0 0 0 0 0 0 0 0 0 0 0 0 0 0 0 0 0 0 0 0 0 0 0 0 0 0 0 0 0 0 0 0 0 0 0 0 0 0 0 0 0 0 0 0 0 0 0 0 0 0 0 0 0 0 0 0 0 0 0 0 0 0 0 0 0 0 0 0 0 0 0 0 0 0 0 0 0 0 0 0 0 0 0 0 0 0 0 0 0 0 0 0 0 0 0 0 0 0 0 0 0 0 0 0 0 0 0 0 0 0 0 0 0 0 0 0 0 0 0 0 0 0 0 0 0 0 0 0 0 0 0 0 0 0 0 0 0 0 0 0 0 0 0 0 0 0 0 0 0 0 0 0 0 0 0 0 0 0 0 0 0 0 0 0 0 0 0 0 0 0 0 0 0 0 0 0 0 0 0 0 0 0 0 0 0 0 0 0 0 0 0 0 0 0 0 0 0 0 0 0 0 0 0 0 0 0 0 0 0 0 0 0 0 0 0 0 0 0 0 0 0 0 0 0 0 0 0 0 0 0 0 0 0 0 0 0 0 0 0 0 0 0 0 0 0 0 0 0 0 0 0 0 0 0 0 0 0 0 0 0 0 0 0 0 0 0 0 0 0 0 0 0 0 0 0 0 0 0 0 0 0 0 0 0 0 0 0 0 0 0 0 0 0 0 0 0 0 0 0 0 0 0 0 0 0 0 0 0 0 0 0 0 0 0 0 0 0 0 0 0 0 0 0 0 0 0 0 0 0 0 0 0 0 0 0 0 0 0 0 0 0 0 0 0 0 0 0 0 0 0 0 0 0 0 0 0 0 0 0 0 0 0 0 0 0 0 0 0 0 0 0 0 0 0 0 0 0 0 0 0 0 0 0 0 0 0 0 0 0 0 0 0 0 0 0 0 0 0 0 0 0 0 0 0 0 0 0 0 0 0 0 0 0 0 0 0 0 0 0 0 0 0 0 0 0 0 0 0 0 0 0 0 0 0 0 0 0 0 0 0 0 0 0 0 0 0 0 0 0 0 0 0 0 0 0 0 0 0 0 0 0 0 0 0 0 0 0 0 0 0 0 0 0 0 0 0 0 0 0 0 0 0 0 0 0 0 0 0 0 0 0 0 0 0 0 0 0 0 0 0 0 0 0 0 0 0 0 0 0 0 0 0 0 0 0 0 0 0 0 0 0 0 0 0 0 0 0 0 0 0 0 0 0 0 0 0 0 0 0 0 0 0 0 0 0 0 0 0 0 0 0 0 0 0 0 0 0 0 0 0 0 0 0 0 0 0 0 0 0 0 0 0 0 0 0 0 0 0 0 0 0 0 0 0 0 0 0 0 0 0 0 0 0 0 0 0 0 0 0 0 0 0 0 0 0 0 0 0 0 0 0 0 0 0 0 0 0 0 0 0 0 0 0 0 0 0 0 0 0 0 0 0 0 0 0 0 0 0 0 0 0 0 0 0 0 0 0 0 0 0 0 0 0 0 0 0 0 0 0 0 0 0 0 0 0 0 0 0 0 0 0 0 0 0 0 0 0 0 0 0 0 0 0 0 0 0 0 0 0 0 0 0 0 0 0 0 0 0 0 0 0 0 0 0 0 0 0 0 0 0 0 0 0 0 0 0 0 0 0 0 0 0 0 0 0 0 0 0 0 0 0 0 0 0 0 0 0 0 0 0 0 0 0 0 0 0 0 0 0 0 0 0 0 0 0 0 0 0 0 0 0 0 0 0 0 0 0 0 0 0 0 0 0 0 0 0 0 0 0 0 0 0 0 0 0 0 0 0 0 0 0 0 0 0 0 0 0 0 0 0 0 0 0 0 0 0 0 0 0 0 0 0 0 0 0 0 0 0 0 0 0 0 0 0 0 0 0 0 0 0 0 0 0 0 0 0 0 0 0 0 0 0 0 0 0 0 0 0 0 0 0 0 0 0 0 0 0 0 0 0 0 0 0 0 0 0 0 0 0 0 0 0 0 0 0 0 0 0 0 0 0 0 0 0 0 0 0 0 0 0 0 0 0 0 0 0 0 0 0 0 0 0 0 0 0 0 0 0 0 0 0 0 0 0 0 0 0 0 0 0 0 0 0 0 0 0 0 0 0 0 0 0 0 0 0 0 0 0 0 0 0 0 0 0 0 0 0 0 0 0 0 0 0 0 0 0 0 0 0 0 0 0 0 0 0 0 0 0 0 0 0 0 0 0 0 0 0 0 0 0 0 0 0 0 0 0 0 0 0 0 0 0 0 0 0 0 0 0 0 0 0 0 0 0 0 0 0 0 0 0 0 0 0 0 0 0 0 0 0 0 0 0 0 0 0 0 0 0 0 0 0 0 0 0 0 0 0 0 0 0 0 0 0 0 0 0 0 0 0 0 0 0 0 0 0 0 0 0 0 0 0 0 0 0 0 0 0 0 0 0 0 0 0 0 0 0 0 0 0 0 0 0 0 0 0 0 0 0 0 0 0 0 0 0 0 0 0 0 0 0 0 0 0 0 0 0 0 0 0 0 0 0 0 0 0 0 0 0 0 0 0 0 0 0 0 0 0 0 0 0 0 0 0 0 0 0 0 0 0 0 0 0 0 0 0 0 0 0 0 0 0 0 0 0 0 0 0 0 0 0 0 0 0 0 0 0 0 0 0 0 0 0 0 0 0 0 0 0 0 0 0 0 0 0 0 0 0 0 0 0 0 0 0 0 0 0 0 0 0 0 0 0 0 0 0 0 0 0 0 0 0 0 0 0 0 0 0 0 0 0 0 0 0 0 0 0 0 0 0 0 0 0 0 0 0 0 0 0 0 0 0 0 0 0 0 0 0 0 0 0 0 0 0 0 0 0 0 0 0 0 0 0 0 0 0 0 0 0 0 0 0 0 0 0 0 0 0 0 0 0 0 0 0 0 0 0 0 0 0 0 0 0 0 0 0 0 0 0 0 0 0 0 0 SP151 Bacteria;Actinobacteria;Actinomycetia;Actinomycetales;Actinomycetaceae;Actinomyces;dentalis 0 0 0 2 3 1 0 4 0 1 0 50 36 0 0 0 13 0 0 0 1 0 0 49 0 6 0 3 23 7 0 0 0 4 19 1 0 713 0 0 0 0 1 0 0 0 0 0 36 5 1 3 4 7 0 0 0 0 0 0 0 0 0 0 0 1 0 1 82 0 3 0 0 0 9 0 1 0 3 27 0 0 2 2 0 0 0 1 0 0 0 0 69 0 0 0 0 0 0 2 2 4 0 0 1 9 0 70 0 5 5 58 1 1 0 0 0 0 0 0 0 1 0 3 0 0 0 1 0 1 0 0 0 0 0 0 0 0 0 0 2 0 0 12 0 4 67 2 1 0 1 0 3 2 1 0 0 0 0 2 0 0 0 13 1 0 0 0 58 4 0 0 0 0 0 0 0 1 0 0 0 0 23 4 0 0 0 0 0 0 1 0 1 0 0 0 0 0 0 1 1 0 0 1 0 0 1 57 13 4 0 0 3 0 1 0 0 2 0 0 1 7 0 0 0 0 0 0 0 2 0 0 14 2 2 0 4 5 2 0 0 0 0 10 0 22 3 0 0 0 2 0 0 19 0 0 7 7 0 0 150 0 23 0 2 5 0 23 0 0 0 0 3 0 0 0 99 4 72 0 31 10 0 97 1 0 0 0 0 0 0 0 0 0 0 0 2 0 0 7 0 0 170 38 0 0 0 0 3 0 0 0 0 0 1 31 0 0 1 0 0 0 0 0 0 0 0 0 0 0 0 0 0 0 0 0 0 0 0 0 0 0 0 0 0 0 0 0 0 0 0 0 0 11 0 0 0 0 0 0 0 0 0 3 0 0 0 0 0 0 7 0 0 25 0 0 0 0 0 0 0 0 0 0 0 0 0 1 0 0 0 0 0 0 0 0 0 0 0 0 0 0 0 5 0 0 0 17 0 0 0 45 0 0 0 0 0 0 0 0 2 0 43 76 0 0 0 0 0 0 0 0 0 6 0 0 0 0 0 0 19 0 0 0 1 0 0 0 15 27 0 0 0 0 0 10 0 0 0 1 0 0 0 0 1 0 0 120 0 0 1 42 0 0 0 0 0 1 0 0 0 0 0 0 0 0 0 0 0 5 5 0 0 23 5 0 0 0 0 86 0 0 0 0 0 0 0 0 0 0 20 2 0 0 0 0 0 1 0 0 0 2 0 0 0 0 0 0 0 0 0 0 0 0 7 0 0 0 0 0 0 19 1 0 0 0 28 63 0 0 0 0 0 0 0 0 0 0 0 21 0 67 0 70 126 4 0 0 0 0 0 0 0 0 0 0 0 0 9 0 0 4 0 0 0 0 53 0 0 0 0 0 0 0 0 67 0 2 0 0 0 0 0 112 0 0 0 0 0 1 0 0 0 0 0 0 3 0 9 1 0 0 0 0 0 0 0 0 0 1 0 0 0 0 0 0 0 0 6 1 0 3 2 80 3 0 0 0 0 0 32 0 0 0 0 0 0 0 0 25 0 0 0 12 0 1 14 0 8 0 0 0 0 0 0 0 0 0 0 0 0 5 107 0 0 0 0 0 0 0 1 0 0 0 0 0 0 0 0 3 7 0 0 4 0 0 6 0 0 0 0 0 161 0 0 0 0 0 0 0 0 0 0 0 0 453 15 8 35 4 52 1 0 0 0 2 3 0 56 5 0 14 12 0 0 0 0 4 24 0 10 0 0 0 0 0 0 0 0 10 0 0 0 0 0 0 9 0 0 50 0 0 60 0 0 0 0 0 5 0 0 0 0 0 0 0 0 0 0 0 0 0 0 0 0 0 3 0 0 0 0 0 0 0 0 0 0 0 22 0 0 0 0 0 0 0 0 0 0 0 188 0 0 0 0 0 0 0 6 0 0 0 0 0 0 0 0 0 0 0 60 0 0 0 0 0 0 0 0 0 0 0 0 0 0 0 0 22 0 0 0 0 0 0 0 0 0 0 0 0 93 2 0 2 213 0 147 1 0 0 1 1 0 152 0 0 0 0 0 50 2 0 0 0 0 0 0 0 33 0 24 0 0 0 0 0 0 0 0 0 0 0 0 0 0 0 0 0 0 0 0 0 0 6 0 0 0 49 0 0 0 0 2 0 0 0 12 172 3 1 3 0 1 0 0 2 17 0 1 0 14 0 148 22 0 0 0 0 0 0 0 0 0 6 0 12 0 0 0 0 0 0 0 4 1 0 17 1 0 12 0 0 20 1 0 3 0 81 0 28 0 0 3 54 0 3 0 0 0 0 0 0 0 0 0 23 0 0 0 0 0 0 0 0 0 0 0 0 0 0 0 0 0 0 0 0 2 0 0 0 0 0 0 0 1 0 1 2 0 0 2 1 0 9 0 0 0 0 1 0 0 0 0 0 0 0 0 0 0 0 4 0 0 0 1 17 0 0 0 0 0 0 0 0 0 0 0 0 0 0 0 0 0 0 0 0 0 0 1 0 0 7 0 0 0 0 0 0 0 0 0 0 0 0 0 0 0 0 0 0 0 0 0 0 0 0 0 0 0 0 0 2 7 0 0 0 0 0 0 0 0 0 0 0 0 0 0 2 0 0 0 0 0 0 0 0 0 11 0 0 0 0 0 0 0 0 0 0 0 0 0 0 0 0 0 0 0 0 0 1 0 0 0 0 0 0 0 0 0 0 0 13 0 0 4 0 0 0 0 0 3 0 2 0 0 0 0 2 0 3 0 0 0 2 0 0 0 1 0 0 0 3 0 1 0 0 0 0 0 0 0 0 0 0 7 0 0 0 0 1 0 1 1 0 1 0 0 0 0 0 0 0 0 0 0 0 0 0 0 0 0 0 0 0 0 0 3 1 0 0 0 0 0 0 0 0 0 0 0 3 0 0 0 0 1 0 0 0 0 0 0 0 0 0 10 0 21 0 0 0 0 0 0 0 0 0 0 0 0 0 0 0 0 0 0 1 0 0 0 0 0 0 0 0 0 0 0 0 0 0 0 0 0 0 0 0 0 0 0 0 0 0 3 1 0 9 0 0 17 0 0 0 4 0 0 2 0 0 0 0 0 0 5 0 0 0 0 0 0 1 0 0 9 0 17 1 0 0 0 0 0 0 0 0 16 0 0 0 0 0 0 0 0 0 0 0 0 0 0 0 0 0 0 0 0 63 0 0 0 0 0 0 0 0 0 0 0 0 0 0 0 0 0 0 0 0 0 0 0 0 45 0 0 0 0 0 0 1 0 0 1 0 0 0 0 0 0 0 0 0 0 0 0 0 0 0 0 0 2 0 0 35 0 0 0 0 0 2 29 0 0 0 0 0 0 1 1 0 0 0 0 0 0 0 0 0 0 0 0 0 0 0 0 0 0 0 0 0 0 0 0 0 0 0 0 0 0 0 0 0 0 0 0 0 0 32 0 0 0 0 0 0 0 0 0 1 0 0 0 0 1 0 0 1 0 0 0 0 0 2 0 0 0 0 0 5 0 0 0 0 0 0 0 0 0 0 0 0 0 0 0 9 2 0 0 0 0 0 0 0 0 0 0 0 9 0 0 0 5 0 0 0 0 0 0 0 0 8 0 0 0 0 0 2 9 0 0 0 0 0 0 0 0 0 0 0 0 1 0 0 2 0 0 0 0 0 0 2 0 0 1 0 0 0 0 0 0 0 0 0 0 0 0 0 0 0 0 0 0 0 0 0 0 3 0 0 0 0 3 0 0 0 69 0 0 0 0 0 0 0 0 0 0 0 0 0 0 0 0 0 0 0 0 0 0 0 0 3 0 0 0 0 0 0 0 0 0 1 0 0 0 0 0 0 0 0 0 0 0 0 0 0 0 0 0 0 0 1 0 0 0 0 0 0 0 0 4 0 0 0 0 0 0 1 0 0 0 0 0 0 2 0 0 0 0 0 0 0 1 0 0 3 2 7 0 0 3 0 8 1 0 13 0 0 0 0 0 0 0 0 0 0 0 0 0 0 0 0 0 0 3 0 0 0 0 0 0 0 0 2 1 0 0 0 16 0 0 0 0 0 4 0 0 0 0 0 0 0 0 0 3 0 0 0 0 0 0 0 0 0 0 0 0 1 1 0 0 0 0 0 1 0 0 0 0 0 0 0 0 0 0 0 0 0 SP152 Bacteria;Firmicutes;Clostridia;Negativicutes;Veillonellaceae;Veillonella;atypica 121 113 18 937 4 234 13 477 7 373 1834 34 115 4 18 343 20 6 268 58 574 115 282 518 534 244 1 172 24 9 7 147 0 119 165 302 1302 23 144 24 173 11 29 1095 223 593 129 341 210 1 3982 1023 1436 25 701 36 1946 168 6 267 14 12 74 135 42 9 21 1864 53 111 671 91 107 1328 792 0 1639 443 102 26 157 156 66 65 3326 113 127 1571 10 2678 1 1215 11 5 159 2 0 0 3 658 345 580 110 44 7 5 562 15 69 12 754 33 2483 119 1171 6 204 413 427 10 426 536 1663 139 725 15 2011 509 641 1 623 5 75 90 784 0 317 380 38 0 81 0 190 29 2 397 192 356 450 0 1052 7 185 146 35 11 0 96 19 30 6 0 74 106 65 346 4 104 0 212 46 13 0 127 619 56 1 0 1 87 698 42 20 1032 4072 16 78 10 0 1315 352 16 446 152 1033 379 464 368 173 33 5 47 1014 55 19 1685 2 11 17 1 974 10 162 59 73 229 64 129 0 260 607 582 69 98 5004 112 176 37 11 4785 840 0 20 17 112 0 176 258 273 38 58 45 1523 2 12 110 114 7 2499 182 1462 0 4 197 5 105 143 3 176 273 315 1634 43 671 477 423 1549 314 0 1 5 0 0 46 23 0 1 20 1 0 45 54 379 12 33 33 200 12 65 92 14 67 0 0 0 0 32 28 0 9 30 9 87 38 3 0 211 14 4 0 1 24 44 0 80 39 125 12 59 49 0 0 12 0 119 0 0 0 0 0 0 15 0 0 0 0 0 0 52 1 2 79 0 17 14 42 0 11 1 0 9 0 0 11 67 3 11 3 0 0 4 6 0 20 0 7 0 1 0 0 4 0 10 29 0 2 0 0 0 18 22 0 2 0 0 0 2 31 0 0 0 40 0 1 0 2 0 0 0 1 0 0 14 9 0 2 0 0 0 0 1 7 4 35 43 0 8 0 45 0 6 32 62 101 0 6 65 0 0 0 0 2 2 2 18 35 11 0 17 0 4 0 22 33 9 61 0 8 4 5 24 9 26 0 46 25 1 11 0 2 1 0 0 0 21 1 86 31 5 0 0 44 0 0 6 1 12 32 0 4 2 35 80 28 11 20 1 0 0 2 26 10 97 7 39 0 21 19 0 78 65 8 0 6 0 0 20 1 0 45 134 106 34 0 0 0 15 27 0 0 1 54 0 0 1 8 0 0 0 4 0 1 0 3 15 0 3 57 2 0 8 16 6 34 0 0 0 9 0 94 0 1 2 0 0 0 0 0 0 0 0 27 28 61 22 1 0 15 0 4 11 0 0 3 0 0 0 0 0 0 0 1 0 0 4 1 0 0 0 0 114 5 18 56 0 10 0 3 0 0 0 9 0 0 0 0 0 0 3 1 0 0 51 0 1 0 0 0 50 3 25 94 9 0 0 0 25 0 13 0 11 0 5 0 2 0 2 0 13 0 12 20 5 0 1 0 0 117 191 0 35 54 1 2 0 38 6 29 0 13 6 0 0 16 12 0 36 176 0 0 0 3 0 0 0 0 29 0 0 0 0 1 24 0 0 3 1 0 0 0 2 0 44 26 2 3 0 24 24 1 0 31 7 65 0 0 20 4 166 35 1 0 9 21 0 3 0 19 4 21 0 0 4 0 0 0 6 3 4 13 25 262 11 10 0 23 9 15 12 69 0 1 1 0 0 0 0 3 14 0 5 3 0 33 2 3 0 13 0 1 0 11 0 1 0 0 0 8 1 38 0 0 31 0 4 38 28 5 2 65 21 0 0 3 25 9 69 0 115 0 0 0 2 7 0 20 41 0 185 0 14 1 0 9 0 0 0 0 15 0 0 2 0 0 0 3 0 0 1 1 7 50 78 5 0 8 59 2 5 0 0 0 0 0 0 0 0 26 71 3 3 1 1 0 52 15 0 0 10 0 52 0 0 0 1 107 5 7 7 0 49 0 25 52 0 0 37 0 0 0 2 4 6 10 2 0 5 0 22 1 0 2 5 0 8 0 159 0 0 0 22 106 0 1 1 0 14 0 2 1 56 0 60 62 0 0 1 9 3 10 0 8 0 17 62 0 1 24 1 1 4 1 3 1 1 34 0 0 0 0 7 1 16 16 72 38 52 36 6 208 15 0 4 12 0 6 73 0 11 26 120 0 90 7 0 55 32 2 9 0 16 49 3 36 0 0 0 9 6 1 15 1 24 100 5 25 78 77 71 5 113 0 27 57 4 59 0 13 52 22 5 0 17 18 7 0 55 0 19 0 0 3 0 57 87 70 0 0 0 0 0 5 0 0 0 0 1 0 22 5 4 41 0 43 20 0 5 30 27 0 0 8 2 19 4 1 2 6 68 3 7 4 10 0 32 3 1 32 1 4 2 0 0 71 30 1 9 1 0 0 0 0 9 0 3 16 0 3 0 0 15 7 0 1 0 29 0 1 4 0 5 15 26 1 1 30 0 0 12 22 37 32 0 0 0 4 0 1 1 0 7 0 0 3 0 1 0 0 13 0 0 0 16 11 0 2 1 0 0 33 0 0 1 0 0 8 1 0 0 10 6 0 4 1 0 0 4 1 1 3 21 0 0 1 0 2 1 6 0 1 0 0 0 23 4 1 0 5 9 0 4 0 9 17 1 0 0 3 0 0 0 14 3 11 2 3 0 0 2 7 9 18 1 1 3 5 0 0 17 8 126 0 42 8 6 1 0 1 11 3 50 6 5 113 1 7 0 42 5 0 9 8 0 11 14 0 0 6 6 2 1 5 17 28 3 46 1 10 1 2 0 9 25 6 33 6 0 5 191 27 0 7 9 5 0 7 4 1 0 2 0 14 5 7 2 0 1 28 2 9 75 0 5 0 3 0 4 25 0 11 5 0 0 0 2 3 4 3 0 5 0 2 0 2 9 0 57 2 6 0 9 1 1 23 0 5 4 3 1 4 2 8 1 3 3 1 0 1 0 10 1 0 0 4 9 1 1 8 0 0 13 124 0 0 0 13 1 27 1 10 8 0 0 0 0 15 0 0 3 0 1 27 3 12 63 0 3 0 0 3 0 4 3 2 14 2 16 1 0 3 0 9 0 2 22 13 18 11 14 0 13 4 0 0 42 1 15 0 1 63 0 12 0 1 0 4 0 3 0 5 0 44 3 0 0 1 18 34 0 0 0 0 2 0 7 2 3 1 6 0 0 4 4 3 19 1 1 2 0 0 28 0 0 0 4 3 3 16 67 12 14 53 0 39 9 34 0 6 0 55 35 2 0 32 1 19 0 1 4 0 1 32 46 3 2 8 5 12 14 9 12 98 14 6 1 1 0 5 0 8 1 25 2 4 8 6 0 3 0 0 15 0 2 0 34 4 0 0 0 77 11 0 79 2 31 0 0 8 0 0 0 42 4 1 3 7 11 6 2 127 5 4 124 37 3 2 4 2 64 23 0 3 45 13 0 9 2 4 0 10 0 0 59 2 0 25 22 103 24 2 3 2 1 2 1 0 0 0 3 0 5 13 0 3 2 4 27 15 9 4 54 24 1 0 1 0 2 2 2 7 16 2 1 1 4 0 5 0 2 19 0 13 2 6 29 0 114 1 5 2 0 33 0 2 29 0 14 17 0 126 75 1 2 0 0 0 2 0 1 0 4 0 0 9 4 0 0 1 23 0 5 10 25 16 16 7 3 0 3 0 5 0 2 29 7 5 2 14 5 0 2 8 17 0 29 20 11 31 29 7 0 1 18 2 0 0 0 4 1 2 3 10 4 25 41 30 0 2 39 26 8 13 12 0 128 2 1 9 2 1 37 2 7 14 5 0 18 33 4 0 0 12 4 0 3 1 61 11 6 1 0 0 0 2 5 0 8 4 19 0 0 1 0 1 0 0 0 0 1 1 23 15 0 0 0 3 29 9 16 32 0 12 2 3 25 6 26 31 57 16 0 1 13 3 145 0 85 1 0 13 0 77 2 4 80 40 4 1 10 0 0 0 1 8 60 7 14 34 0 26 9 0 25 3 5 0 9 1 0 12 11 1 5 59 4 3 54 18 0 6 57 0 11 18 0 0 6 20 0 0 12 8 0 4 11 10 18 3 2 0 12 0 0 15 1 0 0 4 55 1 21 1 2 0 SP153 Bacteria;Firmicutes;Bacilli;Lactobacillales;Streptococcaceae;Streptococcus;australis 320 748 338 76 344 1244 264 877 265 404 543 1079 7680 7410 32 3640 2970 810 2410 3449 1157 169 824 195 480 1179 1462 633 1080 577 3508 7038 795 294 247 334 419 245 954 1157 1451 1270 1692 232 451 1020 299 68 82 9871 252 134 414 1571 469 1512 860 1459 4087 458 889 425 1163 82 2271 910 1133 716 2807 1959 0 456 1914 1450 83 16909 591 4535 1848 2290 1152 3047 2458 231 540 1772 1721 1269 592 78 119 222 544 213 473 1773 325 1376 2287 189 1142 1022 1660 4054 192 763 410 353 4601 600 1 4426 15 1611 2296 1337 735 1789 321 7990 1004 1258 627 1551 231 665 127 136 484 162 668 7538 229 256 101 247 2561 788 3553 7614 73 1670 401 4915 56 1794 2369 1013 1013 7418 152 1539 453 3323 212 4944 675 480 247 1815 753 1859 1671 425 1822 1631 2284 4879 1375 1721 3070 3964 5201 2230 164 47 10107 9110 213 186 931 3137 7130 619 161 6181 4489 3155 8944 865 3255 8773 2540 1238 536 470 680 305 1707 5166 595 2207 121 3598 142 312 794 230 584 1038 994 610 305 140 2226 1124 295 989 273 1776 199 844 177 1534 159 1211 763 422 141 41 611 4181 1908 54 316 6980 426 552 1645 292 921 4598 403 940 191 765 3197 1240 497 364 231 3078 2783 1827 3262 1150 9379 7834 269 343 217 261 1959 3405 338 684 116 32 0 0 0 0 0 0 0 0 0 0 0 0 0 0 0 0 0 0 0 0 0 0 0 0 0 0 0 0 0 0 0 0 0 0 0 0 0 0 0 0 0 0 0 0 0 0 0 0 0 0 0 0 0 0 0 0 0 0 0 0 0 0 0 0 0 0 0 0 0 0 0 0 0 0 0 0 0 0 0 0 0 0 0 0 0 0 0 0 0 0 0 0 0 0 0 0 0 0 0 0 0 0 0 0 0 0 0 0 0 0 0 0 0 0 0 0 0 0 0 0 0 0 0 0 0 0 0 0 0 0 0 0 0 0 0 0 0 0 0 0 0 0 0 0 0 0 0 0 0 0 0 0 0 0 0 0 0 0 0 0 0 0 0 0 0 0 0 0 0 0 0 0 0 0 0 0 0 0 0 0 0 0 0 0 0 0 0 0 0 0 0 0 0 0 0 0 0 0 0 0 0 0 0 0 0 0 0 0 0 0 0 0 0 0 0 0 0 0 0 0 0 0 0 0 0 0 0 0 0 0 0 0 0 0 0 0 0 0 0 0 0 0 0 0 0 0 0 0 0 0 0 0 0 0 0 0 0 0 0 0 0 0 0 0 0 0 0 0 0 0 0 0 0 0 0 0 0 0 0 0 0 0 0 0 0 0 0 0 0 0 0 0 0 0 0 0 0 0 0 0 0 0 0 0 0 0 0 0 0 0 0 0 0 0 0 0 0 0 0 0 0 0 0 0 0 0 0 0 0 0 0 0 0 0 0 0 0 0 0 0 0 0 0 0 0 0 0 0 0 0 0 0 0 0 0 0 0 0 0 0 0 0 0 0 0 0 0 0 0 0 0 0 0 0 0 0 0 0 0 0 0 0 0 0 0 0 0 0 0 0 0 0 0 0 0 0 0 0 0 0 0 0 0 0 0 0 0 0 0 0 0 0 0 0 0 0 0 0 0 0 0 0 0 0 0 0 0 0 0 0 0 0 0 0 0 0 0 0 0 0 0 0 0 0 0 0 0 0 0 0 0 0 0 0 0 0 0 0 0 0 0 0 0 0 0 0 0 0 0 0 0 0 0 0 0 0 0 0 0 0 0 0 0 0 0 0 0 0 0 0 0 0 0 0 0 0 0 0 0 0 0 0 0 0 0 0 0 0 0 0 0 0 0 0 0 0 0 0 0 0 0 0 0 0 0 0 0 0 0 0 0 0 0 0 0 0 0 0 0 0 0 0 0 0 0 0 0 0 0 0 0 0 0 0 0 0 0 0 0 0 0 0 0 0 0 0 0 0 0 0 0 0 0 0 0 0 0 0 0 0 0 0 0 0 0 0 0 0 0 0 0 0 0 0 0 0 0 0 0 0 0 0 0 0 0 0 0 0 0 0 0 0 0 0 0 0 0 0 0 0 0 0 0 0 0 0 0 0 0 0 0 0 0 0 0 0 0 0 0 0 0 0 0 0 0 0 0 0 0 0 0 0 0 0 0 0 0 0 0 0 0 0 0 0 0 0 0 0 0 0 0 0 0 0 0 0 0 0 0 0 0 0 0 0 0 0 0 0 0 0 0 0 0 0 0 0 0 0 0 0 0 0 0 0 0 0 0 0 0 0 0 0 0 0 0 0 0 0 0 0 0 0 0 0 0 0 0 0 0 0 0 0 0 0 0 0 0 0 0 0 0 0 0 0 0 0 0 0 0 0 0 0 0 0 0 0 0 0 0 0 0 0 0 0 0 0 0 0 0 0 0 0 0 0 0 0 0 0 0 0 0 0 0 0 0 0 0 0 0 0 0 0 0 0 0 0 0 0 0 0 0 0 0 0 0 0 0 0 0 0 0 0 0 0 0 0 0 0 0 0 0 0 0 0 0 0 0 0 0 0 0 0 0 0 0 0 0 0 0 0 0 0 0 0 0 0 0 0 0 0 0 0 0 0 0 0 0 0 0 0 0 0 0 0 0 0 0 0 0 0 0 0 0 0 0 0 0 0 0 0 0 0 0 0 0 0 0 0 0 0 0 0 0 0 0 0 0 0 0 0 0 0 0 0 0 0 0 0 0 0 0 0 0 0 0 0 0 0 0 0 0 0 0 0 0 0 0 0 0 0 0 0 0 0 0 0 0 0 0 0 0 0 0 0 0 0 0 0 0 0 0 0 0 0 0 0 0 0 0 0 0 0 0 0 0 0 0 0 0 0 0 0 0 0 0 0 0 0 0 0 0 0 0 0 0 0 0 0 0 0 0 0 0 0 0 0 0 0 0 0 0 0 0 0 0 0 0 0 0 0 0 0 0 0 0 0 0 0 0 0 0 0 0 0 0 0 0 0 0 0 0 0 0 0 0 0 0 0 0 0 0 0 0 0 0 0 0 0 0 0 0 0 0 0 0 0 0 0 0 0 0 0 0 0 0 0 0 0 0 0 0 0 0 0 0 0 0 0 0 0 0 0 0 0 0 0 0 0 0 0 0 0 0 0 0 0 0 0 0 0 0 0 0 0 0 0 0 0 0 0 0 0 0 0 0 0 0 0 0 0 0 0 0 0 0 0 0 0 0 0 0 0 0 0 0 0 0 0 0 0 0 0 0 0 0 0 0 0 0 0 0 0 0 0 0 0 0 0 0 0 0 0 0 0 0 0 0 0 0 0 0 0 0 0 0 0 0 0 0 0 0 0 0 0 0 0 0 0 0 0 0 0 0 0 0 0 0 0 0 0 0 0 0 0 0 0 0 0 0 0 0 0 0 0 0 0 0 0 0 0 0 0 0 0 0 0 0 0 0 0 0 0 0 0 0 0 0 0 0 0 0 0 0 0 0 0 0 0 0 0 0 0 0 0 0 0 0 0 0 0 0 0 0 0 0 0 0 0 0 0 0 0 0 0 0 0 0 0 0 0 0 0 0 0 0 0 0 0 0 0 0 0 0 0 0 0 0 0 0 0 0 0 0 0 0 0 0 0 0 0 0 0 0 0 0 0 0 0 0 0 0 0 0 0 0 0 0 0 0 0 0 0 0 0 0 0 0 0 0 0 0 0 0 0 0 0 0 0 0 0 0 0 0 0 0 0 0 0 0 0 0 0 0 0 0 0 0 0 0 0 0 0 0 0 0 0 0 0 0 0 0 0 0 0 0 0 0 0 0 0 0 0 0 0 0 0 0 0 0 0 0 0 0 0 0 0 0 0 0 0 0 0 0 0 0 0 0 0 0 0 0 0 0 0 0 0 0 0 0 0 0 0 0 0 0 0 0 0 0 0 0 0 0 0 0 0 0 0 0 0 0 0 0 0 0 0 0 0 0 0 0 0 0 0 0 0 0 0 0 0 0 0 0 0 0 0 0 0 0 0 0 0 0 0 0 0 0 0 0 0 0 0 0 0 0 0 0 0 0 0 0 0 0 0 0 0 0 0 0 0 0 0 0 0 0 0 0 0 0 0 0 0 0 0 0 0 0 0 0 0 0 0 0 0 0 0 0 0 0 0 0 0 0 0 0 0 0 0 0 0 0 0 0 0 0 0 SP156 Bacteria;Bacteroidetes;Bacteroidia;Bacteroidales;Prevotellaceae;Alloprevotella;tannerae 0 0 0 0 0 1 0 0 0 0 0 2 0 0 0 0 0 0 0 0 0 0 0 0 5 5 0 0 0 0 17 0 0 288 0 0 0 0 0 0 198 0 0 0 5 27 0 0 19 0 13 0 0 0 0 0 2 1 0 0 0 0 0 2 0 0 0 657 11 0 0 0 0 0 0 1 0 8 0 1 0 0 0 6 1 0 0 0 0 37 0 0 7 0 0 0 0 13 0 0 0 0 0 0 1 0 3 0 394 0 0 0 9 25 66 0 107 0 3372 0 6 0 0 0 2 0 0 10 0 0 0 0 0 0 0 0 1116 0 0 210 0 0 2 3 0 1 33 5 453 0 0 0 80 0 2 0 0 0 0 0 1 0 0 0 0 0 0 4 0 0 0 0 0 1 0 0 11 3 0 0 0 0 0 180 0 0 0 0 0 8 0 0 0 0 0 0 0 0 1 0 0 8 2 0 0 0 0 0 2 0 0 0 0 0 2 12 0 67 0 0 4 7 2 0 1 0 386 0 0 33 0 0 0 0 0 826 32 0 0 4 3 0 0 0 0 0 0 0 0 0 122 0 0 1 0 0 5 2 0 0 0 0 0 0 0 0 0 0 0 0 0 0 0 0 0 0 2 0 0 0 15 0 0 18 0 0 0 0 0 0 0 0 5 0 0 0 0 0 0 0 0 0 0 0 0 1 0 0 5 0 0 6 0 0 0 1 0 0 0 0 0 0 0 0 0 3 0 0 0 0 0 1 0 0 0 0 0 0 0 0 0 0 0 15 0 0 0 0 0 0 0 0 0 0 0 0 0 0 0 0 0 0 0 0 0 0 0 0 0 0 0 0 0 0 0 0 0 0 0 0 0 0 0 0 0 0 0 68 0 0 0 0 0 0 1 0 0 0 0 0 0 0 0 0 0 0 0 0 0 0 0 0 0 0 0 0 0 0 0 0 0 0 0 0 0 0 0 0 0 0 0 0 0 0 0 0 0 0 0 0 0 0 0 0 0 0 0 0 0 0 0 0 0 0 0 0 0 0 0 1 0 0 0 0 0 0 0 0 0 0 0 0 0 0 0 0 0 0 0 0 0 0 0 0 0 0 0 0 0 0 0 0 0 41 0 0 0 0 0 21 0 0 1 0 0 0 0 0 0 0 17 0 0 0 1 0 0 0 0 0 0 4 0 0 0 0 0 0 0 0 0 0 0 0 0 0 7 0 0 0 0 0 0 0 0 0 5 0 0 0 2 3 0 0 0 0 0 0 0 3 0 2 0 0 0 0 0 0 0 0 0 0 0 0 0 0 0 0 0 0 0 0 0 0 0 0 16 0 0 0 0 0 0 0 0 4 0 0 0 0 0 0 0 23 0 0 0 0 0 0 0 0 0 0 0 0 0 0 0 0 0 0 0 0 0 0 0 0 0 0 0 0 0 0 0 0 0 0 8 0 0 0 0 0 0 0 0 0 13 0 0 0 0 0 0 0 0 0 0 0 0 0 0 0 0 0 5 0 0 0 0 0 0 0 0 0 0 0 1 0 0 0 0 0 0 0 0 0 0 0 0 0 0 0 0 0 0 0 0 0 0 0 19 4 0 0 0 0 0 0 0 0 15 0 0 5 0 0 0 0 0 0 0 0 0 54 3 0 1 0 0 0 0 0 0 0 0 0 1 0 0 0 0 0 0 0 0 0 44 0 236 0 0 0 0 0 2 0 0 0 0 0 0 0 0 0 0 0 0 0 0 0 0 0 0 0 0 0 0 0 0 0 0 0 0 0 0 0 0 0 0 0 0 0 0 0 0 0 0 0 0 0 3 0 0 0 0 0 0 0 0 0 0 0 0 0 0 0 0 0 3 0 0 0 0 0 0 0 0 0 0 0 0 0 0 0 0 0 0 0 0 0 0 0 0 0 0 0 0 0 0 0 0 0 0 0 0 0 0 0 0 0 0 0 2 0 0 0 0 0 0 0 0 0 0 0 0 0 0 0 1 87 0 0 0 0 0 0 0 0 0 0 0 0 0 0 0 0 0 0 0 0 0 0 0 0 0 0 0 0 0 0 0 0 0 0 0 0 0 0 0 0 0 0 0 0 0 0 0 0 0 0 0 0 0 0 0 0 0 0 16 0 4 0 0 1 0 0 0 0 0 0 20 0 0 16 0 0 0 0 0 0 0 0 0 0 0 0 0 0 0 0 0 0 0 0 11 0 0 0 0 0 0 0 0 1 0 0 0 0 0 0 0 22 0 0 0 0 0 0 0 0 0 0 0 1 0 0 0 0 0 0 0 0 0 0 0 0 0 0 5 0 0 0 0 0 2 0 0 0 0 0 0 0 0 3 0 2 0 0 22 0 0 0 0 0 0 0 0 0 0 0 0 0 0 0 0 0 0 0 0 0 0 0 0 5 0 0 0 0 0 0 0 0 0 0 0 0 0 0 0 0 0 0 0 0 0 0 0 0 0 12 0 0 0 0 0 0 0 0 0 0 0 0 0 0 0 0 0 0 0 0 0 0 0 0 0 0 0 0 0 0 0 0 0 0 0 0 0 0 0 0 0 0 0 0 0 0 0 0 0 0 0 0 0 0 0 20 0 0 2 0 0 0 0 0 1 0 0 0 0 0 0 0 0 0 0 27 0 0 0 46 0 0 0 0 0 0 0 0 0 0 0 0 0 0 0 0 0 0 0 0 0 0 0 0 4 0 0 2 0 0 0 0 0 0 0 0 0 0 4 0 0 0 0 0 0 0 0 0 0 1 0 0 0 0 11 0 0 0 0 13 0 0 0 77 0 0 0 0 0 0 0 0 0 0 0 0 0 0 0 0 0 0 0 0 3 0 0 9 1 0 0 0 0 0 18 0 0 1 0 0 0 0 0 0 0 0 0 3 0 0 0 0 0 0 75 9 0 0 0 0 0 19 0 0 56 0 0 0 0 0 0 0 0 0 0 0 0 0 0 0 0 0 0 0 0 0 0 0 0 0 0 0 0 0 0 0 0 0 4 0 0 0 0 0 0 0 284 0 0 0 0 0 0 0 0 0 0 0 0 0 0 0 0 0 0 0 0 45 0 0 1 0 0 0 0 0 0 0 0 0 0 0 191 0 0 0 0 0 0 1 0 1 0 0 0 0 0 0 0 0 0 0 0 0 0 1 0 0 0 0 0 0 0 0 0 0 0 0 0 0 0 0 0 0 0 2 0 0 0 0 0 0 0 0 0 0 0 0 424 0 0 0 0 4 0 0 0 0 0 0 0 0 0 0 0 0 0 0 0 60 0 0 0 0 0 0 0 0 0 0 0 0 0 14 0 0 0 0 0 3 0 0 0 0 0 0 0 0 0 0 0 1 0 0 0 0 4 0 0 0 0 0 0 0 0 0 0 0 0 0 0 0 0 20 0 0 0 0 0 0 0 0 0 35 17 0 0 0 0 0 0 0 0 1 4 0 0 3 0 0 23 0 0 0 0 0 0 0 0 0 0 0 0 0 0 0 0 0 0 0 0 0 0 2 0 0 0 0 0 0 0 0 2 0 0 0 0 0 0 0 0 3 0 0 0 0 0 0 3 0 0 10 0 0 1 60 0 0 0 0 0 0 0 0 0 0 0 0 0 0 0 0 0 0 0 0 0 0 0 0 0 1 0 0 1 0 0 0 0 0 0 0 0 0 0 0 0 0 0 0 0 0 0 1 0 0 0 0 0 0 0 0 0 0 0 0 0 0 0 0 0 0 0 0 0 0 0 0 0 5 0 1 0 0 0 0 0 0 0 0 0 26 0 0 0 0 0 0 0 0 0 0 0 0 0 0 0 0 0 0 0 0 0 0 1 0 0 0 4 0 0 0 0 0 0 0 0 0 0 0 0 0 0 0 0 0 0 0 1 2 0 0 0 0 0 0 0 0 0 49 0 0 0 5 0 0 24 3 0 0 0 0 0 0 0 0 0 0 0 0 0 0 0 0 0 0 0 0 0 0 0 0 0 0 0 0 0 1 0 0 0 0 0 0 0 0 0 0 45 0 0 0 0 0 0 0 0 0 0 0 0 0 0 0 17 0 0 0 0 0 0 0 0 0 0 0 0 0 0 0 0 2 2 0 0 0 0 0 0 0 0 0 SP157 Bacteria;Bacteroidetes;Bacteroidia;Bacteroidales;Porphyromonadaceae;Porphyromonas;sp. HMT930 0 63 11 2 3 26 281 0 9 168 1 1176 54 2 4 0 24 8 0 0 1 0 1 78 2 1 3 3 63 32 8 2 1 6 0 8 28 7 0 268 1 13 30 27 3 0 125 0 1155 1 59 0 1 10 46 3 2 104 24 22 1 52 0 307 13 69 28 14 63 22 40 67 4 2 0 2 8 9 6 0 14 3 12 147 3 0 0 2 9 5 246 0 259 21 24 0 477 0 43 8 5 2 0 2 39 35 0 0 62 1 0 13 17 71 133 807 49 6 12 1 0 6 1 5 2 13 29 0 1 286 20 3 1 54 105 1174 11 0 0 0 762 57 17 164 7 11 36 483 0 0 1 0 0 0 0 0 0 3 25 0 5 0 3 0 0 3 4 0 0 0 1 1 3 15 0 0 0 0 0 4 0 0 1 31 32 9 9 72 0 15 0 1 61 0 12 7 2 21 12 2 35 381 3 5 1 5 54 0 30 0 7 58 0 0 0 3 48 3 17 22 292 23 2 0 22 3 38 47 0 0 17 195 0 2 0 0 61 5 643 19 126 2 0 20 8 0 0 0 22 0 0 0 0 0 0 0 0 0 0 0 0 0 0 8 785 0 2 0 1 15 15 680 17 0 2 38 6 2 16 52 17 0 2 1 13 12 29 46 12 16 25 3 12 21 2 37 0 3 1 44 7 1 8 107 22 1 9 4 1 0 0 12 3 5 8 1 34 29 6 3 2 2 0 0 1 0 0 0 8 4 0 1 5 1 0 2 1 10 3 0 0 13 0 0 1 0 40 0 4 1 14 1 0 6 16 48 11 0 8 10 8 4 22 0 4 13 0 0 1 0 38 9 2 20 12 1 0 5 18 12 0 0 16 3 0 12 9 0 0 144 53 7 0 0 10 2 3 2 4 15 12 5 1 149 1 1 0 6 35 3 8 4 6 2 4 42 32 0 8 32 10 0 1 0 723 5 3 15 12 2 161 1 11 75 3 1 3 20 2 2 2 0 11 0 27 21 22 76 11 159 3 0 43 55 0 123 2 203 26 9 11 11 16 9 5 2 0 0 1 3 7 2 18 8 3 5 89 4 4 1 21 0 1 1 7 24 36 26 15 5 0 31 8 11 125 1229 0 9 47 4 19 0 0 5 1 6 1 12 0 0 1 0 7 0 40 1 1 49 13 2 38 307 3 19 10 0 0 14 0 0 2 3 8 2 2 0 16 9 8 12 0 0 10 36 0 7 81 42 0 1 1 0 2 2 0 1 0 13 27 19 18 11 3 4 0 116 0 6 2 0 7 0 6 16 3 0 7 132 2 0 22 1 0 36 6 7 0 448 23 1 0 6 0 149 11 4 69 0 0 0 0 0 89 2 3 17 4 25 13 22 16 27 4 9 0 18 0 0 2 14 53 20 21 13 204 2 2 1 36 2 24 0 18 10 11 10 1 21 6 8 80 52 12 1 6 2 0 0 110 29 0 35 11 11 85 4 6 25 10 0 0 0 6 5 210 4 8 0 0 5 3 1 5 2 1 3 5 1 4 49 21 6 1 7 83 0 1 0 1 10 1 805 27 3 12 1 2 29 0 249 352 0 11 13 10 30 6 17 2 9 50 0 6 4 27 0 2 2 0 0 4 0 4 3 4 50 59 45 0 7 0 0 0 0 11 0 12 0 1 14 18 0 225 3 3 11 6 1 8 11 75 13 31 43 15 2 8 95 50 3 5 11 20 4 1 0 26 6 6 63 10 61 34 27 0 0 64 8 57 1 3 4 7 1 2 1 13 0 1 18 16 3 7 6 3 0 1 0 3 2 0 14 10 3 44 5 18 4 1 7 32 0 11 8 14 22 1 0 0 17 9 9 3 1 0 13 12 4 48 7 17 4 1 0 2 1 20 17 0 2 6 5 13 1 1 2 7 30 48 3 6 66 9 16 27 4 399 9 2 0 0 0 0 0 10 27 6 5 41 2 0 4 13 16 5 1 2 0 6 17 0 2 29 4 5 10 0 3 14 0 11 0 207 0 0 4 6 5 4 5 3 42 2 12 4 3 10 15 9 17 3 8 0 33 1 13 0 2 131 29 0 0 17 4 7 0 14 2 28 10 8 20 0 12 5 2 5 37 0 2 32 8 115 3 14 4 16 3 2 25 3 65 24 139 19 36 1 1 11 36 20 36 36 31 0 1 0 3 3 245 0 4 0 1 18 9 27 36 0 12 4 1 1 0 3 2 0 7 3 0 28 0 6 0 2 1 6 16 0 0 0 1 7 9 0 0 0 1 21 0 0 2 1 2 2 6 33 0 3 0 0 33 6 0 4 0 23 49 320 906 2638 323 119 92 327 102 784 67 521 604 96 348 842 102 156 680 72 50 4 151 48 537 1882 1 58 103 551 257 1566 696 430 122 0 1 315 16 0 1275 1712 3412 407 34 480 173 38 1 115 176 112 1 181 313 655 0 361 17 54 264 906 3 231 28 28 9 10 83 109 958 376 441 906 1023 348 113 118 257 45 250 50 19 87 480 0 67 1313 496 73 68 8 569 14 95 124 48 59 248 77 218 1070 442 379 2891 36 212 91 2308 36 273 1243 296 3 1173 1 143 141 188 1319 9 1296 948 224 3027 879 4 175 224 203 767 355 2227 746 589 317 560 88 2632 212 88 1292 240 354 147 856 41 361 72 34 889 1 1040 140 1 16 436 134 51 207 664 572 324 8 37 6 38 84 5203 947 511 280 38 42 564 266 11 378 59 49 11 76 5558 307 11 681 158 1041 332 190 298 436 1412 236 1092 14 593 0 10 215 337 1175 534 2651 761 14 465 8 247 259 823 322 211 2241 311 36 450 1247 656 22 1539 564 642 165 8 14 858 224 170 1229 5 1901 13 641 483 1 1224 67 477 44 38 11 16 566 41 416 196 119 1967 138 214 3216 303 1316 142 570 376 63 19 31 315 210 5265 34 449 88 5 22 597 276 122 170 2408 168 274 106 177 373 862 183 643 1093 190 165 814 1740 1842 1263 67 775 433 2240 120 320 373 713 1266 1591 1 97 364 17 10 889 172 29 28 796 5 1173 1190 130 108 648 274 325 1284 630 18 197 1949 118 0 5 162 1651 204 122 221 8 99 2093 301 257 833 4 1 52 93 141 315 314 1152 931 184 734 380 1177 1392 3196 1001 16 12 4803 290 1780 102 0 9 864 968 953 690 2478 124 550 1469 623 200 30 111 151 43 294 81 607 57 10 1051 33 34 109 342 18 33 209 8 1 71 105 227 184 58 337 100 135 112 57 0 477 6 27 72 0 309 576 15 368 164 1296 325 239 669 335 95 654 4 44 5 328 42 314 479 1317 429 633 164 312 956 2397 21 198 593 763 260 10 607 1320 2215 352 937 60 501 977 130 450 0 655 142 572 371 283 150 215 27 47 232 132 64 1774 50 7 59 1017 93 63 1511 424 72 1275 367 53 954 12 8 58 13 345 14 61 6 668 105 233 110 10 25 25 1319 635 257 11 94 830 234 335 1488 783 220 193 4 13 228 687 338 34 335 918 355 82 10 37 69 14 46 86 750 1866 1554 436 192 272 619 659 68 45 272 503 83 17 13 87 136 3 5 384 367 150 371 392 320 54 229 15 128 1492 118 1103 2808 714 125 808 289 88 34 87 730 569 202 19 79 116 1069 388 319 219 367 246 65 1 567 5370 124 231 239 260 216 554 48 0 279 74 277 1268 1190 295 168 997 678 0 265 272 1303 707 44 1278 316 801 778 162 2167 40 1307 317 48 3 40 60 393 441 94 55 763 11 3105 17 72 9 621 12 100 253 39 1135 0 343 503 19 77 341 101 177 6 27 355 246 94 8 82 208 41 118 684 600 506 44 84 109 186 22 498 439 353 484 1530 582 64 529 462 61 123 88 1898 456 1333 1273 1185 22 47 46 317 75 401 725 957 444 124 31 532 13 876 3938 645 9 165 40 4 4 605 233 135 443 52 66 67 510 23 461 204 22 0 61 7 787 8 14 1 10 49 230 257 3 21 1026 1622 631 1972 9 513 563 0 10 3 296 118 809 93 11 236 2755 231 25 1127 422 20 0 392 241 112 514 477 224 57 3 1081 21 170 75 539 1 269 29 78 58 151 189 359 332 1549 486 83 2840 570 21 1276 17 9 908 306 442 61 41 242 252 83 14 56 171 674 38 12 58 1058 0 343 55 76 348 351 2244 961 442 1900 128 260 2701 17 SP158 Bacteria;Firmicutes;Bacilli;Lactobacillales;Streptococcaceae;Streptococcus;anginosus 0 0 0 0 8 55 0 0 41 6 0 5 0 0 0 8 0 0 0 0 16 0 2 0 81 0 0 824 0 1 49 2 0 0 0 132 0 0 0 0 0 0 1 18 9 0 0 0 280 3 0 8 2 0 0 0 0 0 0 9 0 0 0 3 22 0 0 67 609 338 0 56 9 0 31 0 0 0 0 12 0 0 0 102 0 0 0 0 0 181 0 0 0 0 0 0 1 0 0 16 88 21 0 87 5 0 9 8 0 0 0 464 0 0 0 0 0 48 0 0 0 42 0 0 58 0 12 0 2 0 18 14 347 10 0 2 0 10 1 0 12 0 0 0 0 31 121 0 0 0 71 0 0 0 14 0 0 0 0 0 38 0 1 0 9 0 7 24 26 0 0 0 0 0 0 0 0 0 0 0 0 0 6 19 1 0 5 0 0 36 0 0 0 3 0 0 0 7 8 1 0 0 105 0 0 1 0 0 197 0 4 0 18 0 20 0 6 0 0 1 0 251 4 0 2 0 0 0 0 8 110 0 95 1 0 0 4 3 4 35 0 0 10 0 0 1 1 64 0 0 7 0 0 14 0 0 0 0 6 25 65 76 1 5 8 0 0 0 0 0 0 0 0 2 1 0 0 0 0 0 3 0 0 1 0 0 0 0 1 0 0 0 0 0 0 0 0 0 0 3 3 0 9 1 0 0 3 0 0 0 0 0 0 0 3 2 0 0 2 3 0 0 1 0 0 0 0 0 0 0 0 0 0 0 0 0 0 0 0 0 0 0 0 0 2 0 0 1 0 0 0 0 0 0 2 0 0 0 0 0 0 0 0 0 0 0 0 0 0 0 0 0 0 0 0 0 1 0 1 11 0 0 0 0 0 0 0 0 0 0 0 0 0 0 0 0 1 0 0 0 0 0 0 0 0 0 0 1 0 0 2 0 0 0 0 0 0 0 0 0 2 1 0 3 0 0 0 0 0 0 0 1 3 0 1 0 0 0 0 0 0 0 0 0 0 3 0 0 0 1 0 0 2 0 1 4 0 0 0 0 1 0 0 0 0 0 0 0 0 0 2 0 0 0 0 0 2 0 0 1 0 0 11 0 0 1 1 1 0 0 0 1 0 0 0 0 0 1 0 0 0 0 0 0 0 0 0 0 0 0 0 1 0 0 0 0 0 0 0 0 0 1 0 0 0 1 0 0 0 0 0 0 0 0 0 0 0 5 0 4 0 0 2 0 0 0 0 0 0 1 0 0 0 0 0 0 0 0 0 0 0 1 0 0 1 0 0 0 0 0 0 0 0 0 1 0 0 0 0 0 0 0 0 0 0 0 0 0 0 0 7 0 0 1 0 1 0 4 0 0 0 0 0 3 0 0 0 0 0 0 0 0 1 0 0 0 1 0 1 0 0 0 0 0 0 0 0 0 0 0 0 0 5 0 0 1 0 0 0 0 1 0 2 0 0 0 0 0 1 0 3 1 0 0 0 0 0 0 0 0 0 0 0 2 2 0 1 0 0 0 0 0 0 0 0 0 2 0 0 0 0 0 0 0 0 0 0 0 0 0 0 0 1 0 0 0 0 0 0 1 2 0 1 2 0 0 1 0 4 0 0 0 0 0 0 0 0 0 0 1 0 0 0 0 0 2 0 0 1 0 0 0 0 0 0 1 0 0 2 7 0 0 0 0 0 0 0 1 0 0 0 0 0 0 0 0 1 2 0 0 0 0 0 0 0 0 0 4 1 5 1 0 0 0 0 0 0 0 1 1 0 1 0 0 0 0 0 0 0 0 0 0 0 0 0 0 0 0 0 0 0 0 0 0 0 0 0 0 0 0 0 0 0 0 0 0 0 0 0 0 8 1 2 0 0 0 0 1 0 0 0 0 0 0 0 1 0 0 1 0 0 2 1 0 0 3 0 0 2 0 0 1 0 0 0 2 0 0 1 0 0 0 0 0 0 0 0 0 0 0 0 0 0 0 5 0 0 0 0 0 1 0 0 0 0 0 0 0 0 0 1 0 0 3 0 0 0 0 0 0 0 0 0 0 0 0 0 0 0 0 0 0 0 0 0 0 0 9 1 0 0 0 0 0 0 3 0 0 0 0 0 0 0 0 0 0 1 0 0 0 0 0 0 0 1 0 0 0 0 0 0 0 0 2 0 0 0 0 0 0 3 0 0 0 0 0 0 0 0 0 0 0 0 20 19 0 4 0 0 0 0 0 0 0 0 1 0 0 0 0 0 0 0 0 0 0 0 0 0 0 0 0 0 0 0 0 0 0 0 0 0 0 0 0 0 0 0 0 0 0 0 0 0 2 0 0 0 0 0 0 0 1 0 0 0 0 1 0 1 0 0 0 0 1 0 0 1 1 0 0 0 0 0 2 0 0 0 1 0 1 0 0 0 0 0 2 0 0 0 0 5 0 0 0 0 0 0 0 0 0 0 0 0 0 0 0 0 0 1 0 0 4 0 0 0 0 0 0 0 0 0 0 0 0 0 0 0 0 0 0 0 0 0 0 0 0 0 0 0 1 0 0 1 0 0 0 0 0 0 0 0 0 0 0 0 0 0 0 0 0 0 0 0 0 0 0 0 6 0 0 1 0 0 0 0 0 0 0 0 0 0 0 0 0 0 0 0 0 0 1 0 5 0 0 1 0 0 0 0 0 0 0 0 0 0 0 0 0 0 0 2 0 0 1 0 0 0 0 0 0 0 0 0 2 0 0 0 0 0 0 0 0 0 0 0 0 0 4 0 0 0 0 0 0 0 0 0 0 0 0 0 3 0 0 1 0 0 0 0 0 0 0 0 0 0 0 0 5 0 0 0 0 0 2 1 0 0 0 0 0 0 0 0 0 1 0 0 0 0 0 0 0 0 0 5 0 0 0 0 2 0 0 0 0 1 0 0 0 0 0 0 0 0 34 0 0 0 0 0 0 0 0 0 3 0 0 0 0 0 0 0 0 0 0 1 0 0 0 0 0 0 0 0 1 0 4 0 0 0 1 0 0 0 0 0 9 0 0 0 0 0 0 0 2 0 0 0 0 0 0 0 0 1 0 0 0 0 0 0 1 0 0 0 0 1 0 0 0 0 0 0 1 0 0 6 2 0 0 0 0 0 0 0 1 1 0 0 0 0 1 0 0 0 0 0 18 0 1 0 0 0 0 0 1 2 0 0 0 0 0 0 0 0 0 1 0 0 0 1 0 1 0 0 0 0 0 0 0 0 0 7 0 0 0 0 0 0 0 0 0 0 1 0 0 0 0 0 0 0 0 0 2 0 0 1 0 0 0 2 0 0 0 0 1 0 3 1 0 0 0 0 0 0 0 0 0 0 0 0 0 0 0 1 0 0 0 0 0 0 1 0 0 1 0 0 0 0 0 0 0 0 0 0 0 0 17 0 0 0 2 1 0 0 0 0 0 1 0 0 0 0 0 1 2 0 1 0 0 0 1 0 0 0 0 0 0 0 0 0 0 1 0 1 0 1 0 0 0 0 0 0 0 1 0 0 0 0 0 0 0 0 0 0 0 0 0 0 0 0 0 0 0 0 0 1 0 0 1 0 0 0 0 0 2 0 0 0 2 0 0 0 1 0 0 0 0 1 0 0 0 0 1 0 0 0 0 0 0 1 0 0 0 0 1 1 0 0 0 0 0 2 0 0 0 0 0 0 0 0 0 0 0 0 19 2 1 0 2 0 0 0 1 1 0 0 0 0 0 0 0 0 0 0 0 0 0 0 0 0 0 0 0 0 0 0 0 0 2 0 0 0 1 0 0 0 0 0 5 0 0 0 0 0 0 0 0 0 3 0 0 0 1 0 0 0 0 0 0 1 0 0 0 0 2 0 0 0 0 0 0 1 0 0 0 0 0 0 0 0 0 0 0 0 0 0 0 1 0 0 0 0 1 1 0 0 0 0 0 5 0 0 1 0 2 0 0 0 0 0 0 0 1 0 0 3 0 0 6 0 1 12 0 0 1 1 0 0 0 0 0 0 0 0 0 1 0 1 0 0 3 1 0 0 0 0 0 1 0 0 2 0 0 0 0 0 0 5 0 0 0 0 0 0 0 0 0 0 0 0 0 0 0 0 0 0 0 1 0 0 0 0 1 0 0 SP162 Bacteria;Firmicutes;Bacilli;Lactobacillales;Streptococcaceae;Streptococcus;intermedius 21 121 76 81 3 33 27 26 71 25 22 23 153 7 24 47 71 1 10 3 70 57 42 88 216 91 20 259 238 200 1 53 313 10 51 107 27 347 13 59 20 52 1 21 29 127 59 13 11 15 51 65 153 126 13 14 33 25 33 119 33 196 44 2 16 2 73 8 158 12 28 23 32 15 178 3 7 11 44 14 102 31 8 12 4 23 7 60 266 40 17 206 108 102 69 29 23 9 18 22 12 78 41 185 32 61 15 36 41 98 288 62 38 13 42 8 2 34 48 3 86 105 9 48 16 5 9 90 38 90 17 58 110 230 26 24 88 79 64 8 160 4 630 8 334 9 15 22 11 1840 41 24 67 10 94 35 1 0 21 11 116 56 2 36 3 19 61 13 44 24 0 19 79 117 60 25 23 11 15 14 4 50 103 20 8 13 6 8 0 53 53 5 4 26 6 273 89 3 6 15 33 3 6 5 18 81 9 7 12 0 35 23 9 9 17 0 59 40 39 3 36 16 181 63 14 10 41 8 141 23 75 0 74 130 88 1 24 5 17 14 7 1 16 19 54 27 26 15 38 14 38 464 80 8 5 78 32 34 7 1 24 4 20 5 8 22 14 60 0 0 28 0 2 101 251 0 23 5 53 2 120 104 0 100 15 23 26 60 144 53 100 0 19 1 152 40 34 7 0 240 73 0 134 50 7 33 393 0 76 2 1 18 2 0 73 16 0 129 232 383 0 44 21 0 15 0 8 0 3 0 0 13 0 10 10 0 0 0 0 0 0 30 0 24 55 27 0 110 271 0 21 16 0 4 670 13 0 47 14 0 0 16 0 0 3 0 0 8 2 0 7 0 4 18 0 25 26 0 6 461 1 0 94 12 0 11 329 145 1 0 5 11 0 3 3 18 250 0 6 67 0 0 0 43 39 72 0 80 18 0 81 160 20 0 0 0 155 0 19 0 48 103 8 463 0 36 83 0 45 0 4 6 239 8 46 0 60 0 0 8 3 12 1 32 88 180 6 0 6 85 0 5 83 0 205 165 0 54 0 13 24 0 0 16 0 0 0 38 0 21 41 92 0 1 11 0 141 134 2 124 54 9 234 20 12 72 59 51 0 72 35 84 50 2 47 0 1 39 0 16 30 0 0 0 9 0 3 6 37 2 73 5 0 2 3 0 6 74 0 0 5 24 0 1 7 60 0 3 2 6 0 90 26 18 39 0 28 509 116 965 0 9 119 0 70 24 5 46 0 307 26 68 2 43 117 0 3 92 0 14 0 38 0 0 30 0 0 1 0 12 106 0 6 14 63 6 36 0 6 0 0 29 19 0 57 0 50 0 0 2 2821 0 37 152 0 55 0 418 0 0 0 16 0 14 8 2 0 3 45 29 0 4 200 0 2 0 11 0 6 9 0 0 3 13 2 45 2 1 39 4 0 1 244 44 88 11 12 0 9 16 59 68 106 1 5 0 0 13 60 0 90 308 0 58 16 31 133 4 0 3 4 0 66 382 298 12 153 0 8 1 0 0 0 5 0 35 57 0 20 18 0 9 9 0 0 3 6 0 54 2 2 1 72 35 0 134 6 60 0 136 89 1 88 113 0 51 64 0 30 131 13 0 10 0 0 3 1 0 5 44 0 49 32 1 0 204 18 16 67 3 97 143 52 5 0 236 7 34 60 74 0 153 3 0 12 0 0 43 14 12 7 17 54 0 135 56 59 172 0 10 15 43 1 107 4 0 25 227 10 215 136 0 10 119 0 16 31 0 353 188 17 37 0 28 5 0 11 0 25 0 8 2 31 19 0 2 6 0 0 0 2 0 3 1 0 0 10 0 6 2 26 0 0 0 4 27 0 0 21 5 65 15 90 20 0 0 0 19 32 0 7 22 0 0 2 260 0 1 31 2 1 143 208 0 50 376 37 22 164 0 3 63 6 0 44 192 0 64 42 0 0 0 6 124 1 1 29 0 6 0 1 0 0 1 237 0 47 0 34 0 76 68 1 2 42 0 0 3 218 0 50 9 0 434 7 0 64 0 25 0 7 0 11 0 5 0 0 3 11 33 10 1 0 55 92 8 0 34 197 0 24 1 0 0 173 673 0 2 8 0 21 0 38 116 0 5 106 19 44 252 24 0 44 41 0 26 54 0 1 276 71 0 14 121 2 30 17 12 16 1 153 24 0 18 0 1 0 59 84 0 29 0 1 138 180 0 133 57 0 19 21 0 81 148 0 85 0 62 38 37 16 0 19 35 0 16 17 9 172 2 1 0 0 7 15 41 0 0 0 0 2 62 1 0 0 7 0 0 17 0 6 6 1 146 107 0 17 13 6 0 3 44 0 6 3 0 37 5 33 0 15 6 0 6 6 1 41 56 16 1 20 11 0 176 13 0 0 5 0 2 11 2 0 0 9 123 0 5 10 0 62 12 0 1 0 21 3 0 3 0 0 0 2 0 0 15 0 0 17 28 1 26 1 29 0 4 3 2 0 0 6 0 5 0 0 13 23 0 0 10 2 0 28 2 0 1 0 0 0 21 10 1 27 2 7 0 0 0 0 28 3 0 83 13 0 0 2 52 0 16 1 0 0 0 6 0 0 88 0 0 37 1 1 11 2 0 9 1 3 0 0 3 0 5 9 0 1 2 4 3 0 29 21 0 4 0 0 4 43 0 0 24 1 0 6 10 0 0 3 19 132 0 7 130 44 5 4 1 0 15 27 4 16 116 0 0 0 10 47 6 3 5 0 4 5 1 0 105 43 0 0 5 6 0 5 10 0 15 1 9 0 21 30 0 22 13 0 3 13 1 1 29 55 0 1 2 0 149 32 0 0 1 0 17 15 0 9 11 0 8 12 0 4 58 16 0 8 7 0 8 3 0 0 7 28 0 48 16 0 42 10 0 2 0 5 0 8 11 0 0 4 2 0 116 3 0 3 0 0 5 5 13 0 8 0 0 4 0 0 3 13 0 0 1 18 0 3 11 5 1 7 41 2 14 0 216 47 0 0 220 1 0 9 0 15 435 14 0 42 0 13 0 40 8 0 75 13 0 0 0 1 0 5 0 21 0 29 1 0 23 0 0 4 1 42 17 0 0 1 2 7 34 1 0 131 23 0 2 54 1 5 2 0 70 56 20 0 0 8 117 0 50 118 1 1 325 12 74 0 0 9 0 0 31 138 0 0 8 0 0 0 14 34 0 191 6 1 9 4 0 19 47 2 4 19 0 0 6 19 0 20 7 0 1 19 9 0 57 0 0 14 25 0 5 10 0 0 2 31 0 15 174 2 55 27 0 27 1 109 0 4 12 15 134 0 9 17 0 3 22 0 44 11 12 0 4 4 0 2 24 0 4 12 0 0 24 0 0 7 97 0 0 46 0 0 1 5 8 0 0 0 1 10 0 3 62 1 1 1 238 23 0 9 4 0 18 40 1 2 29 11 0 77 79 0 19 14 0 0 52 0 0 25 6 0 6 3 0 2 0 6 1 63 0 17 3 0 0 5 9 0 14 2 11 0 1 8 0 27 1 16 25 0 0 16 50 0 11 10 0 1 15 0 73 9 0 0 43 35 0 5 2 0 13 8 0 113 15 5 0 47 39 0 5 27 0 5 14 0 0 12 22 0 0 6 0 0 43 24 1 48 1 0 5 16 14 0 3 25 0 27 0 1 16 13 0 0 3 2 0 0 0 0 95 19 6 1 27 0 0 0 13 194 1 8 4 0 4 3 0 4 0 0 0 2 4 0 21 1 0 13 0 0 0 48 34 0 63 8 0 2 6 0 1 0 0 0 6 12 0 50 1 0 59 23 0 21 107 5 0 2 147 24 0 49 1 0 6 14 0 67 4 0 44 19 1 20 1 0 0 45 14 0 2 2 0 7 2 0 1 47 0 0 48 26 0 93 1 6 0 0 30 13 0 0 0 7 1 199 4 0 26 15 26 20 0 0 0 11 5 0 82 1 0 131 27 0 143 6 12 25 0 0 6 31 0 8 1 0 11 71 0 26 4 80 4 33 2 0 41 16 0 7 13 12 0 25 2 0 81 85 3 0 1 2 0 28 5 0 0 0 6 0 17 2 0 0 0 0 0 10 7 0 8 2 0 9 2 0 6 31 2 3 0 SP163 Bacteria;Proteobacteria;Betaproteobacteria;Neisseriales;Neisseriaceae;Neisseria;subflava 0 0 1 1366 0 3 0 2 6 0 0 215 26 0 2758 0 0 0 5 2 2 0 0 45 1 0 1 24 98 56 1 9 2 181 4 12 0 0 6 1 1 0 366 0 7 3 62 0 63 127 11 0 0 0 13 3 2 9 0 274 6 1 0 3 35 7 2 0 60 18 1 10 274 0 0 25 6 0 0 0 27 2 4 38 3 0 12 13 0 1 7 0 30 317 55 3 22 19 30 0 0 23 234 0 0 31 65 0 1 0 15 1 0 0 0 26 2 0 1 49 6 359 14 3 11 0 4 0 14 5 9 6 0 118 366 131 1 0 0 100 2 1 0 25 144 4 0 3 0 121 12 143 563 0 0 0 1 2 61 3 78 44 2 10 20 4 203 51 78 0 4 0 1 5 1203 0 0 0 51 23 0 1 123 40 13 43 2 20 41 9684 3 0 6 0 0 0 2 1 22 399 2 275 601 94 1214 0 0 1 5 4 298 345 366 6 4 1273 19 0 0 55 12 50 1 53 8 1528 8 723 9 74 2 9 0 121 0 0 124 0 1 1390 47 17 2 0 0 1 1 66 0 0 3 356 4 2 0 0 1 0 0 1 0 11 0 1 26 0 4 0 0 0 0 0 0 0 0 0 0 0 0 0 0 0 0 0 0 0 0 0 0 0 0 0 0 0 0 0 0 0 0 0 0 0 0 0 0 0 0 0 0 0 0 0 0 0 0 0 0 0 0 0 0 0 0 0 0 0 0 0 0 0 0 0 0 0 0 0 0 0 0 0 0 0 0 0 0 0 0 0 0 0 0 0 0 0 0 0 0 0 0 0 0 0 0 0 0 0 0 0 0 0 0 0 0 0 0 0 0 0 0 0 0 0 0 0 0 0 0 0 0 0 0 0 0 0 0 0 0 0 0 0 0 0 0 0 0 0 0 0 0 0 0 0 0 0 0 0 0 0 0 0 0 0 0 0 0 0 0 0 0 0 0 0 0 0 0 0 0 0 0 0 0 0 0 0 0 0 0 0 0 0 0 0 0 0 0 0 0 0 0 0 0 0 0 0 0 0 0 0 0 0 0 0 0 0 0 0 0 0 0 0 0 0 0 0 0 0 0 0 0 0 0 0 0 0 0 0 0 0 0 0 0 0 0 0 0 0 0 0 0 0 0 0 0 0 0 0 0 0 0 0 0 0 0 0 0 0 0 0 0 0 0 0 0 0 0 0 0 0 0 0 0 0 0 0 0 0 0 0 0 0 0 0 0 0 0 0 0 0 0 0 0 0 0 0 0 0 0 0 0 0 0 0 0 0 0 0 0 0 0 0 0 0 0 0 0 0 0 0 0 0 0 0 0 0 0 0 0 0 0 0 0 0 0 0 0 0 0 0 0 0 0 0 0 0 0 0 0 0 0 0 0 0 0 0 0 0 0 0 0 0 0 0 0 0 0 0 0 0 0 0 0 0 0 0 0 0 0 0 0 0 0 0 0 0 0 0 0 0 0 0 0 0 0 0 0 0 0 0 0 0 0 0 0 0 0 0 0 0 0 0 0 0 0 0 0 0 0 0 0 0 0 0 0 0 0 0 0 0 0 0 0 0 0 0 0 0 0 0 0 0 0 0 0 0 0 0 0 0 0 0 0 0 0 0 0 0 0 0 0 0 0 0 0 0 0 0 0 0 0 0 0 0 0 0 0 0 0 0 0 0 0 0 0 0 0 0 0 0 0 0 0 0 0 0 0 0 0 0 0 0 0 0 0 0 0 0 0 0 0 0 0 0 0 0 0 0 0 0 0 0 0 0 0 0 0 0 0 0 0 0 0 0 0 0 0 0 0 0 0 0 0 0 0 0 0 0 0 0 0 0 0 0 0 0 0 0 0 0 0 0 0 0 0 0 0 0 0 0 0 0 0 0 0 0 0 0 0 0 0 0 0 0 0 0 0 0 0 0 0 0 0 0 0 0 0 0 0 0 0 0 0 0 0 0 0 0 0 0 0 0 0 0 0 0 0 0 0 0 0 0 0 0 0 0 0 0 0 0 0 0 0 0 0 0 0 0 0 0 0 0 0 0 0 0 0 0 0 0 0 0 0 0 0 0 0 0 0 0 0 0 0 0 0 0 0 0 0 0 0 0 0 0 0 0 0 0 0 0 0 0 0 0 0 0 0 0 0 0 0 0 0 0 0 0 0 0 0 0 0 0 0 0 0 0 0 0 0 0 0 0 0 0 0 0 0 0 0 0 0 0 0 0 0 0 0 0 0 0 0 0 0 0 0 0 0 0 0 0 0 0 0 0 0 0 0 0 0 0 0 0 0 0 0 0 0 0 0 0 0 0 0 0 0 0 0 0 0 0 0 0 0 0 0 0 0 0 0 0 0 0 0 0 0 0 0 0 0 0 0 0 0 0 0 0 0 0 0 0 0 0 0 0 0 0 0 0 0 0 0 0 0 0 0 0 0 0 0 0 0 0 0 0 0 0 0 0 0 0 0 0 0 0 0 0 0 0 0 0 0 0 0 0 0 0 0 0 0 0 0 0 0 0 0 0 0 0 0 0 0 0 0 0 0 0 0 0 0 0 0 0 0 0 0 0 0 0 0 0 0 0 0 0 0 0 0 0 0 0 0 0 0 0 0 0 0 0 0 0 0 0 0 0 0 0 0 0 0 0 0 0 0 0 0 0 0 0 0 0 0 0 0 0 0 0 0 0 0 0 0 0 0 0 0 0 0 0 0 0 0 0 0 0 0 0 0 0 0 0 0 0 0 0 0 0 0 0 0 0 0 0 0 0 0 0 0 0 0 0 0 0 0 0 0 0 0 0 0 0 0 0 0 0 0 0 0 0 0 0 0 0 0 0 0 0 0 0 0 0 0 0 0 0 0 0 0 0 0 0 0 0 0 0 0 0 0 0 0 0 0 0 0 0 0 0 0 0 0 0 0 0 0 0 0 0 0 0 0 0 0 0 0 0 0 0 0 0 0 0 0 0 0 0 0 0 0 0 0 0 0 0 0 0 0 0 0 0 0 0 0 0 0 0 0 0 0 0 0 0 0 0 0 0 0 0 0 0 0 0 0 0 0 0 0 0 0 0 0 0 0 0 0 0 0 0 0 0 0 0 0 0 0 0 0 0 0 0 0 0 0 0 0 0 0 0 0 0 0 0 0 0 0 0 0 0 0 0 0 0 0 0 0 0 0 0 0 0 0 0 0 0 0 0 0 0 0 0 0 0 0 0 0 0 0 0 0 0 0 0 0 0 0 0 0 0 0 0 0 0 0 0 0 0 0 0 0 0 0 0 0 0 0 0 0 0 0 0 0 0 0 0 0 0 0 0 0 0 0 0 0 0 0 0 0 0 0 0 0 0 0 0 0 0 0 0 0 0 0 0 0 0 0 0 0 0 0 0 0 0 0 0 0 0 0 0 0 0 0 0 0 0 0 0 0 0 0 0 0 0 0 0 0 0 0 0 0 0 0 0 0 0 0 0 0 0 0 0 0 0 0 0 0 0 0 0 0 0 0 0 0 0 0 0 0 0 0 0 0 0 0 0 0 0 0 0 0 0 0 0 0 0 0 0 0 0 0 0 0 0 0 0 0 0 0 0 0 0 0 0 0 0 0 0 0 0 0 0 0 0 0 0 0 0 0 0 0 0 0 0 0 0 0 0 0 0 0 0 0 0 0 0 0 0 0 0 0 0 0 0 0 0 0 0 0 0 0 0 0 0 0 0 0 0 0 0 0 0 0 0 0 0 0 0 0 0 0 0 0 0 0 0 0 0 0 0 0 0 0 0 0 0 0 0 0 0 0 0 0 0 0 0 0 0 0 0 0 0 0 0 0 0 0 0 0 0 0 0 0 0 0 0 0 0 0 0 0 0 0 0 0 0 0 0 0 0 0 0 0 0 0 0 0 0 0 0 0 0 0 0 0 0 0 0 0 0 0 0 0 0 0 0 0 0 0 0 0 0 0 0 0 0 0 0 0 0 0 0 0 0 0 0 0 0 0 0 0 0 0 0 0 0 0 0 0 0 0 0 0 0 0 0 0 0 0 0 0 0 0 0 0 0 0 0 0 0 0 0 0 0 0 0 0 0 0 0 0 0 0 0 0 0 0 0 0 0 SP164 Bacteria;Firmicutes;Clostridia;Eubacteriales;Lachnospiraceae;Lachnospiraceae_[G-2];bacterium HMT096 78 0 0 0 2 24 1 0 3 0 2232 2 151 15 1 0 16 0 272 331 0 0 23 0 556 0 0 0 0 0 47 0 0 431 56 73 0 0 4 0 471 0 0 304 143 0 0 0 0 0 2680 103 178 5 856 9 2444 301 1 382 0 0 0 0 1352 2 1 4220 57 91 155 0 10 0 55 0 361 275 0 6 0 42 13 43 663 80 88 5 0 3483 1 0 12 0 0 112 0 12 0 0 0 78 0 0 2 1 980 0 0 0 0 15 131 367 1035 0 1240 654 2119 0 0 0 596 91 717 642 29 865 0 0 82 1007 30 0 202 13 3453 2 13 15 3 1 0 0 2 1672 114 213 0 0 1 0 0 1 0 26 2492 0 304 970 0 0 175 0 0 0 21 234 0 0 0 0 53 2 343 76 21 26 0 0 0 0 0 0 0 16 670 0 0 1694 0 1 467 0 809 2 0 1607 55 7 0 37 875 0 19 4136 0 0 5 0 0 15 338 22 31 2 0 611 0 51 25 0 10 33 0 0 218 0 0 3017 22 0 12 0 1 62 279 956 0 4 0 0 0 0 1 21 124 0 0 0 867 0 0 143 0 0 0 0 0 337 0 201 0 0 41 37 0 0 0 0 0 0 0 0 0 0 0 0 0 0 27 49 153 0 0 0 0 0 0 1 0 0 1 0 0 0 0 11 0 4 2 6 23 1 0 0 0 0 0 0 0 0 0 0 0 1 0 0 0 0 0 0 9 0 0 0 1 0 0 0 0 0 0 0 0 0 0 0 0 0 0 0 0 0 0 0 0 0 0 0 0 0 0 0 0 0 0 0 0 0 0 0 0 1 0 0 0 0 0 0 0 0 0 4 0 0 0 0 0 0 0 0 0 0 0 0 0 0 0 0 0 0 0 0 0 0 0 0 0 2 0 0 0 0 0 0 0 0 0 0 3 1 0 0 0 1 0 0 0 0 0 0 2 0 0 0 0 0 1 0 0 0 0 0 0 0 0 1 0 1 36 0 0 0 0 0 0 0 0 0 0 0 0 0 0 0 0 2 0 1 2 0 0 0 0 1 0 0 0 0 0 0 0 0 0 0 0 0 0 0 0 0 2 0 0 1 1 0 1 1 0 0 0 0 0 0 0 0 0 0 2 0 0 0 0 0 0 0 0 0 0 3 0 1 0 0 0 1 0 0 0 0 0 0 0 0 0 0 0 0 0 0 0 0 0 0 0 0 0 1 0 2 0 3 0 0 21 58 0 0 173 6 0 0 0 0 0 0 0 34 0 23 3 223 377 784 0 0 0 0 11 0 0 0 0 0 0 0 0 0 0 1 0 0 0 0 0 0 0 0 0 0 0 0 0 0 0 0 0 0 0 0 0 2 0 0 0 0 0 0 0 0 0 0 0 0 0 0 0 0 0 0 0 0 0 0 0 0 0 0 0 0 0 0 0 0 80 0 0 0 0 0 0 1 0 0 0 0 0 0 0 0 0 0 0 32 0 0 0 0 0 0 0 0 0 0 0 0 0 3 0 0 0 0 0 0 0 0 1 0 0 0 0 0 2 0 0 0 0 1 0 0 0 0 0 0 0 0 0 0 5 0 6 0 0 0 0 0 0 1 2 0 0 0 0 0 0 0 0 0 0 0 0 0 0 3 0 0 0 0 0 127 0 0 0 0 0 0 6 0 0 7 50 0 1 0 0 1 0 0 0 0 0 0 0 0 0 0 0 1 0 1 0 0 0 0 0 0 0 33 1 0 0 0 1 1 0 0 1 0 0 0 1 0 2 0 0 0 0 0 2 0 0 0 0 0 0 1 2 0 0 0 0 0 0 0 0 0 0 0 0 0 0 0 0 0 0 0 3 0 2 0 0 1 0 0 0 0 0 0 0 0 0 0 0 0 0 0 0 0 2 0 0 0 0 0 0 0 0 0 1 1 0 0 0 0 0 0 0 0 0 0 0 27 0 0 0 0 0 0 0 1 0 3 0 0 6 9 0 0 2 0 0 23 0 0 6 0 0 0 1 0 0 0 0 0 0 0 0 0 0 0 0 0 0 0 0 0 0 0 0 0 0 0 0 0 0 1 0 0 0 0 0 0 0 0 0 0 0 0 3 0 0 0 0 0 0 0 0 0 0 0 0 0 0 0 0 0 0 0 0 0 2 0 0 0 0 0 0 0 0 0 0 1 0 0 0 0 0 0 0 0 0 40 0 0 5 18 0 0 0 0 0 0 0 0 0 0 0 5 0 0 0 1 0 7 0 0 2 2 0 0 0 0 0 0 0 0 0 0 0 0 0 0 1 0 0 0 0 18 0 0 0 0 0 0 0 0 3 6 0 2 0 2 2 0 0 0 0 0 0 0 0 0 0 0 2 1 0 0 0 0 0 2 0 3 0 3 0 0 0 0 13 0 0 166 0 0 0 0 0 1 0 0 0 1 0 0 0 0 0 0 0 0 0 22 0 0 0 1 0 0 2 0 0 0 0 0 10 0 0 0 0 0 0 0 0 0 0 0 0 6 0 0 0 0 6 0 0 0 0 0 3 0 0 0 0 0 0 0 0 0 0 0 0 0 2 0 0 0 6 0 0 0 0 1 0 0 0 0 0 0 0 0 101 0 0 0 0 0 0 0 0 0 1 0 0 10 0 0 0 0 0 1 0 0 0 0 0 9 0 2 0 0 1 1 0 0 0 0 13 0 0 0 0 1 0 0 0 0 0 0 0 19 0 0 0 0 0 1 0 0 0 0 0 0 0 0 0 0 6 0 0 1 0 0 10 0 0 0 0 6 1 0 0 1 4 0 0 0 0 1 0 0 0 0 0 0 0 0 0 0 0 1 2 0 0 0 0 0 0 0 0 0 0 0 0 0 0 0 0 0 0 0 0 0 0 0 0 0 0 0 0 0 1 3 3 0 0 0 0 0 10 9 0 0 1 0 1 0 0 0 4 0 0 0 0 0 0 0 0 0 0 1 0 2 0 0 0 0 0 0 0 0 0 0 1 0 0 0 1 0 0 1 0 0 0 0 1 0 3 0 1 0 2 0 0 0 0 0 0 0 0 0 0 3 0 0 0 0 0 0 0 0 0 2 47 0 0 0 0 0 0 0 0 0 0 0 0 0 0 2 0 0 0 0 0 0 0 0 0 0 0 0 0 2 0 1 0 1 8 13 0 0 0 0 0 0 0 0 0 0 0 0 0 0 0 0 0 0 0 0 0 0 0 0 0 4 0 0 0 0 0 140 0 0 0 0 0 0 3 0 0 2 0 0 0 0 1 0 0 0 0 0 0 6 1 0 0 0 0 0 0 0 1 0 0 0 0 1 0 2 0 0 0 0 0 0 0 0 0 0 0 0 0 0 0 0 0 0 0 0 0 0 0 0 0 0 0 0 0 2 0 0 0 0 0 0 0 0 2 0 0 0 0 0 5 0 2 1 0 0 0 0 0 0 0 0 0 1 0 0 0 0 0 0 0 0 6 10 0 0 0 0 0 0 7 0 0 0 0 0 0 0 3 0 0 0 0 1 0 0 0 0 0 0 0 3 40 0 0 4 0 1 8 0 0 0 0 1 0 1 1 3 0 10 0 0 0 0 0 0 0 0 0 3 0 0 0 0 0 0 0 0 0 0 0 0 0 0 4 0 0 9 0 4 5 0 1 0 0 1 1 1 1 0 0 0 0 0 1 2 0 15 0 1 0 4 0 0 7 0 0 0 0 0 6 0 0 0 0 0 0 0 0 0 0 0 0 0 0 28 0 0 2 2 0 0 0 0 0 0 0 0 0 0 0 0 0 0 0 0 1 0 0 0 0 0 0 0 0 0 0 0 0 0 2 2 0 0 0 0 0 0 0 0 0 0 0 0 1 6 4 0 0 0 0 0 0 0 2 10 0 0 0 0 14 0 2 57 0 0 0 0 103 1 0 0 0 8 0 23 0 1 0 0 0 0 0 0 0 0 0 0 0 0 0 0 0 0 0 0 0 1 3 1 0 0 0 0 1 0 0 0 0 0 1 0 0 0 1 0 0 0 0 0 0 0 0 0 0 0 30 1 0 0 0 1 0 0 0 19 0 0 0 1 1 0 5 0 0 0 74 0 0 0 0 0 0 0 0 0 0 0 SP169 Bacteria;Firmicutes;Bacilli;Lactobacillales;Streptococcaceae;Streptococcus;sp. HMT074 3461 1 39 1555 2 643 0 1 1150 2619 4 5 105 12 1458 7981 11 10 3 2 37 184 3052 79 273 2297 113 426 283 50 1 0 0 0 490 42 68 339 1705 2 158 512 11 544 6 0 5 839 11 0 309 2083 2199 0 12 0 1520 555 23 257 8209 412 456 27 1 21 29 0 26 0 1067 47 1 644 799 212 1194 969 82 485 8 64 596 49 6 0 356 701 96 1934 0 31 121 513 928 91 6 8 1 2056 796 47 38 0 107 86 110 39 7 1160 9 4284 77 189 930 369 1 660 446 194 25 2 468 970 94 2 2484 3490 865 24 0 0 546 199 77 0 0 781 441 12 73 4 35 16 1 7 2 1 1772 1 409 3 0 671 466 8 1 19 0 11 106 4 40 0 519 1031 4 2 1 1518 0 22 0 2 316 466 7 8 1319 1389 467 2 79 2 1667 4 7 89 0 13 1 210 164 194 485 473 637 1243 41 4 4 0 1 0 1490 323 3 31 1089 0 4 275 1572 2393 3079 252 169 861 1 0 26 2 45 12 873 61 1 1446 905 760 664 4 0 7 2 0 1 9 2097 5 8363 4697 836 2 2 272 333 0 2 0 14 1 1 23 0 1 2 991 699 3 1583 3425 2 24 139 837 415 3840 0 0 0 0 0 0 0 0 0 0 0 0 0 0 0 0 0 0 0 0 0 0 0 0 0 0 0 0 0 0 0 0 0 0 0 0 0 0 0 0 0 0 0 0 0 0 0 0 0 0 0 0 0 0 0 0 0 0 0 0 0 0 0 0 0 0 0 0 0 0 0 0 0 0 0 0 0 0 0 0 0 0 0 0 0 0 0 0 0 0 0 0 0 0 0 0 0 0 0 0 0 0 0 0 0 0 0 0 0 0 0 0 0 0 0 0 0 0 0 0 0 0 0 0 0 0 0 0 0 0 0 0 0 0 0 0 0 0 0 0 0 0 0 0 0 0 0 0 0 0 0 0 0 0 0 0 0 0 0 0 0 0 0 0 0 0 0 0 0 0 0 0 0 0 0 0 0 0 0 0 0 0 0 0 0 0 0 0 0 0 0 0 0 0 0 0 0 0 0 0 0 0 0 0 0 0 0 0 0 0 0 0 0 0 0 0 0 0 0 0 0 0 0 0 0 0 0 0 0 0 0 0 0 0 0 0 0 0 0 0 0 0 0 0 0 0 0 0 0 0 0 0 0 0 0 0 0 0 0 0 0 0 0 0 0 0 0 0 0 0 0 0 0 0 0 0 0 0 0 0 0 0 0 0 0 0 0 0 0 0 0 0 0 0 0 0 0 0 0 0 0 0 0 0 0 0 0 0 0 0 0 0 0 0 0 0 0 0 0 0 0 0 0 0 0 0 0 0 0 0 0 0 0 0 0 0 0 0 0 0 0 0 0 0 0 0 0 0 0 0 0 0 0 0 0 0 0 0 0 0 0 0 0 0 0 0 0 0 0 0 0 0 0 0 0 0 0 0 0 0 0 0 0 0 0 0 0 0 0 0 0 0 0 0 0 0 0 0 0 0 0 0 0 0 0 0 0 0 0 0 0 0 0 0 0 0 0 0 0 0 0 0 0 0 0 0 0 0 0 0 0 0 0 0 0 0 0 0 0 0 0 0 0 0 0 0 0 0 0 0 0 0 0 0 0 0 0 0 0 0 0 0 0 0 0 0 0 0 0 0 0 0 0 0 0 0 0 0 0 0 0 0 0 0 0 0 0 0 0 0 0 0 0 0 0 0 0 0 0 0 0 0 0 0 0 0 0 0 0 0 0 0 0 0 0 0 0 0 0 0 0 0 0 0 0 0 0 0 0 0 0 0 0 0 0 0 0 0 0 0 0 0 0 0 0 0 0 0 0 0 0 0 0 0 0 0 0 0 0 0 0 0 0 0 0 0 0 0 0 0 0 0 0 0 0 0 0 0 0 0 0 0 0 0 0 0 0 0 0 0 0 0 0 0 0 0 0 0 0 0 0 0 0 0 0 0 0 0 0 0 0 0 0 0 0 0 0 0 0 0 0 0 0 0 0 0 0 0 0 0 0 0 0 0 0 0 0 0 0 0 0 0 0 0 0 0 0 0 0 0 0 0 0 0 0 0 0 0 0 0 0 0 0 0 0 0 0 0 0 0 0 0 0 0 0 0 0 0 0 0 0 0 0 0 0 0 0 0 0 0 0 0 0 0 0 0 0 0 0 0 0 0 0 0 0 0 0 0 0 0 0 0 0 0 0 0 0 0 0 0 0 0 0 0 0 0 0 0 0 0 0 0 0 0 0 0 0 0 0 0 0 0 0 0 0 0 0 0 0 0 0 0 0 0 0 0 0 0 0 0 0 0 0 0 0 0 0 0 0 0 0 0 0 0 0 0 0 0 0 0 0 0 0 0 0 0 0 0 0 0 0 0 0 0 0 0 0 0 0 0 0 0 0 0 0 0 0 0 0 0 0 0 0 0 0 0 0 0 0 0 0 0 0 0 0 0 0 0 0 0 0 0 0 0 0 0 0 0 0 0 0 0 0 0 0 0 0 0 0 0 0 0 0 0 0 0 0 0 0 0 0 0 0 0 0 0 0 0 0 0 0 0 0 0 0 0 0 0 0 0 0 0 0 0 0 0 0 0 0 0 0 0 0 0 0 0 0 0 0 0 0 0 0 0 0 0 0 0 0 0 0 0 0 0 0 0 0 0 0 0 0 0 0 0 0 0 0 0 0 0 0 0 0 0 0 0 0 0 0 0 0 0 0 0 0 0 0 0 0 0 0 0 0 0 0 0 0 0 0 0 0 0 0 0 0 0 0 0 0 0 0 0 0 0 0 0 0 0 0 0 0 0 0 0 0 0 0 0 0 0 0 0 0 0 0 0 0 0 0 0 0 0 0 0 0 0 0 0 0 0 0 0 0 0 0 0 0 0 0 0 0 0 0 0 0 0 0 0 0 0 0 0 0 0 0 0 0 0 0 0 0 0 0 0 0 0 0 0 0 0 0 0 0 0 0 0 0 0 0 0 0 0 0 0 0 0 0 0 0 0 0 0 0 0 0 0 0 0 0 0 0 0 0 0 0 0 0 0 0 0 0 0 0 0 0 0 0 0 0 0 0 0 0 0 0 0 0 0 0 0 0 0 0 0 0 0 0 0 0 0 0 0 0 0 0 0 0 0 0 0 0 0 0 0 0 0 0 0 0 0 0 0 0 0 0 0 0 0 0 0 0 0 0 0 0 0 0 0 0 0 0 0 0 0 0 0 0 0 0 0 0 0 0 0 0 0 0 0 0 0 0 0 0 0 0 0 0 0 0 0 0 0 0 0 0 0 0 0 0 0 0 0 0 0 0 0 0 0 0 0 0 0 0 0 0 0 0 0 0 0 0 0 0 0 0 0 0 0 0 0 0 0 0 0 0 0 0 0 0 0 0 0 0 0 0 0 0 0 0 0 0 0 0 0 0 0 0 0 0 0 0 0 0 0 0 0 0 0 0 0 0 0 0 0 0 0 0 0 0 0 0 0 0 0 0 0 0 0 0 0 0 0 0 0 0 0 0 0 0 0 0 0 0 0 0 0 0 0 0 0 0 0 0 0 0 0 0 0 0 0 0 0 0 0 0 0 0 0 0 0 0 0 0 0 0 0 0 0 0 0 0 0 0 0 0 0 0 0 0 0 0 0 0 0 0 0 0 0 0 0 0 0 0 0 0 0 0 0 0 0 0 0 0 0 0 0 0 0 0 0 0 0 0 0 0 0 0 0 0 0 0 0 0 0 0 0 0 0 0 0 0 0 0 0 0 0 0 0 0 0 0 0 0 0 0 0 0 0 0 0 0 0 0 0 0 0 0 0 0 0 0 0 0 0 0 0 0 0 0 0 0 0 0 0 0 0 0 0 0 0 0 0 0 0 0 0 0 0 0 0 0 0 0 0 0 0 0 0 0 0 0 0 0 0 0 0 0 0 0 0 0 0 0 0 0 0 0 0 0 0 0 0 0 0 0 0 0 0 0 0 0 0 0 0 0 0 0 0 0 0 0 0 0 0 0 0 0 0 0 0 0 0 0 0 0 0 0 0 0 0 0 0 0 0 0 0 0 0 0 0 0 0 0 0 0 0 0 0 0 0 0 0 0 0 0 0 SP17 Bacteria;Actinobacteria;Actinobacteria;Actinomycetales;Actinomycetaceae;Schaalia;sp. HMT172 2375 0 6 224 106 478 0 643 5 205 1113 32 968 18 58 8654 0 77 5 8 3925 0 445 327 758 950 89 4 86 35 2 3503 0 298 350 1 123 1187 820 0 164 3 260 1 0 2 31 4 1 7 431 1583 346 3 895 1 3145 186 10 52 0 0 705 29 3678 0 15 514 7 3 39 3 0 7 17 2 1479 1467 208 355 0 3 3 2 557 1056 713 525 434 407 2 643 33 0 1880 685 0 13 5 3346 554 2559 0 676 515 9 37 0 20 517 1 0 166 114 3255 12 5 2545 915 276 668 521 335 0 60 846 2118 590 7 2 1 0 281 3 419 15 21 4789 341 179 266 10 65 0 1 4704 7 52 1799 0 355 2 36 2 1247 307 26 2443 297 409 112 1 286 312 402 159 91 4796 29 2012 1 1 6 0 601 3826 309 256 8 110 1 84 403 1630 4409 593 0 0 1 0 2900 13 1545 4 1928 567 146 38 1 16 4 83 1690 13 0 2648 0 1 37 0 59 12 1 753 87 73 39 3162 1 1 482 3 147 4 215 6 0 166 0 1035 2139 8 1618 39 602 424 20 19 11 1 27 214 196 5 11 11 869 2 0 0 0 0 0 5203 40 199 47 1289 0 1771 1610 1323 22 7438 582 1339 2382 1642 0 0 0 0 1 3 0 0 0 0 4 1 5 2 14 1 4 3 2 2 3 6 6 3 0 0 1 2 5 3 0 3 7 0 8 0 1 0 10 0 3 0 1 2 0 0 8 2 0 1 0 3 0 1 7 0 6 0 0 0 5 0 0 3 0 0 3 0 0 1 1 0 0 0 0 0 0 0 0 0 3 0 0 3 0 0 0 1 0 1 0 0 0 0 0 0 0 0 1 1 0 0 0 0 4 8 0 0 1 0 1 0 0 0 0 0 0 0 0 1 0 0 0 0 0 1 0 2 0 0 0 0 3 0 1 1 0 0 0 1 0 1 1 0 0 3 0 0 0 0 3 0 4 0 2 4 4 2 1 0 0 2 0 1 1 0 0 0 1 0 0 0 0 1 0 0 0 1 0 0 4 0 2 3 0 0 4 3 0 1 0 0 1 0 0 0 0 3 8 4 0 0 4 4 2 3 0 2 3 2 0 0 0 15 1 5 0 2 1 0 0 1 2 0 1 1 0 0 4 0 1 9 5 0 15 0 0 0 23 0 1 1 13 19 0 0 1 2 0 1 0 11 0 1 1 0 0 1 0 4 1 3 0 3 0 0 0 0 2 1 0 0 1 4 0 8 2 1 0 6 2 6 2 0 0 0 1 1 0 0 11 3 0 1 5 3 4 2 0 10 0 1 1 0 0 0 0 0 0 0 0 0 0 0 0 0 1 1 1 0 0 0 2 1 1 6 0 0 4 4 0 0 0 1 0 0 0 0 0 1 0 0 0 1 5 0 2 0 0 0 1 0 5 2 0 0 8 1 0 1 7 2 0 1 1 0 1 4 5 0 6 1 0 4 0 0 8 10 0 1 2 4 1 3 2 0 0 0 0 27 1 1 1 0 0 1 3 1 0 0 8 1 23 0 0 2 0 1 0 0 1 1 1 0 0 0 3 1 0 0 1 0 1 0 0 0 0 0 0 0 0 0 0 20 0 3 0 5 0 0 0 0 0 0 0 2 2 2 0 0 0 0 0 1 1 0 0 2 7 4 3 3 1 3 0 0 4 0 3 1 1 1 0 0 7 3 0 0 0 1 6 0 1 6 0 0 1 0 0 4 0 4 1 0 3 0 1 0 2 3 12 4 0 0 8 0 0 12 2 0 1 3 0 0 0 7 2 0 2 0 9 0 0 0 3 0 1 5 0 0 24 0 4 1 0 0 0 0 1 0 0 0 0 2 0 0 0 2 0 0 0 0 9 13 0 0 0 0 0 1 1 0 0 1 0 0 0 1 0 0 7 2 0 1 0 0 4 1 0 0 4 0 2 0 0 0 0 2 0 3 5 0 10 0 1 0 0 1 1 1 1 0 0 1 6 4 0 0 0 0 0 6 1 1 0 1 0 0 7 0 0 0 3 1 2 0 6 0 0 0 1 3 1 0 13 0 0 1 0 0 1 0 0 0 0 0 0 0 0 2 0 2 0 0 0 0 0 19 0 0 0 1 0 0 1 1 0 4 3 13 3 21 0 0 6 3 0 0 5 0 3 0 28 1 13 2 0 5 1 0 1 0 0 5 0 0 0 1 0 2 2 0 6 5 1 0 0 0 5 6 14 0 1 1 0 3 0 2 0 1 3 2 0 0 2 1 20 2 2 0 4 0 0 3 1 0 17 0 0 0 0 0 0 2 0 0 1 0 0 0 1 6 4 3 0 2 1 0 3 4 2 1 0 1 0 4 0 10 0 1 0 0 0 1 1 6 3 1 1 1 1 3 4 0 1 2 3 4 0 1 0 1 0 0 6 0 1 5 2 2 2 3 3 3 2 0 0 2 0 1 2 0 6 0 1 2 0 5 0 0 1 4 0 1 4 3 0 1 0 0 1 8 0 1 0 1 0 0 0 0 2 0 0 0 1 12 0 0 4 4 1 12 0 0 0 0 0 20 0 0 0 3 2 5 1 0 7 2 0 0 8 2 30 1 0 2 1 14 0 0 0 1 0 0 0 1 9 3 1 1 6 1 5 3 3 2 0 0 0 8 2 0 5 0 0 20 0 1 3 1 3 6 3 1 0 7 1 2 0 0 4 5 2 0 2 0 5 0 0 0 4 4 2 3 0 2 0 1 0 1 3 0 2 4 2 1 0 0 0 0 3 0 3 0 0 3 7 8 14 2 0 3 1 0 0 2 2 1 4 1 0 5 0 0 1 0 0 0 8 0 0 3 0 2 13 0 0 0 2 0 0 0 0 2 3 0 1 0 2 5 2 7 0 7 1 1 2 0 2 0 1 2 0 7 0 0 6 12 5 5 6 1 1 1 2 2 0 10 1 0 3 2 0 1 12 1 0 2 0 1 18 1 0 0 0 1 6 11 0 2 0 2 4 24 0 0 12 0 0 0 0 2 4 1 1 1 1 5 2 0 0 0 9 2 2 8 13 4 3 0 0 1 0 0 1 7 4 2 1 0 2 0 1 0 2 7 6 1 4 7 1 2 1 0 1 2 0 0 1 3 3 12 0 16 0 4 0 2 1 3 1 0 0 0 0 0 0 0 0 2 0 0 0 0 5 1 1 1 2 2 1 0 1 1 0 1 0 0 3 0 0 1 1 2 2 0 0 2 17 10 1 7 0 0 1 29 2 4 0 2 0 12 1 2 0 2 7 0 6 3 1 0 0 2 0 0 1 3 0 4 1 0 3 1 0 2 40 3 0 24 1 1 0 1 0 3 4 1 0 3 0 0 3 0 0 0 12 4 0 0 21 3 2 12 0 1 0 1 0 0 3 0 1 9 2 7 0 0 1 1 0 0 0 2 7 5 0 3 0 1 5 0 1 6 3 1 3 2 1 16 0 2 2 7 4 1 1 0 0 0 3 4 0 0 1 1 1 3 11 1 1 0 4 0 0 0 3 3 0 1 2 0 0 2 1 0 0 0 2 1 0 5 6 2 0 0 1 0 3 0 4 8 2 0 3 1 1 0 1 1 0 1 0 0 1 0 0 0 0 1 2 41 3 1 2 2 1 1 1 1 0 0 0 0 0 4 0 0 2 1 0 0 1 7 0 1 1 1 2 0 1 1 1 3 0 1 1 5 5 2 0 0 13 2 2 0 2 3 7 2 9 2 0 1 2 22 0 0 0 1 0 17 0 3 3 8 4 2 1 0 4 5 6 0 13 0 0 23 2 0 1 6 5 2 3 0 0 0 6 0 0 0 0 2 1 1 1 1 5 5 0 1 1 0 0 0 2 0 0 0 8 1 2 2 4 0 3 0 0 0 0 0 0 0 0 0 1 1 1 0 4 1 3 0 0 1 15 3 0 20 5 4 0 0 2 0 0 4 2 9 0 3 3 1 3 13 4 2 0 0 3 1 0 1 0 1 1 4 0 0 0 0 2 2 2 1 1 3 0 0 0 0 0 1 0 0 3 2 0 2 1 1 0 2 31 11 1 1 4 3 0 0 0 5 2 2 9 14 1 0 13 4 1 1 4 4 11 1 1 0 8 0 4 0 0 1 SP170 Bacteria;Actinobacteria;Actinobacteria;Actinomycetales;Actinomycetaceae;Schaalia;meyeri 31 2 23 12 1 3 0 28 2 0 16 2 88 47 0 152 8 4 3 3 24 8 56 4 546 139 0 6 0 1 5 129 0 1 20 1 4 511 1233 0 0 12 7 16 0 1 2 9 0 11 4 341 33 0 10 5 31 5 7 411 2 0 8 6 2310 0 4 45 63 4 3 3 0 21 38 3 471 18 2 33 0 2627 16 3 13 9 101 1 3 7 0 1 9 1 46 21 0 14 0 27 2 19 5 15 2 34 2 0 3 0 7 20 1 2 22 3 0 51 1 1 11 1 6 1 1 245 7 13 24 0 597 0 8 2 0 1 41 47 10 9 27 0 2 0 72 9 8 26 450 0 548 0 579 11 7 592 55 24 1 26 26 0 676 0 1 4 12 18 0 825 0 0 16 6 6 209 568 466 0 1 2 45 0 6 21 40 3 219 0 2 78 0 207 62 16 7 2 7 1 4 0 0 5 1 0 136 0 0 0 0 0 0 9 5 14 7 26 6 0 203 309 0 9 0 3 3 366 1 0 80 13 0 805 8 161 2 214 86 5 186 6 14 517 4 21 3182 3057 0 1 6 3 0 0 44 1 75 25 11 0 952 52 12 11 26 10 43 23 45 0 0 0 0 0 0 0 0 0 0 0 0 0 0 0 0 0 0 0 0 0 0 0 0 0 0 0 0 0 0 0 0 0 0 0 0 0 0 0 0 0 0 0 0 0 0 0 0 0 0 0 0 0 0 0 0 0 0 0 0 0 0 0 0 0 0 0 0 0 0 0 0 0 0 0 0 0 0 0 0 0 0 0 0 0 0 0 0 0 0 0 0 0 0 0 0 0 0 0 0 0 0 0 0 0 0 0 0 0 0 0 0 0 0 0 0 0 0 0 0 0 0 0 0 0 0 0 0 0 0 0 0 0 0 0 0 0 0 0 0 0 0 0 0 0 0 0 0 0 0 0 0 0 0 0 0 0 0 0 0 0 0 0 0 0 0 0 0 0 0 0 0 0 0 0 0 0 0 0 0 0 0 0 0 0 0 0 0 0 0 0 0 0 0 0 0 0 0 0 0 0 0 0 0 0 0 0 0 0 0 0 0 0 0 0 0 0 0 0 0 0 0 0 0 0 0 0 0 0 0 0 0 0 0 0 0 0 0 0 0 0 0 0 0 0 0 0 0 0 0 0 0 0 0 0 0 0 0 0 0 0 0 0 0 0 0 0 0 0 0 0 0 0 0 0 0 0 0 0 0 0 0 0 0 0 0 0 0 0 0 0 0 0 0 0 0 0 0 0 0 0 0 0 0 0 0 0 0 0 0 0 0 0 0 0 0 0 0 0 0 0 0 0 0 0 0 0 0 0 0 0 0 0 0 0 0 0 0 0 0 0 0 0 0 0 0 0 0 0 0 0 0 0 0 0 0 0 0 0 0 0 0 0 0 0 0 0 0 0 0 0 0 0 0 0 0 0 0 0 0 0 0 0 0 0 0 0 0 0 0 0 0 0 0 0 0 0 0 0 0 0 0 0 0 0 0 0 0 0 0 0 0 0 0 0 0 0 0 0 0 0 0 0 0 0 0 0 0 0 0 0 0 0 0 0 0 0 0 0 0 0 0 0 0 0 0 0 0 0 0 0 0 0 0 0 0 0 0 0 0 0 0 0 0 0 0 0 0 0 0 0 0 0 0 0 0 0 0 0 0 0 0 0 0 0 0 0 0 0 0 0 0 0 0 0 0 0 0 0 0 0 0 0 0 0 0 0 0 0 0 0 0 0 0 0 0 0 0 0 0 0 0 0 0 0 0 0 0 0 0 0 0 0 0 0 0 0 0 0 0 0 0 0 0 0 0 0 0 0 0 0 0 0 0 0 0 0 0 0 0 0 0 0 0 0 0 0 0 0 0 0 0 0 0 0 0 0 0 0 0 0 0 0 0 0 0 0 0 0 0 0 0 0 0 0 0 0 0 0 0 0 0 0 0 0 0 0 0 0 0 0 0 0 0 0 0 0 0 0 0 0 0 0 0 0 0 0 0 0 0 0 0 0 0 0 0 0 0 0 0 0 0 0 0 0 0 0 0 0 0 0 0 0 0 0 0 0 0 0 0 0 0 0 0 0 0 0 0 0 0 0 0 0 0 0 0 0 0 0 0 0 0 0 0 0 0 0 0 0 0 0 0 0 0 0 0 0 0 0 0 0 0 0 0 0 0 0 0 0 0 0 0 0 0 0 0 0 0 0 0 0 0 0 0 0 0 0 0 0 0 0 0 0 0 0 0 0 0 0 0 0 0 0 0 0 0 0 0 0 0 0 0 0 0 0 0 0 0 0 0 0 0 0 0 0 0 0 0 0 0 0 0 0 0 0 0 0 0 0 0 0 0 0 0 0 0 0 0 0 0 0 0 0 0 0 0 0 0 0 0 0 0 0 0 0 0 0 0 0 0 0 0 0 0 0 0 0 0 0 0 0 0 0 0 0 0 0 0 0 0 0 0 0 0 0 0 0 0 0 0 0 0 0 0 0 0 0 0 0 0 0 0 0 0 0 0 0 0 0 0 0 0 0 0 0 0 0 0 0 0 0 0 0 0 0 0 0 0 0 0 0 0 0 0 0 0 0 0 0 0 0 0 0 0 0 0 0 0 0 0 0 0 0 0 0 0 0 0 0 0 0 0 0 0 0 0 0 0 0 0 0 0 0 0 0 0 0 0 0 0 0 0 0 0 0 0 0 0 0 0 0 0 0 0 0 0 0 0 0 0 0 0 0 0 0 0 0 0 0 0 0 0 0 0 0 0 0 0 0 0 0 0 0 0 0 0 0 0 0 0 0 0 0 0 0 0 0 0 0 0 0 0 0 0 0 0 0 0 0 0 0 0 0 0 0 0 0 0 0 0 0 0 0 0 0 0 0 0 0 0 0 0 0 0 0 0 0 0 0 0 0 0 0 0 0 0 0 0 0 0 0 0 0 0 0 0 0 0 0 0 0 0 0 0 0 0 0 0 0 0 0 0 0 0 0 0 0 0 0 0 0 0 0 0 0 0 0 0 0 0 0 0 0 0 0 0 0 0 0 0 0 0 0 0 0 0 0 0 0 0 0 0 0 0 0 0 0 0 0 0 0 0 0 0 0 0 0 0 0 0 0 0 0 0 0 0 0 0 0 0 0 0 0 0 0 0 0 0 0 0 0 0 0 0 0 0 0 0 0 0 0 0 0 0 0 0 0 0 0 0 0 0 0 0 0 0 0 0 0 0 0 0 0 0 0 0 0 0 0 0 0 0 0 0 0 0 0 0 0 0 0 0 0 0 0 0 0 0 0 0 0 0 0 0 0 0 0 0 0 0 0 0 0 0 0 0 0 0 0 0 0 0 0 0 0 0 0 0 0 0 0 0 0 0 0 0 0 0 0 0 0 0 0 0 0 0 0 0 0 0 0 0 0 0 0 0 0 0 0 0 0 0 0 0 0 0 0 0 0 0 0 0 0 0 0 0 0 0 0 0 0 0 0 0 0 0 0 0 0 0 0 0 0 0 0 0 0 0 0 0 0 0 0 0 0 0 0 0 0 0 0 0 0 0 0 0 0 0 0 0 0 0 0 0 0 0 0 0 0 0 0 0 0 0 0 0 0 0 0 0 0 0 0 0 0 0 0 0 0 0 0 0 0 0 0 0 0 0 0 0 0 0 0 0 0 0 0 0 0 0 0 0 0 0 0 0 0 0 0 0 0 0 0 0 0 0 0 0 0 0 0 0 0 0 0 0 0 0 0 0 0 0 0 0 0 0 0 0 0 0 0 0 0 0 0 0 0 0 0 0 0 0 0 0 0 0 0 0 0 0 0 0 0 0 0 0 0 0 0 0 0 0 0 0 0 0 0 0 0 0 0 0 0 0 0 0 0 0 0 0 0 0 0 0 0 0 0 0 0 0 0 0 0 0 0 0 0 0 0 0 0 0 0 0 0 0 0 0 0 0 0 0 0 0 0 0 0 0 0 0 0 0 0 0 0 0 0 0 0 0 0 0 0 0 0 0 0 0 0 0 0 0 0 0 0 0 0 0 0 0 0 0 0 0 0 0 0 0 0 0 0 0 0 0 0 0 0 0 0 0 0 0 0 0 0 0 SP172 Bacteria;Fusobacteria;Fusobacteriia;Fusobacteriales;Leptotrichiaceae;Leptotrichia;shahii 0 0 38 0 5 126 7 1 13 10 1 400 0 0 20 2 1 2 0 0 0 0 16 282 35 2 0 4 0 233 0 0 0 18 44 16 32 0 0 0 0 0 0 0 0 0 4 0 173 0 37 5 3 12 0 0 20 2 0 18 0 14 0 0 0 3 0 0 22 0 7 1 0 6 8 0 4 0 0 0 0 0 0 9 0 0 0 4 14 0 3 2 15 92 5 0 0 8 1 2 14 11 3 0 25 1 0 0 0 0 69 13 14 2 0 0 0 0 0 0 0 7 0 0 2 0 1 3 1 90 0 3 0 0 4 0 3 0 0 0 9 0 47 0 3 2 11 0 0 19 1 1 22 7 0 0 2 0 1 0 0 0 0 0 0 1 0 0 2 0 0 0 0 4 2 0 0 0 2 0 3 0 4 0 1 0 1 0 0 0 0 0 0 0 0 8 1 3 3 4 1 0 2 0 0 0 0 20 8 0 2 0 0 1 0 0 0 0 0 0 8 0 2 0 0 0 4 3 0 0 0 0 2 6 0 2 1 4 0 11 0 0 0 2 7 0 0 0 0 0 2 3 0 5 0 1 0 1 0 0 2 0 0 0 4 0 0 0 5 0 7 0 26 234 1436 1 168 661 3083 10 1156 1162 1264 224 145 747 969 0 1040 795 946 13 17 0 878 2534 13 2630 1 1395 198 1124 848 626 31 16 1081 14 409 3 16 34 108 2 65 30 0 132 537 464 1 58 3 0 667 8 45 0 13 0 3 249 1 0 0 0 1 0 0 0 0 391 0 2 10 8 12 34 18 0 0 1 0 279 16 21 1 32 14 0 0 327 0 871 1 24 12 87 2 0 12 0 4734 18 0 274 32 1 0 70 10 0 64 116 1 1 1 126 0 0 0 6 0 1260 6 168 125 4 5 352 0 17 1 1491 1183 252 0 1 0 1 8 693 0 616 92 13 61 0 1182 0 97 2021 179 1477 0 1277 789 0 0 0 0 373 133 1663 0 1656 518 0 138 9 1456 3 2 2 9 5 0 0 569 392 2995 291 98 1 14 15 34 10 0 2651 536 1 0 0 35 387 150 375 8 14 93 1331 1 0 1 15 69 63 435 818 85 923 38 1015 728 983 109 1239 17 181 1560 9 2567 1553 141 0 4 2 0 111 1010 0 0 11 196 1 12 0 17 585 168 288 0 6 8 1 48 1515 0 20 1 642 7 0 1314 450 2 0 1 1183 0 14 0 29 273 0 11 1190 7 64 6 654 1826 294 5 0 1727 687 4 196 776 349 2 13 42 16 0 21 0 1384 3 3119 0 837 933 2302 0 0 0 504 5 1 12 29 584 1 4 1 0 0 0 45 18 0 351 675 765 0 5 4 965 0 1002 1 0 1232 8 275 0 1 0 1342 1 856 12 5 0 2 5 517 17 23 14 0 7 193 1047 1 7 2 0 22 18 38 0 416 102 1 3 125 2217 15 1 2 338 216 1138 0 143 409 80 0 20 1096 594 0 0 2811 68 2319 0 5 309 5 13 519 511 6 25 1540 95 1 472 939 2404 37 391 0 19 33 0 4 1 257 3 3 6 0 61 4 6 4 1792 0 0 0 3 2 18 490 1 0 1 2295 1 1241 0 2 436 2 378 198 59 1184 0 4 436 0 1316 539 59 2 1691 1798 0 14 5 0 11 48 24 32 893 42 15 2326 40 39 443 134 2073 641 78 90 0 212 14 127 443 251 0 1442 237 0 1 0 2 1 43 0 227 1 1534 0 892 39 9 15 0 219 5 6 1 1 1 0 38 474 7 1649 159 25 1454 785 2 13 2449 2 147 576 670 10 2 1782 42 60 2565 7 1 0 0 2 6 649 7 186 278 0 91 3 4 0 3 283 0 0 25 0 3155 1 4 2794 0 3 0 46 0 4 47 423 29 3173 61 33 1 2 57 368 780 0 0 3 2 1 1 0 0 0 1 44 16 305 938 2 375 51 3348 1 2320 0 0 75 5 10 377 29 0 1 33 0 9 1 29 2241 19 5 42 10 461 0 69 54 10 143 1598 2 4 362 549 1 9 5077 2422 225 280 19 174 10 5 4 1159 0 0 0 14 4 41 0 1272 10 527 48 1012 41 29 0 160 554 1314 12 817 164 0 7 174 117 0 1140 1760 273 153 4 18 313 2 0 6 190 364 0 1 10 460 4298 0 1655 2 412 1692 2458 602 1 138 68 2 94 472 3 230 1438 503 0 1983 1515 1 122 991 14 108 0 4 1464 2 2036 4 116 2 0 522 4 4187 2124 12 678 917 0 483 131 27 2964 132 3 640 1324 1 635 2 857 60 544 1333 9 534 783 2 27 11 6 7 8 13 994 2 29 2 2058 0 0 5 0 0 24 0 1 1003 15 0 0 1 27 25 1645 0 441 1555 0 35 398 192 0 20 337 4 130 89 0 14 2 661 4 1466 62 0 0 5 2 1 86 120 18 167 75 0 79 133 0 63 90 0 125 30 37 3 0 305 1130 1 0 0 0 4 26 1 0 1 2046 0 0 0 0 1 1 27 0 120 324 0 0 98 22 17 167 21 0 0 0 2 0 0 0 3 0 174 8 0 12 0 0 0 0 0 0 3 0 0 52 0 1 28 56 62 6 930 101 3 0 717 158 0 10 6 0 65 385 0 0 13 186 4 35 49 0 0 78 279 0 0 101 1 2 360 12 0 68 21 0 91 0 2 0 6 25 13 0 115 1 0 31 4 42 0 172 643 5 548 2 1 1 3 0 0 736 19 1 210 44 0 0 1 142 286 2 58 2054 80 0 9 42 0 54 512 1 131 304 1 3 1 66 83 0 28 30 0 23 7 9 12 140 24 0 0 228 557 0 14 204 0 185 73 572 0 82 555 6 279 177 0 18 54 0 3 5 194 1 0 0 5 171 580 41 2 1 0 19 476 0 11 401 2 67 22 0 0 1 2 0 12 162 0 61 9 0 3 741 3 0 63 23 0 17 11 1 6 0 81 0 208 54 1 0 24 483 0 170 231 0 67 2 0 23 264 25 0 1 0 5 165 0 1 2907 126 0 0 75 215 3 20 17 94 0 30 3 0 20 1 107 11 24 0 120 1 1 1303 195 1647 1 2 0 490 70 472 0 361 419 23 89 4 0 1 0 0 0 0 2 14 0 12 0 0 245 3 1 1802 0 26 1 0 3 52 2 2 11 4 1 84 3 484 18 1 1 8 10 0 0 4 0 0 0 244 319 0 58 51 0 1494 48 2015 12 1 0 211 3 0 91 48 0 1 0 1 0 0 0 185 0 10 21 16 601 2 0 156 10 0 3 89 0 0 29 22 0 49 55 2 0 10 572 0 1 0 0 244 48 5 134 12 0 0 3 171 23 20 922 0 1 0 0 61 0 675 1 1 10 1 3 0 43 63 50 9 1 0 36 2 7 0 100 11 0 0 0 0 275 52 51 4 8 4 0 6 3758 3 0 1568 1 2 8 31 40 1 508 0 20 138 0 7 86 64 0 60 25 124 0 3 3 1 52 5 2 47 53 8 0 113 84 0 623 260 2 1 138 34 2 14 147 0 817 1090 0 11 18 112 0 41 0 90 8 0 0 1 0 0 54 11 84 0 22 3 0 63 5 21 1140 0 0 60 6 29 1 1386 0 0 4 1 1 1 0 390 882 1100 2 64 111 2 1 392 0 506 406 1716 1 18 347 0 4 303 0 106 163 0 5 137 108 1 0 1 0 0 7 47 1 187 6 0 69 54 73 2 2 1703 1 0 4 0 165 261 1 0 0 77 0 156 132 0 646 90 0 3 172 274 0 0 88 934 0 69 35 0 6 17 0 11 90 60 0 6 6 0 291 1 58 7 0 33 0 88 507 0 269 1176 4 21 113 8 11 13 2 0 235 3 3 0 0 0 24 5 0 58 13 3 382 0 0 52 0 134 145 6 210 3 0 9 3 1 293 9 3 0 33 0 1 14 271 0 55 85 10 2 1 0 1 405 0 0 81 166 0 202 1987 78 0 0 163 6 5 20 525 59 0 79 41 35 257 38 33 0 0 0 0 0 0 4 6 45 0 42 3763 5 1 55 3 82 0 0 238 93 10 200 12 0 704 151 0 96 44 350 1 424 404 1 74 459 0 2 42 34 1 68 102 0 45 1499 0 0 10 22 0 7 76 0 0 41 7 0 14 8 1 87 3 0 12 33 3 0 8 748 0 1 0 0 0 0 21 78 1 SP173 Bacteria;Proteobacteria;Gammaproteobacteria;Cardiobacteriales;Cardiobacteriaceae;Cardiobacterium;hominis 9 13 35 2 2 1 10 16 8 9 1 112 49 11 104 8 3 43 15 31 4 2 4 17 22 9 38 2 78 25 1 1 29 6 9 15 8 10 4 13 30 25 4 3 3 6 8 15 13 6 3 6 1 7 1 4 9 34 0 23 5 19 8 4 3 15 4 0 2 13 3 145 8 1 6 0 3 0 4 36 2 5 0 7 7 3 7 5 8 2 11 0 14 9 1 16 77 76 2 3 7 3 31 186 18 4 0 7 1 5 6 9 9 20 8 0 0 3 14 6 6 2 6 4 1 2 1 2 9 28 14 18 7 4 4 4 0 1 4 4 0 60 123 36 11 10 6 7 3 9 4 13 11 4 4 5 12 5 7 9 23 31 1 10 12 23 12 9 58 25 5 2 3 7 21 4 0 0 5 57 1 1 17 24 5 31 53 13 0 6 4 35 2 8 0 1 0 4 7 12 11 3 0 11 3 4 4 2 4 286 8 5 4 3 12 14 0 14 0 5 6 17 0 39 12 34 11 108 54 7 8 6 24 0 3 6 11 7 24 11 0 0 1 7 4 16 2 1 2 0 4 4 3 12 0 8 16 3 5 18 15 13 9 16 4 12 1 45 2 334 32 0 310 11 127 0 356 121 116 31 168 111 250 175 70 95 9 7 129 19 713 282 48 0 388 286 66 78 0 66 42 117 15 96 226 14 17 545 161 0 81 30 15 0 1 28 205 353 91 39 1 15 0 0 17 0 2 0 35 0 4 12 23 12 14 0 28 11 3 2 0 325 0 252 86 52 165 124 488 33 300 34 18 92 452 1426 0 200 313 0 1 48 0 58 65 250 102 33 123 0 106 2 1 225 95 171 190 0 2 92 16 0 193 64 72 107 197 132 3 88 7 5 0 485 318 65 42 0 204 192 54 22 70 34 50 76 1 107 120 274 32 201 10 304 73 823 126 0 336 0 31 18 46 21 0 66 18 330 42 38 7 113 121 316 23 128 128 0 0 2 59 54 76 0 1 9 0 11 59 124 17 106 84 1507 0 5 24 3 0 91 24 1497 0 270 49 72 0 178 182 170 988 167 41 36 188 269 196 9 155 62 213 39 9 109 98 17 270 172 552 90 48 104 25 216 228 49 346 690 0 72 240 170 0 8 149 15 14 113 1 2 13 1 2 37 6 1 27 40 21 448 0 20 11 3 89 190 177 231 1 74 92 1238 1640 361 45 0 27 165 105 21 168 20 33 94 332 397 68 31 1057 73 183 49 165 104 572 1274 7 264 0 146 8 73 207 51 63 54 0 10 0 48 42 0 114 206 350 119 558 7 10 0 11 153 217 52 3 137 259 7 140 3 4 0 37 115 126 56 100 58 1 0 0 52 0 259 51 0 1555 3 28 104 290 39 105 12 125 100 111 152 13 380 7 65 6 72 79 374 254 20 86 196 83 224 17 854 363 596 83 16 86 68 470 55 222 543 179 0 0 91 165 0 32 24 339 333 1072 0 36 4 19 70 241 0 543 422 198 24 20 1 7 24 14 84 1 259 135 96 36 35 76 3 0 108 178 0 0 95 132 586 117 103 87 0 1 77 47 94 3 2 0 14 150 399 56 34 144 12 95 1207 0 80 20 113 33 83 1 61 157 0 359 28 64 73 129 3184 110 12 172 306 132 24 310 61 283 111 153 85 40 66 230 32 155 363 167 5 191 17 499 263 209 64 70 80 123 2 305 365 388 209 7 165 1485 315 213 146 274 145 141 252 77 42 95 938 57 174 53 10 93 1 287 146 15 104 0 762 3 26 59 20 420 52 47 132 26 179 0 86 143 1 0 64 6 67 4 0 30 729 389 1993 84 71 613 0 82 26 20 258 3 0 55 271 1 0 26 65 0 0 164 64 27 5 11 313 34 0 19 1 490 94 3 76 348 27 183 0 27 427 103 29 136 1 2 152 77 516 290 42 257 306 42 0 79 23 97 28 76 77 1036 375 70 139 352 159 86 60 126 613 194 1 147 6 288 173 249 36 115 11 56 17 350 144 110 5 0 417 194 91 114 1 175 115 22 110 10 544 61 0 23 125 101 108 230 41 0 762 132 144 0 53 743 700 34 118 276 774 436 0 0 48 207 1482 115 1327 71 108 39 30 37 141 233 27 314 53 42 93 0 92 140 304 275 0 295 334 91 212 0 61 100 51 98 15 5 74 0 29 2 19 863 648 485 543 120 311 0 16 233 23 36 11 6 47 114 93 39 167 0 38 0 187 7 173 245 118 0 55 4 290 557 17 2 118 6 274 377 15 5 53 0 0 0 0 0 143 0 27 9 2 8 0 3 1 13 43 351 151 115 0 85 44 14 0 13 24 5 16 32 0 27 2 5 6 20 18 0 21 67 6 42 13 27 20 51 25 0 37 52 0 36 12 0 6 34 27 3 0 7 6 0 2 21 0 54 35 0 36 57 72 93 0 24 0 0 0 78 0 38 79 20 0 14 1 0 13 49 3 0 0 236 38 0 17 2 0 28 19 0 10 2 0 2 4 21 1 0 8 0 12 0 0 75 73 146 0 70 1 118 0 34 118 2 61 11 0 13 439 32 0 12 42 0 2 1 1 0 20 40 0 0 77 42 0 36 8 11 3 41 0 8 3 2 0 5 1 16 1 5 1 20 4 5 24 0 10 157 44 26 1 6 17 3 0 0 9 28 73 12 57 16 12 3 16 10 2 63 109 57 0 63 64 12 102 28 5 10 21 1 9 3 63 73 0 27 89 0 1 3 0 0 76 25 0 0 34 20 0 4 21 0 11 3 82 3 33 87 9 122 34 0 5 1 1 2 7 100 94 3 0 0 96 176 0 0 7 0 25 13 21 25 21 1 55 21 1 23 64 125 0 53 19 1 72 13 0 4 25 4 0 139 266 0 111 41 0 4 16 2 0 156 5 0 7 177 17 1 22 5 1 14 20 0 10 44 8 0 273 0 0 207 139 0 63 241 9 0 2 46 4 22 183 5 0 43 16 41 45 0 98 14 148 0 122 1 0 410 33 0 72 87 0 58 92 15 0 47 83 7 126 24 0 0 35 2 0 13 114 19 0 80 0 0 102 58 0 12 0 49 143 54 30 27 1 52 136 0 5 71 22 15 3 10 21 3 113 0 19 259 29 0 1 34 81 0 376 96 6 8 32 7 49 19 3 6 0 1 87 5 0 0 3 0 0 0 27 89 0 50 85 1 62 4 0 16 112 6 65 18 1 0 1 201 0 26 138 0 2 15 5 3 114 139 0 2 21 0 22 60 0 0 1 39 1 23 19 0 82 48 0 4 7 101 142 0 10 52 16 0 9 11 13 14 25 0 113 2 43 0 5 11 1 4 42 1 37 39 13 0 122 43 0 0 45 0 3 73 46 0 17 25 44 65 28 0 206 166 19 409 19 15 0 1 79 42 5 3 0 0 6 6 0 4 27 16 0 19 37 1 42 24 0 1 50 5 0 165 0 0 35 61 7 43 0 39 12 68 0 17 1 0 3 48 11 0 14 23 191 0 15 83 0 57 7 12 148 0 0 81 94 0 1 135 0 1 163 37 115 32 44 7 40 108 3 12 2 0 18 22 0 27 109 0 1 32 123 0 26 45 1 34 16 4 0 73 35 2 8 4 13 0 122 44 3 17 8 0 4 43 22 0 2 20 0 10 40 0 11 22 1 9 131 138 0 1 74 0 11 113 53 0 23 41 0 0 17 41 0 76 20 0 63 25 0 9 9 0 23 200 76 3 10 7 0 202 3 33 0 136 497 1 242 20 0 0 44 2 11 0 3 0 11 7 1 30 15 0 31 3 2 27 8 19 74 2 7 124 0 89 33 0 31 6 27 105 34 5 289 60 72 10 2 0 1 76 1 0 12 6 2 68 5 48 59 5 6 0 11 55 0 21 53 9 0 0 36 215 41 0 44 40 0 21 1 6 11 31 13 88 0 0 0 0 17 3 26 8 0 203 30 47 18 12 368 20 0 0 24 9 1 16 7 1 20 101 0 51 30 68 1 21 42 2 3 31 3 33 10 1 0 24 76 0 73 69 1 0 7 28 0 44 14 0 0 86 15 0 19 0 2 1 4 0 26 3 17 0 13 35 0 30 3 0 21 43 2 3 0 SP174 Bacteria;Fusobacteria;Fusobacteriia;Fusobacteriales;Leptotrichiaceae;Leptotrichia;sp. HMT212 0 20 113 5 2 16 114 7 12 17 5 79 7 1 1466 0 7 45 18 27 2 0 6 17 22 4 2 1 117 216 103 7 124 69 127 1 8 18 12 23 55 21 18 0 9 0 27 0 0 7 3 6 0 6 0 14 7 38 0 47 3 19 0 0 2 277 177 4 251 3 0 352 26 0 2 3 2 0 31 1 20 0 7 5 5 9 4 8 0 85 191 0 37 188 7 10 464 922 1 1 0 42 1 110 9 30 5 8 4 7 2 43 7 8 0 1 0 16 1 19 78 2 13 14 6 0 2 11 0 629 37 53 0 188 42 201 17 3 0 7 6 29 82 8 246 1 15 23 4 7 9 5 150 0 0 1 7 0 346 0 85 20 4 1 1 2 0 0 93 0 0 0 2 9 2 0 0 0 6 21 2 9 10 1 3 1 14 1 6 5 0 1 2 0 1 2 0 3 0 341 87 1 50 3 0 7 4 6 63 303 9 10 4 5 25 6 0 1 0 12 200 5 2 131 4 14 4 934 0 27 28 59 23 28 245 2 12 0 85 154 62 13 2 0 2 3 16 27 16 0 7 23 43 3 0 0 2 1 0 2 2 0 0 1 32 0 1 2 0 434 125 0 72 1 11 0 64 86 106 1183 195 402 27 244 141 36 5 129 0 911 632 37 341 0 612 162 318 382 0 62 32 1 420 108 16 1 5 0 136 7 621 235 15 1 21 367 1110 608 25 0 25 418 327 0 473 0 0 0 49 0 0 64 265 0 1 2 5 9 1 0 53 92 0 213 440 373 106 3 4 0 18 22 96 488 13 583 49 108 0 0 0 45 0 240 37 46 0 5 54 0 1 0 34 23 3 93 0 1 2 232 4 0 240 66 0 2 245 252 0 28 5 1102 0 146 3 84 472 0 79 196 627 0 516 6 28 0 0 44 7 47 81 419 1 1600 209 21 59 0 2202 0 93 21 1 0 0 38 0 1204 2 59 1 737 15 163 1 59 4 738 0 5 6 6 14 9 14 39 0 0 387 545 417 45 111 996 0 50 0 30 0 134 39 1550 0 3 3 11 0 110 0 83 41 73 15 0 37 243 6 215 558 200 174 2 0 82 1272 88 59 70 7 90 54 611 2 851 71 21 115 76 0 148 512 2776 0 5 235 0 2 1033 2 1 90 365 18 45 6 6 10 5 1067 0 0 173 5 0 31 1 0 9 1 1 0 59 19 248 272 1 111 113 36 25 6 274 209 333 25 24 184 13 423 2 60 76 192 87 170 98 4 43 0 263 85 75 37 528 62 162 0 10 126 195 23 0 28 155 4 237 351 300 28 0 38 61 34 0 5 856 199 8 192 0 4 0 14 292 1997 183 9 7 0 1326 0 33 272 85 404 3 17 1 30 110 24 114 220 9 40 271 11 0 227 925 15 109 11 9 79 56 608 1 60 302 34 539 123 123 95 376 165 2 42 143 13 40 17 1266 464 245 0 9 2 1 0 176 169 117 45 2 7 3 26 3 1 56 15 66 238 46 9 0 451 269 516 154 2 127 173 1 936 23 123 8 0 110 236 5 0 838 178 647 55 22 362 0 10 396 346 28 0 4 1 1 15 809 122 24 41 6 1 1301 0 145 41 154 92 68 4 19 177 2826 7 13 285 59 456 773 27 26 227 184 53 165 199 6 1 7 106 22 253 447 317 110 19 21 139 88 478 0 178 273 678 182 528 217 281 247 1405 363 104 107 1345 116 36 106 33 121 64 0 54 147 9 512 59 896 537 34 1 9 120 0 829 366 67 332 1 129 5 138 28 5 167 31 0 57 3 119 134 405 134 0 0 21 21 20 1 3 79 4 68 991 13 13 75 0 58 1 7 132 120 0 16 169 17 2 3 63 0 0 0 73 60 39 1 75 60 0 318 39 89 456 69 33 677 6 163 450 4 0 0 28 89 1 6 118 19 102 51 13 109 225 14 3983 2 1 376 20 1 3 1 876 219 104 101 212 1193 627 70 16 254 9 356 3 11 44 18 27 8 113 151 1035 241 999 550 0 0 1 364 1 0 2 84 14 260 0 48 118 5 1 122 6 14 120 2 10 0 79 54 59 0 0 19 31 4 25 5 705 11 0 2 969 141 273 308 326 16 150 4 16 1 95 381 107 177 297 228 92 0 222 1132 577 220 735 223 1 431 322 0 553 49 17 6 0 11 1686 4407 336 35 61 2 542 594 105 83 110 1 185 545 243 627 12 0 78 8 22 296 89 0 38 0 53 6 180 215 0 5 46 134 140 430 5 1 7 37 111 362 134 16 178 0 0 3 1 0 251 0 89 42 41 0 0 1 0 0 1 49 94 34 0 325 129 203 0 5 51 0 118 18 5 3 119 5 0 72 13 0 0 73 18 12 285 0 69 61 32 0 0 2 0 440 58 0 2 346 370 436 0 41 14 2 1 18 0 10 49 18 0 38 29 89 7 256 0 1 1108 225 0 33 195 131 0 22 3 8 98 9 8 0 3 21 400 0 26 2 0 23 10 0 46 33 0 21 8 6 7 43 87 20 145 29 0 8 213 1 0 2 1 892 0 187 32 0 17 63 0 26 247 4 0 59 21 1 3 11 9 0 30 307 1 6 170 70 0 42 7 0 5 90 2 0 335 62 0 6 0 13 3 0 0 7 468 6 74 1 1 54 21 33 78 3 5 0 1 21 344 71 194 143 294 64 47 3 34 6 0 26 153 129 37 77 125 9 395 203 5 24 2 2 9 0 39 153 42 152 375 6 63 31 4 0 6 29 0 0 125 21 0 7 4 0 468 15 103 42 30 279 7 644 51 0 8 8 107 0 50 195 22 73 2 0 492 146 10 0 78 2 18 19 0 37 59 21 399 52 7 7 133 149 0 145 455 17 231 504 3 43 193 39 41 479 623 0 137 59 1 4 32 17 0 44 6 2 158 148 85 0 135 28 1 37 12 0 12 66 5 0 17 5 6 23 12 11 204 569 4 0 79 56 21 5 140 8 101 229 31 0 77 0 113 38 131 1 129 6 0 118 28 373 13 265 0 276 27 33 9 396 311 93 898 72 0 0 4 19 14 48 257 34 2 190 8 0 844 80 4 9 0 235 629 6 5 36 1 480 175 3 0 528 139 17 37 317 104 2 52 0 40 34 117 0 0 30 5 1 67 126 0 0 52 8 38 82 6 15 2 1 26 1 0 5 22 2 1 0 5 99 1 17 250 4 11 0 0 87 27 0 11 83 2 0 40 519 56 21 123 1 0 122 70 15 34 38 0 11 15 0 128 14 0 0 1 44 4 18 35 0 43 50 1 120 81 49 24 28 178 341 29 0 60 37 78 64 22 1 46 36 2 0 36 17 13 3 10 1 13 73 1 0 59 95 57 0 193 0 0 189 72 226 69 7 1 582 204 3 277 449 2 84 74 41 6 16 78 110 99 7 4 0 5 66 1 95 179 14 0 225 90 16 52 175 3 0 11 5 62 362 13 0 127 118 263 9 5 32 226 521 0 62 1 0 0 246 0 0 279 23 290 0 135 283 56 112 7 5 65 1 0 188 276 0 19 73 0 412 297 38 66 77 74 12 25 70 1 2 62 21 7 34 1 652 182 177 3 62 228 0 96 500 4 39 105 0 0 343 93 21 21 6 45 0 115 75 42 63 1 0 84 64 6 0 2 44 0 78 268 36 185 369 10 0 97 388 0 6 63 0 150 236 28 1 51 120 0 2 5 112 20 126 23 0 68 27 1 31 9 9 12 164 133 1 204 13 0 90 5 21 6 260 121 115 429 74 1 15 343 4 0 0 1 1 35 18 3 16 27 2 388 2 14 16 397 5 116 3 78 374 3 21 309 6 3 7 58 28 0 6 321 306 37 34 15 0 1 58 7 5 74 65 24 113 134 40 348 73 33 0 9 9 5 6 2 34 8 2 138 214 2037 4 87 603 0 15 25 5 27 10 23 0 0 350 0 2 224 1 3 29 0 117 133 189 44 1 84 117 0 0 80 14 0 21 0 0 108 30 0 103 34 55 3 74 80 0 17 80 26 30 27 23 1 92 1217 14 180 11 2 6 76 290 3 258 1102 1 0 0 58 17 83 47 7 54 21 0 5 40 4 0 1 0 1 33 6 6 33 96 1 30 0 SP176 Bacteria;Fusobacteria;Fusobacteriia;Fusobacteriales;Leptotrichiaceae;Leptotrichia;hofstadii 0 3 14 0 4 10 0 0 4 1 0 4 0 0 36 2 2 23 3 0 0 2 0 93 4 0 11 3 62 88 0 0 9 8 25 10 2 0 0 3 0 0 5 0 5 0 3 12 8 1 8 4 0 4 1 0 7 15 0 7 9 15 0 0 2 0 3 1 7 0 2 5 0 1 17 0 3 0 9 4 0 0 0 1 0 0 0 9 2 3 78 0 11 43 0 0 0 31 0 6 0 0 0 0 2 0 0 7 2 3 0 0 10 29 0 0 0 7 1 0 5 4 1 10 2 0 1 2 10 14 0 8 0 0 1 0 0 0 0 0 4 0 240 9 0 3 17 1 0 0 6 0 2 4 0 0 0 0 0 0 0 0 0 4 0 0 1 2 0 0 0 0 0 0 1 0 0 0 0 0 4 0 0 2 5 0 3 0 0 0 1 0 0 0 1 2 0 2 0 1 3 0 6 0 0 2 0 1 3 0 2 0 3 1 0 0 2 0 0 0 0 8 1 1 0 4 1 3 10 22 8 0 0 0 2 0 1 0 0 27 0 0 13 2 1 4 0 0 0 0 2 0 0 6 0 0 0 0 0 4 0 1 0 0 5 1 2 18 0 2 8 0 0 53 2 0 28 1 167 0 157 98 1 476 338 257 0 5 0 101 6 0 8 0 132 143 29 141 0 364 60 0 165 49 1 67 31 0 71 1 0 36 0 0 12 31 0 0 44 0 2 0 1 0 1 0 52 0 0 0 0 14 0 0 1 0 0 0 0 0 0 0 0 0 0 0 0 6 2 0 0 0 0 272 0 0 0 5 4 1 0 1 0 925 1 0 0 1 0 0 1 0 3 0 0 75 0 0 0 1 0 0 265 298 0 0 0 2 0 1 0 0 0 214 12 0 0 0 0 0 0 0 0 81 2 0 0 13 0 0 11 707 0 0 0 0 32 0 0 0 9 17 34 69 1 307 0 0 0 0 0 0 32 836 0 14 3 0 0 0 0 0 2 0 0 10 0 0 1 9 1 3 93 0 0 2 0 143 0 153 35 0 0 0 0 73 0 221 0 0 0 257 0 0 0 0 0 4 0 46 0 2 31 25 12 8 1 0 0 76 430 0 19 193 1 0 8 2 0 3 4 0 0 1 1 0 4 0 0 0 14 2 0 1 1 0 1 26 0 0 0 46 14 0 45 0 0 0 0 214 0 1 1 0 0 0 0 1 24 3 0 449 253 0 0 0 9 8 0 2 320 35 0 0 0 0 0 5 0 12 0 9 0 70 60 4 0 0 0 74 29 0 5 4 25 0 2 0 0 0 0 3 0 0 0 0 2 0 0 24 0 0 3 0 0 161 0 3 0 0 0 0 0 106 4 0 0 1 0 0 0 1 0 0 3 3 0 1 0 0 0 0 100 0 0 0 0 0 12 127 0 0 0 103 0 19 13 0 6 82 0 39 0 338 48 0 0 0 0 0 0 0 0 0 0 31 167 0 168 85 1170 0 388 109 5 1 49 0 0 0 0 0 0 76 0 0 0 0 52 3 0 1 0 0 0 0 12 0 4 81 0 0 0 249 0 384 0 0 0 7 0 0 98 97 0 3 553 0 37 318 41 0 228 194 0 0 0 0 47 249 0 9 25 0 0 36 0 0 2 4 320 10 0 2 0 2 7 201 14 17 0 47 55 0 0 0 0 5 10 0 4 0 0 0 0 177 11 0 0 0 2 0 0 300 0 0 15 17 1 325 84 0 153 82 0 111 360 0 1 46 60 0 0 121 763 0 0 3 0 0 2 1 0 0 0 1 168 0 0 0 1 0 1 0 0 1 0 0 25 0 0 0 0 0 0 1 0 0 2 0 12 0 5 0 0 0 0 63 0 0 0 0 0 0 1 0 0 4 4 1 0 5 18 0 2 2 0 1 71 0 0 13 1 0 7 17 0 202 4 0 3 0 0 1 0 0 0 0 0 0 28 71 2 34 11 0 0 64 0 1 9 4 0 672 0 0 0 2 1 4 1112 0 0 0 0 1 2 0 257 1 9 0 1 0 10 0 0 558 20 0 216 42 0 0 112 0 0 0 0 0 116 0 0 2 35 28 0 0 0 0 0 0 72 171 0 16 0 5 202 47 15 0 91 6 0 182 145 0 765 0 185 0 192 68 0 10 6 30 39 0 4 0 0 126 0 30 0 0 8 0 256 0 0 100 168 0 79 15 0 116 185 0 80 357 0 271 0 118 0 331 1 0 120 49 0 4 0 3 0 0 0 180 0 0 0 3 0 0 2 0 0 0 0 0 1 0 0 0 0 0 0 0 9 558 0 0 15 7 25 0 11 81 0 41 35 1 114 9 11 0 233 22 0 0 0 0 0 9 6 0 212 0 1 59 21 0 18 4 0 2 74 0 0 0 39 22 0 0 2 0 28 32 0 0 0 488 1 0 2 0 2 7 0 0 128 6 0 0 7 8 0 86 16 0 0 1 0 0 0 1 0 0 1253 0 0 0 0 0 0 0 0 0 26 0 0 177 0 0 3 53 270 2 380 1 42 0 0 0 0 45 0 0 13 154 0 0 231 56 0 69 0 0 0 141 0 0 0 573 0 0 102 21 0 2 1 0 274 0 0 0 0 0 1 0 21 2 1 4 0 0 0 0 2 1 131 0 0 6 12 0 0 2 0 0 2 0 0 0 0 101 7 0 13 2 26 0 28 0 0 20 22 0 71 6 0 0 0 14 22 0 10 186 0 10 8 0 0 70 21 0 0 47 4 0 11 54 0 0 61 64 0 40 71 0 245 73 0 28 0 60 0 8 19 0 5 0 0 103 6 0 0 28 0 0 0 0 9 67 0 33 0 0 0 11 32 0 10 2 0 4 0 0 0 0 0 0 1 180 0 30 0 0 0 0 4 0 979 31 0 0 4 6 0 198 3 0 569 8 0 3 34 1 0 143 0 0 138 0 0 142 0 0 0 32 7 0 0 0 0 0 75 0 0 0 0 188 8 0 0 258 0 0 1181 221 0 0 0 0 288 19 47 1 1340 484 0 127 0 0 0 5 1 0 0 0 1 0 23 1 0 70 0 0 18 0 0 0 0 0 204 0 6 0 1 0 187 0 0 0 0 3 0 5 0 0 0 0 0 0 250 154 0 37 3 0 0 41 184 143 0 0 140 1 0 199 24 0 1 1 0 0 0 0 19 0 1652 0 0 0 0 0 209 365 0 54 8 0 0 9 30 0 0 1 0 1 9 3 0 0 0 0 82 9 0 172 10 0 0 0 63 4 75 70 0 1 0 0 157 237 250 0 0 100 19 12 0 9 2 0 3 10 1 1458 9 20 0 125 10 0 0 0 0 31 42 0 0 0 0 0 3 97 0 0 25 0 0 4 15 0 0 0 0 44 398 2 85 1897 24 0 0 46 13 0 0 2 0 188 6 0 0 816 1 0 40 40 0 604 36 0 0 202 2 0 0 26 0 119 7 0 0 0 17 0 0 0 35 2 0 0 1 2 0 112 0 0 0 81 1 0 155 3 104 10 0 0 282 0 0 1 0 0 0 0 0 7 0 0 9 344 126 0 31 1 0 7 8 0 216 168 0 0 49 1 0 13 136 0 148 75 0 0 16 24 0 0 11 0 0 24 35 0 32 3 0 42 17 15 0 20 147 0 13 1 0 13 67 0 0 192 89 0 32 0 0 120 511 2 0 604 0 0 0 0 0 0 8 61 0 0 20 0 19 139 0 4 47 0 1 388 0 0 15 1 7 0 1435 39 0 64 68 0 19 0 1 0 0 0 0 1586 1 0 1 0 0 1221 0 0 187 7 1 0 0 3 0 0 323 10 0 0 25 0 4 0 0 2 0 1 70 6 0 0 0 13 0 19 77 0 315 1 2 676 274 19 0 32 46 0 129 866 3 0 0 710 502 3 2 0 38 0 251 10 0 56 4 6 0 0 0 0 0 0 0 0 1 0 373 1213 0 38 213 0 80 0 0 43 74 1 17 10 0 79 119 0 254 165 49 0 310 3 0 63 13 0 13 13 28 0 20 42 0 0 100 0 0 0 0 0 1 2 0 0 0 12 0 0 1 0 4 10 0 7 18 2 0 0 0 0 58 0 0 2 0 7 1 0 SP177 Bacteria;Bacteroidetes;Bacteroidia;Bacteroidales;Prevotellaceae;Prevotella;shahii 0 10 0 2 1 72 0 113 0 0 0 28 15 16 0 0 28 0 590 188 0 0 0 0 17 0 0 1 2 4 213 95 8 0 162 12 0 0 0 0 0 0 126 0 0 307 0 0 0 6 0 0 0 0 82 5 0 15 2 5 0 0 0 18 542 14 0 521 29 703 0 23 4 0 0 94 97 25 0 0 0 134 0 48 3 9 8 0 0 11 1 1 2 3 0 59 2 14 16 0 0 2 0 0 1 0 0 0 928 2 0 1 0 10 77 32 388 0 198 0 0 0 0 216 4 38 4 19 0 0 201 1353 0 13 32 33 1793 0 2 233 0 0 0 7 0 4 74 191 184 2 2 2 0 0 0 15 1039 0 0 18 0 0 9 5 13 0 0 24 1 0 0 0 16 18 0 0 40 18 2 0 0 1 44 751 0 55 155 0 121 0 0 0 209 57 0 0 0 314 44 10 0 31 20 0 1 17 0 0 0 19 0 5 36 0 0 159 0 19 0 12 0 0 0 15 0 41 1280 0 0 28 0 0 1 0 0 643 34 0 81 2 11 288 278 0 7 0 130 21 0 0 2 55 2 1 0 2 0 4 0 4 0 0 0 0 0 0 0 0 0 6 0 0 0 0 5 0 0 1 15 0 5 2 0 6 10 0 4 0 0 7 16 0 0 0 14 7 3 5 0 6 0 1 7 5 0 0 0 0 3 0 0 0 0 0 0 1 0 3 0 0 0 0 0 0 0 0 0 0 0 0 0 1 0 0 0 0 0 0 0 0 0 1 0 0 1 0 0 0 0 0 0 0 0 0 0 0 0 0 0 0 0 0 0 0 0 0 0 0 0 0 0 0 0 2 0 0 0 0 0 0 0 0 1 1 0 0 0 0 0 0 0 0 0 1 0 0 2 0 0 0 0 0 0 3 0 0 0 1 0 0 0 21 0 0 0 0 0 0 0 0 1 0 1 0 0 7 0 0 0 0 0 0 3 8 0 0 1 0 0 0 1 0 0 0 0 2 0 0 0 4 1 0 0 0 0 1 0 3 0 7 6 0 0 0 0 0 0 19 0 0 0 1 0 5 0 0 2 0 1 2 0 0 0 0 8 1 1 1 0 2 0 0 0 2 0 0 0 0 0 1 4 0 0 0 4 0 0 0 0 0 1 0 0 0 0 0 0 0 0 0 0 3 0 0 0 0 0 3 0 0 0 0 0 0 0 0 0 1 0 0 0 0 8 0 0 0 0 4 0 1 1 0 0 0 0 0 0 0 0 11 0 1 0 4 1 2 0 0 0 0 0 0 0 0 0 0 9 0 0 0 0 0 0 0 0 0 1 0 0 0 2 0 2 0 0 1 0 0 0 0 0 0 0 5 0 0 0 0 0 1 0 0 0 0 0 0 2 0 0 0 0 0 0 0 0 0 0 0 0 0 1 0 0 0 0 0 7 0 0 1 0 1 0 0 0 0 0 0 0 0 0 0 0 1 0 0 6 0 0 0 1 0 3 3 0 0 0 0 0 0 0 0 0 0 0 0 0 0 0 0 0 3 0 0 0 0 1 0 1 0 0 0 0 2 0 3 0 0 0 0 3 0 1 0 0 0 0 0 0 2 0 0 5 0 0 0 0 0 0 0 0 0 2 0 0 2 12 5 7 0 7 0 0 0 0 0 1 1 15 2 0 4 12 0 0 0 0 0 0 0 0 0 5 0 4 4 0 0 0 3 0 4 0 0 0 0 5 2 0 12 1 0 20 1 0 0 9 0 2 0 0 0 0 1 0 0 0 0 0 0 0 0 0 0 0 1 4 0 0 0 0 0 0 0 0 0 0 0 0 0 1 0 0 0 0 0 0 0 0 0 0 1 0 0 0 0 0 0 1 0 0 0 0 0 0 0 0 0 0 0 0 0 1 0 0 0 0 0 0 0 0 0 0 0 0 0 0 5 0 0 0 0 0 0 0 0 0 3 0 0 0 0 0 0 7 0 0 0 3 0 0 2 0 6 2 0 0 0 0 0 1 0 0 0 0 0 0 0 2 0 2 0 8 0 0 0 0 0 0 0 1 1 0 0 2 0 0 0 0 0 0 0 0 0 2 0 0 0 0 0 7 0 0 12 0 2 0 8 1 5 9 0 0 0 0 0 5 0 2 7 0 0 12 7 0 0 2 0 2 0 0 0 0 0 0 2 0 0 3 0 6 2 0 0 1 0 4 1 0 1 0 0 0 0 0 6 0 4 5 0 2 0 0 4 0 0 0 0 0 0 0 1 0 2 0 14 0 0 0 0 0 0 0 0 0 0 0 0 0 0 0 0 0 0 4 0 0 0 2 0 0 1 0 1 0 0 1 0 0 0 6 0 0 25 0 0 0 0 0 0 0 0 0 0 0 0 7 1 0 0 0 0 1 0 4 0 0 0 2 0 0 0 0 0 1 8 1 0 5 0 0 0 0 0 0 3 0 0 0 1 0 1 0 0 0 0 0 0 0 0 0 0 1 0 0 1 0 0 0 0 0 0 0 0 0 2 0 0 1 3 0 0 9 0 1 0 0 0 0 0 0 0 0 0 0 0 0 0 0 0 0 0 0 0 1 0 0 2 0 0 16 1 0 0 0 0 0 0 1 0 0 0 0 0 0 0 0 1 1 1 0 0 0 0 0 0 0 0 0 0 0 1 0 0 6 2 0 0 0 0 0 0 2 0 1 0 1 2 0 2 2 0 0 2 0 0 0 3 0 0 5 2 0 1 1 0 1 0 2 0 0 2 0 0 0 1 0 0 1 9 0 2 1 0 0 1 0 1 1 0 0 0 13 0 0 0 0 0 7 0 0 0 0 1 0 0 0 0 0 0 0 0 0 0 2 0 3 0 0 0 0 0 0 2 1 0 4 2 0 0 0 0 0 0 0 0 8 1 0 0 1 4 0 1 0 0 3 0 0 0 0 2 0 2 0 0 2 0 0 0 0 0 0 1 0 0 0 0 1 0 1 0 0 0 0 0 0 0 0 1 0 0 11 0 4 9 1 0 8 1 0 0 5 0 0 1 1 0 0 0 0 0 1 0 1 0 0 0 0 4 0 0 2 0 3 4 0 0 0 0 3 3 0 0 12 1 6 2 8 0 0 0 0 0 10 0 0 0 0 0 0 0 0 0 0 2 0 0 0 0 0 0 0 2 0 0 0 0 0 0 0 0 0 0 0 2 0 0 0 0 0 0 0 0 0 0 0 0 0 0 0 0 0 0 0 0 0 0 0 0 9 1 0 0 0 0 0 0 0 0 0 9 0 0 0 0 1 0 5 0 0 0 0 0 0 2 2 0 0 0 0 2 0 1 0 1 0 0 0 0 0 2 1 0 0 0 0 0 0 8 0 0 3 0 1 0 0 0 2 0 0 0 0 0 0 0 1 0 0 2 0 0 0 0 0 5 4 0 0 1 0 0 3 1 0 7 0 0 0 1 0 0 5 0 0 17 15 0 0 0 2 0 2 0 0 1 0 0 0 0 0 3 0 1 0 0 1 0 0 0 0 23 0 0 9 0 0 0 0 0 0 1 0 0 1 0 2 7 6 0 0 0 0 0 6 0 9 9 2 0 0 0 0 0 7 0 1 0 0 0 0 1 0 0 0 0 0 1 0 0 5 0 0 3 1 0 0 0 11 0 0 0 0 0 0 0 0 0 0 0 0 0 0 0 0 0 0 0 5 0 0 0 2 0 0 1 0 0 3 0 0 0 0 0 0 0 0 0 0 0 0 0 0 0 1 1 0 6 1 0 0 5 0 1 5 0 0 2 0 0 0 0 0 0 0 0 0 0 0 5 0 0 0 0 0 0 0 0 1 0 0 0 0 1 0 0 1 0 0 0 0 0 0 0 0 0 0 0 0 2 1 0 0 0 2 0 0 0 1 0 0 2 4 0 0 0 4 0 0 0 0 3 0 1 0 0 0 0 0 0 0 0 1 0 0 7 0 2 0 3 2 0 0 4 3 0 0 0 0 0 2 0 2 0 3 0 0 0 0 2 2 0 0 0 0 0 3 0 0 1 0 0 0 0 0 0 1 2 0 0 0 0 0 0 0 0 0 0 0 0 2 0 0 0 1 0 0 0 0 1 0 1 1 0 SP179 Bacteria;Bacteroidetes;Flavobacteriia;Flavobacteriales;Flavobacteriaceae;Capnocytophaga;sputigena 0 165 29 18 2 363 6 580 14 234 6 306 172 32 4561 6 29 429 377 175 0 0 10 32 25 2 3 1 342 621 118 76 918 35 195 8 32 187 9 226 188 79 39 3 17 5 540 3 275 13 29 6 4 16 22 82 12 195 3 102 8 30 1 329 718 850 53 62 1022 3289 127 360 241 14 4 202 49 9 15 11 200 2 23 57 24 5 12 51 11 109 17 0 126 319 5 34 1073 600 1430 9 13 103 15 220 19 116 15 36 1593 2 9 85 17 76 59 91 63 10 203 7 36 12 7 143 11 15 12 0 103 232 1590 58 1 403 64 156 135 24 6 21 34 39 190 20 180 206 73 181 63 44 17 291 131 23 5 11 406 7 17 28 219 243 36 6 2 24 30 5 250 2 447 10 37 129 22 4 38 24 51 194 2 10 114 24 18 178 266 110 60 27 23 57 63 31 14 27 2 25 41 245 104 57 27 158 115 17 11 6 46 3502 41 20 24 0 13 5 8 7 3 304 170 196 7 192 26 40 307 388 506 27 30 105 15 13 249 7 43 6 46 197 0 417 50 122 12 1 51 33 55 6 6 639 165 38 1 14 137 5 7 35 64 17 12 341 84 3 15 128 792 93 135 0 31 0 142 0 17 298 193 1104 304 380 628 3 214 64 5 84 98 315 610 618 20 27 856 443 158 215 0 240 494 955 60 234 243 3 228 2066 683 16 72 696 40 1 78 171 0 250 31 143 46 196 180 0 61 0 0 0 7 0 1 46 371 68 20 1 0 1 38 76 570 177 1 129 132 28 708 5 106 36 568 357 372 564 1335 1040 937 36 388 1 8 34 5450 82 106 2433 1598 126 299 0 261 8 207 361 273 60 2 1051 19 107 3 0 88 216 622 218 64 379 4 1285 12 473 0 322 1122 72 447 1470 218 326 1150 188 178 37 96 1641 2 319 83 352 465 236 526 561 280 89 709 0 106 2218 194 208 90 3 1 26 108 874 93 417 72 348 588 175 79 434 239 0 432 6 37 44 319 0 43 407 1 1625 37 38 60 51 156 2641 0 165 55 116 2 93 34 1408 6 178 431 154 2 423 21 139 499 218 566 365 648 123 99 116 288 501 1202 673 41 160 295 111 518 360 286 267 30 797 187 478 397 1255 158 172 0 666 304 448 0 85 252 56 193 1592 7 3 263 83 43 66 5 8 82 224 93 4590 1 46 21 18 152 152 4 337 8 573 1876 491 771 1268 232 0 25 977 305 37 196 107 84 302 221 121 78 21 58 401 61 15 924 833 534 1338 4 242 0 273 2552 177 862 89 17 54 2 48 0 328 21 0 139 16 467 471 717 446 10 0 94 123 242 2 5 486 185 35 378 0 5 6 292 1145 346 215 206 123 0 5392 0 109 1363 2 948 166 789 59 237 395 461 193 794 266 74 158 195 1962 447 477 221 279 9 214 1 285 1220 38 819 258 99 2 793 571 144 760 199 2197 24 26 277 407 354 309 259 170 0 198 611 2735 3 62 3690 1092 162 12 26 136 1135 4 23 4 36 73 666 35 2 93 195 218 626 154 6 246 1068 156 342 1023 80 1 6 45 257 18 146 256 22 468 297 36 74 14 107 270 39 69 0 123 0 4 1 2122 68 17 888 13 2 401 3 190 11 2175 26 253 0 43 356 1515 58 8 407 105 227 314 156 15 534 687 193 251 268 56 220 29 578 81 54 46 114 350 926 100 380 0 488 154 214 628 290 705 279 553 480 511 196 174 284 1137 1177 557 1205 769 557 126 1944 1552 657 640 593 104 247 803 184 344 1583 219 163 2826 628 431 76 220 3846 1117 1 759 264 7 330 222 17 247 24 101 3973 1158 436 0 130 246 273 1932 170 1 533 92 200 485 2 144 393 479 744 1262 145 1121 1814 2 2 756 1 2 20 177 25 0 347 392 72 686 3 271 433 1 40 213 1279 561 46 382 819 25 28 11 1 414 326 466 344 14 28 822 742 790 339 148 511 156 264 0 599 18 243 101 47 92 4833 617 247 377 27 264 722 1006 60 10 158 2 96 414 79 42 826 21 250 784 115 427 37 127 102 4 0 322 1530 519 257 479 174 224 36 55 9 795 115 55 670 90 249 580 344 268 0 829 589 210 0 22 161 2761 16 2374 1084 398 1091 1 427 589 247 834 354 622 77 326 79 315 33 201 566 258 295 302 0 214 0 229 277 231 184 1905 941 4998 182 363 0 230 165 6 269 499 228 612 982 76 5 47 188 232 476 43 269 405 675 187 532 179 305 77 315 315 11 183 78 405 11 66 0 164 16 98 179 266 65 247 464 91 738 13 6 38 7 431 100 514 412 140 0 30 3 0 1 112 0 468 15 19 145 0 21 4 0 17 1092 726 418 2 87 147 159 0 108 178 126 37 74 0 41 56 107 43 49 33 10 772 611 22 102 113 15 50 154 283 0 118 114 0 153 61 0 5 555 157 42 0 28 1 2 11 18 0 12 54 4 354 58 295 404 25 70 0 1 1271 326 0 145 77 99 13 98 89 7 73 74 4 0 16 725 121 1 260 41 1 14 279 0 9 51 3 22 6 81 17 35 30 0 225 21 0 71 20 223 1 93 53 939 1 99 61 1 167 53 39 121 630 51 0 41 153 0 6 21 6 0 58 198 10 2 31 8 16 219 18 15 12 118 0 7 114 46 53 29 6 352 9 27 19 75 29 18 82 0 50 137 289 78 414 18 42 3 0 0 93 299 531 77 153 269 283 5 41 28 2 400 32 159 54 247 385 32 91 154 7 28 25 5 27 8 446 149 64 56 123 5 29 68 4 2 62 219 0 0 84 98 0 6 127 1 313 10 224 127 90 364 29 12 126 0 15 63 21 1 102 97 169 5 53 12 243 119 1 2 331 0 186 191 31 63 4 1 283 126 6 57 109 102 0 421 197 3 285 112 0 40 187 26 55 241 558 0 294 135 0 39 127 0 0 474 18 0 2 750 529 23 146 24 0 19 56 0 37 359 33 0 18 32 1 266 147 3 285 361 48 4 7 54 14 6 578 24 1 206 53 52 36 1 68 93 1493 10 23 19 14 308 184 343 310 181 0 19 157 54 2 136 152 81 507 282 0 33 10 9 17 20 885 35 1 60 8 0 588 198 4 33 4 139 470 27 60 92 5 10 483 11 5 556 67 11 5 1236 380 30 122 0 35 98 93 1 11 0 394 15 830 1538 41 25 53 25 241 127 0 27 9 0 210 15 0 4 9 0 2 3 20 99 1 140 179 2 92 12 8 18 4 5 40 71 0 0 37 1429 65 43 674 24 6 55 37 11 609 261 0 120 166 10 9 7 0 3 3 60 2 108 12 2 161 323 2 76 79 18 566 32 44 14 296 2 4 65 34 123 108 1 11 382 11 1 76 83 0 2 107 3 112 155 14 0 51 151 10 0 248 3 3 228 195 184 138 145 724 163 61 40 64 59 5 223 72 150 6 13 331 83 76 10 3 1 2 2 0 103 23 33 0 108 84 8 245 143 4 0 43 7 75 950 42 9 17 242 808 166 1 130 68 324 6 47 5 0 12 124 8 0 111 21 539 0 75 144 62 240 48 11 599 0 2 97 760 86 40 178 0 0 866 56 772 184 59 0 62 508 23 20 99 1 9 50 0 529 326 131 8 1 365 0 280 104 5 86 632 29 0 460 266 11 9 18 245 0 193 307 30 31 15 3 50 263 61 0 8 79 242 43 137 13 133 198 3 21 29 403 0 4 119 0 143 160 48 2 50 369 0 4 8 130 36 830 41 0 247 67 3 49 25 0 108 708 345 5 180 42 6 356 5 92 127 435 368 158 217 66 1 3 56 9 521 0 32 0 50 22 125 233 127 16 429 439 27 236 80 48 152 48 125 267 100 28 680 17 92 154 5 281 14 29 218 722 163 76 21 0 0 116 11 25 19 18 20 37 729 379 184 64 28 0 31 34 0 1 65 27 2 0 56 10 277 0 152 25 4 88 76 12 17 172 42 107 0 2 0 1 664 74 202 52 2 576 59 324 332 60 1174 12 0 0 105 269 332 108 4 0 17 126 0 265 32 43 24 62 203 1 71 51 1 299 80 11 5 117 322 0 74 28 3 5 38 147 3 135 120 3 0 1772 42 0 44 8 24 204 1161 3 93 23 326 0 85 109 0 157 36 79 128 248 4 60 3 SP18 Bacteria;Fusobacteria;Fusobacteriia;Fusobacteriales;Leptotrichiaceae;Leptotrichia;sp. HMT392 0 1 19 0 5 5 44 5 2 4 3 173 37 4 4 0 0 102 11 14 2 0 1 11 6 2 26 3 92 99 3 2 197 3 15 5 2 0 7 17 5 1 11 0 0 0 0 2 0 0 7 9 0 27 0 0 2 0 7 12 0 15 3 5 3 17 0 7 42 15 9 10 0 0 0 5 6 0 0 7 0 0 5 2 2 6 2 4 2 7 203 0 9 145 1 0 38 257 9 2 2 14 0 0 9 0 5 11 20 6 0 20 2 8 0 1 0 4 0 12 0 2 6 4 0 1 0 1 10 307 7 30 0 17 4 53 17 16 0 1 0 39 24 76 9 6 20 33 1 12 1 0 294 0 0 1 9 0 10 0 155 18 0 2 0 0 2 0 27 0 0 0 7 8 5 0 0 4 2 3 3 0 128 3 3 1 4 1 0 1 0 1 1 0 2 0 1 2 0 17 24 1 39 0 0 0 1 1 0 137 1 6 0 0 2 0 3 0 0 8 7 18 0 58 1 6 6 8 8 12 0 1 56 24 1 0 8 0 5 278 177 1 0 11 14 4 5 3 0 0 1 9 0 12 0 0 37 2 1 9 3 0 0 18 6 2 0 13 0 216 1 0 10 0 2 0 18 8 135 0 377 133 0 18 119 39 0 2 0 0 142 3 4 0 632 221 36 11 0 18 17 0 255 97 200 1 2 0 31 1 48 6 3 0 0 19 0 59 0 0 3 18 73 0 1 0 0 0 1 0 1 1 43 0 0 0 2 0 0 0 0 3 1 120 0 2 0 0 26 0 4 12 1 0 2 0 0 25 0 0 0 1 0 6 0 2 0 2 250 0 10 0 0 66 17 0 0 0 0 9 4 0 224 21 0 23 292 1 0 2 0 48 0 337 10 2 22 0 12 45 333 0 0 0 366 0 0 1 2 0 0 101 0 13 0 0 10 0 1 0 1 0 0 0 0 1 3 0 17 0 0 31 42 179 0 60 19 0 0 0 17 3 0 0 0 3 0 0 160 106 13 0 35 0 0 3 0 7 0 405 122 97 0 4 0 8 0 30 14 3 36 38 0 0 594 0 0 1 47 105 6 2 0 1 17 27 311 300 39 74 7 0 2 169 148 0 3 69 0 39 56 23 0 0 104 0 0 12 1 0 7 12 0 0 1 0 15 12 0 6 0 18 0 3 104 1 0 0 0 1 0 318 1626 0 109 0 45 10 0 0 1 13 39 3 10 1 118 1 433 0 155 12 0 1 2 259 1 2 0 241 471 2 59 101 25 137 0 0 0 2 1 0 0 12 19 2 628 11 0 0 0 64 33 0 2 1 171 1 1 0 0 0 0 1 0 3 0 6 0 0 0 0 0 397 6 0 6 0 2 150 134 22 6 3 0 0 0 0 0 53 0 4 2 10 7 30 222 0 2 325 8 4 8 0 238 237 1 0 4 7 1 3 19 0 57 0 0 80 1 0 1 0 140 38 2 1 3 0 9 0 1 0 109 2 0 47 0 0 5 5 0 64 0 8 0 0 1 0 1 0 0 8 111 0 0 28 9 0 21 155 83 0 0 1 0 85 0 1 0 26 2 0 0 0 0 0 1 0 0 13 11 0 53 10 0 146 3 0 2 4 0 6 139 53 0 0 254 251 27 13 210 3 1 14 114 0 13 4 412 44 77 16 1017 0 144 0 25 93 31 0 224 2 89 18 0 870 46 3 0 531 55 163 0 24 22 0 217 51 0 93 258 0 116 74 0 1 1 0 215 192 3 1 0 34 1 12 10 7 0 6 0 18 0 12 1 22 21 0 0 0 7 2 3 0 1 4 56 0 7 1 50 0 9 0 3 128 0 0 2 10 0 0 4 0 0 0 0 0 1 0 0 1 1 0 6 3 12 28 2 12 1 1 1 1 0 0 0 0 19 0 1 2 1 0 457 0 0 0 0 1 0 11 23 1 9 25 7 213 49 43 3 6 4 118 44 2 394 2 120 0 4 12 0 63 9 0 5 8 66 7 39 0 0 0 21 0 0 0 87 0 12 0 35 0 23 0 84 4 7 1333 2 5 0 459 172 58 0 2 98 199 6 373 26 398 7 0 0 155 26 0 203 70 39 222 0 0 0 4 2 2 8 0 19 15 0 60 79 8 23 1 46 1 283 516 0 9 160 3 0 0 0 34 0 125 0 13 20 0 54 0 177 58 0 2 6 0 88 1 0 1 1 0 25 33 0 20 0 98 0 181 189 0 2 95 1 2 12 4 1 0 2 104 34 0 0 1 0 0 0 0 0 1 0 0 35 17 0 0 1 0 0 0 0 0 19 0 84 24 36 0 53 65 0 179 28 2 1 28 30 0 114 6 0 1 293 0 0 3 2 0 51 7 0 0 0 0 87 26 0 12 428 36 15 0 114 35 0 0 24 0 30 20 3 0 106 69 305 0 0 0 0 10 7 0 36 55 1 0 6 0 0 15 26 42 0 1 1 65 0 3 0 0 132 2 0 14 8 0 0 1 8 9 0 0 0 29 1 0 6 13 20 0 4 10 249 0 24 58 0 79 1 0 9 0 35 0 4 8 0 6 32 0 0 19 50 0 0 421 34 0 80 10 1 14 6 0 9 3 445 0 1 0 7 32 0 1 51 16 4 121 0 11 180 14 53 113 1 19 0 0 0 410 8 0 227 50 12 62 5 7 2 0 163 121 0 0 89 406 0 114 24 6 12 4 1 0 1 171 0 0 66 29 0 16 5 6 0 6 156 0 0 24 116 0 5 4 0 4 0 162 1 59 145 0 185 137 0 0 0 1 0 0 30 4 4 0 0 92 297 0 0 18 1 39 21 2 22 7 0 19 28 0 7 74 63 0 54 34 0 10 28 0 2 16 22 25 1 577 0 50 15 0 19 11 33 0 45 16 0 0 267 228 0 70 15 1 32 18 0 116 32 7 0 286 0 1 273 121 0 70 88 4 0 38 22 2 0 0 7 0 13 5 0 16 0 48 12 6 0 135 0 0 595 114 147 10 17 0 262 34 42 0 121 45 3 140 9 0 0 5 8 0 7 23 19 0 150 5 0 382 4 1 2 0 163 100 0 49 45 1 44 385 5 0 113 158 4 2 190 1 1 31 1 7 0 3 0 1 43 17 0 14 24 0 1 0 8 8 37 0 16 1 0 121 0 0 0 2 2 0 0 0 14 0 11 31 0 10 8 0 21 21 1 22 30 0 1 0 244 1 643 34 0 0 8 130 3 63 1 0 12 11 3 17 1 0 0 0 20 0 62 2 0 1 9 0 0 26 36 0 0 16 334 2 1 47 26 16 3 3 0 11 2 0 0 36 44 1 1 23 0 29 15 25 0 97 1 0 0 0 0 0 0 2 0 34 1 2 195 44 0 211 309 2 301 300 85 0 0 1 33 0 2 0 0 49 2 0 0 95 3 0 11 2 0 27 62 0 0 25 5 0 623 17 1 152 570 0 0 0 74 108 11 0 62 0 0 0 11 5 0 49 9 96 0 8 60 0 63 38 2 0 0 0 130 73 0 0 229 0 0 107 2 7 59 20 4 15 134 0 0 0 0 2 8 0 133 18 0 0 50 125 0 6 52 0 2 45 0 0 91 110 0 0 5 13 0 313 28 2 21 6 0 124 6 16 0 2 0 0 17 51 0 8 46 0 0 28 28 0 2 36 1 5 785 1 0 67 204 0 0 19 0 0 48 89 0 17 71 0 27 24 0 0 160 11 0 27 2 0 19 1 11 1 60 52 0 886 58 1 0 116 1 0 0 0 0 3 4 0 54 0 0 19 2 0 7 10 8 108 2 3 78 23 0 0 4 6 20 8 68 3 0 37 29 4 4 1 0 0 7 1 0 50 9 4 72 422 6 130 178 3 0 0 1 0 0 1 34 8 0 439 81 0 2 45 612 0 33 1 0 44 9 23 0 0 0 0 0 2 1 0 5 0 34 221 17 161 0 80 0 0 0 178 8 0 0 0 0 38 18 0 64 4 111 0 167 175 0 20 409 4 25 22 0 0 0 100 0 34 0 0 0 3 22 0 11 23 0 0 0 1 0 6 8 0 48 48 0 14 35 16 0 0 0 0 26 4 0 23 34 13 7 0 SP181 Bacteria;Firmicutes;Clostridia;Clostridiales;Peptoniphilaceae;Parvimonas;sp. HMT110 0 71 20 78 5 16 0 36 4 11 0 3 37 58 0 20 21 0 0 0 4 25 10 20 194 19 20 120 67 145 4 0 1 48 32 10 0 1303 3 17 10 0 0 4 0 85 7 38 0 0 4 10 28 118 5 1 0 3 13 31 0 0 69 0 16 0 24 54 12 4 3 0 13 8 62 0 9 4 0 30 529 0 8 101 3 0 12 4 0 2 15 58 6 0 56 26 0 22 20 6 3 54 0 0 5 102 0 14 12 121 88 114 1 1 3 1 6 0 0 12 68 0 0 29 0 41 1 33 2 1 3 39 0 7 0 0 3 6 17 20 2 0 73 5 43 2 4 0 3 1814 4 54 106 19 11 0 0 0 14 44 156 0 0 151 46 4 46 2 0 12 0 9 1 117 34 32 41 28 0 0 4 0 3 57 3 0 3 0 5 179 23 115 16 1 0 0 37 0 30 12 22 4 96 0 11 12 13 30 54 2 0 0 51 0 0 0 0 0 8 0 12 949 27 9 0 0 3 0 1 3 124 0 73 7 607 19 17 2 0 19 4 0 119 22 1 5 11 0 0 0 13 621 46 2 0 21 79 3 3 4 132 0 0 99 45 19 0 18 0 0 0 0 0 0 0 0 0 0 0 0 0 0 0 0 0 0 0 0 0 0 0 0 0 0 27 0 0 0 0 18 11 0 0 0 0 0 0 0 3 0 0 0 0 0 0 0 0 2 0 0 0 0 0 0 0 0 0 0 0 0 0 0 0 0 0 0 0 0 0 0 0 0 0 0 3 0 0 0 0 0 0 0 0 0 0 0 0 0 0 0 0 0 0 0 0 0 0 0 0 0 0 0 0 0 0 0 0 0 0 0 0 0 0 0 0 0 0 0 0 0 0 0 0 2 0 0 0 0 0 0 0 0 0 0 0 0 0 0 0 0 0 0 0 0 0 0 0 0 0 0 0 0 0 0 0 0 0 0 0 0 0 0 0 0 0 0 0 0 0 0 0 0 0 0 0 0 0 0 0 0 0 0 0 0 0 0 0 0 0 0 0 0 0 0 0 0 0 0 0 0 0 4 0 0 0 0 11 1 0 1 0 0 0 0 0 3 0 0 0 3 0 0 0 0 0 0 0 0 0 0 0 0 0 0 0 0 0 0 2 0 0 0 0 0 0 0 0 0 0 0 0 0 0 0 0 0 0 0 0 0 0 0 0 0 0 0 0 0 0 0 0 0 0 0 0 2 0 0 0 0 0 0 0 1 11 0 0 0 0 0 0 0 0 0 0 0 0 0 0 0 0 0 0 0 0 0 0 0 1 0 0 0 0 0 0 0 0 0 0 0 0 0 0 0 0 6 0 0 0 0 0 8 0 0 0 0 0 0 0 0 0 0 0 0 0 0 0 0 4 11 0 0 0 0 2 0 0 0 0 0 0 0 0 0 0 0 0 0 0 0 0 0 0 0 0 0 0 0 0 0 0 0 0 0 0 0 0 0 0 0 0 0 0 0 0 0 0 0 1 0 0 0 0 0 0 0 0 0 0 0 0 0 0 0 0 0 0 0 0 0 0 0 0 0 0 0 0 0 0 0 0 0 0 0 0 0 0 0 0 0 3 0 0 0 0 0 0 0 0 0 0 0 0 0 0 0 3 2 16 0 0 1 0 0 0 0 0 2 0 0 0 0 0 0 0 0 0 0 0 0 6 0 0 0 18 0 0 0 0 0 0 0 0 0 0 0 0 0 0 0 0 0 1 0 0 0 0 0 28 4 0 0 0 0 0 0 0 0 0 0 0 0 1 0 0 0 0 0 0 0 0 0 6 0 0 0 0 0 0 0 0 0 0 0 0 1 0 0 0 0 1 0 0 0 0 0 0 0 0 0 0 0 0 0 0 3 0 0 0 0 0 0 0 0 0 0 0 0 0 0 0 0 0 0 0 0 0 18 3 0 0 0 0 0 0 0 0 0 0 0 0 0 0 0 2 0 0 0 0 0 0 0 0 0 0 0 0 0 0 0 0 0 0 0 0 0 0 0 0 0 5 0 0 0 0 0 0 0 0 0 0 0 0 0 0 0 0 0 0 0 0 0 0 0 0 0 0 0 0 0 0 0 0 0 0 0 0 0 0 8 1 0 0 2 0 0 0 0 0 0 0 0 0 0 0 6 0 0 0 0 0 0 0 3 0 1 0 0 0 0 0 0 0 9 8 0 25 0 0 2 0 0 2 9 0 19 0 2 0 13 14 1 0 5 0 0 0 0 1 0 0 0 0 0 0 0 0 0 0 0 0 0 0 0 1 0 0 0 0 0 2 0 0 1 0 0 0 0 0 0 1 14 0 0 0 0 0 0 0 0 0 0 0 0 0 0 7 6 0 0 1 0 0 0 0 0 0 0 0 0 0 0 0 0 0 0 0 0 0 0 3 0 0 0 0 0 0 0 0 0 0 0 0 0 0 0 0 0 0 0 0 0 0 0 0 0 0 0 0 0 0 0 0 0 0 0 0 0 0 0 0 0 0 0 0 0 0 0 0 0 0 0 0 0 0 0 0 0 0 0 0 0 0 0 0 0 0 0 0 0 0 0 0 0 0 0 0 0 0 0 0 0 0 0 0 0 0 0 0 0 0 0 0 0 0 0 0 0 0 0 0 0 0 0 0 0 0 0 0 0 0 2 0 0 0 0 0 0 0 0 0 0 0 0 0 0 0 2 0 1 0 0 0 0 0 0 0 0 0 0 0 1 0 0 0 0 0 0 0 0 0 0 0 0 0 0 0 0 0 0 0 0 0 0 1 0 0 0 0 0 0 0 0 0 0 0 0 5 0 0 0 0 0 0 0 0 1 0 0 0 0 0 0 0 0 0 0 0 0 0 3 0 0 0 0 0 1 0 0 0 0 0 0 0 0 0 0 0 0 0 0 0 0 0 0 0 0 0 0 0 0 0 0 0 0 0 0 0 0 0 0 0 0 0 0 0 0 0 0 0 0 0 0 0 0 0 0 0 0 0 0 0 0 0 0 0 0 0 0 0 0 1 0 0 0 0 1 0 0 0 0 0 1 0 1 0 0 0 0 0 0 0 0 0 6 16 0 0 0 0 0 0 0 0 0 0 0 0 0 0 0 0 0 0 36 0 0 0 0 0 0 0 0 0 0 0 0 0 0 0 0 0 0 0 0 0 1 0 0 0 0 0 0 0 0 0 0 0 0 0 0 0 0 0 0 0 0 0 0 0 0 0 0 0 0 1 0 0 0 0 0 0 0 0 0 0 0 0 1 0 0 0 0 0 0 0 0 0 0 0 0 0 0 0 0 0 0 0 0 0 0 2 0 0 0 0 0 0 0 0 0 0 0 0 0 0 0 0 0 0 0 0 0 0 0 1 0 0 0 0 0 0 0 0 0 0 0 0 0 0 1 0 0 0 0 0 0 0 0 0 0 0 0 0 0 0 1 0 0 0 0 0 0 0 0 8 0 0 0 0 0 0 0 0 0 0 0 0 0 0 0 0 0 0 0 0 0 0 0 0 0 0 0 0 0 0 0 0 0 0 0 0 0 0 0 0 0 0 0 0 0 0 0 0 0 0 2 0 0 0 0 1 0 0 0 0 0 0 0 0 0 0 0 0 0 0 0 0 0 0 0 0 0 0 0 0 0 0 0 0 5 0 0 0 0 0 0 0 0 0 0 0 0 0 0 0 0 0 0 0 0 1 0 0 0 0 0 0 0 0 0 0 0 0 0 0 0 0 0 0 0 0 0 0 3 0 0 0 0 0 0 0 0 1 0 0 0 0 0 0 0 0 0 0 0 0 0 0 0 0 0 0 0 0 0 0 0 0 0 0 0 0 0 0 1 0 0 0 0 0 0 0 0 0 0 0 0 0 0 0 0 0 0 0 0 0 0 0 1 0 0 0 0 0 0 0 0 0 1 0 0 0 0 0 0 0 0 0 0 0 0 0 0 0 0 10 0 0 0 0 0 0 0 0 0 0 2 0 0 0 2 0 0 0 10 0 5 0 0 0 1 0 0 0 0 0 0 0 0 0 0 0 0 0 0 0 0 0 0 0 0 0 0 0 0 0 0 0 0 0 0 0 0 0 0 0 0 0 0 0 0 0 0 0 SP182 Bacteria;Fusobacteria;Fusobacteriia;Fusobacteriales;Leptotrichiaceae;Leptotrichia;sp. HMT417 24 7 2 24 0 191 0 466 8 35 333 13 127 9 7 84 17 2 921 725 18 28 202 151 710 2 0 77 41 4 26 789 0 69 137 287 300 90 22 1 227 2 4 451 324 341 13 8 147 10 246 424 357 5 317 83 227 35 9 29 16 0 59 2 463 15 13 2270 120 83 43 3 251 150 14 13 90 102 1 23 723 85 21 67 217 68 96 174 0 396 0 19 14 2 1 4 0 13 2 81 34 561 2 40 0 4 34 1 77 7 0 63 232 100 340 2 41 316 339 34 85 40 45 400 28 27 1998 758 523 4 35 236 1 9 86 2 2618 54 1 31 9 0 3 4 2 384 44 743 13 247 514 15 86 1 3 33 253 0 2 11 0 0 51 6 1 18 5 21 2 6 0 0 22 3 4 0 18 6 5 2 5 0 37 127 3358 66 50 22 19 208 48 5 245 80 190 2 182 219 5 37 3 16 128 17 14 1539 6 10 28 0 45 1 34 0 12 11 8 18 0 26 92 35 34 12 3768 2 316 4 0 9374 62 0 13 54 19 100 53 162 7 64 1 0 1220 3 5 6 292 1 197 0 283 25 19 1427 0 31 258 82 10 35 11 161 1 37 41 29 114 126 0 0 0 0 0 149 7 0 2 1 564 1 434 607 2755 175 47 138 41 5 16 12 133 0 14 1 0 96 1 252 0 219 38 112 406 658 26 4 44 0 1 0 3 0 18 0 487 12 2 0 5 65 1 1 73 0 6 0 6 0 0 0 0 362 1 0 0 0 0 0 0 0 0 0 0 4 9 3 3 3 3 1 5 0 0 0 6 0 1 0 0 0 0 1 0 101 1 0 0 13 2 0 8 0 2 1 18 5 1 4 0 2 0 0 0 0 0 0 0 0 0 0 0 11 0 0 0 0 4 0 4 3 0 0 6 3 0 0 0 1 0 0 6 9 3 7 61 1 0 0 1213 0 1 0 861 22 3 36 1 1 7 0 0 1 11 31 0 29 71 0 9 2 231 1 0 5 0 0 11 0 177 13 1272 11 307 0 1 0 0 6 4 24 4 0 0 0 126 5 0 320 0 1 12 0 0 0 0 0 5 6 283 14 0 10 164 255 4 94 0 1 1 1041 1 0 0 16 3 0 3 0 1 88 261 0 0 0 0 4 0 0 4 56 0 3 0 1 8 2 3 79 0 0 0 375 1 0 0 21 0 0 0 0 0 0 0 0 0 0 2 0 1 2 0 89 234 6 0 1 424 936 0 248 14 55 0 0 0 0 0 0 0 291 0 1674 9 3724 2996 1437 0 0 0 34 27 0 0 14 0 1 0 1 0 0 0 2 0 0 3 922 1 0 3 13 2 0 204 1 0 242 0 36 0 0 0 2042 1 4 0 0 0 0 4 6 3 11 0 0 1 0 0 0 114 4 1 0 2 0 0 0 0 0 3 16 6 0 0 1 0 2 2278 0 30 1 8 1 1 18 5 0 0 2 0 6 4 2 4 5 2 1544 2683 0 2 201 7 0 29 202 1 0 168 0 0 0 0 10 0 31 1 0 1 0 2 1 0 0 5 0 1 0 1 12 1 1 1 6 0 3 0 423 0 0 142 1 1 2 9 419 0 1 73 0 67 1 16 0 416 88 0 0 2 0 0 37 4 0 0 0 0 353 12 4 0 0 203 7 0 5 0 0 6 0 50 84 0 87 421 1 2 0 0 1 13 0 66 0 3 0 66 21 0 0 0 1 0 0 2 0 0 0 0 0 0 1199 4 0 208 0 0 8 0 0 3 8 1 0 0 13 122 0 3 0 0 0 7 0 0 0 0 2 0 0 182 2 1 0 0 1 10 0 0 0 1 0 0 1 0 0 0 2 0 0 0 5 18 50 2 0 0 0 292 0 3 0 2 0 1 0 2 0 2 7 0 1 692 0 7 0 2 0 1 2 1 0 1 3 4 0 5 1 0 585 0 0 2 2 4 4 24 1 0 0 0 0 9 33 0 23 477 0 1 13 41 2 3 4 0 214 2950 2 194 0 63 3061 42 0 0 0 0 0 13 0 44 34 76 0 2 0 12 0 139 0 0 0 1 1 0 0 13 0 0 130 1 1 3 0 3 0 0 11 0 1 35 2 1 0 224 2 7 6 2 719 6 0 0 0 6 2 0 0 414 2 11 6 11 0 85 193 0 2 24 8 39 2 1 2 0 0 0 0 0 0 1 0 6 1 0 381 260 0 251 136 3 203 0 1 6 6 0 1234 1 1219 21 27 0 0 1041 157 4 122 688 6 1 13 1 0 0 0 6 79 0 0 0 0 0 2 0 3 7 0 1 0 0 0 7 0 3 78 13 0 1 1 213 11 4 23 0 24 74 51 57 0 10 0 4 0 3 0 0 0 6 16 1 5 84 0 2 98 16 66 0 6 0 0 0 0 67 0 28 760 5 0 0 0 1 35 7 1 1 128 1 4 486 0 60 0 0 0 9 155 0 1 32 163 1 35 1 0 24 0 1 18 44 0 0 24 0 0 11 0 0 0 29 1 3 8 3 0 0 11 41 1 1 361 1 0 39 1 0 74 13 16 2 1 8 0 7 0 5 72 55 10 65 29 333 0 0 242 2 10 8 4 1 42 79 2 31 124 1006 0 2 0 3 1 29 1 0 0 3 0 0 148 0 0 0 94 0 57 6 0 6 0 33 7 1 6 8 53 4 2 25 5 2 11 3 0 8 1 0 12 2 9 2 1 5 2 9 3 0 7 0 6 0 13 34 2 1 4 14 1 0 14 30 0 78 39 4 9 159 173 44 2 6 390 0 125 230 22 79 80 80 436 117 1 0 7 432 0 5 0 2 0 4 256 0 2 14 1 1 8 105 1 12 5 1 1 0 0 2 4 15 6 4 9 6 0 3 2 4 1 24 15 0 0 0 11 0 0 1 9 52 44 49 0 10 16 4 290 41 3 25 1 1 113 1 47 29 0 3 0 2 1 4 1 1 0 1 16 9 32 18 2 1 1 2 71 0 1 0 4 3 9 0 134 187 4 18 8 2 2 1 0 32 0 73 0 19 25 1 5 10 0 0 1 0 3 0 0 3 2 126 3 0 0 3 22 0 10 428 36 111 0 36 0 1 0 0 11 8 2 122 1 0 55 0 3 2 73 277 2 9 14 0 0 0 6 10 0 2 326 20 3 2 3 53 147 0 9 6 0 4 1 0 0 12 0 0 38 339 4 3 3 0 1 464 6 6 0 0 0 3 256 1 0 1 0 7 5077 7 1 2 12 2 345 856 110 8 29 28 1 0 22 88 8 0 59 0 0 0 12 18 4 114 0 0 3 30 12 0 10 4 293 19 4 0 56 1 361 167 1 2 1 0 2 48 2 11 0 0 5 9 0 538 235 0 0 110 6 0 1 1 0 0 0 1 13 0 4 0 67 3 21 14 10 2 1 3 3 34 8 6 2 8 42 1 1 47 1 0 2 27 0 1 14 8 0 0 24 1 109 2 0 18 12 0 0 4 3 11 14 28 6 0 1 13 55 1 1 9 5 0 160 12 0 17 7 13 0 0 17 107 1 488 2 0 55 1 4 30 0 118 57 3 1 9 7 5 26 474 184 0 0 2 1 3 1 0 2 212 25 90 16 3 99 89 24 5 0 2 1 0 1 0 0 128 1 1 52 3 31 9 7 46 0 3 1 3 10 0 0 2 0 7 0 4 1 0 190 8 7 3 22 7 0 27 0 0 0 24 2 2 23 13 25 10 2 0 63 0 0 2 19 0 1 1 44 11 10 68 9 0 0 20 25 17 31 13 2 0 14 1 134 0 1 4 0 6 0 2 6 75 4 31 21 5 2 95 0 267 0 12 203 5 0 1 1 0 31 4 0 6 2 0 0 7 27 27 67 48 8 2 3 36 3 28 58 1 1 4 0 94 7 48 268 6 65 8 707 1669 15 48 7 36 272 0 317 46 1 0 1 1 1 0 0 2 0 11 0 18 93 4 0 14 2 38 0 0 289 255 4 40 0 0 4 16 0 118 0 1233 9 24 0 0 175 61 3 1 0 4 0 525 12 59 21 159 4 279 39 3 0 49 44 0 0 1 60 0 25 47 45 8 1 109 4 3 1 0 3 7 2 26 0 1 4 0 0 24 0 SP183 Bacteria;Firmicutes;Clostridia;Clostridiales;Lachnospiraceae_[XIV];Stomatobaculum;longum 13 47 0 6 1 16 0 0 1 11 67 0 0 0 0 13 0 0 23 16 327 4 2 26 32 9 1 0 0 2 0 0 0 63 78 60 217 16 7 3 9 2 0 286 45 120 4 22 16 0 434 298 360 1 359 0 636 3 1 98 0 0 8 4 0 0 0 938 3 6 25 20 5 27 76 0 5 73 1 6 76 0 4 0 31 3 5 81 3 1919 1 94 22 0 17 0 0 0 0 23 6 12 7 1 2 0 60 0 0 2 5 1 188 2 321 1 1 234 339 0 9 19 344 101 196 19 340 146 607 0 0 0 21 15 226 0 1 5 11 0 9 0 8 0 0 354 112 44 68 0 101 0 54 10 22 5 212 27 214 13 0 0 8 0 0 72 1 1 0 16 1 45 0 0 162 5 0 0 0 0 45 0 1 104 1129 0 0 0 0 115 21 0 3 1 192 2 902 0 0 3 0 0 126 0 6 726 0 1 0 0 20 5 68 4 41 3 5 47 0 0 11 74 1 2 291 0 0 0 31 861 52 0 0 0 0 0 98 60 35 3 20 0 34 0 0 2 0 0 139 22 162 0 0 8 0 0 0 0 33 0 13 226 0 62 46 68 389 327 0 0 0 0 0 0 0 0 0 0 28 0 5 5 44 20 3 0 2 1 0 0 11 0 1 0 0 0 2 1 0 9 4 7 11 14 2 0 2 1 0 0 0 0 0 0 9 0 0 0 0 0 0 0 3 0 0 0 3 0 0 0 1 1 0 0 0 0 0 0 0 0 0 0 0 0 0 0 0 0 0 0 0 0 0 0 0 0 0 0 0 0 0 0 0 1 0 0 0 0 0 0 0 0 7 0 0 0 0 1 0 0 1 0 0 0 0 0 0 0 0 0 0 0 0 0 0 0 0 0 0 0 0 0 0 0 0 0 0 0 0 0 0 0 0 0 0 0 0 0 1 3 0 0 10 0 0 0 0 1 0 0 0 0 0 1 0 0 0 1 0 1 6 0 0 0 0 0 0 1 1 0 0 0 0 0 5 0 0 0 0 0 0 0 0 0 0 0 0 0 0 0 2 0 0 0 0 0 0 3 0 0 0 0 10 0 0 0 1 0 0 0 0 0 4 0 1 0 0 0 0 4 22 0 0 0 0 0 0 0 0 0 0 6 0 0 0 0 13 1 0 0 0 0 0 0 0 6 0 0 0 0 0 0 0 0 0 0 0 0 0 0 0 0 12 2 0 0 0 51 0 32 0 1 0 0 0 0 0 0 0 0 0 4 0 23 49 13 0 0 0 0 1 0 0 0 0 0 0 0 0 0 0 0 0 0 0 0 0 0 0 0 0 0 0 0 0 3 0 0 0 0 0 0 0 0 0 0 0 0 0 0 0 0 0 0 0 0 0 0 0 0 0 0 0 0 0 0 0 0 0 0 0 0 0 0 0 0 0 0 1 1 0 0 0 0 0 0 0 0 1 0 0 0 0 0 1 102 3 0 0 44 1 0 1 25 0 0 8 0 0 0 0 0 0 0 0 0 0 0 0 0 0 0 0 0 0 0 0 0 0 0 0 1 0 0 0 0 0 0 0 0 1 0 10 0 0 1 0 0 0 3 2 0 1 0 0 0 0 0 0 0 0 0 4 0 0 21 0 0 0 0 0 0 0 1 0 0 1 0 1 0 0 0 0 0 0 0 0 0 0 0 0 0 0 0 1 0 0 0 0 0 0 0 0 0 0 0 0 1 1 1 0 0 1 1 0 0 0 0 0 0 0 0 0 10 0 0 0 0 0 0 0 0 0 0 0 0 2 0 0 0 0 0 0 0 0 0 0 0 0 0 0 0 0 0 0 0 0 0 0 0 8 4 0 0 0 0 0 0 0 2 0 0 0 0 0 0 0 0 0 0 0 0 0 0 1 0 0 0 0 0 0 0 0 0 0 1 0 0 0 0 2 0 0 7 0 0 2 1 0 0 0 0 0 0 15 0 0 0 0 0 1 17 0 0 0 0 0 0 0 0 0 0 0 0 0 0 0 0 0 0 2 0 0 0 1 0 0 0 0 0 0 0 0 0 0 0 0 2 0 0 0 0 0 0 0 1 0 0 0 0 0 0 26 0 1 3 0 0 0 0 0 0 0 0 0 0 2 0 0 0 0 0 2 2 0 0 0 1 0 0 1 0 0 0 0 0 0 0 0 0 0 0 1 12 3 0 14 1 157 1 0 0 0 0 0 0 0 5 0 0 0 0 9 6 0 0 0 0 68 0 0 0 0 0 0 9 0 0 0 0 0 1 0 0 0 0 0 0 0 2 0 0 0 8 0 0 0 0 3 0 3 7 2 0 4 14 1 0 0 0 0 0 0 0 0 0 1 3 0 0 1 0 10 17 2 2 1 0 0 0 0 0 0 0 5 89 2 0 0 1 9 1 0 0 0 0 0 0 0 0 0 0 0 0 2 5 0 0 1 3 0 2 0 0 0 0 0 0 0 0 0 1 0 0 0 0 0 0 0 0 0 1 0 0 0 0 0 0 0 0 0 0 1 0 0 3 0 0 0 0 1 37 0 0 0 0 7 0 19 0 13 0 0 0 0 0 0 0 0 0 0 0 0 41 7 0 0 0 0 0 0 0 0 0 0 0 0 0 0 0 0 2 0 4 0 0 0 0 3 0 0 0 0 0 0 0 0 0 0 0 2 0 4 0 0 5 0 1 0 0 0 0 0 0 0 0 0 1 0 5 1 0 0 2 0 0 0 0 0 0 4 0 2 4 12 0 9 1 1 32 0 5 1 1 6 2 0 0 1 0 0 2 12 0 0 0 1 0 0 16 0 0 0 0 0 0 0 0 1 0 0 0 0 0 0 0 1 4 0 0 0 0 0 0 0 0 0 0 0 0 0 0 0 0 3 4 0 0 0 0 2 0 1 1 0 1 0 0 1 2 0 2 5 0 0 0 0 0 0 0 0 0 1 6 0 35 0 0 0 0 0 0 0 0 0 0 0 0 0 4 0 0 0 0 0 0 0 0 0 0 0 0 0 0 1 0 0 0 0 0 0 0 0 0 0 0 0 0 0 0 0 0 0 10 2 0 0 1 0 1 0 0 0 1 0 0 0 0 0 0 0 2 0 0 0 0 0 2 0 0 0 0 0 0 0 19 2 0 0 0 1 1 2 0 1 1 0 0 0 0 4 0 0 0 3 0 0 0 0 0 0 0 0 0 0 0 0 1 0 0 0 0 0 153 0 3 0 0 0 0 38 0 0 23 1 0 0 2 7 0 0 19 0 0 0 0 0 0 1 0 1 0 0 1 16 0 0 0 1 0 0 0 0 14 18 0 0 0 0 0 0 0 0 0 0 0 0 0 5 0 0 0 0 0 0 0 0 0 0 0 0 0 0 0 0 1 0 1 0 0 0 0 0 0 3 0 1 0 1 0 0 1 3 5 0 0 4 0 0 2 0 0 0 0 0 0 0 0 1 0 0 0 0 0 2 1 5 1 0 0 3 0 0 0 0 0 0 0 2 1 0 1 0 0 0 0 0 0 8 0 0 0 0 0 0 0 1 3 2 3 0 0 0 1 0 10 2 0 1 0 0 3 0 0 3 0 0 0 1 7 5 0 0 0 0 0 0 0 0 1 0 0 0 0 0 7 2 2 1 9 0 0 2 2 0 1 7 0 0 0 0 0 0 7 0 0 0 0 0 0 0 0 5 1 1 1 3 0 0 0 0 0 0 0 0 0 0 0 0 0 0 1 0 0 0 0 0 0 0 0 2 0 0 0 0 0 2 0 0 11 0 0 0 0 0 0 3 0 0 0 0 0 0 0 0 0 0 3 0 1 0 0 0 0 0 1 0 0 0 0 0 0 0 0 2 0 0 1 0 0 0 1 0 0 0 0 5 1 0 10 1 1 0 0 3 0 0 0 1 2 0 0 1 0 4 2 0 0 0 0 0 0 0 32 0 14 0 0 0 0 0 0 0 11 7 12 1 0 0 0 3 1 0 0 0 0 0 0 0 5 0 1 0 2 0 0 5 1 0 0 0 2 52 4 0 0 0 0 0 0 0 0 0 1 3 0 0 0 5 0 0 0 28 0 0 0 0 0 0 0 0 2 0 0 SP184 Bacteria;Bacteroidetes;Bacteroidia;Bacteroidales;Porphyromonadaceae;Tannerella;serpentiformis 3 0 0 0 0 7 0 0 0 8 0 8 8 1 18 0 1 0 150 59 6 0 2 0 0 1 3 0 0 0 4 0 332 0 104 6 0 137 0 21 0 12 5 0 0 0 2 0 39 7 2 0 0 0 0 0 0 2 0 0 0 18 0 0 22 1 2 0 53 51 0 9 0 1 8 32 0 49 0 2 0 2 0 0 4 0 7 0 0 19 0 0 3 0 0 0 0 0 2 2 2 3 0 0 38 0 1 0 154 1 0 9 4 6 0 0 0 0 2 0 0 1 4 8 1 0 0 1 1 0 0 127 0 8 0 9 697 2 0 74 9 4 488 0 0 0 0 2 206 18 0 0 13 6 1 11 201 0 0 6 0 0 0 0 0 13 0 0 27 1 0 0 2 0 0 0 10 5 0 2 0 0 0 1 0 0 9 0 4 0 0 6 0 0 0 0 0 19 0 3 0 0 131 0 3 0 0 0 3 2 1 0 6 0 3 30 0 1 0 0 0 25 5 0 0 0 136 6 0 5 7 0 1 1 0 108 0 0 0 0 22 0 1 0 23 3 0 1 179 0 1 0 2 0 0 6 0 0 0 0 0 0 0 2 0 0 0 0 0 8 1 0 0 1 2 0 14 0 85 0 9 10 0 16 2 0 0 0 0 0 2 0 0 0 1 0 0 17 0 2 0 0 2 0 0 0 0 0 3 0 0 0 0 0 0 0 0 3 0 0 1 0 0 0 0 0 0 0 0 0 0 0 0 0 0 0 0 0 0 0 0 0 0 4 0 0 0 0 0 0 0 0 0 0 0 0 0 0 0 0 0 2 0 0 0 0 0 0 0 0 0 0 2 1 0 0 0 0 1 2 0 0 17 6 0 0 0 0 0 0 0 0 0 0 0 0 0 0 0 1 1 0 0 0 0 0 0 0 0 0 0 1 0 3 0 0 0 0 0 0 0 0 1 0 0 8 2 2 0 0 0 7 9 1 0 0 0 0 3 0 6 0 0 0 0 0 0 0 0 0 108 0 9 0 0 1 0 0 0 95 75 0 0 2 63 0 0 6 0 0 0 3 0 0 0 0 1 0 0 0 0 0 0 0 11 6 4 4 0 0 0 0 0 11 28 0 0 0 0 1 6 0 0 0 0 0 0 0 0 0 1 1 0 1 0 0 0 0 0 0 0 0 0 0 4 1 0 0 0 0 0 1 2 0 3 0 1 0 0 0 0 0 1 0 0 0 13 5 0 0 4 0 0 0 0 0 0 0 0 5 0 0 1 2 0 2 0 0 0 0 0 0 0 0 0 0 3 0 0 0 0 2 0 0 0 69 10 0 0 0 0 0 0 1 0 1 0 0 0 0 0 1 0 0 0 0 0 0 0 12 0 0 0 1 0 0 7 0 0 0 0 0 0 0 0 0 0 0 1 0 5 0 0 0 2 4 0 0 0 0 0 4 1 42 18 0 0 0 1 0 0 0 0 0 0 0 5 0 0 0 0 0 16 0 0 0 0 0 0 0 0 0 0 7 0 0 0 0 0 0 0 0 0 0 0 0 0 0 0 5 0 0 0 1 0 0 0 0 0 0 0 0 0 0 0 0 0 0 0 0 0 0 0 0 0 0 0 0 0 0 0 0 0 0 0 0 6 0 3 1 0 0 0 0 1 0 0 0 16 0 0 10 14 0 0 0 0 0 5 0 2 0 0 0 0 0 0 0 0 3 6 3 0 0 0 0 19 0 0 2 0 0 1 0 0 0 2 0 0 0 0 0 0 0 0 0 0 0 0 0 0 0 0 0 0 0 7 0 0 0 0 0 0 0 0 0 0 0 0 0 1 0 0 0 0 19 0 0 0 0 0 0 0 0 0 0 0 0 2 0 0 0 0 0 0 0 0 1 0 1 2 0 0 0 0 0 0 0 0 0 0 0 0 0 0 0 0 0 0 0 0 0 0 2 0 0 0 87 0 0 0 0 0 1 1 0 0 0 4 0 0 91 0 0 0 0 0 1 0 2 17 0 0 0 0 0 0 0 0 0 0 0 44 0 0 0 0 0 19 0 0 0 0 0 0 0 0 0 0 0 0 0 0 0 1 0 0 0 0 0 1 0 0 0 0 0 0 1 0 2 14 0 7 0 0 3 3 0 0 0 3 0 8 1 0 0 0 0 0 0 0 1 0 5 0 1 0 0 0 0 0 0 0 11 0 0 11 1 0 6 1 0 0 6 0 6 0 30 53 5 2 0 3 22 0 0 4 0 0 0 0 0 0 0 0 6 0 0 0 0 0 0 0 0 0 0 0 0 0 0 0 0 0 0 0 0 3 1 3 0 6 4 0 0 0 0 0 0 0 0 6 0 0 0 0 0 0 0 0 0 3 0 0 0 0 0 2 3 0 0 71 0 0 0 2 59 0 0 3 0 0 0 0 0 0 61 0 0 15 0 0 1 0 0 0 1 0 0 0 1 0 1 0 0 0 0 0 0 0 0 0 0 1 0 0 0 0 0 0 0 1 0 0 0 0 1 0 0 1 3 0 0 2 1 6 0 9 2 0 5 0 5 0 19 0 0 0 0 0 0 1 0 0 17 5 1 0 1 0 0 36 0 0 0 0 0 0 0 0 0 0 0 0 0 0 0 0 0 0 0 0 0 0 0 0 0 0 0 0 0 0 1 0 0 0 0 0 0 0 0 0 0 0 54 0 0 3 0 0 11 0 0 0 0 0 0 0 3 0 0 0 0 0 1 0 0 0 0 0 0 0 0 0 0 4 0 0 0 0 40 0 4 2 0 31 6 0 0 1 0 0 0 1 0 0 0 0 4 0 0 0 0 0 3 1 0 0 0 0 9 5 0 0 23 0 0 5 15 0 0 0 0 0 0 2 0 0 0 0 0 0 0 0 0 1 0 3 0 1 0 1 1 0 5 0 0 4 0 0 2 18 0 0 0 0 0 1 0 0 3 1 2 0 2 0 0 11 0 0 0 0 0 0 12 0 0 0 0 0 34 3 0 3 12 35 1 0 0 6 0 0 0 20 4 0 0 0 0 0 0 0 0 0 0 0 0 1 0 0 45 0 0 2 0 0 0 0 4 1 0 2 0 0 0 23 0 9 0 1 0 0 1 0 5 466 0 0 0 19 3 0 0 0 0 0 0 0 3 0 0 0 1 0 8 0 0 0 0 0 0 0 0 2 0 1 0 0 1 0 0 1 0 0 1 2 0 0 8 1 0 9 0 0 0 0 1 0 0 0 0 4 1 0 4 0 0 0 0 3 0 3 0 0 0 0 0 0 0 2 2 0 2 2 0 0 2 0 0 0 6 0 123 0 0 0 7 2 0 2 1 0 0 0 0 0 0 1 0 2 0 0 0 1 0 0 2 0 0 13 2 0 0 75 0 12 3 0 0 0 2 5 0 0 0 0 3 0 0 0 4 0 0 3 0 0 0 0 0 0 0 0 0 1 1 0 0 50 0 2 0 0 0 0 0 1 1 0 0 1 1 0 0 0 0 0 2 0 0 0 0 0 25 0 0 7 0 1 0 5 0 0 1 0 0 1 0 0 0 0 0 0 0 0 0 0 0 3 21 0 0 3 2 0 0 5 0 5 2 0 0 2 1 0 0 0 0 0 3 0 0 0 0 0 0 0 0 0 0 6 0 0 0 0 0 2 0 0 0 0 0 0 0 0 68 2 1 0 1 0 1 0 0 0 0 0 10 0 0 2 0 1 5 1 0 0 1 0 73 0 0 2 3 0 0 0 1 0 5 0 0 0 0 0 4 0 0 0 14 4 0 1 0 0 0 0 0 1 14 3 14 0 0 1 0 0 0 0 0 0 0 1 0 0 0 0 0 1 0 0 0 0 0 1 2 0 0 3 0 0 0 65 1 0 0 0 0 0 0 0 0 0 41 4 0 0 2 142 0 9 2 0 0 0 7 0 0 0 0 0 0 0 0 0 0 3 16 0 0 1 3 1 0 0 12 3 0 0 0 0 0 1 0 11 0 58 0 8 0 0 5 51 0 1 1 0 0 0 0 0 1 0 0 0 0 0 0 0 0 0 0 0 0 0 1 0 0 0 0 0 0 0 0 0 0 0 0 4 1 0 1 4 0 1 0 SP187 Bacteria;Firmicutes;Clostridia;Clostridiales;Lachnospiraceae_[XIV];Lachnoanaerobaculum;saburreum 0 26 0 24 1 61 1 1 0 23 52 26 0 1 13 0 0 7 4 1 0 5 4 169 16 15 3 9 0 1 46 0 44 1 62 1 0 90 0 0 95 0 1 19 4 5 3 14 84 3 132 8 1 0 55 0 56 14 1 73 0 0 0 10 0 2 0 277 39 0 12 0 0 0 9 1 199 20 21 3 3 8 4 1 0 16 11 17 2 261 32 2 45 188 6 0 0 1 0 5 2 6 9 3 3 6 101 81 52 5 62 8 5 16 0 1 1 9 16 0 1 4 262 188 0 2 63 1 93 3 0 14 1 14 0 0 134 2 6 0 10 0 129 5 2 42 130 70 0 0 14 0 10 1 0 8 0 5 6 0 3 3 15 3 2 37 2 1 1 1 0 0 0 0 1 0 14 22 0 0 20 0 0 4 2 4 0 0 0 3 0 0 31 0 197 1 1 0 0 0 9 0 8 0 0 42 0 19 28 2 7 0 1 1 14 1 14 136 0 1 4 1 9 1 19 10 16 0 15 179 11 0 38 4 10 0 54 175 3 19 9 0 4 2 42 34 55 1 0 6 271 0 0 1 0 0 0 0 0 0 8 20 1 0 4 1 0 18 0 0 0 0 0 214 117 0 19 24 400 0 85 59 0 299 12 71 69 0 0 54 16 0 0 0 21 6 37 86 0 86 45 0 85 53 1 0 11 0 1 0 2 0 8 0 31 7 0 19 13 3 0 1 109 0 165 0 5 0 0 0 1 28 0 0 0 0 0 0 0 0 0 33 0 2 41 1 0 7 2 0 0 0 0 4 0 0 0 0 0 0 3 0 0 36 0 0 0 0 0 0 37 1 331 0 0 13 1 0 0 10 0 0 19 0 0 0 0 4 0 1 0 0 0 9 0 24 7 0 0 1 0 0 0 51 39 0 0 25 0 0 0 81 0 1 5 0 0 0 179 0 6 13 66 84 0 105 40 0 0 0 0 0 33 75 0 34 25 1 0 0 74 0 0 3 43 21 0 0 9 29 37 34 45 0 36 30 1 12 0 24 0 0 0 0 0 9 0 137 0 0 26 3 0 0 0 0 127 15 111 25 5 15 10 81 40 101 0 24 0 31 40 0 36 35 1 0 4 0 0 12 125 0 0 0 0 0 5 0 1 4 5 31 0 0 0 0 2 23 0 0 0 21 0 0 57 64 0 0 0 3 0 0 0 0 0 0 0 3 0 2 0 37 103 5 0 0 0 168 0 3 125 12 0 0 0 0 0 1 0 36 0 201 0 117 106 72 0 0 0 50 7 0 0 4 0 0 0 0 0 0 0 3 0 0 122 0 7 0 0 0 56 0 209 0 0 316 0 51 0 0 0 0 0 249 0 0 0 0 0 0 0 0 0 0 0 2 16 0 5 0 0 6 1 0 0 55 0 0 0 1 105 11 3 0 8 0 324 0 13 37 0 11 4 57 1 0 0 19 7 43 39 0 0 3 0 208 81 0 0 263 29 0 75 108 4 4 80 0 0 0 0 0 0 3 0 0 0 0 26 0 0 0 100 0 0 2 12 1 1 7 0 0 0 126 0 0 0 0 0 0 0 1 41 33 0 0 80 0 210 101 0 0 141 116 0 2 0 0 0 84 0 1 58 0 0 48 1 7 46 3 210 92 0 27 0 22 4 16 23 6 0 13 12 0 0 0 0 0 0 0 0 0 0 0 28 32 0 3 0 54 1 18 0 0 2 0 1 25 0 145 6 0 71 10 0 3 186 0 32 61 38 0 0 65 27 0 170 0 0 0 0 0 1 33 0 19 38 0 0 0 0 0 2 0 0 0 0 0 203 0 0 0 0 0 0 0 0 0 0 1 14 118 0 0 0 0 0 3 1 0 0 0 0 0 0 0 0 0 0 2 0 1 38 0 6 6 0 0 53 0 0 63 1 0 1 3 0 143 5 0 0 0 5 74 0 0 8 0 5 0 73 2 0 8 154 0 5 0 0 0 6 176 0 88 346 0 0 0 14 0 322 0 0 0 2 0 7 0 121 2 20 0 78 0 12 0 0 0 0 0 0 0 0 0 0 0 0 99 0 0 1 7 0 0 2 1 0 0 0 0 0 0 108 225 0 149 0 117 104 76 242 3 5 15 0 5 28 1 74 4 48 0 140 69 0 9 34 0 12 0 0 39 0 80 1 5 0 0 25 0 222 123 0 72 81 0 94 48 272 84 0 0 15 49 0 71 0 64 0 40 0 0 35 44 1 3 0 0 154 0 2 19 0 2 1 137 0 0 0 0 0 6 0 0 0 0 0 0 0 0 4 31 0 65 73 0 10 2 30 0 0 12 0 7 5 0 12 0 7 0 1 0 0 0 20 0 11 21 5 0 0 1 0 26 0 0 3 4 0 1 1 0 2 0 19 73 0 0 0 0 11 5 0 0 0 56 0 0 9 0 0 0 0 0 1 0 0 0 14 17 0 15 1 0 0 0 0 0 0 3 0 0 7 0 0 1 0 0 0 0 0 0 0 0 0 11 0 0 1 38 0 1 74 1 0 0 4 0 0 0 0 0 0 6 0 0 10 5 0 8 0 0 0 0 0 0 0 46 0 0 21 1 0 0 0 0 16 0 0 0 0 1 0 0 3 0 0 0 0 1 0 13 0 0 3 0 0 0 2 0 0 0 0 0 0 0 0 0 0 3 37 0 16 0 5 0 0 5 0 10 4 0 11 59 0 0 0 19 3 0 31 5 0 4 0 0 2 0 0 0 0 10 17 0 6 21 0 3 3 69 0 8 10 0 67 13 0 11 31 0 0 0 7 0 0 0 0 3 0 0 0 1 0 0 30 0 4 1 0 3 0 0 0 1 1 0 3 17 0 0 0 0 0 0 3 0 26 11 0 0 0 0 0 0 12 0 4 8 0 0 0 3 0 19 1 0 8 0 0 0 0 5 0 0 0 0 0 0 0 0 0 0 0 4 2 0 0 3 0 0 0 0 7 0 0 6 1 0 0 3 0 0 0 2 72 12 0 0 107 0 3 0 82 21 0 0 0 1 0 0 0 0 0 0 0 0 0 0 0 4 0 0 5 0 12 3 0 0 5 0 0 1 0 0 34 0 9 0 96 0 0 0 0 0 265 0 0 0 2 9 0 5 10 0 0 12 19 7 0 0 16 0 0 3 1 0 0 0 0 0 0 0 15 0 100 3 0 11 0 0 0 18 0 5 10 0 0 1 0 0 0 13 0 0 0 13 0 2 0 0 74 2 0 29 1 0 0 0 7 0 8 33 0 1 0 0 2 2 0 0 0 16 109 14 0 2 12 0 1 4 0 217 3 12 0 0 0 0 0 0 0 7 6 0 0 0 0 0 1 220 0 0 178 0 0 2 4 0 0 0 0 6 2 0 0 112 3 0 0 23 1 0 0 0 0 5 0 0 0 16 0 0 0 16 0 62 0 0 0 12 2 0 17 2 0 65 61 0 0 0 7 0 1 0 0 0 0 0 0 0 0 53 0 8 0 9 0 0 2 0 18 65 0 0 3 1 0 0 40 0 0 0 0 0 0 0 32 67 23 0 5 4 0 1 53 0 68 11 42 0 5 29 0 0 33 0 46 8 0 0 6 4 0 0 0 0 0 1 2 0 15 0 0 5 6 0 0 4 28 0 0 0 0 3 18 0 0 1 1 0 2 2 0 16 0 0 0 22 0 0 0 0 31 0 6 4 0 0 0 0 2 3 0 0 1 0 0 0 0 0 1 0 0 0 44 2 0 3 7 0 3 4 0 14 0 0 0 23 0 0 0 0 0 0 0 0 16 1 0 0 0 1 0 0 1 0 0 2 0 0 1 0 0 0 0 0 1 0 0 0 0 1 0 1 0 0 0 0 0 12 48 0 0 6 10 0 19 33 9 0 1 30 7 0 0 0 0 0 31 2 0 9 4 5 26 0 0 0 0 0 0 27 0 0 13 129 0 3 3 0 14 0 0 40 46 22 6 0 0 11 27 1 17 7 20 0 1 0 0 13 3 0 0 0 16 0 48 4 0 11 68 0 0 3 0 0 0 0 0 0 0 0 0 0 1 0 0 0 0 0 3 0 0 0 14 0 0 0 0 0 0 2 0 0 SP19 Bacteria;Bacteroidetes;Flavobacteriia;Flavobacteriales;Flavobacteriaceae;Bergeyella;sp. HMT900 0 7 8 1 0 4 3 0 0 2 0 28 31 3 22 6 17 17 10 6 0 0 8 287 7 1 10 0 18 63 1 0 76 20 9 6 2 73 1 2 0 10 4 0 1 9 19 1 27 1 6 4 0 52 1 0 5 5 2 1 1 15 4 0 12 1 17 0 80 13 0 25 20 1 4 6 5 0 1 42 57 0 0 2 1 0 1 4 4 13 18 0 21 29 2 7 40 2 17 1 4 11 2 0 54 1 0 18 7 41 0 30 1 16 2 0 2 2 4 3 1 1 0 4 0 1 0 0 3 91 1 39 0 1 0 1 0 3 2 0 7 2 10 11 7 2 9 8 8 1 1 4 69 10 2 2 6 0 9 0 5 0 0 6 1 1 4 1 1 2 0 1 4 26 2 2 0 0 0 2 0 0 4 2 0 1 0 1 0 1 0 3 0 2 3 3 0 0 4 9 7 2 18 0 0 0 1 5 5 79 1 0 2 3 0 4 5 2 0 1 0 11 10 29 1 1 4 17 15 2 6 12 11 3 5 0 4 0 6 29 33 0 0 3 0 4 1 0 0 0 1 3 1 0 0 7 8 0 0 3 6 1 1 22 7 1 0 24 0 33 0 0 0 0 2 0 0 0 40 2 20 7 36 22 1 0 2 0 0 20 5 0 20 0 5 24 6 35 0 5 0 3 6 1 1 0 1 0 4 0 1 0 0 0 0 0 0 2 0 0 0 0 10 0 0 8 0 0 0 0 0 11 0 0 0 0 0 0 0 0 0 0 0 2 0 0 0 0 0 0 0 0 0 0 0 0 0 0 0 0 0 0 0 1 0 0 0 0 138 0 2 0 43 0 2 0 0 0 0 2 0 0 15 13 0 0 53 4 0 2 0 0 0 1 0 4 1 0 0 0 0 1 0 12 81 2 2 0 1 0 0 0 0 2 0 14 0 0 0 0 0 2 0 0 0 0 0 0 0 0 0 22 3 16 0 1 20 0 0 0 4 0 0 0 0 0 0 0 34 0 0 0 17 14 0 0 0 9 0 1 16 4 0 2 0 1 0 6 4 0 0 8 0 0 0 0 1 1 3 1 5 0 0 4 13 17 9 4 211 3 8 2 8 72 32 1 0 1 0 1 43 7 0 0 66 0 0 0 1 5 0 0 0 0 0 0 0 1 0 0 0 16 1 0 0 0 0 0 0 22 0 107 34 3 4 0 2 0 0 0 0 18 28 2 0 2 6 1 15 0 3 0 1 0 0 0 0 0 0 23 0 37 0 15 0 0 0 0 0 1 0 0 0 3 15 0 30 0 0 0 0 2 3 0 0 1 0 0 10 0 0 0 0 0 0 0 0 0 0 29 0 0 0 100 0 0 0 0 0 0 2 0 0 0 0 5 0 0 0 0 0 0 2 7 3 1 37 0 0 11 37 0 0 67 15 20 23 0 0 0 0 1 2 0 1 0 0 27 4 4 2 0 9 0 0 0 2 0 0 20 0 0 14 5 2 1 1 0 0 0 0 0 0 54 0 0 0 0 0 0 0 4 44 0 0 0 0 2 0 2 2 0 0 0 0 26 0 0 5 3 5 17 0 6 0 1 7 0 2 0 3 0 6 0 0 0 0 0 0 0 0 0 17 1 0 0 2 2 2 0 1 0 15 0 11 0 0 0 2 2 19 5 16 0 1 0 4 1 5 1 4 0 1 0 16 0 4 7 0 8 1 1 3 3 11 0 4 3 0 12 37 2 17 0 0 0 1 0 2 1 0 0 0 4 0 0 2 0 0 0 0 1 2 0 0 5 1 0 9 0 0 0 0 31 0 0 0 1 3 0 0 0 0 0 0 4 0 0 0 0 0 5 0 3 0 0 1 1 6 0 0 0 0 0 0 1 14 15 0 0 1 1 2 0 0 0 0 0 0 0 0 3 0 0 53 0 0 0 0 0 0 0 0 0 1 0 0 7 6 31 0 0 0 0 0 0 0 0 30 8 0 0 28 6 23 0 0 0 145 33 0 0 0 0 0 0 1 0 0 0 3 0 1 7 0 0 2 8 99 4 6 13 0 2 2 1 0 0 0 0 1 0 0 27 0 0 0 38 0 8 21 8 12 29 0 0 0 4 0 0 6 0 6 0 0 6 3 0 21 0 1 46 0 21 0 2 13 0 16 0 0 2 0 18 0 0 0 1 4 7 0 2 0 18 20 0 30 1 0 11 0 0 1 2 0 16 0 14 0 17 5 1 0 4 0 0 0 0 1 0 1 6 7 0 0 19 0 0 0 0 0 0 0 0 11 0 0 0 0 0 0 0 0 0 1 0 0 0 14 0 1 1 0 1 8 0 6 2 17 0 31 1 0 0 0 0 0 0 17 0 1 2 0 0 0 0 1 10 0 6 1 1 5 0 2 2 1 0 1 0 0 10 0 0 37 39 2 0 9 0 0 39 0 0 3 7 6 0 3 3 0 0 6 0 0 0 16 1 0 1 0 0 0 1 0 3 0 0 0 0 0 0 0 0 0 0 0 0 3 2 13 0 83 2 2 0 2 2 0 1 0 0 3 38 1 0 19 0 0 0 0 0 0 0 33 0 0 118 1 0 21 0 0 0 0 0 0 0 20 0 0 0 1 0 1 1 0 0 0 4 0 0 1 2 8 0 0 0 0 0 0 201 0 0 79 1 1 0 0 2 0 0 6 10 0 0 3 3 0 0 0 0 2 0 0 0 0 4 5 0 11 1 0 0 0 0 0 0 0 0 0 15 13 0 2 12 0 1 2 20 0 7 4 0 24 17 0 0 2 0 0 1 3 0 1 0 0 14 7 2 0 0 0 2 0 2 3 1 0 6 3 0 0 17 1 0 28 22 0 1 1 0 0 3 2 0 18 2 0 12 4 1 0 0 0 0 0 0 0 0 11 2 0 5 1 0 12 0 0 3 18 0 0 1 2 1 86 11 0 13 15 0 0 0 2 0 1 0 1 0 2 0 0 1 0 3 0 0 0 16 0 0 147 14 42 8 0 0 19 0 3 0 56 7 3 11 0 0 0 0 0 0 0 1 5 0 3 0 0 7 0 0 1 0 3 1 0 3 7 0 3 0 0 0 2 8 4 3 19 1 0 2 0 0 0 0 0 0 0 0 0 1 1 0 0 0 0 2 1 0 0 0 0 21 0 0 0 0 0 0 0 0 4 0 53 3 0 10 0 0 37 3 0 2 1 0 0 0 0 0 39 24 0 0 1 5 0 0 0 0 7 0 0 23 1 0 0 0 6 0 0 3 0 0 2 0 0 0 15 0 0 0 0 0 0 2 0 0 0 6 0 26 8 0 0 0 0 0 1 3 0 0 10 3 0 6 0 0 0 0 0 0 0 0 0 1 3 0 0 3 1 16 1 0 17 2 0 0 0 2 0 0 0 0 0 5 3 0 1 1 0 0 2 1 0 0 3 0 0 0 0 0 1 0 0 4 35 9 25 0 5 0 0 0 5 0 0 0 3 0 0 13 0 39 0 1 0 0 15 1 0 5 0 0 4 0 0 0 32 0 0 4 3 0 11 3 0 2 39 0 0 1 0 0 0 0 6 15 0 0 25 0 0 4 1 0 35 0 1 0 2 35 0 0 0 0 0 2 0 1 12 2 0 1 1 0 0 0 1 0 0 0 0 7 4 0 0 1 2 0 0 0 0 15 69 6 0 10 10 1 1 0 0 0 3 6 0 0 8 0 2 0 4 0 1 0 0 4 0 0 3 0 1 1 83 42 0 23 1 0 1 14 0 0 0 0 0 2 1 0 0 0 0 0 1 0 1 0 3 0 1 0 0 0 39 3 0 4 0 2 31 0 0 0 0 0 0 0 0 0 0 11 0 0 1 0 20 2 11 22 1 0 0 15 4 0 0 2 1 0 0 14 67 10 1 0 171 0 0 0 0 2 1 3 0 0 0 0 0 1 0 0 2 0 3 0 0 0 2 2 4 0 0 15 6 0 0 1 0 3 1 0 5 2 10 0 12 7 0 0 16 0 10 0 0 0 0 0 0 3 1 0 0 0 12 0 5 4 0 0 0 0 0 1 3 44 7 5 0 0 0 0 0 0 0 0 6 0 0 2 0 0 1 0 SP190 Bacteria;Bacteroidetes;Bacteroidia;Bacteroidales;Prevotellaceae;Alloprevotella;rava 2 0 0 0 0 0 0 0 0 0 36 0 0 0 0 0 0 0 3 32 0 0 2 0 0 0 0 0 0 0 0 0 0 28 0 0 0 0 0 0 4 0 0 0 0 0 0 0 0 0 55 2 0 0 0 0 21 2 0 4 0 0 0 0 583 1 0 737 6 0 0 0 0 0 0 0 11 0 0 0 0 17 0 0 76 1 1 0 0 1067 0 0 0 1 0 0 0 0 0 0 0 0 0 0 0 0 110 0 0 0 0 0 3 7 12 0 62 0 717 0 0 1 0 0 29 0 49 1314 0 0 7 1 0 0 2 0 90 0 0 0 0 0 0 0 0 5 42 19 0 0 0 0 0 0 0 0 66 0 0 0 0 0 0 0 0 0 0 0 0 0 0 0 0 3 0 0 0 0 0 0 0 0 0 0 0 0 0 0 0 9 0 0 3 0 0 0 0 0 0 1 0 2 336 0 5 13 0 0 0 0 0 0 0 0 0 0 0 3 0 0 6 0 0 0 0 0 3 0 0 606 0 0 0 0 0 15 0 4 0 2 0 0 0 0 0 2 4 0 0 0 1658 0 0 0 0 0 0 0 0 4 0 0 0 0 0 0 0 0 0 0 0 0 0 0 0 0 1 0 0 0 1 0 0 0 0 0 0 0 0 0 0 0 0 0 0 0 0 0 0 0 0 0 3 0 0 0 3 0 0 0 0 0 0 0 0 0 0 0 0 0 0 0 0 0 0 0 0 0 0 0 0 0 0 0 0 0 0 0 0 0 0 0 0 0 0 0 0 0 0 0 0 0 0 0 0 0 0 0 0 0 0 0 0 0 0 0 0 0 0 0 0 0 0 0 0 0 0 0 0 1 0 0 0 0 0 0 0 10 0 0 0 0 0 0 0 0 0 0 0 0 0 0 0 0 0 0 0 0 0 0 0 0 0 0 0 0 0 0 0 0 0 0 2 0 0 0 0 0 0 0 0 0 1 0 0 0 0 0 0 0 4 0 0 0 0 0 0 0 0 0 0 0 0 0 0 0 0 0 0 0 0 0 0 0 0 0 0 0 0 0 0 0 0 0 0 0 0 0 0 0 0 0 0 0 0 0 0 0 0 0 0 0 0 0 0 0 0 0 0 0 10 0 0 0 0 0 0 0 0 0 0 0 0 0 0 0 0 0 0 0 0 0 0 0 0 0 0 0 0 0 0 0 0 0 0 0 0 0 0 2 0 0 0 0 0 0 1 14 0 0 0 0 0 0 0 0 0 0 0 0 0 3 0 1 0 2 0 0 0 0 1 0 0 0 0 0 0 0 0 0 0 0 0 0 0 0 0 0 0 0 0 0 0 0 0 0 0 0 0 0 0 0 0 0 0 0 0 0 0 0 0 0 0 0 0 0 0 0 0 0 0 0 0 0 0 0 0 0 0 0 0 0 0 0 0 0 0 0 0 0 0 1 0 0 0 0 0 0 0 0 0 0 0 0 0 0 0 0 0 0 0 0 0 0 0 0 0 0 0 0 0 0 0 0 0 0 0 0 0 0 0 0 0 0 0 0 0 0 0 0 0 0 0 0 0 0 0 0 0 0 0 0 0 0 0 0 0 0 0 0 0 0 0 0 0 0 0 0 0 0 0 0 0 0 0 0 0 0 0 0 0 0 0 0 0 0 0 0 0 0 0 0 8 0 0 0 0 0 0 0 0 0 0 0 0 0 0 0 0 0 0 0 0 0 0 0 0 0 0 0 0 0 0 0 1 0 0 0 6 2 0 0 0 0 0 0 0 0 0 0 11 0 0 0 0 0 0 0 0 0 0 0 0 0 0 0 0 0 0 0 0 0 0 0 0 0 0 0 0 0 0 2 0 0 0 0 0 0 0 0 0 0 0 0 0 0 0 0 0 0 0 0 0 0 0 0 0 0 0 0 0 0 0 0 0 0 0 0 0 0 0 0 0 0 0 0 0 0 0 0 0 0 0 0 1 0 0 0 0 0 0 0 0 0 0 0 0 0 0 0 0 0 0 0 0 0 0 0 0 0 0 0 0 0 0 1 0 0 0 0 0 0 0 0 0 0 0 0 0 0 0 0 0 0 0 0 0 0 0 0 0 0 0 0 0 0 0 0 0 0 0 0 0 0 0 0 3 0 0 0 0 0 0 0 0 0 0 0 0 0 0 0 0 0 0 0 0 0 0 0 0 0 0 0 0 0 0 0 0 0 0 0 0 0 0 0 0 0 0 0 0 0 1 4 0 0 0 0 0 0 0 0 0 0 0 0 0 0 0 0 0 0 0 0 0 0 0 0 0 0 0 0 0 0 0 0 0 0 2 0 1 2 0 0 4 0 0 0 3 0 0 0 0 0 0 0 0 0 0 0 0 0 0 0 0 7 0 5 0 0 0 0 1 0 0 1 0 0 0 0 0 0 0 0 0 0 0 0 0 0 0 0 0 0 0 19 0 0 0 1 0 0 0 0 0 0 0 0 0 0 0 0 0 0 0 0 0 0 0 0 1 0 0 0 0 0 17 0 0 0 0 0 0 0 0 0 0 0 0 0 0 0 0 0 0 0 0 0 0 0 0 0 0 0 1 0 0 0 0 0 1 0 0 0 45 0 0 0 0 0 0 0 1 0 0 0 0 0 0 0 0 0 0 0 0 0 0 0 0 0 0 3 2 0 0 1 0 0 0 0 0 0 0 0 0 0 2 0 0 1 0 0 0 0 0 1 0 0 0 0 0 0 0 0 0 0 0 4 0 0 2 0 0 0 0 0 25 0 0 0 0 2 0 0 0 6 1 0 0 0 0 3 0 0 0 0 0 1 0 0 0 1 1 6 0 0 1 0 0 0 0 0 0 2 0 0 0 0 0 0 0 0 0 0 1 0 0 0 0 3 0 0 0 0 4 0 12 0 1 0 4 0 0 4 0 0 0 0 0 0 0 1 0 0 0 0 0 0 0 0 0 0 0 0 0 0 1 0 0 0 0 0 0 0 0 0 2 0 0 0 1 0 0 0 0 0 0 0 3 0 33 0 0 0 0 0 0 0 0 0 0 0 0 0 0 0 0 0 0 0 0 0 0 0 2 0 15 0 1 0 0 0 0 0 4 0 0 0 0 0 0 1 0 6 0 0 0 0 0 0 0 0 0 0 0 8 0 0 0 1 1 0 0 0 0 0 0 0 0 0 0 0 1 0 40 2 0 0 0 0 0 0 0 0 0 0 0 2 0 0 0 0 0 0 0 1 0 0 0 0 0 0 0 0 0 0 0 0 7 0 0 0 0 0 0 0 0 0 0 0 0 0 0 0 0 0 0 0 0 0 0 1 0 1 0 1 0 0 0 0 0 0 0 0 0 0 0 0 0 0 0 0 0 0 0 0 0 0 0 0 0 0 0 5 0 0 0 0 0 1 0 0 0 0 0 0 0 0 0 0 0 0 0 0 0 1 0 0 0 0 0 0 0 0 0 0 0 0 2 0 0 0 0 0 5 0 0 0 0 1 0 0 0 0 0 1 0 0 0 0 0 0 0 0 0 0 0 0 11 0 0 3 0 1 17 0 0 0 0 0 0 1 1 30 0 0 1 0 0 0 0 0 0 0 0 0 0 0 0 0 1 0 0 0 0 0 0 0 0 0 0 0 0 11 0 1 0 0 0 0 1 0 4 4 1 0 0 0 0 0 0 0 0 0 0 0 0 4 0 0 0 0 0 0 0 0 1 0 0 0 2 0 0 0 0 0 0 0 0 0 0 104 0 0 10 0 0 0 0 0 0 0 0 0 0 0 0 0 0 0 2 0 1 0 0 0 0 0 0 0 0 0 0 0 0 0 6 16 0 0 0 0 0 0 0 0 0 0 0 0 0 0 3 0 0 0 0 1 0 0 0 9 0 0 0 0 1 0 2 62 0 37 0 0 141 5 0 0 7 38 0 3 0 0 0 0 0 0 0 0 0 0 0 0 0 0 0 0 0 0 0 0 0 0 5 0 0 0 0 1 0 0 0 0 0 0 0 0 0 0 0 0 0 0 0 0 0 2 0 0 0 0 4 0 0 0 7 3 0 0 0 0 0 2 0 1 0 0 0 1 0 0 0 0 0 0 0 0 0 0 0 0 0 0 SP191 Bacteria;Firmicutes;Bacilli;Lactobacillales;Streptococcaceae;Streptococcus;sp. HMT423 4220 415 1118 778 10 575 15174 1013 1298 2172 281 713 716 461 5199 420 342 5798 155 101 347 2675 2129 26937 674 606 3518 55 996 1320 2397 637 4717 102 182 496 172 880 196 1007 883 1797 2481 407 2656 64 1869 1375 1469 3175 217 24 81 380 1049 128 218 1921 8827 2994 387 568 855 213 101 734 520 1285 9518 455 3212 134 380 535 1898 122 242 384 3206 788 3692 350 3908 875 4513 9393 521 892 804 1222 1494 207 496 634 352 3086 5080 130 569 1157 1671 1371 1766 4577 251 1473 2074 217 236 1265 11136 1459 720 423 208 381 387 871 1159 920 274 199 283 718 372 1852 273 929 270 4089 1523 372 604 1965 3288 4724 3270 324 347 349 998 1166 7480 2390 3493 405 1810 4575 485 7128 988 968 458 1353 351 2985 204 762 458 570 1285 24224 173 104 298 2041 2692 2322 940 2098 165 1984 1805 860 222 722 2067 1894 396 727 149 159 1102 1728 101 1907 147 658 2 541 815 956 122 1356 97 4992 39 703 1370 182 2072 773 516 392 126 57 6790 57633 3937 6450 224 885 1326 229 1656 691 904 1037 417 251 1271 145 2100 3688 298 741 479 4534 16462 119 1365 1720 1197 578 535 65 1597 1450 399 5486 4222 670 264 655 6768 1081 57 471 585 716 208 3734 1147 15 27 1548 8901 762 852 432 1775 29 1746 660 4329 304 526 2017 0 0 0 0 0 0 0 0 0 0 0 0 0 0 0 0 0 0 0 0 0 0 0 0 0 0 0 0 0 0 0 0 0 0 0 0 0 0 0 0 0 0 0 0 0 0 0 0 0 0 0 0 0 0 0 0 0 0 0 0 0 0 0 0 0 0 0 0 0 0 0 0 0 0 0 0 0 0 0 0 0 0 0 0 0 0 0 0 0 0 0 0 0 0 0 0 0 0 0 0 0 0 0 0 0 0 0 0 0 0 0 0 0 0 0 0 0 0 0 0 0 0 0 0 0 0 0 0 0 0 0 0 0 0 0 0 0 0 0 0 0 0 0 0 0 0 0 0 0 0 0 0 0 0 0 0 0 0 0 0 0 0 0 0 0 0 0 0 0 0 0 0 0 0 0 0 0 0 0 0 0 0 0 0 0 0 0 0 0 0 0 0 0 0 0 0 0 0 0 0 0 0 0 0 0 0 0 0 0 0 0 0 0 0 0 0 0 0 0 0 0 0 0 0 0 0 0 0 0 0 0 0 0 0 0 0 0 0 0 0 0 0 0 0 0 0 0 0 0 0 0 0 0 0 0 0 0 0 0 0 0 0 0 0 0 0 0 0 0 0 0 0 0 0 0 0 0 0 0 0 0 0 0 0 0 0 0 0 0 0 0 0 0 0 0 0 0 0 0 0 0 0 0 0 0 0 0 0 0 0 0 0 0 0 0 0 0 0 0 0 0 0 0 0 0 0 0 0 0 0 0 0 0 0 0 0 0 0 0 0 0 0 0 0 0 0 0 0 0 0 0 0 0 0 0 0 0 0 0 0 0 0 0 0 0 0 0 0 0 0 0 0 0 0 0 0 0 0 0 0 0 0 0 0 0 0 0 0 0 0 0 0 0 0 0 0 0 0 0 0 0 0 0 0 0 0 0 0 0 0 0 0 0 0 0 0 0 0 0 0 0 0 0 0 0 0 0 0 0 0 0 0 0 0 0 0 0 0 0 0 0 0 0 0 0 0 0 0 0 0 0 0 0 0 0 0 0 0 0 0 0 0 0 0 0 0 0 0 0 0 0 0 0 0 0 0 0 0 0 0 0 0 0 0 0 0 0 0 0 0 0 0 0 0 0 0 0 0 0 0 0 0 0 0 0 0 0 0 0 0 0 0 0 0 0 0 0 0 0 0 0 0 0 0 0 0 0 0 0 0 0 0 0 0 0 0 0 0 0 0 0 0 0 0 0 0 0 0 0 0 0 0 0 0 0 0 0 0 0 0 0 0 0 0 0 0 0 0 0 0 0 0 0 0 0 0 0 0 0 0 0 0 0 0 0 0 0 0 0 0 0 0 0 0 0 0 0 0 0 0 0 0 0 0 0 0 0 0 0 0 0 0 0 0 0 0 0 0 0 0 0 0 0 0 0 0 0 0 0 0 0 0 0 0 0 0 0 0 0 0 0 0 0 0 0 0 0 0 0 0 0 0 0 0 0 0 0 0 0 0 0 0 0 0 0 0 0 0 0 0 0 0 0 0 0 0 0 0 0 0 0 0 0 0 0 0 0 0 0 0 0 0 0 0 0 0 0 0 0 0 0 0 0 0 0 0 0 0 0 0 0 0 0 0 0 0 0 0 0 0 0 0 0 0 0 0 0 0 0 0 0 0 0 0 0 0 0 0 0 0 0 0 0 0 0 0 0 0 0 0 0 0 0 0 0 0 0 0 0 0 0 0 0 0 0 0 0 0 0 0 0 0 0 0 0 0 0 0 0 0 0 0 0 0 0 0 0 0 0 0 0 0 0 0 0 0 0 0 0 0 0 0 0 0 0 0 0 0 0 0 0 0 0 0 0 0 0 0 0 0 0 0 0 0 0 0 0 0 0 0 0 0 0 0 0 0 0 0 0 0 0 0 0 0 0 0 0 0 0 0 0 0 0 0 0 0 0 0 0 0 0 0 0 0 0 0 0 0 0 0 0 0 0 0 0 0 0 0 0 0 0 0 0 0 0 0 0 0 0 0 0 0 0 0 0 0 0 0 0 0 0 0 0 0 0 0 0 0 0 0 0 0 0 0 0 0 0 0 0 0 0 0 0 0 0 0 0 0 0 0 0 0 0 0 0 0 0 0 0 0 0 0 0 0 0 0 0 0 0 0 0 0 0 0 0 0 0 0 0 0 0 0 0 0 0 0 0 0 0 0 0 0 0 0 0 0 0 0 0 0 0 0 0 0 0 0 0 0 0 0 0 0 0 0 0 0 0 0 0 0 0 0 0 0 0 0 0 0 0 0 0 0 0 0 0 0 0 0 0 0 0 0 0 0 0 0 0 0 0 0 0 0 0 0 0 0 0 0 0 0 0 0 0 0 0 0 0 0 0 0 0 0 0 0 0 0 0 0 0 0 0 0 0 0 0 0 0 0 0 0 0 0 0 0 0 0 0 0 0 0 0 0 0 0 0 0 0 0 0 0 0 0 0 0 0 0 0 0 0 0 0 0 0 0 0 0 0 0 0 0 0 0 0 0 0 0 0 0 0 0 0 0 0 0 0 0 0 0 0 0 0 0 0 0 0 0 0 0 0 0 0 0 0 0 0 0 0 0 0 0 0 0 0 0 0 0 0 0 0 0 0 0 0 0 0 0 0 0 0 0 0 0 0 0 0 0 0 0 0 0 0 0 0 0 0 0 0 0 0 0 0 0 0 0 0 0 0 0 0 0 0 0 0 0 0 0 0 0 0 0 0 0 0 0 0 0 0 0 0 0 0 0 0 0 0 0 0 0 0 0 0 0 0 0 0 0 0 0 0 0 0 0 0 0 0 0 0 0 0 0 0 0 0 0 0 0 0 0 0 0 0 0 0 0 0 0 0 0 0 0 0 0 0 0 0 0 0 0 0 0 0 0 0 0 0 0 0 0 0 0 0 0 0 0 0 0 0 0 0 0 0 0 0 0 0 0 0 0 0 0 0 0 0 0 0 0 0 0 0 0 0 0 0 0 0 0 0 0 0 0 0 0 0 0 0 0 0 0 0 0 0 0 0 0 0 0 0 0 0 0 0 0 0 0 0 0 0 0 0 0 0 0 0 0 0 0 0 0 0 0 0 0 0 0 0 0 0 0 0 0 0 0 0 0 0 0 0 0 0 0 0 0 0 0 0 0 0 0 0 0 0 0 0 0 0 0 0 0 0 0 0 0 0 0 0 0 0 0 0 0 0 0 0 0 0 0 0 0 0 0 0 0 0 0 0 0 0 0 0 0 0 0 0 0 0 0 0 0 0 0 0 0 0 0 0 0 0 0 0 0 0 0 0 0 0 0 0 0 0 0 0 0 0 0 0 0 0 0 0 0 0 0 0 0 0 0 0 0 0 0 0 0 0 0 0 0 0 0 0 0 0 0 0 0 0 0 0 0 0 0 0 0 0 0 0 0 0 0 0 0 0 0 0 0 0 0 0 0 0 0 0 0 0 0 0 0 0 0 0 0 0 0 0 0 0 0 0 0 0 0 0 0 0 0 0 0 SP192 Bacteria;Firmicutes;Bacilli;Lactobacillales;Streptococcaceae;Streptococcus;salivarius 4094 5840 4697 25758 3662 3648 1564 2176 668 13467 14027 1934 2436 622 206 17915 4842 2904 1476 4113 12295 2574 4501 5040 13981 15016 1456 20438 854 507 1558 6947 201 11189 8430 6825 12843 921 8007 1259 510 290 438 9882 7500 706 3473 21077 10496 3632 34761 13921 14751 2942 4329 6563 21447 6886 206 8361 6424 733 4535 17 5365 539 747 4623 584 571 10812 1474 2338 22070 25568 228 13240 12567 58 3304 4111 2062 7435 3950 2427 9115 8307 13486 3642 3692 36 20231 189 568 8118 386 19 685 510 28567 18689 4327 3042 6802 888 729 2711 271 3337 2028 3917 2130 25827 3049 3769 1446 4180 2876 2485 1482 14886 10303 29319 2283 3390 8968 6252 3632 3154 908 1863 245 21648 8262 2960 166 6826 25276 407 2189 3725 134 7679 5540 604 4772 6068 1255 6411 1267 17559 10009 4247 18917 3169 21275 7789 7479 14679 17033 1454 166 2213 1371 1409 5135 1496 4000 928 4426 103 2922 8978 3305 22399 20520 6704 6039 348 2344 41952 6097 2390 6437 19730 14730 10112 3004 2 6737 1930 2058 12454 7323 7306 13722 7313 9114 4532 2639 55 812 9924 1357 3875 37582 214 222 973 2 7454 5235 6029 7533 2980 1652 633 21324 132 4450 2426 3446 1879 3085 14608 2892 1927 1529 1171 6049 15838 155 4621 2157 1902 1391 7359 7088 1558 1091 74 594 319 1083 233 5264 3468 1229 11114 18083 7899 206 913 3458 11301 9753 2965 2334 14326 1270 8075 7978 2208 5710 5343 13162 7488 6792 0 0 0 0 0 0 0 0 0 0 0 0 0 0 0 0 0 0 0 0 0 0 0 0 0 0 0 0 0 0 0 0 0 0 0 0 0 0 0 0 0 0 0 0 0 0 0 0 0 0 0 0 0 0 0 0 0 0 0 0 0 0 0 0 0 0 0 0 0 0 0 0 0 0 0 0 0 0 0 0 0 0 0 0 0 0 0 0 0 0 0 0 0 0 0 0 0 0 0 0 0 0 0 0 0 0 0 0 0 0 0 0 0 0 0 0 0 0 0 0 0 0 0 0 0 0 0 0 0 0 0 0 0 0 0 0 0 0 0 0 0 0 0 0 0 0 0 0 0 0 0 0 0 0 0 0 0 0 0 0 0 0 0 0 0 0 0 0 0 0 0 0 0 0 0 0 0 0 0 0 0 0 0 0 0 0 0 0 0 0 0 0 0 0 0 0 0 0 0 0 0 0 0 0 0 0 0 0 0 0 0 0 0 0 0 0 0 0 0 0 0 0 0 0 0 0 0 0 0 0 0 0 0 0 0 0 0 0 0 0 0 0 0 0 0 0 0 0 0 0 0 0 0 0 0 0 0 0 0 0 0 0 0 0 0 0 0 0 0 0 0 0 0 0 0 0 0 0 0 0 0 0 0 0 0 0 0 0 0 0 0 0 0 0 0 0 0 0 0 0 0 0 0 0 0 0 0 0 0 0 0 0 0 0 0 0 0 0 0 0 0 0 0 0 0 0 0 0 0 0 0 0 0 0 0 0 0 0 0 0 0 0 0 0 0 0 0 0 0 0 0 0 0 0 0 0 0 0 0 0 0 0 0 0 0 0 0 0 0 0 0 0 0 0 0 0 0 0 0 0 0 0 0 0 0 0 0 0 0 0 0 0 0 0 0 0 0 0 0 0 0 0 0 0 0 0 0 0 0 0 0 0 0 0 0 0 0 0 0 0 0 0 0 0 0 0 0 0 0 0 0 0 0 0 0 0 0 0 0 0 0 0 0 0 0 0 0 0 0 0 0 0 0 0 0 0 0 0 0 0 0 0 0 0 0 0 0 0 0 0 0 0 0 0 0 0 0 0 0 0 0 0 0 0 0 0 0 0 0 0 0 0 0 0 0 0 0 0 0 0 0 0 0 0 0 0 0 0 0 0 0 0 0 0 0 0 0 0 0 0 0 0 0 0 0 0 0 0 0 0 0 0 0 0 0 0 0 0 0 0 0 0 0 0 0 0 0 0 0 0 0 0 0 0 0 0 0 0 0 0 0 0 0 0 0 0 0 0 0 0 0 0 0 0 0 0 0 0 0 0 0 0 0 0 0 0 0 0 0 0 0 0 0 0 0 0 0 0 0 0 0 0 0 0 0 0 0 0 0 0 0 0 0 0 0 0 0 0 0 0 0 0 0 0 0 0 0 0 0 0 0 0 0 0 0 0 0 0 0 0 0 0 0 0 0 0 0 0 0 0 0 0 0 0 0 0 0 0 0 0 0 0 0 0 0 0 0 0 0 0 0 0 0 0 0 0 0 0 0 0 0 0 0 0 0 0 0 0 0 0 0 0 0 0 0 0 0 0 0 0 0 0 0 0 0 0 0 0 0 0 0 0 0 0 0 0 0 0 0 0 0 0 0 0 0 0 0 0 0 0 0 0 0 0 0 0 0 0 0 0 0 0 0 0 0 0 0 0 0 0 0 0 0 0 0 0 0 0 0 0 0 0 0 0 0 0 0 0 0 0 0 0 0 0 0 0 0 0 0 0 0 0 0 0 0 0 0 0 0 0 0 0 0 0 0 0 0 0 0 0 0 0 0 0 0 0 0 0 0 0 0 0 0 0 0 0 0 0 0 0 0 0 0 0 0 0 0 0 0 0 0 0 0 0 0 0 0 0 0 0 0 0 0 0 0 0 0 0 0 0 0 0 0 0 0 0 0 0 0 0 0 0 0 0 0 0 0 0 0 0 0 0 0 0 0 0 0 0 0 0 0 0 0 0 0 0 0 0 0 0 0 0 0 0 0 0 0 0 0 0 0 0 0 0 0 0 0 0 0 0 0 0 0 0 0 0 0 0 0 0 0 0 0 0 0 0 0 0 0 0 0 0 0 0 0 0 0 0 0 0 0 0 0 0 0 0 0 0 0 0 0 0 0 0 0 0 0 0 0 0 0 0 0 0 0 0 0 0 0 0 0 0 0 0 0 0 0 0 0 0 0 0 0 0 0 0 0 0 0 0 0 0 0 0 0 0 0 0 0 0 0 0 0 0 0 0 0 0 0 0 0 0 0 0 0 0 0 0 0 0 0 0 0 0 0 0 0 0 0 0 0 0 0 0 0 0 0 0 0 0 0 0 0 0 0 0 0 0 0 0 0 0 0 0 0 0 0 0 0 0 0 0 0 0 0 0 0 0 0 0 0 0 0 0 0 0 0 0 0 0 0 0 0 0 0 0 0 0 0 0 0 0 0 0 0 0 0 0 0 0 0 0 0 0 0 0 0 0 0 0 0 0 0 0 0 0 0 0 0 0 0 0 0 0 0 0 0 0 0 0 0 0 0 0 0 0 0 0 0 0 0 0 0 0 0 0 0 0 0 0 0 0 0 0 0 0 0 0 0 0 0 0 0 0 0 0 0 0 0 0 0 0 0 0 0 0 0 0 0 0 0 0 0 0 0 0 0 0 0 0 0 0 0 0 0 0 0 0 0 0 0 0 0 0 0 0 0 0 0 0 0 0 0 0 0 0 0 0 0 0 0 0 0 0 0 0 0 0 0 0 0 0 0 0 0 0 0 0 0 0 0 0 0 0 0 0 0 0 0 0 0 0 0 0 0 0 0 0 0 0 0 0 0 0 0 0 0 0 0 0 0 0 0 0 0 0 0 0 0 0 0 0 0 0 0 0 0 0 0 0 0 0 0 0 0 0 0 0 0 0 0 0 0 0 0 0 0 0 0 0 0 0 0 0 0 0 0 0 0 0 0 0 0 0 0 0 0 0 0 0 0 0 0 0 0 0 0 0 0 0 0 0 0 0 0 0 0 0 0 0 0 0 0 0 0 0 0 0 0 0 0 0 0 0 0 0 0 0 0 0 0 0 0 0 0 0 0 0 0 0 0 0 0 0 0 0 0 0 0 0 0 0 0 0 0 0 0 0 0 0 0 0 0 0 0 0 0 0 0 0 0 0 0 0 0 0 0 0 0 0 0 0 0 0 0 0 0 0 0 0 0 0 0 0 0 0 0 0 0 0 0 0 0 0 0 0 0 0 0 0 0 0 0 0 0 0 0 0 0 0 0 0 0 0 0 0 0 0 0 0 0 0 0 0 0 0 0 0 0 0 0 0 0 0 0 0 0 0 0 0 0 0 0 0 0 0 0 0 0 0 0 0 0 0 0 0 0 0 0 0 0 0 0 0 0 0 0 0 0 0 0 0 0 0 0 0 0 0 0 0 0 0 0 0 0 0 0 0 0 0 0 0 0 0 0 0 0 0 0 0 0 0 0 0 0 0 SP194 Bacteria;Actinobacteria;Actinobacteria;Actinomycetales;Actinomycetaceae;Schaalia;lingnae_[Not_Validly_Published] 1254 1208 51 1104 383 468 17 2461 93 94 725 28 2183 1359 724 1152 290 239 628 832 1400 452 326 125 1199 1234 37 954 53 49 678 1898 65 1245 1641 399 1227 231 696 113 1412 213 1342 1595 1057 622 34 1099 57 324 345 2610 1067 119 1437 388 931 626 44 923 606 89 571 141 826 20 81 994 332 1291 666 550 395 2403 967 217 959 594 67 502 1664 2642 344 152 1949 2258 3752 1388 312 1339 411 1878 39 145 358 1060 10 370 101 507 173 632 1290 159 40 121 813 18 802 128 365 58 1234 2580 758 205 990 1031 1134 1198 1292 1432 2160 725 1805 1825 1058 1650 661 332 1792 590 2672 2027 1197 897 1147 847 108 866 320 5 162 262 14 362 450 482 1407 137 1158 2013 1001 270 389 494 1187 2598 1955 4034 397 68 606 48 278 914 66 1205 3 259 7 1214 404 146 2854 2082 1525 1355 591 243 71 483 582 1123 1223 773 653 1432 531 1134 904 870 665 1696 1030 167 1421 264 604 882 21 2380 3090 566 884 287 5 4 233 1 540 820 851 984 1474 1566 69 1079 14 1301 27 76 158 299 946 1964 624 761 206 382 4620 19 808 270 5471 1520 1545 312 944 193 856 608 1182 78 50 875 3340 586 2404 6155 889 54 2227 511 814 331 2959 2032 1178 359 1275 1154 1044 785 445 1795 1472 4931 0 1 0 1 0 0 0 0 1 0 0 5 0 0 0 0 1 0 0 1 0 0 1 0 0 0 0 0 0 1 0 0 0 0 1 0 0 0 0 1 0 0 0 0 0 1 0 0 0 0 0 0 0 0 0 0 0 0 0 0 0 0 0 0 0 0 0 0 0 0 0 0 0 0 0 0 0 0 0 0 0 0 0 0 1 0 3 0 0 0 1 23 0 0 0 0 0 0 0 0 0 0 0 0 0 2 2 1 0 1 0 0 0 0 0 0 0 1 0 0 0 0 0 0 0 0 0 0 0 0 0 0 0 0 0 0 0 0 0 0 0 0 0 0 1 0 0 0 0 0 1 0 0 0 2 1 1 0 0 0 0 0 0 0 0 0 0 0 0 0 0 0 0 0 0 0 0 0 0 2 0 0 0 0 0 0 0 1 0 1 0 0 0 0 0 0 0 0 1 3 0 0 0 0 0 0 0 0 0 0 0 0 0 1 0 0 0 0 1 0 0 0 0 0 0 0 0 1 0 0 22 1 0 0 2 0 0 0 0 0 0 0 0 0 0 0 0 0 2 0 0 0 0 1 0 0 0 0 0 0 0 0 0 0 0 0 0 0 0 0 0 0 0 0 0 1 0 0 0 0 0 1 0 0 0 0 0 0 0 0 0 2 0 0 0 0 0 0 0 0 0 0 0 0 0 0 0 0 0 0 0 0 0 0 0 0 0 0 0 0 0 0 0 0 1 0 0 0 6 0 0 0 0 0 1 0 0 1 0 0 0 0 0 0 0 0 0 3 0 0 0 0 3 0 0 0 0 1 0 0 0 0 0 0 0 0 0 0 1 2 0 0 0 0 0 1 0 0 0 0 0 0 1 0 0 0 0 0 0 0 0 0 0 0 0 3 0 0 5 5 1 0 2 0 0 1 0 0 0 0 0 1 3 0 0 0 1 0 0 0 0 0 0 7 1 1 0 1 0 0 1 0 0 0 0 0 1 0 0 0 3 0 1 3 1 0 0 1 0 0 0 0 0 0 0 0 0 0 0 1 0 1 0 0 5 1 0 0 3 2 0 0 0 0 0 0 0 0 0 0 0 0 0 0 0 0 0 0 0 0 0 0 0 0 0 0 0 0 0 0 1 2 0 0 0 0 1 0 0 0 0 0 0 0 0 1 0 1 0 0 0 0 0 0 0 0 1 1 0 0 3 0 0 0 0 1 0 0 0 0 0 0 0 1 0 0 0 0 0 0 0 0 2 0 0 2 0 0 0 1 0 5 1 0 0 0 0 1 0 0 0 0 0 0 0 0 0 0 0 0 0 0 0 0 0 0 0 0 0 1 0 0 0 0 0 0 0 0 0 1 0 0 0 0 0 1 0 0 0 2 0 18 1 1 0 0 0 0 0 0 0 0 1 6 4 0 1 0 1 1 0 0 0 0 0 0 0 0 0 0 0 0 0 0 0 0 0 0 0 0 0 0 0 0 0 0 0 0 0 0 0 0 0 0 0 0 2 0 0 1 0 2 0 0 0 0 0 0 0 0 0 0 3 0 0 0 0 0 1 4 0 0 0 0 1 0 0 1 0 0 0 3 1 0 4 0 0 0 0 1 2 0 0 0 0 0 0 0 0 0 0 0 0 0 0 0 0 0 0 0 0 2 0 0 1 0 0 0 0 0 0 0 0 0 0 0 0 0 0 0 4 10 0 0 0 0 0 0 5 2 0 8 3 3 1 6 3 10 0 3 0 1 0 0 8 10 23 3 3 4 1 5 7 1 75 13 16 28 5 5 0 0 1 0 2 4 2 11 9 8 0 2 2 4 6 2 1 2 1 4 3 0 3 0 13 49 0 14 0 0 0 0 0 0 7 6 2 1 0 2 2 0 2 18 0 0 4 0 0 0 6 0 0 3 1 7 0 4 21 3 7 0 0 1 6 0 0 65 0 5 1 4 35 32 2 0 1 1 35 0 24 0 73 1 0 2 1 23 1 0 0 0 2 0 1 20 2 6 3 2 3 0 12 5 2 0 3 0 0 8 1 0 4 20 3 2 0 0 6 0 0 6 1 0 4 0 0 2 4 1 2 3 11 17 12 0 1 9 1 1 14 6 5 1 2 6 0 3 18 16 2 6 10 8 1 3 0 2 1 2 4 5 3 1 3 21 13 6 9 11 7 0 21 2 1 6 2 2 33 0 0 4 0 0 0 2 1 1 20 0 0 12 0 4 6 0 1 1 2 1 4 6 0 6 10 0 0 8 0 9 10 14 0 8 0 0 0 0 1 0 3 2 0 6 2 3 1 18 6 1 14 2 1 1 1 1 0 10 0 0 6 2 0 8 37 1 1 2 0 0 0 11 4 3 2 5 35 86 3 4 0 14 5 42 0 0 166 1 0 1 5 8 8 0 0 6 0 1 1 1 0 0 1 20 1 11 50 0 10 1 0 12 2 5 7 0 7 6 8 0 7 0 0 4 0 47 3 4 52 14 1 3 0 2 6 3 8 1 4 1 1 3 0 58 1 1 0 8 0 18 0 0 365 5 1 2 3 0 0 2 1 0 7 4 1 0 5 4 7 12 1 0 38 0 0 2 0 0 4 2 0 1 1 11 1 0 2 8 164 55 1 14 0 0 5 19 10 2 1 1 0 47 2 8 4 139 27 0 22 62 4 0 0 5 29 0 1 20 0 1 2 0 6 16 0 9 69 0 0 3 28 16 0 0 2 5 11 1 0 2 0 2 5 0 0 2 21 5 0 0 76 20 29 331 19 2 3 0 0 16 14 0 13 26 2 32 2 5 1 20 1 3 0 17 67 21 13 10 7 1 48 0 0 25 18 2 4 35 1 470 18 2 0 0 27 8 1 17 0 3 3 3 1 0 1 6 3 0 583 2 0 1 19 4 0 0 3 10 0 2 2 4 8 0 1 1 1 0 31 1 0 2 0 1 4 1 6 0 7 0 3 55 3 1 3 0 0 24 8 9 0 16 0 1 10 0 0 3 10 1 2 62 5 1 7 2 0 4 19 0 2 0 8 0 1 5 0 4 8 2 0 2 4 2 2 11 2 1 11 0 0 43 1 0 0 0 16 14 10 4 0 2 16 5 5 12 5 12 91 13 6 9 6 3 2 84 0 0 1 4 12 38 1 21 1 10 7 2 0 0 41 9 26 0 46 0 0 14 30 4 0 25 8 0 6 0 2 0 1 2 1 1 1 3 1 8 3 17 34 24 0 1 0 0 14 1 3 1 0 1 41 5 7 2 20 1 4 1 0 2 0 0 1 3 0 0 0 0 1 1 12 5 83 0 11 0 32 2 2 66 13 30 4 0 9 7 0 8 3 66 2 0 9 10 7 683 10 17 2 1 0 2 0 24 5 3 0 9 1 0 16 0 0 1 3 0 0 2 0 0 0 16 0 2 3 0 2 3 1 2 7 7 0 10 24 7 7 0 9 2 0 0 1 8 33 2 7 5 2 0 42 1 0 2 12 6 46 2 0 3 13 1 4 0 0 4 SP195 Bacteria;Bacteroidetes;Flavobacteriia;Flavobacteriales;Flavobacteriaceae;Bergeyella;sp. HMT322 10 283 110 8 3 72 0 309 10 106 37 358 54 273 60 12 161 142 143 141 19 48 236 70 63 7 190 3 320 161 157 156 100 39 43 101 17 208 69 236 84 150 121 36 21 260 181 1 41 129 36 8 10 98 70 81 12 29 23 85 72 44 103 280 404 373 133 84 300 443 48 187 185 11 14 204 84 67 174 147 283 248 34 68 84 19 32 103 24 33 42 0 120 66 66 203 240 139 99 114 19 318 9 246 29 125 81 114 185 477 31 553 11 93 81 120 181 105 139 108 32 109 45 107 76 18 57 1 63 167 330 521 2 81 39 284 142 20 219 238 22 160 347 74 239 144 70 279 124 408 24 44 61 70 43 54 110 49 17 43 245 419 120 173 73 21 61 119 257 88 1245 45 58 557 1 7 46 18 17 100 33 166 442 104 33 103 126 108 158 71 232 40 66 39 44 66 31 138 40 165 113 65 43 82 36 32 175 6 259 965 14 129 30 16 33 281 23 9 117 53 225 180 46 158 62 75 298 167 147 27 3 262 68 68 318 299 32 32 150 191 321 86 83 89 6 36 23 39 74 4 18 346 173 18 7 26 76 5 37 154 12 81 24 163 24 1 9 46 13 37 12 3 29 0 18 0 7 47 3 182 80 27 5 9 58 75 4 37 6 329 9 123 77 62 81 53 50 31 0 178 62 18 44 7 214 1 57 92 50 25 20 77 0 22 50 17 42 53 15 19 78 71 19 0 9 0 0 0 1 0 2 14 82 14 5 0 2 7 12 23 32 4 0 26 249 13 216 11 71 17 143 158 410 69 26 207 162 68 23 0 53 32 346 30 30 1 45 42 129 0 61 97 15 159 187 9 2 30 32 53 7 0 51 91 41 20 83 49 0 29 55 56 0 103 81 69 43 86 85 48 179 35 72 15 4 10 3 45 49 34 228 12 260 95 5 13 78 0 90 18 21 6 12 3 0 24 21 395 45 98 86 43 100 42 28 25 23 432 15 4 0 64 41 1 21 71 0 209 46 31 22 16 51 116 2 35 53 14 33 6 34 107 60 154 42 52 20 37 22 22 40 96 276 243 116 122 61 23 241 120 97 11 6 4 61 51 142 53 132 80 37 210 10 158 290 565 49 138 3 115 38 285 14 29 79 63 40 292 0 0 15 3 36 5 0 5 6 14 96 77 10 79 53 34 24 4 219 31 10 24 310 91 31 52 97 0 69 56 17 37 10 38 36 38 47 138 43 6 48 3 11 21 114 64 85 61 4 54 0 49 45 21 62 21 4 5 3 200 84 83 31 0 16 54 14 134 286 635 8 1 55 71 29 15 10 32 82 16 73 0 11 21 31 58 556 22 94 24 0 338 0 15 100 15 134 86 534 30 99 90 321 151 44 259 150 77 20 233 70 34 19 39 132 347 149 69 63 20 47 98 11 63 51 71 60 66 24 221 5 7 28 39 26 16 17 197 1 10 44 20 4 41 16 84 74 4 0 68 90 16 4 37 18 9 57 68 5 0 44 378 204 16 136 28 68 29 66 152 42 1 26 12 17 24 81 76 59 43 102 14 262 9 44 45 61 19 0 73 0 88 30 86 21 2 101 18 6 164 17 22 4 34 12 5 1 27 70 135 35 7 29 81 24 94 8 1 61 55 43 305 9 23 42 17 159 8 18 16 33 139 292 4 14 113 158 96 74 127 40 112 255 280 136 135 142 37 135 152 271 75 112 129 55 166 51 61 222 301 115 39 67 121 21 103 169 146 19 511 179 79 3 9 252 6 0 7 15 3 67 480 12 284 14 6 51 88 36 0 2 146 80 451 113 9 18 42 8 168 37 6 38 5 229 175 62 158 203 0 0 16 1 0 5 11 45 144 17 9 9 32 4 13 74 0 34 83 23 86 11 25 97 1 30 46 7 0 2 130 15 7 7 80 139 309 80 44 389 13 52 173 59 26 66 1 12 114 36 65 92 132 19 29 148 60 11 0 73 0 17 42 15 16 20 30 8 54 5 15 131 78 71 14 4 70 92 17 29 53 12 11 14 8 0 10 62 31 67 113 34 44 61 66 0 126 134 132 0 3 98 48 21 243 148 17 156 25 115 108 120 284 77 198 28 26 5 74 40 119 40 32 40 219 158 61 36 44 45 62 113 65 51 609 34 69 568 50 14 24 48 60 12 94 813 59 57 7 325 46 20 30 21 143 59 65 39 32 111 37 18 52 27 52 209 209 170 11 0 32 7 51 112 122 40 45 45 11 12 4 11 0 1 72 26 24 15 51 0 95 9 0 1 25 97 356 11 10 18 0 10 4 1 1 107 61 58 10 85 46 45 0 123 51 7 79 21 22 18 36 48 3 17 28 19 466 82 14 118 47 3 54 38 31 0 24 4 0 93 124 0 8 85 68 35 0 20 2 6 11 10 0 18 18 29 20 51 33 4 10 57 0 4 114 41 18 111 31 61 17 24 14 9 19 16 23 9 26 17 41 18 20 33 0 8 44 9 13 28 6 28 11 13 10 20 62 17 73 15 11 12 25 23 1 8 2 176 41 17 18 8 129 62 0 28 187 9 34 22 24 1 21 10 12 2 58 58 19 23 95 6 7 32 9 21 25 25 21 16 70 15 32 72 9 135 97 12 13 76 46 27 11 21 10 140 82 55 267 50 29 3 18 16 78 379 134 37 96 122 116 28 13 21 1 90 19 29 30 15 44 56 100 30 23 11 23 9 13 1 93 50 22 42 61 6 47 79 25 3 37 32 9 15 25 22 27 8 27 14 75 9 7 4 88 39 3 44 48 6 32 18 27 0 49 9 19 23 94 33 68 21 32 0 84 31 63 38 29 61 132 10 106 85 28 65 21 57 13 137 32 3 35 87 1 58 20 12 13 178 111 12 172 116 30 11 29 10 1 17 5 18 15 200 34 1 51 7 11 17 24 0 44 16 1 5 50 47 31 118 119 7 60 58 8 2 9 3 13 28 31 14 62 110 12 196 105 0 20 17 58 3 64 86 13 123 207 129 328 230 8 41 13 19 8 85 107 22 119 70 11 1 13 31 41 55 108 43 27 98 14 0 140 73 102 12 21 38 72 9 38 78 60 144 245 37 19 88 38 29 58 118 233 19 32 11 35 23 19 11 2 28 44 8 134 53 11 2 36 12 18 123 15 27 6 9 38 26 0 43 16 16 13 1 44 32 15 34 93 16 44 26 69 18 11 9 51 50 19 1 22 186 261 6 100 5 8 83 15 32 131 120 64 12 21 11 17 8 0 13 15 11 15 34 5 0 144 120 94 100 29 40 73 18 81 10 28 34 27 18 14 37 18 5 13 40 1 17 22 27 8 16 49 16 15 22 14 3 16 20 2 22 11 3 7 61 115 85 65 15 47 108 63 44 114 24 12 38 23 18 58 10 64 19 137 34 25 0 10 28 0 57 58 11 18 16 20 43 44 122 1 0 30 8 37 51 25 8 75 56 19 56 11 94 22 113 24 39 1 2 28 46 14 5 39 18 106 1 53 279 25 189 69 12 73 15 2 79 93 29 9 42 6 95 194 40 54 54 23 17 2 34 0 14 30 39 12 36 5 106 69 41 4 88 53 3 59 23 11 98 68 15 18 59 39 10 4 24 10 13 102 109 54 49 13 15 12 33 26 0 14 8 101 77 65 63 104 105 3 15 24 34 2 3 54 1 23 89 31 118 19 144 9 3 22 21 5 95 22 1 147 64 55 47 22 36 17 169 126 5 91 98 11 71 17 35 13 129 54 11 251 20 30 10 60 18 399 43 1 2 5 6 24 127 28 10 53 114 11 99 15 63 53 219 230 55 390 96 336 8 136 10 26 87 1 44 71 235 9 142 15 0 33 107 17 7 28 16 30 42 52 29 17 26 20 14 34 26 9 11 10 53 6 0 31 150 177 1 15 55 17 12 29 91 20 92 19 123 6 48 8 15 117 14 67 77 0 96 25 81 79 13 42 2 0 3 25 24 39 25 5 0 24 75 15 83 23 29 1 27 92 1 50 14 5 56 18 5 21 27 54 30 19 5 1 0 40 84 2 23 123 1 0 112 49 15 55 21 55 22 85 4 31 28 16 4 17 38 4 93 57 60 99 94 4 7 2 SP197 Bacteria;Actinobacteria;Actinomycetia;Corynebacteriales;Corynebacteriaceae;Corynebacterium;matruchotii 0 3 18 2 0 17 235 15 2 28 0 364 85 5 38 4 2 39 1 5 3 2 0 71 17 18 17 0 127 104 1 0 17 6 76 7 0 12 4 8 2 0 1 47 23 0 13 43 53 9 1 17 55 6 7 0 27 50 0 15 11 10 2 0 8 2 1 2 28 2 2 2 5 5 13 4 5 4 21 17 72 0 0 12 1 5 8 14 2 17 25 2 11 110 1 0 29 18 1 10 1 15 15 0 7 5 0 39 4 21 15 54 51 130 5 2 2 74 21 2 25 25 1 102 11 1 3 1 15 166 10 224 0 21 11 11 19 96 0 1 40 3 958 84 13 4 25 6 0 4 51 0 25 1 0 1 2 1 2 2 6 11 1 13 2 0 2 1 7 2 1 0 2 10 2 1 0 1 3 1 0 0 7 23 0 2 2 0 1 8 2 2 0 2 0 0 2 1 2 1 15 10 7 0 0 0 1 15 4 12 4 4 1 1 2 7 10 0 0 0 3 43 0 8 13 9 7 13 43 15 15 0 7 12 2 8 8 3 5 24 0 0 9 0 5 13 2 4 0 0 2 2 0 5 0 1 2 2 1 0 7 4 0 22 0 2 0 11 0 799 97 0 7 757 1124 0 2153 509 1267 1 560 1090 0 1424 561 478 1257 15 113 298 781 11 303 1 577 633 172 1170 1 771 722 416 411 520 47 415 697 14 1048 31 894 63 283 16 376 593 0 286 553 850 36 2 506 0 1315 0 190 0 435 0 397 1327 0 248 83 1 5 0 0 0 0 97 0 710 891 0 0 1324 234 0 27 290 0 222 21 0 0 634 323 0 0 586 1 1635 169 0 0 622 341 0 431 15 1515 472 1 2377 83 0 10 787 11 0 836 365 5 143 241 139 1 2 0 0 0 1017 49 1003 583 0 212 215 1 0 0 1993 1334 478 0 601 0 0 537 1138 0 1554 458 1 89 0 1143 0 1894 796 1610 1166 0 1737 665 0 0 7 15 750 487 1220 0 748 726 0 0 114 1340 22 4 30 40 238 12 0 308 1304 778 1792 492 0 72 654 199 992 0 1126 303 0 1 519 1841 789 0 1597 290 0 353 282 0 1053 322 247 702 145 872 1116 207 809 205 669 666 283 300 499 2 427 485 0 661 280 153 0 789 932 0 625 377 0 0 8 240 0 149 0 432 301 70 482 0 26 14 13 94 560 0 1 0 718 205 14 396 958 1 485 11 844 0 440 1185 1 940 0 27 18 234 30 0 375 560 239 415 2 724 1101 0 555 1120 2092 0 40 50 0 18 219 0 988 0 717 1 299 983 1240 1 0 0 449 255 0 325 1335 414 3 484 0 108 0 0 364 278 0 2791 483 843 1 319 68 433 0 2089 14 0 889 0 443 0 0 0 1954 0 1760 156 52 0 0 87 407 474 430 595 0 136 541 1054 1 525 127 1 992 620 229 122 1308 184 2 441 613 1017 1525 157 0 656 676 1382 1 705 1582 299 562 355 2229 1044 1 0 762 22 157 3107 24 0 180 1 1739 335 258 340 3331 910 0 3057 2472 735 1003 715 0 202 162 0 1331 0 1188 0 78 106 1 198 24 0 756 768 0 0 435 397 0 303 681 10 0 10 1521 102 1387 36 5 0 225 1799 30 1075 1366 5 91 2270 0 1038 1284 884 0 1367 945 0 622 358 0 515 914 0 110 683 285 0 2317 310 543 335 112 630 451 1 285 8 97 120 715 588 218 9 1534 717 3 288 0 1 372 860 0 175 0 253 0 537 771 240 149 0 609 174 256 0 117 410 0 627 925 0 422 512 1 956 526 0 287 959 0 363 260 4487 747 0 455 2709 131 1493 94 13 0 138 101 764 518 0 206 978 0 140 2 0 0 63 0 0 37 52 117 1957 314 328 2 0 1 7 232 1 8 884 1363 598 1848 290 244 12 2 1047 391 148 0 14 622 2 3 65 121 0 1301 77 13 1672 660 1072 38 113 156 1501 326 810 0 185 459 68 16 605 213 0 1494 419 0 5 6 406 955 1424 185 115 396 1410 1110 937 465 3 333 510 349 480 1018 1394 1 2243 2373 38 869 1946 0 618 0 631 1476 1194 0 0 0 348 56 1830 0 865 72 4007 2 2486 0 1205 0 625 463 1025 860 574 262 0 1271 1059 202 0 1444 1477 0 503 19 0 1143 228 450 0 718 849 0 664 0 367 1354 0 146 754 584 2309 551 1221 5 283 210 0 477 532 3 1881 1457 920 0 821 999 0 246 840 943 1272 1 6 494 1 329 7 132 1 6 231 0 749 616 0 258 804 16 403 222 1143 527 543 0 341 978 0 1066 0 815 1413 498 860 0 220 466 0 1929 1788 396 1622 2 56 744 222 1801 0 1482 0 0 0 0 2 428 0 6 2597 379 1 0 4 1553 541 556 92 1425 1080 0 277 30 111 0 8 76 1 142 46 0 111 54 71 0 268 25 0 243 91 6 23 50 33 8 224 88 0 56 83 0 163 35 0 29 116 1 9 0 151 113 1 0 21 0 95 86 0 290 82 290 219 0 181 0 1 464 11 0 42 395 0 0 100 80 1 54 47 17 0 0 54 0 0 1 0 0 105 0 1 6 1 0 0 2 1 0 246 0 0 37 0 0 75 194 182 4 562 84 82 0 726 634 0 42 0 0 19 167 1 0 14 77 0 89 6 0 0 241 41 0 0 753 7 0 256 7 6 16 33 0 394 0 15 0 39 4 9 5 4 1 19 10 0 25 0 72 456 0 56 1 0 19 18 0 0 328 17 0 201 14 0 18 0 97 242 0 146 552 35 0 65 189 0 325 53 0 85 233 0 9 0 150 36 0 82 203 2 27 19 4 0 109 49 0 0 31 42 0 92 393 0 12 22 157 0 23 167 0 280 80 0 29 50 13 1 11 558 1 4 1 0 92 131 0 1 15 0 27 44 0 52 151 0 60 6 0 4 38 70 0 40 43 0 157 3 0 0 30 36 0 118 84 0 39 20 0 15 4 40 0 413 121 0 0 224 94 0 148 27 0 126 13 0 17 110 30 0 641 0 10 227 40 0 222 596 1 0 31 54 3 3 0 11 0 99 2 0 58 0 205 3 0 0 487 0 0 456 58 270 356 19 0 388 105 53 0 382 149 1 316 4 0 2 12 0 0 11 3 11 0 51 0 0 98 42 6 232 0 148 58 26 47 123 10 235 442 1 1 454 72 131 46 221 0 3 8 0 5 1407 0 0 0 87 194 0 85 58 0 43 115 101 104 9 0 74 0 0 163 17 0 12 0 0 0 0 0 257 0 172 46 11 132 1 0 155 186 4 66 47 0 0 22 224 0 112 148 0 5 10 6 0 15 0 0 870 34 0 104 2 0 0 4 377 0 119 374 0 14 0 0 45 212 283 4 0 54 247 367 1 132 68 2 36 41 0 362 9 27 0 52 51 0 6 205 8 61 37 126 0 3 376 0 4 605 4 0 809 1 0 7 22 25 24 26 0 174 1017 0 515 786 70 0 0 129 99 1 2 2 0 64 126 4 8 218 27 0 171 570 0 470 76 0 0 140 18 0 152 13 0 359 775 0 60 0 62 9 61 0 43 18 0 0 35 20 0 123 7 68 0 59 78 0 96 16 136 357 0 0 89 65 0 0 475 0 0 174 0 25 65 0 45 931 107 0 14 8 0 23 162 0 150 246 107 0 41 143 0 11 197 0 76 64 0 0 42 45 0 0 7 13 0 67 138 0 64 4 0 65 26 63 0 36 377 0 24 0 0 10 59 1 0 34 29 0 37 47 0 88 266 7 0 622 313 0 0 44 907 0 93 23 0 0 55 0 67 50 0 0 124 0 0 81 0 0 55 8 2 0 640 54 0 284 115 0 3 88 0 34 5 8 0 414 14 0 113 1 0 308 3 0 147 26 7 90 2 16 26 0 229 217 0 342 25 0 169 26 0 251 14 0 18 4 0 0 8 31 0 42 31 1 177 321 0 244 323 25 0 47 34 0 63 379 38 3 0 352 437 379 1 206 130 0 211 3 0 61 304 43 0 0 0 0 0 1 0 1 2 0 173 640 12 79 65 160 154 0 0 78 88 111 24 17 0 112 267 0 90 46 227 1 83 105 0 31 51 6 19 18 37 0 143 135 0 51 659 3 0 16 14 0 6 34 0 0 1 9 0 71 6 0 153 133 0 9 76 25 0 10 54 0 42 8 0 7 48 7 16 0 SP198 Bacteria;Bacteroidetes;Bacteroidia;Bacteroidales;Prevotellaceae;Prevotella;oulorum 0 0 0 0 0 71 13 2 0 6 0 0 0 0 4 5 0 1 0 0 1 0 0 77 1 0 0 2 22 10 0 0 0 2 128 5 4 97 0 0 1 0 0 10 3 35 15 1 154 0 3 1 0 4 0 0 1 0 0 12 0 20 0 13 0 2 0 1 16 0 50 1 0 0 7 0 0 0 2 0 0 1 0 0 8 0 0 0 1 55 0 0 41 9 0 0 0 6 0 0 0 5 0 1 0 3 0 4 1 0 65 1 12 4 0 0 0 0 8 0 2 5 0 8 5 0 6 0 1 7 0 0 0 2 0 10 0 4 0 0 2 0 4 0 1 1 3 2 0 0 8 0 16 0 0 0 2 0 0 0 0 0 0 12 0 0 0 0 0 0 6 0 0 2 4 0 0 0 0 2 0 0 5 10 0 0 0 2 0 3 0 0 0 0 0 2 0 1 0 1 0 0 27 2 0 6 0 8 0 0 1 0 1 0 0 4 4 2 0 0 1 3 0 7 1 0 0 0 5 13 10 0 0 2 0 1 0 0 0 2 0 0 19 1 0 2 0 1 30 0 13 4 0 0 0 0 0 0 2 3 22 8 0 17 61 3 0 7 0 0 0 0 0 38 4 0 0 1 208 0 51 133 653 142 5 2 57 0 6 9 143 3 9 0 143 0 12 85 0 9 6 177 143 199 3 0 13 0 0 0 0 0 10 0 18 0 0 1 10 7 0 0 124 0 235 0 0 0 0 0 0 22 0 0 0 0 0 0 0 0 0 20 0 4 0 1 0 8 0 0 0 0 0 0 0 2 0 0 0 0 0 4 0 2 0 0 1 0 3 0 5 0 90 1 0 0 0 2 0 14 0 0 0 0 0 0 0 9 0 0 0 0 0 0 0 0 3 0 0 0 2 0 0 2 0 3 0 3 0 0 0 146 0 0 0 0 0 0 973 0 2 33 83 199 0 6 14 0 0 0 0 0 7 7 0 5 17 0 0 0 77 0 0 0 53 0 0 2 9 2 800 0 61 0 3 0 0 1 0 31 0 0 0 0 0 0 0 27 0 0 15 8 0 0 0 0 22 3 0 8 1 3 104 126 9 171 0 0 0 7 77 0 213 62 6 0 0 1 0 2 110 0 0 0 0 0 0 0 0 100 63 289 10 0 2 0 7 8 0 0 0 3 0 0 0 2 0 0 0 1 0 1 11 0 0 0 0 128 0 4 0 10 162 166 0 0 0 464 6 387 86 4 0 0 0 0 0 5 0 13 0 246 9 137 162 209 0 0 0 6 1 0 0 0 0 0 0 0 0 0 0 0 0 0 0 36 8 0 0 0 152 0 0 0 0 16 0 2 0 0 0 137 2 10 0 0 0 0 0 0 0 0 1 0 0 0 1 0 2 0 15 0 0 0 0 30 0 0 0 1 0 0 0 10 0 17 54 0 2 4 1 0 0 33 1 0 0 336 24 23 0 0 0 0 0 360 170 0 0 65 47 0 21 278 36 0 30 0 0 0 0 20 0 3 0 0 0 0 0 0 0 0 5 0 0 0 0 0 0 10 0 0 0 0 0 36 0 0 177 0 0 8 2 10 0 0 30 0 164 50 0 0 64 88 0 0 0 0 1 157 0 0 23 1 0 83 1 10 0 0 288 114 3 0 0 17 1 0 26 2 0 69 68 0 0 0 0 0 13 0 1 0 13 0 48 1 0 0 1 0 1 14 16 0 1 0 40 17 0 159 0 0 70 56 1 1 59 0 0 147 0 0 0 68 0 0 0 0 0 0 0 0 0 2 1 0 9 0 38 0 0 0 0 0 0 0 8 0 147 0 0 0 0 0 0 6 0 0 0 0 1 32 0 0 0 0 68 0 0 0 0 0 0 0 0 0 0 0 0 0 6 3 7 0 2 0 182 0 22 0 0 12 0 0 13 0 38 0 0 0 2 0 1 495 0 0 15 0 0 0 0 0 0 1 301 0 6 0 10 1 0 18 1 8 419 0 44 0 0 0 8 0 0 0 6 0 0 0 59 0 2 0 10 0 0 0 0 0 33 4 1 5 0 0 0 2 0 288 17 54 0 18 0 45 0 3 0 2 0 0 0 0 103 145 1 53 0 30 26 92 39 2 0 9 0 0 146 3 4 17 25 0 334 38 0 13 26 0 2 0 0 110 0 79 0 0 0 0 6 3 377 68 0 147 85 0 187 83 41 50 3 0 8 12 0 20 0 265 845 0 15 0 29 6 0 2 73 0 96 0 0 1 0 8 2 144 0 0 0 0 0 0 0 0 41 0 0 0 0 0 0 8 0 1 20 0 0 2 99 0 1 20 1 18 16 12 19 1 2 0 0 0 1 0 0 0 9 28 15 0 2 6 19 246 14 16 4 5 0 3 0 2 6 0 12 420 1 0 0 0 4 3 0 0 0 8 0 0 19 0 3 8 2 0 0 10 0 0 95 17 3 68 0 0 0 0 0 0 0 0 0 0 1 1 0 0 0 0 0 0 0 3 106 1 0 0 0 0 0 12 0 0 47 0 1 3 157 0 0 0 3 0 18 2 0 0 4 12 0 62 2 0 0 0 0 0 1 0 0 0 54 0 0 74 210 20 5 0 0 0 0 0 0 0 1 0 0 8 1 2 2 80 95 0 2 0 0 0 12 0 0 55 0 0 8 0 0 22 0 9 61 0 14 4 7 3 2 26 0 0 0 1 4 70 0 0 0 5 13 6 11 0 4 1 1 0 0 1 1 0 0 10 24 2 166 22 4 17 0 269 0 10 44 1 39 9 0 16 115 0 0 2 79 0 0 0 0 79 0 59 0 0 5 1 13 0 2 3 0 2 6 2 0 1 0 0 2 14 0 0 0 0 1 9 2 0 117 0 0 1 0 1 0 0 41 1 8 3 12 0 4 13 1 64 7 0 5 0 0 3 0 21 6 0 0 0 2 0 0 0 0 0 0 34 25 70 2 5 6 0 3 0 45 2 0 42 0 0 0 26 4 0 16 17 2 9 0 4 25 6 2 0 27 6 19 0 2 0 0 0 0 0 0 0 1 0 0 0 0 20 0 0 53 1 44 4 66 0 5 0 0 0 0 0 60 0 0 8 2 0 0 2 0 0 94 1 1 0 6 0 0 3 0 0 0 83 60 0 0 1 12 1 0 17 3 0 0 0 0 0 9 0 13 0 231 7 1 32 0 0 0 0 2 1 9 0 0 17 1 0 83 3 0 6 0 17 0 2 0 0 157 17 2 15 22 0 0 4 48 1 1 177 0 0 1 1 1 0 249 0 2 2 30 2 5 4 4 32 1 11 0 42 0 12 0 1 0 0 0 0 0 3 3 0 0 0 0 0 16 449 0 0 1 0 0 0 0 1 0 0 0 0 19 0 18 224 21 2 1 11 1 0 1 0 10 4 0 0 11 71 0 3 65 59 0 171 7 1 0 25 3 0 53 7 0 31 22 0 1 0 1 0 0 0 16 5 7 0 0 0 0 170 0 1 0 5 0 0 7 0 14 0 0 0 0 0 0 1 81 0 0 0 0 0 0 0 53 314 31 0 5 11 0 0 6 1 14 17 28 0 4 12 0 1 32 5 32 11 0 0 18 10 0 0 0 0 0 0 0 0 23 0 2 10 1 9 46 3 67 0 3 5 0 7 5 0 0 1 0 0 1 0 2 219 0 0 0 0 1 0 0 1 75 5 0 0 0 1 5 1 0 7 0 0 0 1 0 0 0 0 0 2 2 0 66 5 0 0 0 0 5 3 6 3 12 3 0 73 0 0 0 0 0 0 0 0 30 5 1 2 0 0 11 0 14 0 0 86 4 3 3 0 3 61 0 0 5 4 0 0 1 1 2 0 4 0 0 0 0 15 28 8 0 25 2 0 29 1 8 5 1 133 2 0 24 40 100 0 23 93 2 7 0 0 0 0 0 0 0 0 0 417 0 0 184 270 0 1 1 0 6 0 0 231 124 4 2 0 0 34 14 0 20 0 288 10 31 2 0 15 2 0 0 0 5 0 142 0 0 1 153 3 23 0 5 0 3 3 0 0 0 0 0 3 2 7 11 1 0 1 3 0 0 0 29 0 0 0 0 0 0 0 14 2 SP199 Bacteria;Bacteroidetes;Bacteroidia;Bacteroidales;Prevotellaceae;Prevotella;jejuni 9 0 0 86 0 9 1 229 0 6 86 0 68 1 0 5 0 1 2140 684 145 2 18 52 167 0 0 0 0 0 2 187 0 41 41 7 22 1 12 0 159 2 0 1393 131 1 4 1 15 0 1312 173 831 5 44 1 1208 48 0 454 0 0 1 0 124 0 0 3922 28 2 105 21 6 0 70 0 269 20 3 1 0 116 1 21 438 0 32 25 0 1271 0 531 1 0 27 0 0 0 1 49 0 117 1 0 1 1 57 1 51 1 0 1 1907 15 1951 0 466 381 669 0 6 9 407 183 1608 235 2161 60 839 4 5 6 0 0 334 0 165 81 1 0 2 0 0 0 0 826 250 74 231 0 218 0 0 0 143 2 7 0 1 125 0 0 24 2 2 12 2 11 0 2 1 0 0 2 60 5 1 1 0 5 1 0 2 37 1481 0 0 0 0 4062 101 8 923 1 64 4 811 265 10 8 0 17 957 0 2 1008 0 4 2 0 118 0 59 3 4 198 4 626 0 2 23 2169 45 2 8359 17 57 3 0 2669 204 0 1 0 0 4 64 149 334 3 0 0 935 0 2 4 30 0 231 0 4259 0 0 482 1 0 16 68 89 1057 2 1585 1 139 69 211 595 22 0 0 0 0 0 0 0 0 0 0 0 0 0 0 0 0 0 0 0 0 0 0 0 0 0 0 0 0 0 0 0 0 0 0 0 0 0 0 0 0 0 0 0 0 0 0 0 0 0 0 0 0 0 0 0 0 0 0 0 0 0 0 0 0 0 0 0 0 0 0 0 0 0 0 0 0 0 0 0 0 0 0 0 0 0 0 0 0 0 0 0 0 0 0 0 0 0 0 0 0 0 0 0 0 0 0 0 0 0 0 0 0 0 0 0 0 0 0 0 0 0 0 0 0 0 0 0 0 0 0 0 0 0 0 0 0 0 0 0 0 0 0 0 0 0 0 0 0 0 0 0 0 0 0 0 0 0 0 0 0 0 0 0 0 0 0 0 0 0 0 0 0 0 0 0 0 0 0 0 0 0 0 0 0 0 0 0 0 0 0 0 0 0 0 0 0 0 0 0 0 0 0 0 0 0 0 0 0 0 0 0 0 0 0 0 0 0 0 0 0 0 0 0 0 0 0 0 0 0 0 0 0 0 0 0 0 0 0 0 0 0 0 0 0 0 0 0 0 0 0 0 0 0 0 0 0 0 0 0 0 0 0 0 0 0 0 0 0 0 0 0 0 0 0 0 0 0 0 0 0 0 0 0 0 0 0 0 0 0 0 0 0 0 0 0 0 0 0 0 0 0 0 0 0 0 0 0 0 0 0 0 0 0 0 0 0 0 0 0 0 0 0 0 0 0 0 0 0 0 0 0 0 0 0 0 0 0 0 0 0 0 0 0 0 0 0 0 0 0 0 0 0 0 0 0 0 0 0 0 0 0 0 0 0 0 0 0 0 0 0 0 0 0 0 0 0 0 0 0 0 0 0 0 0 0 0 0 0 0 0 0 0 0 0 0 0 0 0 0 0 0 0 0 0 0 0 0 0 0 0 0 0 0 0 0 0 0 0 0 0 0 0 0 0 0 0 0 0 0 0 0 0 0 0 0 0 0 0 0 0 0 0 0 0 0 0 0 0 0 0 0 0 0 0 0 0 0 0 0 0 0 0 0 0 0 0 0 0 0 0 0 0 0 0 0 0 0 0 0 0 0 0 0 0 0 0 0 0 0 0 0 0 0 0 0 0 0 0 0 0 0 0 0 0 0 0 0 0 0 0 0 0 0 0 0 0 0 0 0 0 0 0 0 0 0 0 0 0 0 0 0 0 0 0 0 0 0 0 0 0 0 0 0 0 0 0 0 0 0 0 0 0 0 0 0 0 0 0 0 0 0 0 0 0 0 0 0 0 0 0 0 0 0 0 0 0 0 0 0 0 0 0 0 0 0 0 0 0 0 0 0 0 0 0 0 0 0 0 0 0 0 0 0 0 0 0 0 0 0 0 0 0 0 0 0 0 0 0 0 0 0 0 0 0 0 0 0 0 0 0 0 0 0 0 0 0 0 0 0 0 0 0 0 0 0 0 0 0 0 0 0 0 0 0 0 0 0 0 0 0 0 0 0 0 0 0 0 0 0 0 0 0 0 0 0 0 0 0 0 0 0 0 0 0 0 0 0 0 0 0 0 0 0 0 0 0 0 0 0 0 0 0 0 0 0 0 0 0 0 0 0 0 0 0 0 0 0 0 0 0 0 0 0 0 0 0 0 0 0 0 0 0 0 0 0 0 0 0 0 0 0 0 0 0 0 0 0 0 0 0 0 0 0 0 0 0 0 0 0 0 0 0 0 0 0 0 0 0 0 0 0 0 0 0 0 0 0 0 0 0 0 0 0 0 0 0 0 0 0 0 0 0 0 0 0 0 0 0 0 0 0 0 0 0 0 0 0 0 0 0 0 0 0 0 0 0 0 0 0 0 0 0 0 0 0 0 0 0 0 0 0 0 0 0 0 0 0 0 0 0 0 0 0 0 0 0 0 0 0 0 0 0 0 0 0 0 0 0 0 0 0 0 0 0 0 0 0 0 0 0 0 0 0 0 0 0 0 0 0 0 0 0 0 0 0 0 0 0 0 0 0 0 0 0 0 0 0 0 0 0 0 0 0 0 0 0 0 0 0 0 0 0 0 0 0 0 0 0 0 0 0 0 0 0 0 0 0 0 0 0 0 0 0 0 0 0 0 0 0 0 0 0 0 0 0 0 0 0 0 0 0 0 0 0 0 0 0 0 0 0 0 0 0 0 0 0 0 0 0 0 0 0 0 0 0 0 0 0 0 0 0 0 0 0 0 0 0 0 0 0 0 0 0 0 0 0 0 0 0 0 0 0 0 0 0 0 0 0 0 0 0 0 0 0 0 0 0 0 0 0 0 0 0 0 0 0 0 0 0 0 0 0 0 0 0 0 0 0 0 0 0 0 0 0 0 0 0 0 0 0 0 0 0 0 0 0 0 0 0 0 0 0 0 0 0 0 0 0 0 0 0 0 0 0 0 0 0 0 0 0 0 0 0 0 0 0 0 0 0 0 0 0 0 0 0 0 0 0 0 0 0 0 0 0 0 0 0 0 0 0 0 0 0 0 0 0 0 0 0 0 0 0 0 0 0 0 0 0 0 0 0 0 0 0 0 0 0 0 0 0 0 0 0 0 0 0 0 0 0 0 0 0 0 0 0 0 0 0 0 0 0 0 0 0 0 0 0 0 0 0 0 0 0 0 0 0 0 0 0 0 0 0 0 0 0 0 0 0 0 0 0 0 0 0 0 0 0 0 0 0 0 0 0 0 0 0 0 0 0 0 0 0 0 0 0 0 0 0 0 0 0 0 0 0 0 0 0 0 0 0 0 0 0 0 0 0 0 0 0 0 0 0 0 0 0 0 0 0 0 0 0 0 0 0 0 0 0 0 0 0 0 0 0 0 0 0 0 0 0 0 0 0 0 0 0 0 0 0 0 0 0 0 0 0 0 0 0 0 0 0 0 0 0 0 0 0 0 0 0 0 0 0 0 0 0 0 0 0 0 0 0 0 0 0 0 0 0 0 0 0 0 0 0 0 0 0 0 0 0 0 0 0 0 0 0 0 0 0 0 0 0 0 0 0 0 0 0 0 0 0 0 0 0 0 0 0 0 0 0 0 0 0 0 0 0 0 0 0 0 0 0 0 0 0 0 0 0 0 0 0 0 0 0 0 0 0 0 0 0 0 0 0 0 0 0 0 0 0 0 0 0 0 0 0 0 0 0 0 0 0 0 0 0 0 0 0 0 0 0 0 0 0 0 0 0 0 0 0 0 0 0 0 0 0 0 0 0 0 0 0 0 0 0 0 0 0 0 0 0 0 0 0 0 0 0 0 0 0 0 0 0 0 0 0 0 0 0 0 0 0 0 0 0 0 0 0 0 0 0 0 0 0 0 0 0 0 0 0 0 0 0 0 0 0 0 0 0 0 0 0 0 0 0 0 0 0 0 0 0 0 0 0 0 0 0 0 0 0 0 0 0 0 0 0 0 0 0 0 0 0 0 0 0 0 0 0 0 0 0 0 0 0 0 0 0 0 0 0 0 0 0 0 0 0 0 0 SP2 Bacteria;Bacteroidetes;Flavobacteriia;Flavobacteriales;Flavobacteriaceae;Capnocytophaga;leadbetteri 2 126 13 5 4 26 7 173 2 52 18 146 139 3 196 10 21 94 1699 736 1 0 3 123 6 19 10 4 297 44 32 58 538 87 14 32 44 11 13 616 1 48 245 11 13 8056 6 0 65 37 49 0 0 18 23 237 14 121 18 83 26 34 0 172 1004 18 26 20 511 2545 295 66 182 10 5 64 16 13 30 11 168 169 8 305 35 39 19 13 8 107 142 1 49 47 85 218 86 567 168 18 6 1 40 188 20 63 14 13 60 46 6 11 13 228 20 148 43 19 43 1004 15 58 8 350 4 14 12 0 35 219 143 3834 2 266 362 139 1061 30 20 517 26 29 831 277 77 54 53 71 9 15 43 72 1339 2 2 14 484 30 46 1 27 69 0 2 1 4 19 16 4 3 13 1 5 4 19 1 18 13 4 19 0 1 182 151 14 54 50 79 81 27 1 5 37 0 2 31 4 411 64 174 9 49 76 13 3 5 1 15 13 18 54 17 23 1 33 87 7 3 2 13 66 138 3 92 11 28 675 131 456 23 5 10 6 40 5 1916 25 1 8 210 7 0 22 6 5 26 1 20 26 0 4 58 12 57 0 2 78 2 18 49 26 10 0 62 68 4 8 91 5 710 14 0 530 0 169 0 22 297 234 1022 255 273 322 79 288 321 32 19 170 420 782 566 173 0 108 827 48 691 0 327 135 95 399 401 147 2 18 1 503 3 118 117 0 2 17 12 416 262 6 0 7 731 173 1 411 0 0 0 1 0 1 57 2 79 2 0 0 2 36 1388 17 59 0 83 429 10 15 2 16 4 45 63 344 98 0 200 0 347 26 0 50 119 0 36 0 344 1 42 202 0 28 21 793 139 101 1 2 1 0 73 1 0 234 105 0 75 512 9 1 9 428 258 0 140 656 19 175 19 65 325 61 15 0 48 51 751 9 132 136 81 53 195 8 844 160 166 165 0 948 0 36 11 420 49 0 175 12 0 5 3 3 186 208 403 0 439 207 1341 43 0 31 2 57 0 43 9 0 23 217 102 21 53 83 0 0 23 0 124 1 207 92 0 1 49 93 371 0 1030 2 47 536 386 734 820 259 197 39 7 110 351 798 41 0 11 393 259 265 167 185 156 218 111 48 595 345 324 27 123 0 108 367 220 1 24 951 0 254 807 1 0 119 93 0 1 0 5 27 493 0 12 0 185 4 2 134 41 3270 308 1 376 0 224 149 114 253 0 21 42 80 23 13 91 334 7 100 159 272 132 5 16 153 3 527 4 32 599 0 40 0 278 23 258 339 191 54 12 0 38 0 119 24 1 2 15 148 51 577 360 2 0 0 26 48 6 0 622 149 3 332 0 2 1 136 963 802 137 0 149 0 254 0 14 0 46 157 2 0 0 204 182 469 76 124 89 56 252 123 103 173 2017 73 8 8 43 1230 152 117 6 189 446 228 123 101 0 60 473 125 0 21 3 31 284 98 535 265 438 0 77 521 16 25 22 345 82 67 4 276 33 12 68 23 1 71 92 573 1 4 1 8 27 42 65 2215 201 83 24 121 0 15 0 0 20 113 1 0 64 67 316 54 46 235 0 25 191 399 293 1 1 1 8 50 128 10 45 365 2 54 337 3 216 3 76 140 150 4 44 47 845 14 3 176 105 237 82 1 0 406 99 88 104 290 49 78 34 851 37 39 62 356 156 765 143 283 31 259 51 24 293 219 25 420 73 438 473 17 260 39 57 39 314 293 502 287 16 143 2470 117 307 68 182 91 808 178 725 0 177 121 787 107 275 12 155 0 9 1 88 475 0 106 8 0 39 2 382 6 417 631 0 1 242 550 0 13 4 1 154 533 88 96 10 315 0 26 42 1 73 140 0 3 179 0 1 1 17 4 10 1 882 427 86 0 33 31 0 12 7 236 159 64 77 49 68 311 674 237 1 52 63 288 0 0 296 56 26 59 16 0 70 105 1194 34 151 77 29 4 10 24 523 244 11 14 32 131 585 146 1 600 1 175 64 17 6 758 7 47 0 13 38 4 72 74 0 0 63 141 38 76 18 293 42 20 0 7 1 349 0 51 98 48 86 45 76 0 183 85 161 0 67 312 2 4 209 275 1001 62 0 0 310 95 0 511 71 60 1101 0 24 1 223 360 140 231 18 421 86 0 30 72 35 111 730 59 6 573 506 0 250 107 4 21 414 90 144 0 252 1 30 1336 14 497 128 138 172 1 127 200 220 1103 46 86 567 21 14 3 184 2 115 0 127 11 191 97 390 27 207 91 97 395 3 4 14 1 204 117 354 31 478 0 4 2 0 0 228 0 331 8 2 5 0 4 12 0 79 149 156 422 9 62 47 300 0 32 97 17 103 174 6 6 50 33 0 137 49 25 2628 133 14 233 77 2 8 145 372 0 2 5 0 146 125 0 11 143 95 181 0 371 21 0 2 44 0 14 25 15 272 94 454 486 2 104 0 3 5 46 0 49 79 75 0 20 34 2 10 50 17 0 2 10 27 0 11 58 0 30 24 65 5 17 0 0 15 44 7 0 62 0 43 3 0 3 32 156 1 238 12 178 0 46 12 1 66 75 0 5 203 5 1 27 76 2 8 11 0 0 232 32 1 0 97 10 2 146 14 12 20 102 0 7 6 256 0 19 3 2 0 3 2 14 93 6 85 15 27 166 0 90 272 17 47 0 0 15 63 30 21 31 25 77 14 3 29 26 2 129 136 86 91 152 88 2 102 54 5 16 16 6 3 1 147 103 97 74 136 0 89 16 62 0 101 87 3 0 49 27 4 7 12 1 14 12 202 117 39 144 12 331 108 0 44 58 17 0 5 192 196 12 0 0 58 195 14 0 14 18 179 60 36 39 112 2 49 84 49 2 67 437 0 145 149 3 37 53 0 21 82 24 73 22 300 0 48 3 1 4 66 1 0 164 3 4 6 498 583 1 69 4 0 101 1 0 11 86 4 16 133 7 5 111 22 4 256 176 4 0 7 15 13 15 173 13 74 35 1 79 130 0 24 0 116 78 299 5 0 563 65 3538 157 8 0 73 53 26 4 340 54 11 154 67 2 6 4 4 14 5 34 69 34 127 4 0 101 77 6 9 1 240 1240 6 105 122 9 1142 174 6 10 621 62 28 596 220 0 5 141 0 10 828 22 1 0 55 121 13 85 313 11 19 8 66 71 70 1 7 4 0 40 5 0 1 1 0 19 2 0 82 0 150 118 5 25 1 0 4 12 18 24 97 0 0 11 122 409 22 398 1 1 36 143 81 220 2 3 53 66 0 76 2 0 2 0 82 10 21 17 0 67 315 6 8 14 113 323 23 19 182 44 14 84 34 1 10 12 0 45 62 2 0 76 5 1 1 14 19 91 59 13 0 89 56 22 10 372 1 0 310 18 4 56 54 1 434 109 1 227 181 8 546 95 176 3 1 129 43 43 3 0 0 6 28 0 9 58 10 0 31 15 3 59 43 0 0 42 1 119 229 12 13 61 195 0 29 14 115 98 71 0 23 0 0 0 358 7 0 68 98 76 0 14 63 30 46 21 6 298 0 0 121 321 7 3 210 0 180 107 6 15 56 9 5 347 244 0 7 8 0 8 103 0 392 260 274 0 92 164 0 18 34 0 157 114 0 0 115 109 8 6 1 27 3 239 76 95 41 3 0 40 38 142 0 3 36 10 14 101 0 101 126 2 27 6 90 0 3 12 1 36 156 2 6 70 80 3 1 14 10 33 277 48 1 209 54 0 24 40 0 0 21 65 2 21 32 0 43 2 27 44 191 213 22 470 91 11 0 61 3 392 281 0 0 159 6 29 163 28 10 279 6 0 12 48 44 17 94 13 95 110 9 697 1 80 30 2 50 8 48 65 41 11 14 7 0 0 17 40 11 18 26 12 74 50 36 38 94 6 0 2 25 6 44 19 10 12 0 234 41 127 1 31 188 10 120 63 32 20 13 13 42 0 0 18 1 114 0 7 32 0 224 84 116 217 31 152 12 0 0 142 87 36 76 1 0 20 81 0 414 4 84 2 120 267 4 29 55 4 36 7 137 0 134 67 2 83 20 0 10 6 45 5 91 195 1 0 351 19 0 2 40 413 6 22 1 13 525 27 0 17 23 1 84 7 21 18 37 0 36 13 SP20 Bacteria;Bacteroidetes;Bacteroidia;Bacteroidales;Prevotellaceae;Prevotella;nanceiensis 1 302 1 24 2 44 1 112 0 17 627 234 102 15 184 17 9 196 1150 598 1211 4 3 15 48 32 0 91 6 4 2332 468 51 2089 1739 1466 27 16 311 20 2958 73 707 42 12 194 747 24 0 27 63 1 72 35 806 646 12 138 13 181 113 11 716 13 2361 19 2 1691 235 1712 93 3709 220 31 1 90 100 76 8 3 2944 1885 1 84 340 0 830 36 4 301 26 2 8 2756 8 8 2 1729 514 93 2 4 289 599 0 160 133 10 2087 181 1 14 10 1097 214 195 2679 1125 906 106 1 2977 588 268 92 214 75 647 1093 27 1485 809 0 1459 1162 1842 2064 41 1 655 1 2 24 48 1 153 495 1155 59 0 39 981 4429 7 13 6 157 2 239 0 10 4 11 2 3 4 1 120 0 0 23 0 4 187 529 7 17 16 337 23 11 6 8 409 118 128 378 110 154 6260 501 11 509 33 81 16 1488 68 109 51 2 1718 2001 1976 73 56 2 0 2 5 2251 1811 91 414 680 493 2 105 0 1657 35 843 38 34 863 1457 1844 683 344 58 451 5 218 22 338 1714 4541 1262 2905 96 813 2211 429 4 6 231 196 478 3318 0 792 31 38 15 462 0 35 0 16 981 8 82 15 176 813 7 164 0 0 6 1 0 23 0 0 5 5 5 0 0 44 1 3 0 11 1 0 18 0 6 10 0 2 0 4 2 3 0 0 2 3 3 39 13 3 0 16 0 0 0 1 0 3 0 1 0 1 1 0 0 1 1 0 0 2 0 1 0 0 0 0 0 16 4 0 3 1 0 12 1 2 6 0 0 1 0 11 0 0 0 1 0 4 0 7 2 2 0 8 3 99 3 0 0 3 0 0 0 1 0 41 0 0 7 7 2 0 0 1 6 3 0 3 0 11 0 1 0 0 6 1 8 0 0 7 0 0 1 1 19 0 0 15 8 0 0 0 2 5 1 2 0 3 30 13 3 0 0 0 0 0 0 3 0 0 6 23 0 0 0 0 0 2 9 2 0 0 5 1 0 0 0 13 15 0 8 2 2 42 13 1 0 3 1 0 1 1 0 2 0 0 9 7 4 4 0 0 0 5 0 0 0 5 0 2 0 1 15 0 1 2 0 0 0 1 0 1 0 6 4 0 0 0 63 16 4 1 0 18 1 10 2 3 2 0 11 1 21 0 0 2 0 3 2 27 0 0 1 1 0 0 1 1 0 1 0 0 3 3 0 0 2 2 0 1 0 5 0 4 4 2 3 1 2 0 2 6 3 0 1 0 0 4 0 1 0 0 0 367 10 0 2 11 1 0 10 0 8 2 0 3 0 0 12 0 0 1 1 3 0 18 0 0 0 1 2 0 65 1 2 0 0 1 6 9 0 4 0 0 1 0 0 8 2 0 5 0 1 21 4 7 3 0 0 0 9 2 0 0 8 1 0 0 0 139 0 1 7 1 18 1 0 0 0 0 0 0 0 0 0 0 2 11 1 3 6 0 6 5 4 0 16 1 13 65 1 0 9 0 0 1 10 0 0 21 0 10 0 4 1 0 1 83 1 0 2 3 0 0 3 6 3 1 21 7 7 1 93 1 0 0 92 5 4 31 0 0 13 0 3 4 1 1 11 8 0 0 1 11 28 8 0 53 0 0 0 0 0 0 0 0 0 0 0 0 17 96 8 0 2 0 0 0 11 1 4 9 2 0 4 0 0 1 1 0 0 0 1 2 2 23 0 1 2 4 0 2 10 4 8 4 4 18 0 0 4 3 1 0 27 0 0 2 1 0 2 1 0 2 45 1 2 2 3 0 2 0 1 0 2 5 16 0 0 0 1 0 0 0 1 1 0 7 1 1 22 1 2 1 26 5 3 0 3 14 2 2 0 0 26 1 2 1 4 0 0 12 0 0 30 59 6 0 0 0 1 1 8 10 2 1 0 0 6 0 0 0 2 23 1 2 12 0 0 11 4 0 1 1 0 3 0 0 2 40 35 2 1 14 0 6 13 15 0 1 0 4 0 0 50 1 14 6 24 2 3 11 0 3 7 3 6 2 0 1 9 0 0 1 0 2 2 0 0 0 0 13 0 7 8 0 1 1 4 1 0 0 2 1 0 1 8 0 15 0 0 3 0 1 0 0 1 5 1 0 3 3 8 2 0 2 0 27 0 5 0 2 1 0 9 0 6 11 0 0 2 0 1 0 8 0 0 2 28 0 0 0 2 0 66 0 0 0 3 2 0 5 0 1 1 0 0 21 1 0 0 0 5 9 0 27 4 0 0 18 0 23 19 1 1 8 0 4 12 4 1 0 6 11 0 0 1 0 2 11 68 3 0 0 5 0 1 0 6 0 0 13 59 3 2 79 159 11 47 270 97 0 39 32 0 9 0 173 64 158 6 149 259 0 15 90 4 4 0 0 0 74 44 0 18 433 32 5 0 7 18 20 29 3 7 28 10 97 33 15 0 12 39 22 0 370 22 146 7 7 26 4 100 0 1 0 12 11 22 24 76 3 5 7 6 18 3 0 13 28 0 13 1 483 40 3 6 6 10 8 6 194 44 3 39 0 1 86 1 8 101 17 28 5 169 101 35 29 5 1 17 7 7 0 7 47 9 0 11 23 394 16 4 3 34 8 51 34 41 53 111 4 2 33 0 119 54 123 65 58 4 19 80 5 104 37 25 5 27 52 2 113 6 0 198 181 20 106 111 16 48 119 17 5 10 5 0 141 15 18 2 21 195 859 18 61 1 6 12 27 5 4 142 17 2 112 20 6 31 30 66 14 17 12 102 7 23 4 397 65 4 285 86 26 0 3 49 14 14 28 81 7 5 0 83 3 7 6 3 1 9 14 27 25 49 3 137 46 36 20 48 27 0 0 156 21 57 100 8 25 9 16 51 238 44 60 7 3 11 27 3 33 4 1 26 11 105 2 7 180 5 163 36 208 12 32 24 0 8 7 3 12 7 0 19 9 48 7 12 55 103 6 3 118 52 26 3 14 30 148 59 12 6 0 85 130 540 16 17 0 16 102 55 5 53 57 6 0 61 0 7 58 16 35 389 139 33 43 30 30 45 47 41 0 52 32 36 43 27 7 319 85 35 1 48 29 262 7 130 70 72 1329 12 5 7 344 45 57 125 42 18 28 3 27 188 7 19 67 20 2 29 76 38 2 21 9 11 5 65 0 17 7 12 101 26 58 22 58 18 13 0 743 50 187 6 8 24 4 51 0 0 154 29 27 28 3 10 10 11 15 93 205 101 18 353 4 10 4 12 65 21 14 55 2 76 3 113 69 13 50 90 5 208 29 4 2 16 181 210 89 951 34 34 21 29 53 414 5 1 18 7 2 35 24 11 9 2 3 1 58 22 14 49 12 48 166 1 2 32 0 101 2 0 132 1 3 52 17 56 234 3 1 546 109 6 7 489 34 94 170 40 18 170 5 9 140 733 122 85 1 78 70 14 690 32 1293 110 92 16 9 169 38 0 3 236 6 0 10 54 25 21 4 0 669 150 26 7 22 286 61 5 4 22 122 1 13 17 72 28 126 111 26 466 21 50 0 0 60 8 37 76 248 5 0 90 41 56 7 15 59 16 19 88 7 1 28 16 602 28 61 86 14 22 103 5 11 16 12 3 4 30 69 3 181 31 114 19 73 24 9 41 58 49 21 0 10 15 6 24 1 9 1 7 0 0 69 230 4 82 34 3 60 8 2 13 0 12 0 12 86 153 178 18 35 49 0 8 11 0 18 213 0 425 72 43 117 32 180 122 12 15 42 55 277 65 12 198 0 400 13 15 19 1 80 82 30 84 217 0 0 25 22 11 76 127 301 22 24 5 23 10 216 74 60 35 151 62 5 196 46 543 289 138 17 9 0 0 88 7 38 1 51 22 190 215 149 22 92 60 39 154 2 18 15 0 22 71 4 0 2 30 5 8 69 316 5 10 266 2 28 32 1 189 89 770 569 6 14 10 31 0 1 183 9 22 329 0 16 20 8 196 6 17 36 10 9 0 0 46 6 29 8 0 0 14 4 13 28 1 11 44 1 303 1 31 23 4 15 22 1 48 1 2 0 13 0 3 85 513 166 168 12 61 0 0 23 161 167 14 47 175 81 3 636 56 14 4 148 68 2 16 9 19 466 32 243 107 1 0 SP202 Bacteria;Firmicutes;Bacilli;Lactobacillales;Streptococcaceae;Streptococcus;oralis_subsp._dentisani_clade_058 37 220 1235 82 2 1408 0 42 219 14 365 3303 1155 358 343 3869 308 112 6679 1410 0 1 11 7076 407 3 166 2 16 80 1738 169 877 462 262 967 20 649 15 119 7523 25011 1566 17 5 2264 225 1136 2837 5027 14 8 19 1320 1532 38 192 551 117 1546 380 1843 104 2 4945 79 22 2684 2403 5837 7 772 3094 1 1 4961 593 1759 11 1384 4849 1087 40 617 1793 787 1590 324 226 2 470 525 86 1352 19 74 176 277 479 128 138 1050 14 6 30 7 1813 233 8670 12 14 18 5 228 29 32 116 0 25 8708 17 439 1 5086 375 229 6 208 0 1704 5198 4491 2 59 140 1689 1675 337 71 1310 750 201 280 934 98 4883 2772 3371 376 272 245 871 271 1175 25 2360 280 3448 1481 2316 694 817 690 127 713 5 1441 1983 1114 415 6 7 751 527 14 632 2891 2625 2262 9599 24 175 1200 1717 134 2272 1307 46 9 21 243 7 1019 420 1 140 0 62 218 868 144 231 1614 1 487 0 259 11207 127 90 34 174 8 120 106 56 18 9 174 2050 699 253 39 980 17 22 3437 2664 108 3 1305 1155 68 4 520 1179 869 901 18 744 9 539 23 9 21 55 826 1303 1785 45 7 172 281 495 74 467 2637 1001 1 46 11 13 714 247 379 318 2349 261 0 0 0 0 0 0 0 0 0 0 0 0 0 0 0 0 0 0 0 0 0 0 0 0 0 0 0 0 0 0 0 0 0 0 0 0 0 0 0 0 0 0 0 0 0 0 0 0 0 0 0 0 0 0 0 0 0 0 0 0 0 0 0 0 0 0 0 0 0 0 0 0 0 0 0 0 0 0 0 0 0 0 0 0 0 0 0 0 0 0 0 0 0 0 0 0 0 0 0 0 0 0 0 0 0 0 0 0 0 0 0 0 0 0 0 0 0 0 0 0 0 0 0 0 0 0 0 0 0 0 0 0 0 0 0 0 0 0 0 0 0 0 0 0 0 0 0 0 0 0 0 0 0 0 0 0 0 0 0 0 0 0 0 0 0 0 0 0 0 0 0 0 0 0 0 0 0 0 0 0 0 0 0 0 0 0 0 0 0 0 0 0 0 0 0 0 0 0 0 0 0 0 0 0 0 0 0 0 0 0 0 0 0 0 0 0 0 0 0 0 0 0 0 0 0 0 0 0 0 0 0 0 0 0 0 0 0 0 0 0 0 0 0 0 0 0 0 0 0 0 0 0 0 0 0 0 0 0 0 0 0 0 0 0 0 0 0 0 0 0 0 0 0 0 0 0 0 0 0 0 0 0 0 0 0 0 0 0 0 0 0 0 0 0 0 0 0 0 0 0 0 0 0 0 0 0 0 0 0 0 0 0 0 0 0 0 0 0 0 0 0 0 0 0 0 0 0 0 0 0 0 0 0 0 0 0 0 0 0 0 0 0 0 0 0 0 0 0 0 0 0 0 0 0 0 0 0 0 0 0 0 0 0 0 0 0 0 0 0 0 0 0 0 0 0 0 0 0 0 0 0 0 0 0 0 0 0 0 0 0 0 0 0 0 0 0 0 0 0 0 0 0 0 0 0 0 0 0 0 0 0 0 0 0 0 0 0 0 0 0 0 0 0 0 0 0 0 0 0 0 0 0 0 0 0 0 0 0 0 0 0 0 0 0 0 0 0 0 0 0 0 0 0 0 0 0 0 0 0 0 0 0 0 0 0 0 0 0 0 0 0 0 0 0 0 0 0 0 0 0 0 0 0 0 0 0 0 0 0 0 0 0 0 0 0 0 0 0 0 0 0 0 0 0 0 0 0 0 0 0 0 0 0 0 0 0 0 0 0 0 0 0 0 0 0 0 0 0 0 0 0 0 0 0 0 0 0 0 0 0 0 0 0 0 0 0 0 0 0 0 0 0 0 0 0 0 0 0 0 0 0 0 0 0 0 0 0 0 0 0 0 0 0 0 0 0 0 0 0 0 0 0 0 0 0 0 0 0 0 0 0 0 0 0 0 0 0 0 0 0 0 0 0 0 0 0 0 0 0 0 0 0 0 0 0 0 0 0 0 0 0 0 0 0 0 0 0 0 0 0 0 0 0 0 0 0 0 0 0 0 0 0 0 0 0 0 0 0 0 0 0 0 0 0 0 0 0 0 0 0 0 0 0 0 0 0 0 0 0 0 0 0 0 0 0 0 0 0 0 0 0 0 0 0 0 0 0 0 0 0 0 0 0 0 0 0 0 0 0 0 0 0 0 0 0 0 0 0 0 0 0 0 0 0 0 0 0 0 0 0 0 0 0 0 0 0 0 0 0 0 0 0 0 0 0 0 0 0 0 0 0 0 0 0 0 0 0 0 0 0 0 0 0 0 0 0 0 0 0 0 0 0 0 0 0 0 0 0 0 0 0 0 0 0 0 0 0 0 0 0 0 0 0 0 0 0 0 0 0 0 0 0 0 0 0 0 0 0 0 0 0 0 0 0 0 0 0 0 0 0 0 0 0 0 0 0 0 0 0 0 0 0 0 0 0 0 0 0 0 0 0 0 0 0 0 0 0 0 0 0 0 0 0 0 0 0 0 0 0 0 0 0 0 0 0 0 0 0 0 0 0 0 0 0 0 0 0 0 0 0 0 0 0 0 0 0 0 0 0 0 0 0 0 0 0 0 0 0 0 0 0 0 0 0 0 0 0 0 0 0 0 0 0 0 0 0 0 0 0 0 0 0 0 0 0 0 0 0 0 0 0 0 0 0 0 0 0 0 0 0 0 0 0 0 0 0 0 0 0 0 0 0 0 0 0 0 0 0 0 0 0 0 0 0 0 0 0 0 0 0 0 0 0 0 0 0 0 0 0 0 0 0 0 0 0 0 0 0 0 0 0 0 0 0 0 0 0 0 0 0 0 0 0 0 0 0 0 0 0 0 0 0 0 0 0 0 0 0 0 0 0 0 0 0 0 0 0 0 0 0 0 0 0 0 0 0 0 0 0 0 0 0 0 0 0 0 0 0 0 0 0 0 0 0 0 0 0 0 0 0 0 0 0 0 0 0 0 0 0 0 0 0 0 0 0 0 0 0 0 0 0 0 0 0 0 0 0 0 0 0 0 0 0 0 0 0 0 0 0 0 0 0 0 0 0 0 0 0 0 0 0 0 0 0 0 0 0 0 0 0 0 0 0 0 0 0 0 0 0 0 0 0 0 0 0 0 0 0 0 0 0 0 0 0 0 0 0 0 0 0 0 0 0 0 0 0 0 0 0 0 0 0 0 0 0 0 0 0 0 0 0 0 0 0 0 0 0 0 0 0 0 0 0 0 0 0 0 0 0 0 0 0 0 0 0 0 0 0 0 0 0 0 0 0 0 0 0 0 0 0 0 0 0 0 0 0 0 0 0 0 0 0 0 0 0 0 0 0 0 0 0 0 0 0 0 0 0 0 0 0 0 0 0 0 0 0 0 0 0 0 0 0 0 0 0 0 0 0 0 0 0 0 0 0 0 0 0 0 0 0 0 0 0 0 0 0 0 0 0 0 0 0 0 0 0 0 0 0 0 0 0 0 0 0 0 0 0 0 0 0 0 0 0 0 0 0 0 0 0 0 0 0 0 0 0 0 0 0 0 0 0 0 0 0 0 0 0 0 0 0 0 0 0 0 0 0 0 0 0 0 0 0 0 0 0 0 0 0 0 0 0 0 0 0 0 0 0 0 0 0 0 0 0 0 0 0 0 0 0 0 0 0 0 0 0 0 0 0 0 0 0 0 0 0 0 0 0 0 0 0 0 0 0 0 0 0 0 0 0 0 0 0 0 0 0 0 0 0 0 0 0 0 0 0 0 0 0 0 0 0 0 0 0 0 0 0 0 0 0 0 0 0 0 0 0 0 0 0 0 0 0 0 0 0 0 0 0 0 0 0 0 0 0 0 0 0 0 0 0 0 0 0 0 0 0 0 0 0 0 0 0 0 0 0 0 0 0 0 0 0 0 0 0 0 0 0 0 0 0 0 0 0 0 0 0 0 0 0 0 0 0 0 0 0 0 0 0 0 0 0 0 0 0 0 0 0 0 0 0 0 0 0 0 0 0 0 0 0 0 0 0 0 0 0 0 0 0 0 0 0 0 0 0 0 0 0 0 0 0 0 0 0 0 0 0 0 0 0 0 0 0 0 0 0 0 0 SP203 Bacteria;Firmicutes;Bacilli;Lactobacillales;Streptococcaceae;Streptococcus;oralis_subsp._tigurinus_clade_071 5 109 40 32 21 64 20 26 532 575 33 284 167 10 25 9 22 179 57 4 15 7 22 115 39 19 151 38 254 341 29 28 78 83 56 29 29 176 34 123 34 105 31 68 42 7 84 193 178 395 38 4 16 148 9 19 12 113 168 98 225 49 32 109 5 394 161 9 6218 22 293 54 12 19 91 491 47 25 13 173 67 9 338 121 0 13 24 173 65 5 60 34 776 86 44 56 211 37 38 317 501 6722 49 478 80 202 3 50 14 256 292 389 41 23 22 49 8 15 32 36 42 462 2 90 40 477 6 6 15 402 18 5 22 257 22 12 3 14 125 222 181 339 762 93 454 148 33 38 13 14 148 32 43 77 113 29 22 170 1356 548 96 158 3 8 31 56 138 1003 114 100 373 6 31 204 61 45 317 272 9 132 3 185 66 82 55 95 0 32 56 12 28 20 116 29 70 164 10 33 93 51 331 13 31 19 24 2 146 6928 1172 3415 84 55 10 5 33 39 24 11 394 24 95 10 112 140 10 20 54 72 531 0 16 68 679 27 14 52 425 36 15 934 71 1 155 228 86 34 36 1 4 37 97 4 24 16 0 90 22 8 29 7 120 21 164 61 55 25 5 480 0 0 0 0 0 0 0 0 0 0 0 0 0 0 0 0 0 0 0 0 0 0 0 0 0 0 0 0 0 0 0 0 0 0 0 0 0 0 0 0 0 0 0 0 0 0 0 0 0 0 0 0 0 0 0 0 0 0 0 0 0 0 0 0 0 0 0 0 0 0 0 0 0 0 0 0 0 0 0 0 0 0 0 0 0 0 0 0 0 0 0 0 0 0 0 0 0 0 0 0 0 0 0 0 0 0 0 0 0 0 0 0 0 0 0 0 0 0 0 0 0 0 0 0 0 0 0 0 0 0 0 0 0 0 0 0 0 0 0 0 0 0 0 0 0 0 0 0 0 0 0 0 0 0 0 0 0 0 0 0 0 0 0 0 0 0 0 0 0 0 0 0 0 0 0 0 0 0 0 0 0 0 0 0 0 0 0 0 0 0 0 0 0 0 0 0 0 0 0 0 0 0 0 0 0 0 0 0 0 0 0 0 0 0 0 0 0 0 0 0 0 0 0 0 0 0 0 0 0 0 0 0 0 0 0 0 0 0 0 0 0 0 0 0 0 0 0 0 0 0 0 0 0 0 0 0 0 0 0 0 0 0 0 0 0 0 0 0 0 0 0 0 0 0 0 0 0 0 0 0 0 0 0 0 0 0 0 0 0 0 0 0 0 0 0 0 0 0 0 0 0 0 0 0 0 0 0 0 0 0 0 0 0 0 0 0 0 0 0 0 0 0 0 0 0 0 0 0 0 0 0 0 0 0 0 0 0 0 0 0 0 0 0 0 0 0 0 0 0 0 0 0 0 0 0 0 0 0 0 0 0 0 0 0 0 0 0 0 0 0 0 0 0 0 0 0 0 0 0 0 0 0 0 0 0 0 0 0 0 0 0 0 0 0 0 0 0 0 0 0 0 0 0 0 0 0 0 0 0 0 0 0 0 0 0 0 0 0 0 0 0 0 0 0 0 0 0 0 0 0 0 0 0 0 0 0 0 0 0 0 0 0 0 0 0 0 0 0 0 0 0 0 0 0 0 0 0 0 0 0 0 0 0 0 0 0 0 0 0 0 0 0 0 0 0 0 0 0 0 0 0 0 0 0 0 0 0 0 0 0 0 0 0 0 0 0 0 0 0 0 0 0 0 0 0 0 0 0 0 0 0 0 0 0 0 0 0 0 0 0 0 0 0 0 0 0 0 0 0 0 0 0 0 0 0 0 0 0 0 0 0 0 0 0 0 0 0 0 0 0 0 0 0 0 0 0 0 0 0 0 0 0 0 0 0 0 0 0 0 0 0 0 0 0 0 0 0 0 0 0 0 0 0 0 0 0 0 0 0 0 0 0 0 0 0 0 0 0 0 0 0 0 0 0 0 0 0 0 0 0 0 0 0 0 0 0 0 0 0 0 0 0 0 0 0 0 0 0 0 0 0 0 0 0 0 0 0 0 0 0 0 0 0 0 0 0 0 0 0 0 0 0 0 0 0 0 0 0 0 0 0 0 0 0 0 0 0 0 0 0 0 0 0 0 0 0 0 0 0 0 0 0 0 0 0 0 0 0 0 0 0 0 0 0 0 0 0 0 0 0 0 0 0 0 0 0 0 0 0 0 0 0 0 0 0 0 0 0 0 0 0 0 0 0 0 0 0 0 0 0 0 0 0 0 0 0 0 0 0 0 0 0 0 0 0 0 0 0 0 0 0 0 0 0 0 0 0 0 0 0 0 0 0 0 0 0 0 0 0 0 0 0 0 0 0 0 0 0 0 0 0 0 0 0 0 0 0 0 0 0 0 0 0 0 0 0 0 0 0 0 0 0 0 0 0 0 0 0 0 0 0 0 0 0 0 0 0 0 0 0 0 0 0 0 0 0 0 0 0 0 0 0 0 0 0 0 0 0 0 0 0 0 0 0 0 0 0 0 0 0 0 0 0 0 0 0 0 0 0 0 0 0 0 0 0 0 0 0 0 0 0 0 0 0 0 0 0 0 0 0 0 0 0 0 0 0 0 0 0 0 0 0 0 0 0 0 0 0 0 0 0 0 0 0 0 0 0 0 0 0 0 0 0 0 0 0 0 0 0 0 0 0 0 0 0 0 0 0 0 0 0 0 0 0 0 0 0 0 0 0 0 0 0 0 0 0 0 0 0 0 0 0 0 0 0 0 0 0 0 0 0 0 0 0 0 0 0 0 0 0 0 0 0 0 0 0 0 0 0 0 0 0 0 0 0 0 0 0 0 0 0 0 0 0 0 0 0 0 0 0 0 0 0 0 0 0 0 0 0 0 0 0 0 0 0 0 0 0 0 0 0 0 0 0 0 0 0 0 0 0 0 0 0 0 0 0 0 0 0 0 0 0 0 0 0 0 0 0 0 0 0 0 0 0 0 0 0 0 0 0 0 0 0 0 0 0 0 0 0 0 0 0 0 0 0 0 0 0 0 0 0 0 0 0 0 0 0 0 0 0 0 0 0 0 0 0 0 0 0 0 0 0 0 0 0 0 0 0 0 0 0 0 0 0 0 0 0 0 0 0 0 0 0 0 0 0 0 0 0 0 0 0 0 0 0 0 0 0 0 0 0 0 0 0 0 0 0 0 0 0 0 0 0 0 0 0 0 0 0 0 0 0 0 0 0 0 0 0 0 0 0 0 0 0 0 0 0 0 0 0 0 0 0 0 0 0 0 0 0 0 0 0 0 0 0 0 0 0 0 0 0 0 0 0 0 0 0 0 0 0 0 0 0 0 0 0 0 0 0 0 0 0 0 0 0 0 0 0 0 0 0 0 0 0 0 0 0 0 0 0 0 0 0 0 0 0 0 0 0 0 0 0 0 0 0 0 0 0 0 0 0 0 0 0 0 0 0 0 0 0 0 0 0 0 0 0 0 0 0 0 0 0 0 0 0 0 0 0 0 0 0 0 0 0 0 0 0 0 0 0 0 0 0 0 0 0 0 0 0 0 0 0 0 0 0 0 0 0 0 0 0 0 0 0 0 0 0 0 0 0 0 0 0 0 0 0 0 0 0 0 0 0 0 0 0 0 0 0 0 0 0 0 0 0 0 0 0 0 0 0 0 0 0 0 0 0 0 0 0 0 0 0 0 0 0 0 0 0 0 0 0 0 0 0 0 0 0 0 0 0 0 0 0 0 0 0 0 0 0 0 0 0 0 0 0 0 0 0 0 0 0 0 0 0 0 0 0 0 0 0 0 0 0 0 0 0 0 0 0 0 0 0 0 0 0 0 0 0 0 0 0 0 0 0 0 0 0 0 0 0 0 0 0 0 0 0 0 0 0 0 0 0 0 0 0 0 0 0 0 0 0 0 0 0 0 0 0 0 0 0 0 0 0 0 0 0 0 0 0 0 0 0 0 0 0 0 0 0 0 0 0 0 0 0 0 0 0 0 0 0 0 0 0 0 0 0 0 0 0 0 0 0 0 0 0 0 0 0 0 0 0 0 0 0 0 0 0 0 0 0 0 0 0 0 0 0 0 0 0 0 0 0 0 0 0 0 SP204 Bacteria;Firmicutes;Erysipelotrichia;Erysipelotrichales;Erysipelotrichaceae;Solobacterium;moorei 1870 86 12 1165 40 1227 5 2831 42 28 1396 32 738 751 308 1013 211 24 596 1351 1352 4 150 54 389 1005 4 188 11 8 2248 2305 144 1216 894 666 242 121 130 10 7529 49 1325 1014 197 1962 6 25 4 50 526 1363 1405 14 1606 453 642 552 12 1687 385 17 187 15 3041 62 3 6302 449 1521 122 1558 249 52 50 1351 407 1026 49 358 4027 2287 68 281 2210 975 513 594 289 3347 246 677 73 734 1051 674 3 2323 53 332 64 575 125 661 56 70 2004 66 1890 86 2 63 177 320 1503 29 1367 3310 1072 556 276 906 865 561 1132 1165 668 2013 807 3 1695 3219 38 114 1036 412 2225 381 213 1116 32 2 21 149 3 758 1802 607 1239 110 2164 5592 626 473 1243 444 1398 337 646 490 133 30 1297 28 164 188 72 1077 53 48 4 0 269 197 914 506 902 743 188 145 20 320 453 1889 2691 417 1459 632 711 1844 3851 1630 406 1679 1417 82 2046 565 182 1799 5 2068 2248 1658 735 191 1 2 34 3 481 428 746 143 138 1467 25 818 0 2080 187 452 195 131 764 700 2216 131 5 636 4264 35 638 11 1251 1667 1212 546 3202 409 176 1583 3515 8 22 353 1264 1940 4176 115 1925 107 915 1880 114 497 3189 2303 38 1027 365 853 582 819 411 345 1104 617 0 0 0 0 0 0 0 0 2 0 0 0 0 0 3 1 0 0 0 0 0 1 9 0 0 0 0 0 0 0 0 0 0 0 4 0 0 0 0 0 1 0 0 0 0 0 1 0 0 0 0 0 0 0 0 0 0 0 0 0 0 0 1 0 0 0 0 0 0 0 0 0 0 0 0 0 0 0 1 0 0 0 0 0 0 0 0 0 0 0 0 0 0 0 0 0 0 0 0 0 0 0 0 0 0 0 0 1 0 2 0 0 0 0 0 0 0 0 0 0 0 0 0 0 0 0 0 0 0 0 0 0 0 0 0 0 0 0 0 0 0 0 0 0 0 0 0 0 0 0 0 1 0 0 0 0 1 0 0 0 0 0 0 0 0 0 0 0 0 2 0 0 1 0 0 0 0 0 0 0 0 0 4 0 0 0 0 0 0 0 1 0 0 0 0 0 0 0 0 0 0 0 0 0 1 0 0 0 0 0 0 0 0 0 0 0 0 0 0 0 0 0 0 0 0 0 0 0 0 0 0 0 1 0 0 0 0 0 0 0 2 0 0 0 0 0 0 1 1 0 0 0 0 0 0 0 0 0 0 0 0 0 0 0 0 0 0 0 0 0 0 0 0 0 1 1 0 0 0 2 0 0 0 1 0 0 0 0 0 0 0 0 0 0 0 0 1 0 0 0 0 0 0 0 0 0 0 0 0 0 0 0 0 0 0 0 0 0 0 0 0 0 0 0 0 0 0 0 0 0 0 0 0 0 0 0 0 0 0 0 0 0 1 0 0 0 0 0 1 0 0 0 0 0 0 0 0 0 0 0 0 0 0 0 0 0 0 0 0 0 2 0 0 0 0 0 0 0 0 0 1 0 0 0 0 0 0 0 0 0 0 0 0 0 0 1 0 0 2 0 0 0 0 0 0 0 0 0 0 0 0 0 0 0 0 2 0 0 0 0 0 0 0 3 0 0 0 0 0 0 0 0 1 0 0 0 0 0 0 0 0 0 2 0 0 0 0 0 0 0 0 0 0 0 0 0 0 1 1 1 0 0 0 0 0 0 0 0 0 0 0 0 0 0 2 0 0 0 0 0 0 0 0 0 0 0 0 0 0 0 0 0 0 0 0 0 0 0 0 0 0 0 0 0 5 0 0 0 0 0 0 0 0 0 0 0 0 0 0 0 0 0 1 0 0 0 0 0 0 0 0 0 0 0 1 0 1 0 0 0 0 0 0 0 0 0 0 1 0 0 0 0 0 0 0 1 0 0 0 0 0 9 4 0 0 0 0 0 0 0 0 0 0 0 0 0 0 0 0 0 0 0 0 0 0 0 0 0 0 0 0 0 0 0 0 5 0 0 0 0 0 0 0 0 0 0 0 0 0 0 0 17 0 2 0 0 0 0 0 0 0 0 0 0 0 0 0 0 0 0 0 0 0 0 1 0 0 0 0 0 0 0 0 0 0 0 0 0 0 0 0 0 0 0 0 0 0 0 0 0 0 0 1 0 0 0 0 0 0 0 0 0 0 0 0 0 0 0 0 0 0 0 0 0 0 2 1 0 0 0 0 0 0 0 0 0 0 0 0 0 0 0 0 0 0 0 0 0 0 0 0 0 0 0 4 0 0 0 0 0 0 0 0 0 0 0 0 1 0 0 0 1 0 0 0 1 0 1 0 0 4 0 1 0 0 0 2 0 0 0 0 0 0 0 0 0 0 0 0 1 0 1 0 1 0 5 0 2 0 0 0 0 0 0 9 1 1 0 0 3 0 0 1 0 1 0 0 0 3 1 0 0 1 0 0 0 0 11 1 0 0 0 3 2 1 0 0 0 2 0 2 0 4 0 0 0 0 1 0 1 0 2 0 2 1 0 0 0 1 0 6 0 1 0 0 1 0 0 0 0 3 0 0 4 0 0 0 0 2 3 0 0 0 0 0 0 0 3 0 0 0 0 0 29 0 0 1 0 7 0 6 0 0 0 0 2 2 3 0 0 0 0 0 0 1 3 11 7 0 0 1 0 0 1 0 5 0 0 1 17 0 0 0 0 0 3 0 0 0 0 0 3 0 0 3 1 0 1 1 1 0 0 0 0 1 0 0 0 0 0 1 1 1 0 0 0 2 1 0 1 0 1 6 1 0 0 2 0 0 1 0 1 3 0 0 12 1 1 7 1 0 2 0 0 0 1 0 1 0 0 0 1 0 2 6 0 0 0 2 1 0 21 0 1 2 0 0 0 0 0 0 1 0 0 0 0 0 0 0 2 6 0 0 0 0 0 0 0 0 0 0 1 0 1 0 0 1 0 1 5 1 0 4 0 1 12 0 0 2 1 0 0 0 1 2 0 0 3 0 1 1 0 0 0 0 2 2 4 1 0 0 3 2 29 0 0 0 0 0 0 0 2 4 1 0 1 0 0 0 1 0 0 0 2 0 2 0 0 3 0 0 0 1 9 0 0 0 0 4 0 0 0 0 1 1 2 4 1 2 0 0 0 0 0 1 2 2 1 0 0 0 23 0 10 0 2 0 0 1 5 0 0 0 0 0 0 0 11 0 1 2 2 3 3 3 0 0 0 1 3 2 0 4 3 0 9 7 0 4 1 0 0 0 2 3 0 0 1 4 7 0 0 103 0 0 11 0 1 1 1 0 37 0 2 0 8 2 0 0 80 2 2 0 2 0 0 2 22 2 0 1 0 1 0 0 1 0 1 0 15 1 3 1 0 0 0 6 3 0 1 0 1 4 0 0 0 2 2 0 0 11 1 0 2 1 0 4 0 0 3 2 0 5 9 0 0 0 38 0 6 0 0 2 7 0 0 0 4 0 0 3 1 0 1 0 2 0 2 1 0 0 3 0 0 0 0 0 1 1 1 2 4 0 0 0 0 2 0 8 0 1 0 3 1 1 1 0 1 0 2 0 1 0 0 1 0 0 0 1 1 0 0 0 1 0 0 0 1 0 0 0 1 0 0 6 0 0 1 0 0 1 0 0 0 0 0 0 4 0 0 0 40 3 1 2 0 3 0 0 0 0 0 0 0 0 0 0 2 2 0 1 0 0 3 0 7 1 0 0 0 0 1 0 0 0 0 2 0 2 1 0 0 0 0 4 2 4 0 3 2 7 0 1 0 0 9 0 0 3 1 2 0 0 13 0 0 0 0 0 0 3 0 5 0 2 0 0 4 0 0 0 35 6 0 1 0 0 0 0 1 2 1 0 0 1 0 5 1 34 0 0 0 1 0 0 1 0 0 1 2 0 1 1 1 5 1 7 2 0 2 0 0 0 1 0 0 0 0 0 2 3 30 0 2 0 0 21 2 0 24 5 22 0 2 1 0 0 0 0 0 0 0 17 0 1 0 0 2 0 0 0 0 0 0 0 0 0 2 0 0 0 2 0 0 0 0 2 2 1 0 0 0 0 0 0 0 0 0 3 0 0 1 0 0 13 8 0 1 1 2 0 0 0 5 0 0 4 6 0 0 28 0 0 0 25 0 0 0 0 0 0 1 1 0 0 0 SP206 Bacteria;Absconditabacteria_(SR1);Absconditabacteria_(SR1)_[C-1];Absconditabacteria_(SR1)_[O-1];Absconditabacteria_(SR1)_[F-1];Absconditabacteria_(SR1)_[G-1];bacterium HMT875 0 0 0 0 0 0 0 0 1 0 0 0 0 18 0 0 65 0 3 208 0 0 2 0 7 0 0 0 0 0 76 126 80 0 0 0 3 0 0 12 0 50 13 0 0 129 0 0 0 0 0 0 0 1 0 21 0 2 0 14 0 0 1 0 121 125 0 5 1065 233 0 0 1 0 0 188 27 3 0 3 0 15 1 65 37 8 0 1 0 0 5 0 11 9 0 82 0 7 19 0 2 8 0 0 68 9 22 0 81 1 0 4 1 0 95 507 18 0 9 109 0 0 5 0 0 3 0 0 0 0 0 363 0 1 12 1388 82 0 0 1 1 0 0 10 0 0 45 723 0 92 0 1 0 0 0 6 35 0 0 0 16 48 4 0 0 0 9 0 1 0 0 0 12 15 0 0 10 12 14 0 0 2 246 3 0 0 22 0 0 75 0 23 285 6 2 0 0 16 14 11 0 4 8 0 0 0 5 2 2 0 0 0 2 0 0 0 1 0 4 0 59 0 0 3 0 0 106 25 0 0 0 2 5 0 0 2 2 2 1 150 0 3 0 3 0 0 3 0 188 0 1 528 6 0 0 0 0 0 0 0 0 0 3 0 0 0 0 0 0 0 0 0 1 0 0 0 0 0 0 0 0 0 0 0 0 0 0 0 0 0 1 0 2 0 8 0 0 0 0 0 0 0 0 0 0 0 0 0 0 0 0 0 0 0 0 0 0 0 0 0 0 0 0 0 0 0 0 0 0 0 0 0 0 0 0 0 0 0 0 0 0 0 0 0 0 1 0 0 0 0 0 0 0 0 0 0 0 0 0 0 0 0 0 0 0 0 0 0 0 0 0 0 0 0 0 0 0 0 0 0 0 0 0 0 0 0 0 0 0 0 0 0 0 0 0 0 0 0 0 0 0 0 0 0 0 0 0 0 0 0 0 0 0 0 0 0 0 0 0 0 0 0 0 0 0 0 0 0 0 0 0 0 0 0 0 0 0 0 0 0 0 0 0 0 0 0 0 0 25 0 1 0 0 0 0 0 0 0 0 0 0 0 0 0 0 0 0 0 0 0 0 0 0 20 0 0 0 0 0 0 0 0 0 0 10 1 4 1 0 0 0 0 0 0 0 0 0 0 0 0 0 0 0 0 0 0 0 0 0 0 0 0 0 0 0 0 0 0 0 0 0 0 0 0 0 0 0 1 0 0 0 0 0 0 0 0 4 0 0 0 0 1 0 0 0 0 5 0 0 0 0 0 0 0 0 0 0 0 0 6 0 0 2 0 0 0 0 0 0 0 0 0 0 0 0 0 0 0 0 0 1 0 0 0 0 0 0 0 0 0 0 0 0 0 0 0 0 0 0 0 0 0 0 0 0 3 0 0 0 0 2 0 0 2 0 0 0 0 0 0 0 0 0 0 0 0 0 0 0 0 0 0 0 0 0 0 0 0 0 0 0 0 1 0 1 0 0 0 0 0 0 0 0 0 0 0 0 0 0 0 0 0 0 0 0 0 0 0 0 0 0 0 0 0 0 0 2 0 0 0 0 3 0 1 0 0 0 10 0 0 0 0 0 0 0 0 0 0 0 0 0 0 0 0 0 0 0 0 0 0 0 0 0 0 0 0 0 0 0 0 0 0 0 0 0 0 5 63 0 0 0 0 0 0 0 0 0 0 3 0 0 0 0 0 1 0 0 0 0 0 0 0 5 0 0 0 2 1 0 71 0 14 0 0 0 0 192 0 0 0 0 0 0 0 0 0 0 0 0 0 0 0 0 0 0 0 0 0 0 0 0 0 0 0 0 0 0 0 0 0 0 0 0 0 0 0 0 0 0 0 0 0 0 0 1 0 0 0 0 0 0 0 0 0 0 0 0 0 2 0 24 0 0 0 0 0 0 0 0 1 0 0 0 0 0 0 0 0 0 0 0 0 0 0 0 0 0 0 0 0 0 0 0 0 2 0 0 3 1 0 0 0 0 0 0 0 1 0 0 0 0 0 0 0 0 0 0 0 0 0 0 0 0 0 0 0 0 0 0 0 0 0 0 0 0 0 0 0 47 0 0 3 0 1 0 7 0 0 0 0 0 0 0 1 0 0 0 0 0 0 0 0 0 0 0 0 0 0 0 0 0 0 0 0 0 0 0 0 0 0 0 0 0 0 0 0 0 0 0 0 0 0 0 0 0 0 0 0 0 0 0 0 0 0 0 0 0 0 0 0 0 0 0 0 0 0 0 0 0 0 1 0 0 0 0 1 1 0 0 0 0 0 0 0 0 0 0 0 6 0 0 0 0 0 6 0 0 0 0 0 0 0 0 0 0 0 0 2 0 0 0 0 1 0 0 0 0 0 0 0 0 0 0 19 0 0 0 0 0 0 0 0 0 0 0 0 4 44 0 0 1 5 0 0 0 0 0 0 0 0 0 0 0 0 1 0 0 5 0 0 0 0 0 0 0 0 1 0 0 0 0 0 0 0 0 0 0 0 1 0 0 0 0 0 0 0 0 0 0 0 0 0 0 0 0 0 0 0 0 0 0 0 0 0 0 0 0 0 0 0 0 2 0 0 0 0 0 0 0 0 0 0 0 0 20 0 0 0 0 0 0 0 0 0 0 0 0 2 0 0 0 1 52 1 1 0 3 5 0 0 0 0 0 0 0 0 0 0 0 0 0 2 2 1 6 1 1 0 0 0 0 0 0 0 0 0 2 23 1 1 4 0 0 0 3 0 0 0 0 0 0 0 0 0 0 0 0 0 0 1 0 0 0 0 0 0 0 0 0 0 0 0 0 0 0 5 0 0 0 0 0 3 0 0 0 3 0 8 0 2 0 1 0 4 1 0 2 0 0 0 0 0 0 1 0 0 0 0 1 0 0 0 0 4 0 0 0 0 0 5 2 0 0 3 0 0 0 0 0 0 9 0 0 0 0 0 0 1 0 0 0 0 0 5 0 1 0 0 0 0 0 0 0 0 0 0 0 0 0 24 0 1 0 0 0 0 0 0 0 0 0 0 0 0 0 0 0 0 0 0 0 0 1 0 0 3 6 0 0 0 0 3 10 11 0 31 2 1 0 0 1 0 0 0 0 0 78 0 0 0 0 0 0 0 0 0 0 0 0 0 0 0 0 2 0 0 0 0 0 0 0 0 0 0 0 0 0 0 12 0 0 0 0 0 0 0 0 8 0 3 0 0 0 0 0 0 0 0 0 0 0 0 0 0 0 0 0 0 0 0 0 0 0 0 0 0 0 5 0 0 0 0 0 0 0 0 0 0 0 0 0 0 0 14 1 2 0 1 0 0 0 0 0 0 0 7 0 0 0 0 0 0 0 0 0 0 0 1 0 0 0 0 0 1 0 0 0 0 0 0 0 0 0 1 0 0 0 0 10 0 0 3 0 0 0 3 0 15 0 0 0 0 0 0 0 0 13 0 0 0 0 0 0 0 0 0 0 0 0 0 0 0 0 0 0 15 0 0 1 0 0 0 1 0 0 0 0 0 1 0 0 3 0 2 0 3 0 14 0 1 0 0 1 0 2 0 0 0 0 0 0 5 1 0 0 0 0 0 0 0 0 0 0 0 0 0 0 0 0 0 0 2 0 0 0 1 0 0 0 0 0 3 8 0 0 0 0 4 0 0 0 0 0 0 0 0 0 0 0 0 0 0 0 0 2 0 0 0 0 0 0 0 0 0 3 0 3 4 0 0 0 0 0 0 0 0 0 0 1 0 2 0 0 0 1 0 0 0 0 0 1 17 0 20 0 0 0 0 2 0 0 0 0 0 0 0 0 0 12 0 4 0 3 0 2 0 1 0 0 0 11 3 0 22 0 0 31 0 0 0 0 0 0 0 0 0 1 0 0 0 0 0 9 3 0 0 0 0 1 0 4 1 0 0 0 0 0 0 0 4 0 0 0 0 0 0 0 0 3 0 0 0 1 0 0 0 0 0 0 0 0 0 0 0 0 0 0 0 0 0 0 0 0 0 0 0 0 0 0 0 0 0 0 0 0 0 0 1 0 0 0 0 0 0 0 0 0 1 0 0 0 0 0 8 2 0 0 0 0 0 0 18 0 0 0 2 8 0 0 0 0 0 0 0 0 0 0 0 3 5 4 0 0 0 SP208 Bacteria;Bacteroidetes;Bacteroidia;Bacteroidales;Prevotellaceae;Prevotella;pallens 33 21 0 38 3 133 0 378 1 16 406 14 125 8 4 81 15 4 1639 1068 18 1 36 14 9 28 0 3 3 4 31 134 4 73 174 12 43 2 5 3 238 0 23 105 7 176 0 0 2 12 701 235 563 0 357 7 841 107 1 316 0 1 2 15 1159 12 1 4086 65 88 114 23 13 0 22 0 215 52 27 0 21 103 1 32 942 48 11 205 2 3372 1 78 8 1 38 3 0 1 1 112 1 23 0 33 2 8 105 1 903 5 3 3 84 163 545 2 258 676 1384 12 16 55 182 170 1104 70 1584 115 1704 0 1516 653 5 17 1013 13 4084 83 12 44 8 1 3 1 0 742 806 1423 200 0 763 0 25 16 7 106 3812 3 200 22 2 1 14 4 1 21 5 76 1 0 3 0 1 7 126 1 41 26 1 6 4 0 50 514 1230 170 17 25 68 684 163 2 1451 56 432 54 871 1109 123 22 0 565 546 2189 9 1376 0 2 0 2 646 7 205 11 37 339 18 569 0 120 59 382 11 46 1542 153 214 5 1 4599 190 1 19 1 10 2945 379 350 252 1 4 72 17523 5 12 378 211 24 3661 2 1846 0 0 182 0 2 39 5 0 821 4 580 10 1023 3204 32 364 44 0 0 1 0 0 0 0 0 0 0 1 0 9 3 0 0 0 0 0 2 0 0 24 0 0 0 0 3 0 21 0 0 0 0 130 22 0 0 0 0 0 0 0 0 0 0 0 0 0 0 0 0 0 1 22 0 0 0 0 0 0 0 2 0 0 0 0 0 0 0 0 0 0 3 0 0 0 0 0 1 0 0 0 0 0 0 1 0 0 0 0 0 0 0 0 0 0 0 0 1 0 0 0 0 0 0 0 0 0 0 0 0 0 0 0 0 0 0 0 0 0 0 0 0 0 0 0 0 0 0 0 0 0 0 0 0 0 0 0 0 0 0 0 0 0 0 0 0 0 0 0 0 0 0 0 0 0 0 0 0 0 0 0 0 0 0 0 0 0 4 5 0 0 0 0 0 1 0 0 0 2 1 107 0 1 0 0 0 0 0 0 0 0 0 0 0 0 0 0 0 0 0 2 12 0 0 0 1 0 0 0 0 0 0 2 0 0 0 1 0 1 0 0 0 9 0 1 0 0 0 0 15 215 0 0 0 0 0 0 0 0 0 0 0 0 0 0 0 0 0 0 0 0 0 0 0 0 0 0 0 0 0 0 1 0 0 0 0 0 0 0 1 0 0 216 0 0 0 12 21 0 0 0 0 0 0 0 0 0 0 0 3 0 11 0 36 105 1 0 0 0 0 4 0 0 1 0 0 0 0 0 0 0 0 0 0 0 0 0 0 0 1 0 0 0 0 0 0 0 0 0 0 0 18 0 1 0 0 0 1 0 0 0 0 0 0 0 0 0 0 0 0 0 0 0 0 0 8 0 0 0 0 0 0 1 0 0 0 0 0 0 0 0 0 0 0 0 0 0 2 3 0 0 0 0 0 0 0 220 0 0 2 0 0 1 0 0 0 0 0 1 5 0 0 0 0 0 0 0 0 1 0 0 0 0 4 0 0 0 0 0 0 0 0 1 0 2 0 0 0 0 0 0 2 1 0 0 0 4 1 0 0 4 0 18 0 0 1 0 0 0 0 0 0 0 0 0 12 0 0 0 0 0 0 0 0 0 2 0 0 96 6 0 0 110 0 0 0 0 0 3 0 0 0 3 0 0 0 0 0 0 0 1 0 0 0 0 0 1 1 0 44 0 0 0 0 1 0 0 0 0 0 0 0 0 0 0 0 0 0 0 0 9 0 0 0 0 0 0 0 0 0 0 0 0 0 1 1 1 0 0 0 0 0 0 0 0 0 0 0 0 0 0 0 0 0 0 0 0 0 0 4 94 1 0 0 0 0 0 0 0 0 0 0 0 0 0 1 0 0 0 0 0 1 0 0 0 0 0 2 0 0 0 0 0 166 3 0 0 0 0 0 0 0 0 0 68 0 0 3 0 1 0 10 0 0 0 0 3 0 0 0 1 0 0 0 0 0 0 0 0 1 0 0 0 0 0 0 0 0 0 0 0 0 0 0 2 0 0 0 0 0 0 0 0 0 0 0 0 0 0 0 0 0 0 0 0 0 0 53 0 0 0 0 0 0 0 0 0 0 0 0 0 0 0 0 0 0 0 1 0 0 0 0 0 0 0 0 0 0 0 0 0 0 0 0 0 0 19 4 0 0 0 0 4 0 0 0 0 0 1 0 0 0 0 0 0 11 4 0 0 0 0 0 1 8 25 0 0 0 11 0 0 0 0 0 2 1 0 0 0 0 0 0 0 0 1 0 1 0 38 0 2 2 1 7 4 15 0 0 0 0 0 0 17 2 1 0 2 6 0 0 10 0 0 13 0 21 1 1 0 0 9 0 3 0 1 8 0 6 0 0 13 0 0 11 1 0 0 0 7 0 11 3 0 0 0 34 0 0 1 0 0 2 6 0 0 0 0 0 19 2 1 0 0 0 0 0 0 0 0 0 2 0 0 0 0 1 51 5 1 5 0 0 23 0 0 2 1 4 0 1 1 4 7 0 0 0 26 5 0 0 96 0 0 8 0 3 0 0 0 2 3 0 0 0 556 8 0 0 1 1 1 0 0 0 0 0 0 73 0 0 0 0 0 0 0 0 0 0 0 0 0 4 1 2 8 0 0 0 0 0 0 0 1 1 1 3 0 1 2 4 1 0 0 0 0 1 0 3 1 1 1 1 0 12 3 3 0 7 21 2 0 5 0 4 9 0 42 1 4 6 0 18 13 2 8 12 0 0 0 12 0 4 42 0 0 4 0 14 1 3 0 15 3 7 4 0 1 0 0 1 0 0 0 0 1 0 5 11 1 3 0 0 5 2 9 0 0 0 0 0 0 1 2 0 2 3 25 37 5 0 8 0 0 61 0 0 0 0 0 1 0 32 0 0 1 0 7 23 0 0 0 0 0 9 4 2 16 1 0 0 0 296 0 0 0 0 1 1 0 22 12 0 0 1 0 0 0 0 2 0 23 0 1 13 0 0 0 0 0 1 0 0 0 0 0 0 9 0 0 0 5 0 0 0 0 0 0 0 0 2 2 0 0 2 4 1 0 0 0 12 1 24 2 29 0 1 1 15 0 3 1 6 3 0 0 0 1 2 0 9 17 19 2 1 2 0 6 1 1 0 0 2 0 0 141 39 1 1 0 0 15 4 2 0 0 0 2 39 2 0 0 0 0 661 1 0 0 10 0 0 0 6 2 83 0 0 0 115 18 0 0 0 0 1 2 3 4 13 16 2 6 14 0 0 1 0 0 13 2 11 0 8 1 0 0 1 0 2 0 0 1 0 0 1 0 0 1 0 55 0 0 0 1 0 1 0 0 0 7 0 1 68 1 4 0 3 0 14 0 2 10 0 0 0 0 0 6 1 15 9 0 0 9 3 0 4 17 0 0 3 0 0 0 5 0 0 0 0 11 13 0 2 0 2 6 3 0 0 1 0 0 6 1 0 0 7 2 1 0 1 0 0 0 0 1 2 4 0 0 0 0 6 0 8 37 1 1 1 4 0 11 2 11 7 15 0 0 0 0 0 0 1 1 0 0 2 0 1 0 85 6 3 1 0 0 6 0 4 1 1 1 0 0 44 0 11 1 1 0 0 2 19 2 25 3 1 2 0 0 0 0 5 0 1 0 14 0 13 0 2 0 0 2 1 4 0 2 11 24 0 9 2 0 7 2 0 3 3 1 0 2 514 0 1 4 0 0 1 11 0 0 0 0 0 0 0 0 8 1 16 32 0 9 0 0 0 10 0 4 1 0 0 0 0 1 6 20 0 1 1 0 0 5 0 0 0 1 0 0 0 3 1 9 1 13 2 0 5 0 0 9 17 0 0 0 0 9 0 7 52 1 1 1 0 681 105 3 6 25 207 1 5 1 0 0 0 0 0 4 0 3 0 0 0 0 0 2 0 3 2 1 0 0 74 131 2 0 0 0 11 3 0 4 0 1 2 1 7 0 4 1 1 8 4 0 0 3 0 0 5 1 0 43 37 1 0 165 7 0 0 0 95 0 4 8 9 33 1 10 0 0 0 127 2 0 0 2 2 0 0 0 0 0 0 SP214 Bacteria;Saccharibacteria_(TM7);Saccharibacteria_(TM7)_[C-1];Saccharibacteria_(TM7)_[O-1];Saccharibacteria_(TM7)_[F-1];Saccharibacteria_(TM7)_[G-3];bacterium HMT351 212 2 40 1 7 26 0 82 3 2 29 23 5 45 0 117 34 2 157 52 22 13 42 6 13 76 0 17 2 1 7 16 5 27 0 21 171 6 25 4 70 25 25 116 41 0 4 0 20 16 14 149 108 4 166 16 25 5 4 107 0 7 22 1 137 6 0 47 32 68 18 10 24 0 2 78 61 34 6 38 0 33 8 40 11 38 20 288 3 48 6 0 16 14 41 155 1 1 0 34 111 34 3 10 1 7 25 4 87 4 0 14 5 22 77 6 35 24 83 10 4 12 3 42 24 26 83 12 40 5 37 1 15 10 120 276 181 150 68 30 34 1 5 25 5 108 47 119 90 39 14 102 63 195 43 185 249 20 4 57 31 5 160 4 2 30 13 105 79 11 0 2 7 30 55 128 37 42 2 7 19 17 35 135 35 102 52 151 0 73 24 15 73 74 39 56 80 170 86 9 12 20 35 5 7 7 5 6 5 0 51 16 27 13 12 59 1 93 2 3 15 39 19 4 26 7 39 0 0 70 67 6 97 1 62 99 46 65 92 34 11 13 88 1 7 32 248 19 29 8 38 29 21 21 2 19 53 107 0 127 63 5 185 63 1 48 78 39 0 0 0 0 0 1 1 0 0 0 3 0 1 1 0 2 0 0 0 0 0 0 11 0 0 0 1 0 0 0 0 0 0 0 0 0 0 0 0 0 3 0 0 0 0 0 0 0 0 0 0 0 0 0 8 0 0 0 0 0 0 0 0 0 0 0 0 0 0 0 0 0 0 0 0 0 0 0 0 0 0 0 0 0 0 0 0 0 0 0 0 0 0 0 0 0 0 0 0 0 1 0 0 0 0 3 0 0 0 0 0 0 0 0 0 0 0 0 0 0 0 0 0 0 0 1 0 0 0 0 0 0 0 0 0 0 0 0 0 1 0 0 0 2 0 1 0 0 0 0 0 0 0 0 0 0 0 0 0 0 0 0 0 0 0 0 0 0 1 0 0 0 0 0 0 0 0 0 0 0 0 0 0 0 3 0 0 0 0 0 0 3 0 0 0 1 0 0 0 0 0 0 0 0 0 0 0 0 0 0 0 1 0 0 0 0 0 1 0 1 0 4 0 0 0 0 1 0 0 0 0 0 8 0 0 0 0 0 0 0 0 0 0 0 0 0 0 0 0 0 0 0 0 0 0 0 0 2 0 1 0 0 0 0 0 0 0 0 0 0 0 0 0 0 0 0 0 0 0 1 0 0 10 0 0 0 0 0 0 0 0 6 0 1 0 0 3 1 0 0 0 0 0 0 0 0 0 0 0 0 0 0 0 0 0 0 0 0 0 0 0 0 0 0 0 0 0 5 0 0 0 0 0 3 0 1 0 0 0 0 0 0 0 0 0 0 0 0 0 0 0 0 0 0 0 0 0 1 0 0 0 0 1 0 0 0 0 0 6 0 0 0 0 5 0 1 0 0 0 0 0 0 0 0 0 0 0 1 8 0 0 0 0 0 3 1 0 0 1 0 0 0 0 0 0 0 0 0 1 0 0 0 0 0 0 0 0 0 3 0 0 0 1 0 0 0 0 0 0 0 0 0 0 0 0 0 0 0 2 2 0 1 0 0 7 0 0 0 0 0 0 0 0 0 0 0 0 0 1 2 0 0 0 1 0 0 0 0 0 0 0 0 0 0 0 0 0 0 0 0 1 0 0 0 1 0 0 1 0 0 0 2 0 0 0 0 0 0 0 0 0 0 0 0 2 0 0 0 1 0 0 0 0 0 0 0 0 0 0 0 0 0 0 0 0 0 0 0 1 0 0 0 0 0 0 0 0 0 0 0 0 0 0 0 0 0 0 0 0 0 0 0 0 1 0 0 0 0 0 0 0 0 0 0 0 0 0 0 1 0 0 0 0 0 0 0 0 0 0 0 0 0 0 1 1 0 2 0 0 0 0 0 0 0 0 0 0 0 0 0 0 0 0 0 0 3 0 0 0 0 0 0 0 0 0 0 0 0 0 0 0 0 0 0 0 0 0 0 0 0 1 0 0 0 1 0 0 0 0 0 2 0 1 6 0 0 0 0 0 4 0 0 0 0 0 0 0 0 0 0 0 0 0 0 1 0 0 0 0 2 1 0 0 0 2 0 0 0 3 0 0 0 0 0 0 1 0 0 0 0 0 0 0 0 0 0 0 0 0 0 0 0 0 0 0 1 1 0 2 1 26 0 0 0 0 0 0 0 0 1 1 0 0 0 0 0 0 0 1 0 0 1 0 0 0 1 0 15 0 0 1 0 0 0 0 0 0 0 0 0 0 0 0 0 0 0 1 0 3 0 0 0 0 0 0 0 0 0 3 0 0 0 0 1 0 0 0 0 1 0 0 1 2 0 0 0 0 0 0 0 0 1 1 0 0 0 3 18 0 0 0 0 0 0 0 0 0 0 0 0 0 0 0 0 0 0 0 1 0 0 1 0 0 0 0 0 0 0 0 0 2 0 0 0 0 0 0 0 0 0 0 0 0 0 0 0 0 1 0 0 0 0 0 0 1 0 0 0 0 0 0 0 0 7 0 0 1 0 0 0 0 0 0 0 0 2 0 1 0 0 0 1 4 0 0 0 0 0 0 0 0 0 0 0 0 0 1 0 0 0 0 0 0 2 0 0 0 0 0 0 1 0 0 6 0 0 1 1 0 0 0 0 0 0 2 0 0 0 0 1 1 0 0 0 0 0 0 0 0 0 0 0 0 0 0 0 0 0 0 0 0 0 1 2 0 2 1 0 0 0 0 1 0 0 1 0 1 0 0 0 0 0 0 0 6 0 0 0 0 5 0 0 0 0 0 0 2 0 2 0 0 0 1 0 0 0 0 0 1 1 0 1 0 0 0 1 1 0 0 0 0 0 0 0 0 0 0 0 0 2 0 0 0 0 0 3 0 0 0 0 0 0 0 2 0 0 0 0 0 0 0 0 0 0 0 0 0 0 1 0 0 0 0 0 0 0 0 0 0 0 0 0 1 0 0 0 0 0 0 0 0 0 0 0 0 0 0 1 0 0 0 0 0 0 0 0 1 2 0 0 0 2 0 2 0 1 4 0 0 0 0 0 1 0 0 2 0 0 1 0 1 0 0 0 0 1 0 0 1 0 0 0 0 0 0 0 0 1 0 0 0 0 2 0 0 0 0 0 0 0 0 0 0 0 0 0 0 0 0 0 0 0 1 0 0 0 0 2 1 0 1 0 0 0 0 1 0 1 0 0 0 0 8 1 0 0 1 0 0 2 0 0 0 1 0 0 0 0 0 0 0 0 2 0 3 1 2 0 0 0 0 4 0 1 0 5 0 0 0 0 0 1 0 0 0 0 0 1 0 0 0 0 0 0 2 1 0 0 0 0 0 0 0 0 0 0 0 1 0 0 0 1 0 1 0 0 0 0 1 0 0 1 0 0 0 1 0 0 0 0 0 3 0 0 0 0 0 2 3 0 0 5 1 0 1 0 0 0 1 0 0 1 0 1 0 0 0 0 3 0 1 0 0 11 0 0 0 0 0 0 0 0 2 0 1 0 0 0 1 1 1 0 0 0 0 2 2 2 0 1 0 0 0 0 0 1 1 0 0 0 0 0 0 0 0 0 0 0 0 0 0 0 0 0 0 3 0 1 0 0 1 0 1 0 1 0 0 0 0 0 0 0 0 1 0 2 0 0 0 3 5 1 0 0 1 0 0 1 2 0 0 0 0 0 0 0 0 0 0 0 0 0 0 1 0 2 0 0 0 0 0 1 0 0 1 0 0 0 0 1 0 0 0 0 0 0 0 0 0 0 0 0 0 0 1 0 2 0 2 1 0 0 0 0 0 0 0 0 0 0 0 0 0 0 0 0 0 0 0 0 1 0 3 0 0 0 0 0 0 1 0 0 0 2 0 0 0 0 0 0 12 1 0 1 0 0 0 0 0 0 0 0 0 0 0 1 0 0 0 0 0 0 0 0 0 5 4 2 0 0 0 4 1 0 0 0 3 0 0 2 0 0 0 0 0 1 0 0 0 0 0 0 0 0 8 8 1 0 0 0 0 0 0 1 0 0 0 1 0 0 5 0 0 0 3 0 1 0 0 0 3 0 0 0 0 0 SP217 Bacteria;Firmicutes;Bacilli;Lactobacillales;Streptococcaceae;Streptococcus;chosunense 1328 4767 319 703 118 1690 18955 13 281 2138 634 7606 669 858 604 433 481 4719 551 22 162 1300 6181 950 344 1034 654 161 14282 567 1989 128 2784 177 277 1509 686 5465 509 1722 4172 4962 400 393 3665 2389 927 990 7740 854 410 61 594 109 1104 472 128 1793 9543 107 1004 11276 99 5150 614 979 29339 85 3150 1453 2010 216 2716 366 7119 283 489 400 12494 5942 416 3426 1343 1627 106 5977 1056 716 9077 432 2552 1778 6080 1093 81 249 7922 1073 2980 740 974 2223 1953 229 6679 544 346 50534 987 3908 11128 1014 2491 5399 4480 1292 49 5149 2481 4224 1555 1650 358 4211 1915 792 48 178 189 1166 201 569 203 5540 838 1155 206 829 329 25 1493 2712 1594 1997 8467 2731 488 1054 740 1211 430 660 769 3088 1270 723 3020 844 1392 7257 7925 8021 207 51418 17996 1559 1017 1595 5391 3363 174 16 3729 5248 275 4381 2983 2837 2665 4130 254 5442 2915 369 600 385 393 469 7 1140 267 5749 886 138 612 767 66 1553 4507 522 5564 548 616 220 143 763 16615 575 1682 1236 238 3408 125 1338 4152 2971 22228 546 6621 122 10207 3417 2504 2523 38 1408 322 892 4485 1 769 3020 955 112 8 12 1472 2118 1193 348 3378 26 821 12345 7087 481 97 1175 2070 1224 174 356 13 482 10 40 567 164 5956 237 658 34 576 43 606 40 1442 79 0 0 0 0 0 0 0 0 0 0 0 0 0 0 0 0 0 0 0 0 0 0 0 0 0 0 0 0 0 0 0 0 0 0 0 0 0 0 0 0 0 0 0 0 0 0 0 0 0 0 0 0 0 0 0 0 0 0 0 0 0 0 0 0 0 0 0 0 0 0 0 0 0 0 0 0 0 0 0 0 0 0 0 0 0 0 0 0 0 0 0 0 0 0 0 0 0 0 0 0 0 0 0 0 0 0 0 0 0 0 0 0 0 0 0 0 0 0 0 0 0 0 0 0 0 0 0 0 0 0 0 0 0 0 0 0 0 0 0 0 0 0 0 0 0 0 0 0 0 0 0 0 0 0 0 0 0 0 0 0 0 0 0 0 0 0 0 0 0 0 0 0 0 0 0 0 0 0 0 0 0 0 0 0 0 0 0 0 0 0 0 0 0 0 0 0 0 0 0 0 0 0 0 0 0 0 0 0 0 0 0 0 0 0 0 0 0 0 0 0 0 0 0 0 0 0 0 0 0 0 0 0 0 0 0 0 0 0 0 0 0 0 0 0 0 0 0 0 0 0 0 0 0 0 0 0 0 0 0 0 0 0 0 0 0 0 0 0 0 0 0 0 0 0 0 0 0 0 0 0 0 0 0 0 0 0 0 0 0 0 0 0 0 0 0 0 0 0 0 0 0 0 0 0 0 0 0 0 0 0 0 0 0 0 0 0 0 0 0 0 0 0 0 0 0 0 0 0 0 0 0 0 0 0 0 0 0 0 0 0 0 0 0 0 0 0 0 0 0 0 0 0 0 0 0 0 0 0 0 0 0 0 0 0 0 0 0 0 0 0 0 0 0 0 0 0 0 0 0 0 0 0 0 0 0 0 0 0 0 0 0 0 0 0 0 0 0 0 0 0 0 0 0 0 0 0 0 0 0 0 0 0 0 0 0 0 0 0 0 0 0 0 0 0 0 0 0 0 0 0 0 0 0 0 0 0 0 0 0 0 0 0 0 0 0 0 0 0 0 0 0 0 0 0 0 0 0 0 0 0 0 0 0 0 0 0 0 0 0 0 0 0 0 0 0 0 0 0 0 0 0 0 0 0 0 0 0 0 0 0 0 0 0 0 0 0 0 0 0 0 0 0 0 0 0 0 0 0 0 0 0 0 0 0 0 0 0 0 0 0 0 0 0 0 0 0 0 0 0 0 0 0 0 0 0 0 0 0 0 0 0 0 0 0 0 0 0 0 0 0 0 0 0 0 0 0 0 0 0 0 0 0 0 0 0 0 0 0 0 0 0 0 0 0 0 0 0 0 0 0 0 0 0 0 0 0 0 0 0 0 0 0 0 0 0 0 0 0 0 0 0 0 0 0 0 0 0 0 0 0 0 0 0 0 0 0 0 0 0 0 0 0 0 0 0 0 0 0 0 0 0 0 0 0 0 0 0 0 0 0 0 0 0 0 0 0 0 0 0 0 0 0 0 0 0 0 0 0 0 0 0 0 0 0 0 0 0 0 0 0 0 0 0 0 0 0 0 0 0 0 0 0 0 0 0 0 0 0 0 0 0 0 0 0 0 0 0 0 0 0 0 0 0 0 0 0 0 0 0 0 0 0 0 0 0 0 0 0 0 0 0 0 0 0 0 0 0 0 0 0 0 0 0 0 0 0 0 0 0 0 0 0 0 0 0 0 0 0 0 0 0 0 0 0 0 0 0 0 0 0 0 0 0 0 0 0 0 0 0 0 0 0 0 0 0 0 0 0 0 0 0 0 0 0 0 0 0 0 0 0 0 0 0 0 0 0 0 0 0 0 0 0 0 0 0 0 0 0 0 0 0 0 0 0 0 0 0 0 0 0 0 0 0 0 0 0 0 0 0 0 0 0 0 0 0 0 0 0 0 0 0 0 0 0 0 0 0 0 0 0 0 0 0 0 0 0 0 0 0 0 0 0 0 0 0 0 0 0 0 0 0 0 0 0 0 0 0 0 0 0 0 0 0 0 0 0 0 0 0 0 0 0 0 0 0 0 0 0 0 0 0 0 0 0 0 0 0 0 0 0 0 0 0 0 0 0 0 0 0 0 0 0 0 0 0 0 0 0 0 0 0 0 0 0 0 0 0 0 0 0 0 0 0 0 0 0 0 0 0 0 0 0 0 0 0 0 0 0 0 0 0 0 0 0 0 0 0 0 0 0 0 0 0 0 0 0 0 0 0 0 0 0 0 0 0 0 0 0 0 0 0 0 0 0 0 0 0 0 0 0 0 0 0 0 0 0 0 0 0 0 0 0 0 0 0 0 0 0 0 0 0 0 0 0 0 0 0 0 0 0 0 0 0 0 0 0 0 0 0 0 0 0 0 0 0 0 0 0 0 0 0 0 0 0 0 0 0 0 0 0 0 0 0 0 0 0 0 0 0 0 0 0 0 0 0 0 0 0 0 0 0 0 0 0 0 0 0 0 0 0 0 0 0 0 0 0 0 0 0 0 0 0 0 0 0 0 0 0 0 0 0 0 0 0 0 0 0 0 0 0 0 0 0 0 0 0 0 0 0 0 0 0 0 0 0 0 0 0 0 0 0 0 0 0 0 0 0 0 0 0 0 0 0 0 0 0 0 0 0 0 0 0 0 0 0 0 0 0 0 0 0 0 0 0 0 0 0 0 0 0 0 0 0 0 0 0 0 0 0 0 0 0 0 0 0 0 0 0 0 0 0 0 0 0 0 0 0 0 0 0 0 0 0 0 0 0 0 0 0 0 0 0 0 0 0 0 0 0 0 0 0 0 0 0 0 0 0 0 0 0 0 0 0 0 0 0 0 0 0 0 0 0 0 0 0 0 0 0 0 0 0 0 0 0 0 0 0 0 0 0 0 0 0 0 0 0 0 0 0 0 0 0 0 0 0 0 0 0 0 0 0 0 0 0 0 0 0 0 0 0 0 0 0 0 0 0 0 0 0 0 0 0 0 0 0 0 0 0 0 0 0 0 0 0 0 0 0 0 0 0 0 0 0 0 0 0 0 0 0 0 0 0 0 0 0 0 0 0 0 0 0 0 0 0 0 0 0 0 0 0 0 0 0 0 0 0 0 0 0 0 0 0 0 0 0 0 0 0 0 0 0 0 0 0 0 0 0 0 0 0 0 0 0 0 0 0 0 0 0 0 0 0 0 0 0 0 0 0 0 0 0 0 0 0 0 0 0 0 0 0 0 0 0 0 0 0 0 0 0 0 0 0 0 0 0 0 0 0 0 0 0 0 0 0 0 0 0 0 0 0 0 0 0 0 0 0 0 0 0 0 0 0 0 0 0 0 0 0 0 0 0 0 0 0 0 0 0 0 0 0 0 0 0 0 0 0 0 0 0 0 0 0 0 0 0 0 0 0 0 0 0 0 0 0 0 0 0 0 0 0 0 0 0 0 0 0 0 0 0 0 0 0 0 0 0 0 0 0 0 0 0 0 0 0 0 0 0 0 0 0 0 0 0 0 0 0 0 0 0 0 0 0 0 0 0 0 SP219 Bacteria;Firmicutes;Bacilli;Bacillales;Gemellaceae;Gemella;sanguinis 517 2438 25 159 4056 1296 78 2027 79 453 1317 383 894 3269 326 1499 604 344 624 2073 1674 912 344 416 1974 3817 135 723 419 380 677 3064 246 1113 3880 3753 1997 191 1044 371 1824 939 776 1311 110 1309 108 3032 79 3195 377 295 1534 1237 1304 833 1051 1833 279 756 278 457 645 229 3372 478 260 760 536 1530 901 435 951 481 718 6342 2835 2873 257 915 2270 1614 1609 1157 1219 1959 2551 1504 1590 505 48 1007 92 595 2754 4160 43 906 133 1038 316 456 612 1762 270 168 273 203 812 370 520 347 108 1944 1892 726 457 892 444 784 789 1466 759 2443 206 943 733 749 593 15 2316 2711 3629 389 201 364 3251 1802 313 2644 487 334 1242 1955 241 2210 1572 5425 2611 324 848 3542 3025 4531 1001 7918 2123 778 1050 997 600 261 516 346 845 577 390 2491 494 481 114 2012 1933 2861 310 1424 3215 2692 276 610 931 1495 1868 1707 859 2890 1111 240 2384 864 3766 2918 2661 3578 1298 741 3205 1338 1196 799 136 691 957 1904 351 586 130 59 567 60 222 591 1694 688 1148 93 44 1239 18 999 381 814 196 1217 812 504 1366 505 239 691 1244 380 1289 165 1239 1893 343 1161 1134 311 367 684 825 217 75 723 1108 393 1316 617 486 482 1463 386 981 984 5713 1326 432 1150 3085 759 2157 972 327 367 327 3735 0 0 0 0 0 0 0 0 0 0 0 0 0 0 0 0 0 0 0 0 0 0 0 0 0 0 0 0 0 0 0 0 0 0 0 0 0 0 0 0 0 0 0 0 0 0 0 0 0 0 0 0 0 0 0 0 0 0 0 0 0 0 0 0 0 0 0 0 0 0 0 0 0 0 0 0 0 0 0 0 0 0 0 0 0 0 0 0 0 0 0 0 0 0 0 0 0 0 0 0 0 0 0 0 0 0 0 0 0 0 0 0 0 0 0 0 0 0 0 0 0 0 0 0 0 0 0 0 0 0 0 0 0 0 0 0 0 0 0 0 0 0 0 0 0 0 0 0 0 0 0 0 0 0 0 0 0 0 0 0 0 0 0 0 0 0 0 0 0 0 0 0 0 0 0 0 0 0 0 0 0 0 0 0 0 0 0 0 0 0 0 0 0 0 0 0 0 0 0 0 0 0 0 0 0 0 0 0 0 0 0 0 0 0 0 0 0 0 0 0 0 0 0 0 0 0 0 0 0 0 0 0 0 0 0 0 0 0 0 0 0 0 0 0 0 0 0 0 0 0 0 0 0 0 0 0 0 0 0 0 0 0 0 0 0 0 0 0 0 0 0 0 0 0 0 0 0 0 0 0 0 0 0 0 0 0 0 0 0 0 0 0 0 0 0 0 0 0 0 0 0 0 0 0 0 0 0 0 0 0 0 0 0 0 0 0 0 0 0 0 0 0 0 0 0 0 0 0 0 0 0 0 0 0 0 0 0 0 0 0 0 0 0 0 0 0 0 0 0 0 0 0 0 0 0 0 0 0 0 0 0 0 0 0 0 0 0 0 0 0 0 0 0 0 0 0 0 0 0 0 0 0 0 0 0 0 0 0 0 0 0 0 0 0 0 0 0 0 0 0 0 0 0 0 0 0 0 0 0 0 0 0 0 0 0 0 0 0 0 0 0 0 0 0 0 0 0 0 0 0 0 0 0 0 0 0 0 0 0 0 0 0 0 0 0 0 0 0 0 0 0 0 0 0 0 0 0 0 0 0 0 0 0 0 0 0 0 0 0 0 0 0 0 0 0 0 0 0 0 0 0 0 0 0 0 0 0 0 0 0 0 0 0 0 0 0 0 0 0 0 0 0 0 0 0 0 0 0 0 0 0 0 0 0 0 0 0 0 0 0 0 0 0 0 0 0 0 0 0 0 0 0 0 0 0 0 0 0 0 0 0 0 0 0 0 0 0 0 0 0 0 0 0 0 0 0 0 0 0 0 0 0 0 0 0 0 0 0 0 0 0 0 0 0 0 0 0 0 0 0 0 0 0 0 0 0 0 0 0 0 0 0 0 0 0 0 0 0 0 0 0 0 0 0 0 0 0 0 0 0 0 0 0 0 0 0 0 0 0 0 0 0 0 0 0 0 0 0 0 0 0 0 0 0 0 0 0 0 0 0 0 0 0 0 0 0 0 0 0 0 0 0 0 0 0 0 0 0 0 0 0 0 0 0 0 0 0 0 0 0 0 0 0 0 0 0 0 0 0 0 0 0 0 0 0 0 0 0 0 0 0 0 0 0 0 0 0 0 0 0 0 0 0 0 0 0 0 0 0 0 0 0 0 0 0 0 0 0 0 0 0 0 0 0 0 0 0 0 0 0 0 0 0 0 0 0 0 0 0 0 0 0 0 0 0 0 0 0 0 0 0 0 0 0 0 0 0 0 0 0 0 0 0 0 0 0 0 0 0 0 0 0 0 0 0 0 0 0 0 0 0 0 0 0 0 0 0 0 0 0 0 0 0 0 0 0 0 0 0 0 0 0 0 0 0 0 0 0 0 0 0 0 0 0 0 0 0 0 0 0 0 0 0 0 0 0 0 0 0 0 0 0 0 0 0 0 0 0 0 0 0 0 0 0 0 0 0 0 0 0 0 0 0 0 0 0 0 0 0 0 0 0 0 0 0 0 0 0 0 0 0 0 0 0 0 0 0 0 0 0 0 0 0 0 0 0 0 0 0 0 0 0 0 0 0 0 0 0 0 0 0 0 0 0 0 0 0 0 0 0 0 0 0 0 0 0 0 0 0 0 0 0 0 0 0 0 0 0 0 0 0 0 0 0 0 0 0 0 0 0 0 0 0 0 0 0 0 0 0 0 0 0 0 0 0 0 0 0 0 0 0 0 0 0 0 0 0 0 0 0 0 0 0 0 0 0 0 0 0 0 0 0 0 0 0 0 0 0 0 0 0 0 0 0 0 0 0 0 0 0 0 0 0 0 0 0 0 0 0 0 0 0 0 0 0 0 0 0 0 0 0 0 0 0 0 0 0 0 0 0 0 0 0 0 0 0 0 0 0 0 0 0 0 0 0 0 0 0 0 0 0 0 0 0 0 0 0 0 0 0 0 0 0 0 0 0 0 0 0 0 0 0 0 0 0 0 0 0 0 0 0 0 0 0 0 0 0 0 0 0 0 0 0 0 0 0 0 0 0 0 0 0 0 0 0 0 0 0 0 0 0 0 0 0 0 0 0 0 0 0 0 0 0 0 0 0 0 0 0 0 0 0 0 0 0 0 0 0 0 0 0 0 0 0 0 0 0 0 0 0 0 0 0 0 0 0 0 0 0 0 0 0 0 0 0 0 0 0 0 0 0 0 0 0 0 0 0 0 0 0 0 0 0 0 0 0 0 0 0 0 0 0 0 0 0 0 0 0 0 0 0 0 0 0 0 0 0 0 0 0 0 0 0 0 0 0 0 0 0 0 0 0 0 0 0 0 0 0 0 0 0 0 0 0 0 0 0 0 0 0 0 0 0 0 0 0 0 0 0 0 0 0 0 0 0 0 0 0 0 0 0 0 0 0 0 0 0 0 0 0 0 0 0 0 0 0 0 0 0 0 0 0 0 0 0 0 0 0 0 0 0 0 0 0 0 0 0 0 0 0 0 0 0 0 0 0 0 0 0 0 0 0 0 0 0 0 0 0 0 0 0 0 0 0 0 0 0 0 0 0 0 0 0 0 0 0 0 0 0 0 0 0 0 0 0 0 0 0 0 0 0 0 0 0 0 0 0 0 0 0 0 0 0 0 0 0 0 0 0 0 0 0 0 0 0 0 0 0 0 0 0 0 0 0 0 0 0 0 0 0 0 0 0 0 0 0 0 0 0 0 0 0 0 0 0 0 0 0 0 0 0 0 0 0 0 0 0 0 0 0 0 0 0 0 0 0 0 0 0 0 0 0 0 0 0 0 0 0 0 0 0 0 0 0 0 0 0 0 0 0 0 0 0 0 0 0 0 0 0 0 0 0 0 0 0 0 0 0 0 0 0 0 0 0 0 0 0 0 0 0 0 0 0 0 0 0 0 0 0 0 0 0 0 0 0 0 0 0 0 0 0 0 0 0 0 0 0 0 0 0 0 0 0 0 0 0 0 0 0 0 0 0 0 0 0 0 0 0 0 0 0 0 0 0 0 0 0 0 0 0 0 0 0 0 0 0 0 0 0 0 0 0 0 0 0 0 SP22 Bacteria;Bacteroidetes;Bacteroidia;Bacteroidales;Prevotellaceae;Prevotella;vespertina 15 0 0 0 1 20 0 0 0 2 509 0 24 1 0 42 2 0 0 0 0 10 0 5 3 13 0 0 0 0 55 13 0 0 81 61 8 4 0 0 12 0 0 323 19 0 2 0 0 0 78 100 1023 0 131 0 122 0 0 0 0 1 0 0 2 0 0 1734 14 2 67 47 5 22 0 0 178 165 0 33 0 0 3 0 529 216 16 2 0 0 0 586 0 0 0 0 0 10 0 0 0 107 0 0 3 39 103 0 0 1 0 0 10 0 1781 0 0 0 4 0 5 26 1329 0 69 2 189 2 0 0 0 0 1 0 666 0 1169 7 0 0 83 0 0 0 0 368 146 170 2 0 1 0 0 0 0 0 0 42 2 8 0 0 36 0 0 24 0 0 0 5 3 0 0 0 95 0 4 9 0 0 0 0 0 0 0 1 115 0 0 513 18 7 149 0 111 17 0 221 0 4 0 0 1000 0 0 27 0 3 0 1 12 4 7 0 0 15 1 4 0 0 0 5 0 31 5191 8 128 0 0 3 17 0 0 0 0 1 36 853 200 16 0 0 0 0 0 178 33 0 0 0 279 0 0 45 1 0 0 0 141 0 0 1268 20 0 0 0 13 0 0 0 0 0 0 0 0 0 0 0 0 0 0 0 0 0 0 0 0 0 0 0 0 0 0 0 0 0 0 0 0 0 0 0 0 0 0 0 0 0 0 0 0 0 0 0 0 0 0 0 0 0 0 0 0 0 0 0 0 0 0 0 0 0 0 0 0 0 0 0 0 0 0 0 0 0 0 0 0 0 0 0 0 0 0 0 0 0 0 0 0 0 0 0 0 0 0 0 0 0 0 0 0 0 0 0 0 0 0 0 0 0 0 0 0 0 0 0 0 0 0 0 0 0 0 0 0 0 0 0 0 0 0 0 0 0 0 0 0 0 0 0 0 0 0 0 0 0 0 0 0 0 0 0 0 0 0 0 0 0 0 0 0 0 0 0 0 0 0 0 0 0 0 0 0 0 0 0 0 0 0 0 0 0 0 0 0 0 0 0 0 0 0 0 0 0 0 0 0 0 0 0 0 0 0 0 0 0 0 0 0 0 0 0 0 0 0 0 0 0 0 0 0 0 0 0 0 0 0 0 0 0 0 0 0 0 0 0 0 0 0 0 0 0 0 0 0 0 0 0 0 0 0 0 0 0 0 0 0 0 0 0 0 0 0 0 0 0 0 0 0 0 0 0 0 0 0 0 0 0 0 0 0 0 0 0 0 0 0 0 0 0 0 0 0 0 0 0 0 0 0 0 0 0 0 0 0 0 0 0 0 0 0 0 0 0 0 0 0 0 0 0 0 0 0 0 0 0 0 0 0 0 0 0 0 0 0 0 0 0 0 0 0 0 0 0 0 0 0 0 0 0 0 0 0 0 0 0 0 0 0 0 0 0 0 0 0 0 0 0 0 0 0 0 0 0 0 0 0 0 0 0 0 0 0 0 0 0 0 0 0 0 0 0 0 0 0 0 0 0 0 0 0 0 0 0 0 0 0 0 0 0 0 0 0 0 0 0 0 0 0 0 0 0 0 0 0 0 0 0 0 0 0 0 0 0 0 0 0 0 0 0 0 0 0 0 0 0 0 0 0 0 0 0 0 0 0 0 0 0 0 0 0 0 0 0 0 0 0 0 0 0 0 0 0 0 0 0 0 0 0 0 0 0 0 0 0 0 0 0 0 0 0 0 0 0 0 0 0 0 0 0 0 0 0 0 0 0 0 0 0 0 0 0 0 0 0 0 0 0 0 0 0 0 0 0 0 0 0 0 0 0 0 0 0 0 0 0 0 0 0 0 0 0 0 0 0 0 0 0 0 0 0 0 0 0 0 0 0 0 0 0 0 0 0 0 0 0 0 0 0 0 0 0 0 0 0 0 0 0 0 0 0 0 0 0 0 0 0 0 0 0 0 0 0 0 0 0 0 0 0 0 0 0 0 0 0 0 0 0 0 0 0 0 0 0 0 0 0 0 0 0 0 0 0 0 0 0 0 0 0 0 0 0 0 0 0 0 0 0 0 0 0 0 0 0 0 0 0 0 0 0 0 0 0 0 0 0 0 0 0 0 0 0 0 0 0 0 0 0 0 0 0 0 0 0 0 0 0 0 0 0 0 0 0 0 0 0 0 0 0 0 0 0 0 0 0 0 0 0 0 0 0 0 0 0 0 0 0 0 0 0 0 0 0 0 0 0 0 0 0 0 0 0 0 0 0 0 0 0 0 0 0 0 0 0 0 0 0 0 0 0 0 0 0 0 0 0 0 0 0 0 0 0 0 0 0 0 0 0 0 0 0 0 0 0 0 0 0 0 0 0 0 0 0 0 0 0 0 0 0 0 0 0 0 0 0 0 0 0 0 0 0 0 0 0 0 0 0 0 0 0 0 0 0 0 0 0 0 0 0 0 0 0 0 0 0 0 0 0 0 0 0 0 0 0 0 0 0 0 0 0 0 0 0 0 0 0 0 0 0 0 0 0 0 0 0 0 0 0 0 0 0 0 0 0 0 0 0 0 0 0 0 0 0 0 0 0 0 0 0 0 0 0 0 0 0 0 0 0 0 0 0 0 0 0 0 0 0 0 0 0 0 0 0 0 0 0 0 0 0 0 0 0 0 0 0 0 0 0 0 0 0 0 0 0 0 0 0 0 0 0 0 0 0 0 0 0 0 0 0 0 0 0 0 0 0 0 0 0 0 0 0 0 0 0 0 0 0 0 0 0 0 0 0 0 0 0 0 0 0 0 0 0 0 0 0 0 0 0 0 0 0 0 0 0 0 0 0 0 0 0 0 0 0 0 0 0 0 0 0 0 0 0 0 0 0 0 0 0 0 0 0 0 0 0 0 0 0 0 0 0 0 0 0 0 0 0 0 0 0 0 0 0 0 0 0 0 0 0 0 0 0 0 0 0 0 0 0 0 0 0 0 0 0 0 0 0 0 0 0 0 0 0 0 0 0 0 0 0 0 0 0 0 0 0 0 0 0 0 0 0 0 0 0 0 0 0 0 0 0 0 0 0 0 0 0 0 0 0 0 0 0 0 0 0 0 0 0 0 0 0 0 0 0 0 0 0 0 0 0 0 0 0 0 0 0 0 0 0 0 0 0 0 0 0 0 0 0 0 0 0 0 0 0 0 0 0 0 0 0 0 0 0 0 0 0 0 0 0 0 0 0 0 0 0 0 0 0 0 0 0 0 0 0 0 0 0 0 0 0 0 0 0 0 0 0 0 0 0 0 0 0 0 0 0 0 0 0 0 0 0 0 0 0 0 0 0 0 0 0 0 0 0 0 0 0 0 0 0 0 0 0 0 0 0 0 0 0 0 0 0 0 0 0 0 0 0 0 0 0 0 0 0 0 0 0 0 0 0 0 0 0 0 0 0 0 0 0 0 0 0 0 0 0 0 0 0 0 0 0 0 0 0 0 0 0 0 0 0 0 0 0 0 0 0 0 0 0 0 0 0 0 0 0 0 0 0 0 0 0 0 0 0 0 0 0 0 0 0 0 0 0 0 0 0 0 0 0 0 0 0 0 0 0 0 0 0 0 0 0 0 0 0 0 0 0 0 0 0 0 0 0 0 0 0 0 0 0 0 0 0 0 0 0 0 0 0 0 0 0 0 0 0 0 0 0 0 0 0 0 0 0 0 0 0 0 0 0 0 0 0 0 0 0 0 0 0 0 0 0 0 0 0 0 0 0 0 0 0 0 0 0 0 0 0 0 0 0 0 0 0 0 0 0 0 0 0 0 0 0 0 0 0 0 0 0 0 0 0 0 0 0 0 0 0 0 0 0 0 0 0 0 0 0 0 0 0 0 0 0 0 0 0 0 0 0 0 0 0 0 0 0 0 0 0 0 0 0 0 0 0 0 0 0 0 0 0 0 0 0 0 0 0 0 0 0 0 0 0 0 0 0 0 0 0 0 0 0 0 0 0 0 0 0 0 0 0 0 0 0 0 0 0 0 0 0 0 0 0 0 0 0 0 0 0 0 0 0 0 0 0 0 0 0 0 0 0 0 0 0 0 0 0 0 0 0 0 0 0 0 0 0 0 0 0 0 0 0 0 0 0 0 0 0 0 SP220 Bacteria;Bacteroidetes;Flavobacteriia;Flavobacteriales;Flavobacteriaceae;Bergeyella;sp. HMT206 0 0 0 9 13 6 0 0 31 1825 3 602 117 0 1 0 865 161 0 0 0 0 1 149 6 0 2 4 0 0 4 0 685 10 0 0 15 4004 33 391 0 73 0 4 39 216 1109 3 0 37 0 6 0 17 25 104 3 32 116 1 243 0 0 0 7 8966 1879 0 1022 4 196 125 6 2 0 0 11 0 0 0 54 0 19 390 10 0 0 7 0 0 0 0 1 2 0 0 0 86 23 121 95 7 0 0 16 4404 0 1089 97 2 0 807 28 0 255 146 0 0 68 63 0 0 1 0 562 0 43 1 55 0 14 0 7 4 419 0 0 252 105 0 292 114 257 913 3871 4 9 446 0 0 0 0 0 16 0 293 93 37 0 0 52 171 5 0 0 0 36 0 0 55 6247 0 295 86 0 0 0 0 0 217 41 55 0 5 0 97 9 0 0 51 4 17 40 0 3 0 0 17 32 93 0 1 0 0 0 0 649 10 270 0 14 0 1 0 0 0 198 0 0 68 4019 41 0 20 34 0 218 818 0 0 1 53 0 1161 0 0 7 45 0 3 0 9 0 0 0 6 31 0 12 3 0 6 0 0 0 0 0 0 1 0 0 0 0 0 0 0 1 0 0 0 17 104 0 0 0 212 0 0 0 0 0 0 0 0 0 0 0 2 2 0 0 0 0 75 0 0 0 0 0 1 0 25 1 0 0 0 0 0 1 0 0 0 0 1 0 0 0 0 0 0 6 0 0 0 0 0 1 0 0 6 0 0 1 3 1 0 1 5 0 0 1 0 0 0 0 0 0 0 0 0 0 1 4 0 1 0 0 0 0 0 0 1 0 0 0 0 0 0 2 1 3 0 0 0 1 0 0 3 11 3 4 0 1 0 1 0 0 1 0 0 0 0 0 0 0 0 0 6 0 0 0 0 0 0 0 0 0 0 1 0 0 0 0 2 0 10 0 0 0 0 0 1 0 0 0 1 0 0 4 0 12 1 5 0 0 0 1 0 0 0 1 0 0 0 0 0 0 0 0 0 0 0 1 11 0 0 0 3 0 0 0 0 142 21 1 0 0 1 5 0 0 0 4 2 0 3 0 26 0 0 0 0 0 0 0 0 0 1 10 0 0 0 0 0 2 0 0 0 0 0 0 0 0 1 0 23 0 1 0 0 0 0 0 0 0 0 0 0 0 0 0 0 0 0 0 0 0 1 2 0 0 0 2 3 0 0 0 0 0 0 1 0 0 1 0 2 0 0 0 0 0 1 2 0 0 0 7 0 0 0 282 0 0 0 0 0 0 0 0 0 0 0 0 15 0 0 0 3 0 0 0 0 0 53 3 0 0 0 1 0 0 0 0 0 0 0 1 0 0 1 0 0 9 0 1 1 23 2 5 0 4 0 0 3 0 0 2 0 0 0 0 0 3 0 0 3 0 8 0 0 0 2 0 0 0 0 0 0 0 0 0 3 0 1 3 0 0 0 2 2 0 0 0 1 0 0 0 1 0 0 1 0 1 1 0 1 0 2 0 0 0 0 9 0 13 0 0 17 0 12 0 0 0 9 52 0 0 9 0 0 0 491 0 0 1 0 40 2 0 0 0 0 0 0 0 0 1 0 0 0 0 0 0 0 0 0 1 1 0 0 1 0 0 4 0 3 0 0 0 1 0 0 0 1 0 2 1 0 0 0 0 1 0 0 0 3 16 0 0 0 0 0 0 44 1 0 0 1 21 0 11 2 0 2 0 0 0 0 2 1 2 0 0 0 0 1 1 0 1 0 0 0 0 0 0 0 2 0 2 10 13 2 1 2 0 0 1 0 0 0 1 0 0 1 1 0 0 0 0 1 0 0 0 6 1 1 0 0 0 0 2 0 0 0 0 0 0 1 0 0 6 0 2 0 10 0 0 0 0 0 0 0 0 0 0 0 0 0 0 0 2 1 4 0 1 1 0 1 0 1 0 4 0 0 12 49 2 1 0 0 0 0 0 0 0 0 8 0 0 0 0 0 0 0 0 0 0 0 0 0 0 0 0 0 0 0 0 3 0 0 0 0 1 2 0 0 5 1 0 0 0 1 0 1 0 1 0 0 0 0 0 0 0 0 3 0 0 0 1 0 0 0 0 0 0 0 3 4 0 0 0 1 0 0 0 0 0 0 0 0 0 0 1 32 0 0 0 4 0 0 0 0 0 0 0 0 26 0 7 8 0 0 0 1 10 0 0 0 0 1 3 0 0 0 0 0 1 0 0 0 0 0 0 0 0 0 0 0 0 0 4 0 0 1 3 1 0 0 2 1 0 0 0 2 0 3 4 0 1 1 0 3 2 0 0 0 20 35 19 15 384 1 4239 132 13 0 0 45 0 0 558 15 188 27 199 100 0 2707 297 1 26 0 0 0 261 1 0 25 0 0 93 24 11 0 1258 215 18 4 0 4247 0 123 9 618 56 0 23 81 93 0 3 9 4 0 1739 57 36 294 29 0 0 0 165 1 167 136 19 0 246 0 0 0 14 216 198 0 10 173 0 18 94 3 0 0 0 1 0 0 0 73 0 1 3 0 138 0 1799 13 344 903 41 1 23 1192 565 0 0 94 2 859 0 84 8 1598 1220 111 26 0 1298 805 102 0 0 3 33 0 671 147 72 483 574 301 29 1 26 833 43 35 397 34 0 0 1 2124 1 5 0 250 0 0 43 37 120 1 409 412 1 495 5 0 0 0 1 1 20 180 0 0 0 20 43 3 0 0 57 0 0 1 17 197 57 214 375 1 0 2 192 1 0 0 0 0 7 0 365 2 0 0 0 0 0 385 0 0 0 23 0 530 32 5 364 13 0 1 1433 1564 0 0 0 0 3827 9 0 474 34 2621 886 0 0 0 58 0 0 448 0 0 0 0 0 49 0 0 0 1 20 581 1814 0 0 1 223 21 801 1204 0 0 3 109 0 0 15 0 0 2 3037 0 14 0 0 0 66 0 0 275 2685 234 406 304 773 0 163 3 79 0 0 0 0 110 1358 3534 58 45 6567 819 0 3787 2 33 24 5 8329 1615 1117 0 0 28 1 0 0 130 0 1256 221 9 2 52 296 373 0 0 1 11 170 2055 21 0 529 1070 2249 8 13 227 247 4 135 29 1 5660 1344 0 1 19 185 629 0 0 0 3619 89 11 61 1 1093 330 3 1 1 54 0 0 4 3 499 345 62 3081 0 121 260 1 80 141 2 122 33 0 102 1778 334 498 226 366 4 5 0 1 224 1556 2606 8 2519 1 0 945 25 6 1 42 44 0 1 2441 1186 14 155 131 1367 151 513 0 0 131 401 0 54 0 0 24 216 69 1497 4 1824 182 464 9 97 51 0 10 0 0 0 0 0 31 58 0 167 208 4787 0 16 0 0 2241 1726 1 3512 1473 583 297 13 63 0 106 488 556 1 0 1 28 0 108 0 3708 2423 35 715 1547 148 0 9 0 38 24 115 60 11 90 305 69 10 177 143 1552 999 32 3 0 3 1 51 670 0 0 0 0 0 132 0 5 15 0 0 56 40 302 9 601 25 40 22 3720 680 262 1 1 0 667 16 0 37 49 155 48 47 819 56 6 0 0 890 2329 81 26 8 0 36 0 0 13 1677 0 0 1 1 29 1 1 809 7 0 1968 14 1 15 12 29 0 0 0 22 0 78 0 0 0 0 0 15 648 1 378 1660 3 6673 785 1 256 640 694 466 44 0 76 1 5538 0 0 73 0 0 0 0 30 2623 0 2137 10 6 0 0 260 11 552 127 904 48 75 0 638 26 65 0 125 1 125 361 14 14 1330 0 0 0 382 114 49 16 0 51 0 3 60 1 0 53 4 0 0 36 510 0 0 0 0 0 0 0 141 57 116 172 9 765 1643 123 0 1144 35 348 1547 674 56 0 0 0 0 17 62 836 6212 1667 165 1 1546 1344 0 0 74 2 0 76 0 2 0 354 0 2 428 29 37 0 0 2 23 0 0 69 854 0 1 1 2 2 63 2 0 0 0 0 3 54 475 92 2 311 0 12 2862 0 0 1349 1 108 49 57 1632 0 158 2633 0 0 0 0 4 81 43 0 0 0 1326 10 0 18 0 0 0 0 0 143 98 0 0 6 0 0 0 0 5 0 1 0 22 77 53 828 5 0 0 1 1 2 18 45 64 0 7 0 0 15 0 0 0 240 23 614 0 174 58 51 0 10 0 SP221 Bacteria;Saccharibacteria_(TM7);Saccharibacteria_(TM7)_[C-1];Saccharibacteria_(TM7)_[O-1];Saccharibacteria_(TM7)_[F-1];Saccharibacteria_(TM7)_[G-1];bacterium HMT957 0 34 58 9 5 8 0 15 0 0 2 0 0 0 0 0 15 24 3 7 0 0 0 42 1 1 0 0 61 184 7 8 144 3 0 0 1 8 0 14 0 0 0 0 2 0 3 0 0 0 7 39 0 13 0 0 0 11 0 32 0 0 0 0 0 1 0 2 0 0 0 9 1 0 0 4 5 0 1 33 3 0 8 16 0 5 0 5 15 1 2 0 16 90 0 20 0 0 0 0 62 26 0 0 51 18 0 0 4 0 1 24 0 0 22 1 1 0 0 0 5 0 0 16 0 6 0 1 2 453 0 5 11 0 0 39 0 0 45 0 0 3 0 3 145 13 14 4 1 0 0 0 3 13 0 4 18 0 6 0 0 16 0 1 8 2 25 1 892 0 0 5 1 45 10 0 6 8 0 23 3 0 20 15 0 1 0 8 1 0 0 36 1 0 1 0 0 0 24 0 37 0 5 0 0 0 0 63 65 0 0 0 42 1 0 3 0 0 6 1 12 1 4 0 0 0 13 0 0 1 0 1 115 17 17 4 2 6 0 11 0 0 0 1 3 0 9 5 1 25 4 8 3 25 0 8 4 7 4 0 15 0 87 28 0 15 0 0 0 3 18 0 2 0 0 0 57 6 37 0 2 2 0 25 3 0 0 0 0 5 110 0 13 0 0 0 0 0 0 31 1 4 99 0 0 0 0 0 17 0 1 0 0 0 0 4 0 0 0 0 0 2 8 0 0 0 0 0 12 0 0 12 0 0 0 0 0 0 0 0 1 0 0 0 0 0 0 0 0 0 0 0 0 0 0 0 0 0 0 0 0 1 0 0 0 0 0 0 1 0 1 0 0 1 21 0 0 0 1 1 0 0 0 0 0 0 0 6 0 0 0 0 0 10 0 3 0 0 0 1 0 0 1 0 0 0 0 1 0 0 0 34 0 0 0 0 5 0 39 0 0 0 0 0 0 8 5 0 0 0 0 2 2 0 0 1 63 0 0 0 0 0 0 0 6 0 0 0 13 5 26 0 0 0 0 0 0 0 0 6 0 0 0 1 0 0 0 12 5 0 0 2 0 4 0 0 0 0 2 0 0 1 0 0 7 13 10 0 4 2 0 0 4 9 12 0 1 1 0 8 18 16 0 0 9 0 0 0 0 0 4 8 0 0 0 1 0 0 0 0 0 0 0 0 0 1 0 8 0 1 0 5 31 0 1 0 1 20 0 5 0 0 1 4 0 0 27 45 11 0 32 1 3 0 0 13 0 0 0 89 0 3 13 19 13 8 0 0 0 1 0 0 0 0 0 0 0 8 5 0 5 1 0 0 0 0 0 1 4 0 0 0 0 0 0 1 0 0 0 0 0 9 0 5 0 0 0 0 5 20 1 0 1 0 3 0 1 0 1 0 0 0 0 0 7 0 4 0 0 2 0 0 0 2 15 16 10 0 1 0 3 11 1 20 1 0 0 143 1 1 3 0 0 2 1 0 1 1 0 0 0 0 20 15 0 0 0 0 1 0 0 2 0 0 0 5 41 0 0 0 0 3 14 0 0 16 61 0 0 2 0 0 0 0 39 0 0 0 0 0 13 0 0 3 0 0 0 0 1 0 1 0 17 23 0 0 0 0 0 0 0 0 0 0 0 4 23 100 6 0 0 0 35 0 0 0 0 11 29 0 2 24 0 0 1 0 0 0 6 0 8 0 91 0 0 0 5 0 0 8 1 1 0 0 0 0 34 3 0 17 0 0 2 0 0 0 0 0 0 0 0 0 0 0 0 0 0 0 0 0 0 21 2 38 0 0 5 0 0 0 0 0 0 0 0 0 0 0 5 2 19 1 0 2 3 18 0 0 0 0 1 24 0 0 0 0 1 0 1 0 0 2 0 0 0 0 0 1 0 0 106 0 0 0 0 0 0 0 0 0 0 0 0 0 1 1 27 0 0 0 0 0 1 0 6 0 0 0 0 2 8 1 1 0 1 0 478 3 0 0 0 0 11 0 0 0 21 0 67 22 1 0 0 0 0 0 0 0 3 0 11 0 5 0 0 0 0 84 56 174 10 99 0 209 1 0 0 3 28 23 0 0 0 35 3 4 0 6 0 0 0 0 0 46 0 0 0 3 2 0 1 0 0 0 0 1 7 0 3 0 1 0 10 11 0 7 10 0 0 0 0 0 0 4 0 0 0 0 1 67 0 3 0 2 2 0 4 1 9 1 0 2 18 7 0 2 0 13 41 24 33 0 0 4 0 25 11 0 0 20 0 0 6 33 0 22 0 0 0 0 0 1 0 0 26 2 0 0 0 0 0 0 0 107 0 0 19 0 3 0 4 0 0 1 0 0 0 1 0 0 15 1 0 7 0 0 0 0 1 0 0 0 0 0 0 0 6 5 0 2 1 0 0 0 9 165 0 0 0 0 0 0 0 5 0 0 1 0 0 0 0 2 0 0 0 5 0 0 0 0 0 6 0 0 0 0 0 12 0 0 0 0 3 0 0 1 0 0 0 0 0 0 0 0 0 1 0 0 0 2 0 0 1 0 6 0 0 0 0 0 0 0 0 0 0 0 0 0 0 0 0 0 0 14 0 0 0 1 0 0 0 0 0 0 0 0 2 0 0 0 0 4 3 5 4 3 13 0 0 4 0 0 9 1 1 0 0 0 2 0 0 2 0 0 0 0 0 0 1 0 1 1 0 0 0 0 2 24 0 26 0 0 0 0 0 0 1 0 0 0 0 5 0 0 0 2 0 0 0 0 0 0 0 0 0 0 0 0 0 32 0 0 0 0 2 2 0 0 0 0 0 0 47 0 1 0 0 0 0 0 0 0 0 0 0 0 0 0 0 0 2 0 0 0 0 0 1 2 0 0 2 0 0 12 1 0 0 0 0 0 0 0 0 0 1 0 1 0 0 0 0 2 0 1 0 0 0 9 0 3 0 1 0 1 0 0 28 4 0 0 0 0 0 0 0 0 0 0 1 0 0 0 0 17 0 0 0 0 0 13 0 0 6 0 1 0 0 0 10 4 3 0 1 0 0 1 0 0 0 0 0 0 7 0 5 0 0 0 0 1 1 0 1 0 0 0 0 0 0 0 12 0 0 0 0 2 0 0 7 0 0 1 0 0 0 0 0 0 0 0 0 0 0 0 0 0 0 0 0 0 3 0 0 7 0 0 0 0 0 0 0 0 0 0 0 0 0 1 0 0 1 0 0 0 0 0 0 0 2 0 79 152 0 0 0 7 0 5 1 0 1 0 1 0 0 0 0 1 3 0 0 1 0 2 1 0 0 0 0 0 0 0 4 0 0 2 0 1 0 0 0 2 0 0 0 0 0 0 0 0 0 1 0 5 0 0 0 0 0 0 0 0 21 0 0 0 0 0 0 0 0 3 217 0 1 0 0 0 0 0 1 4 1 1 0 0 1 0 0 2 0 0 15 1 0 0 0 0 0 1 0 0 2 0 0 14 43 0 0 0 10 3 34 0 1 0 0 0 0 2 0 1 2 1 0 2 10 0 0 0 0 1 0 0 8 6 0 0 2 0 0 5 0 0 4 0 0 2 7 0 0 3 0 0 0 0 0 1 1 0 1 1 0 0 3 0 0 2 0 0 2 4 0 0 0 0 0 21 0 0 0 0 0 1 0 0 0 0 0 0 0 0 0 0 0 0 0 0 0 0 0 1 0 2 5 0 0 8 44 0 0 1 28 0 1 1 0 0 0 0 1 0 0 0 0 0 0 0 0 1 0 0 0 0 2 1 0 2 0 0 0 6 0 0 0 0 0 0 0 0 0 0 0 0 0 0 0 2 1 11 0 0 4 1 7 0 0 8 1 1 4 1 6 0 0 1 0 0 0 0 1 0 0 0 0 0 1 0 0 0 2 0 0 0 0 0 0 0 0 2 0 8 1 18 0 7 18 0 2 1 0 0 0 1 0 0 0 0 0 0 0 0 0 0 0 1 1 0 0 0 1 0 0 0 3 0 0 0 0 0 1 0 0 0 15 0 4 5 0 0 3 0 0 0 0 0 0 0 0 0 1 0 2 0 1 0 0 8 0 0 0 0 0 0 0 0 0 0 0 0 6 0 0 0 0 0 0 0 0 0 2 0 0 0 SP224 Bacteria;Proteobacteria;Gammaproteobacteria;Pasteurellales;Pasteurellaceae;Haemophilus;haemolyticus 0 82 5 1 7 321 288 0 3 100 0 14 119 31 6 3 46 48 0 0 1 5 7 8 2 0 1 1 135 25 6 7 29 0 0 12 3 142 4 358 4 17 15 2 8 0 136 0 25 14 31 0 0 4 5 3 0 2 71 12 5 230 8 2 2 9 97 0 25 5 213 26 96 6 0 5 0 0 32 7 16 6 0 48 0 1 6 33 6 1 16 1 15 4 1 0 86 1 7 4 0 38 7 1 16 47 5 219 0 2 68 3 0 3 4 62 23 1 3 4 3 6 0 1 12 1 0 2 0 1162 1 0 0 6 84 628 0 0 1 1 23 138 25 10 18 14 2 6 0 0 2 0 4 2 0 0 0 0 1 0 3 29 1 12 1 0 0 0 2 0 11 0 0 56 0 0 1 2 0 17 0 5 97 13 5 11 0 0 0 5 6 5 1 0 3 14 0 1 7 0 10 3 1 5 0 2 57 10 33 2 4 14 0 0 5 10 61 0 19 0 18 11 2 2 1 8 12 11 9 1 0 96 7 0 0 0 0 3 3 17 0 1 5 193 2 1 1 3 1 3 2 5 0 0 0 0 0 0 4 0 18 0 0 0 24 0 0 6 0 0 0 0 0 0 0 0 0 0 0 0 0 0 0 0 0 0 0 0 0 0 0 0 0 0 0 0 0 0 0 0 0 0 0 0 0 0 0 0 0 0 0 0 0 0 0 0 0 0 0 0 0 0 0 0 0 0 0 0 0 0 0 0 0 0 0 0 0 0 0 0 0 0 0 0 0 0 0 0 0 0 0 0 0 0 0 0 0 0 0 0 0 0 0 0 0 0 0 0 0 0 0 0 0 0 0 0 0 0 0 0 0 0 0 0 0 0 0 0 0 0 0 0 0 0 0 0 0 0 0 0 0 0 0 0 0 0 0 0 0 0 0 0 0 0 0 0 0 0 0 0 0 0 0 0 0 0 0 0 0 0 0 0 0 0 0 0 0 0 0 0 0 0 0 0 0 0 0 0 0 0 0 0 0 0 0 0 0 0 0 0 0 0 0 0 0 0 0 0 0 0 0 0 0 0 0 0 0 0 0 0 0 0 0 0 0 0 0 0 0 0 0 0 0 0 0 0 0 0 0 0 0 0 0 0 0 0 0 0 0 0 0 0 0 0 0 0 0 0 0 0 0 0 0 0 0 0 0 0 0 0 0 0 0 0 0 0 0 0 0 0 0 0 0 0 0 0 0 0 0 0 0 0 0 0 0 0 0 0 0 0 0 0 0 0 0 0 0 0 0 0 0 0 0 0 0 0 0 0 0 0 0 0 0 0 0 0 0 0 0 0 0 0 0 0 0 0 0 0 0 0 0 0 0 0 0 0 0 0 0 0 0 0 0 0 0 0 0 0 0 0 0 0 0 0 0 0 0 0 0 0 0 0 0 0 0 0 0 0 0 0 0 0 0 0 0 0 0 0 0 0 0 0 0 0 0 0 0 0 0 0 0 0 0 0 0 0 0 0 0 0 0 0 0 0 0 0 0 0 0 0 0 0 0 0 0 0 0 0 0 0 0 0 0 0 0 0 0 0 0 0 0 0 0 0 0 0 0 0 0 0 0 0 0 0 0 0 0 0 0 0 0 0 0 0 0 0 0 0 0 0 0 0 0 0 0 0 0 0 0 0 0 0 0 0 0 0 0 0 0 0 0 0 0 0 0 0 0 0 0 0 0 0 0 0 0 0 0 0 0 0 0 0 0 0 0 0 0 0 0 0 0 0 0 0 0 0 0 0 0 0 0 0 0 0 0 0 0 0 0 0 0 0 0 0 0 0 0 0 0 0 0 0 0 0 0 0 0 0 0 0 0 0 0 0 0 0 0 0 0 0 0 0 0 0 0 0 0 0 0 0 0 0 0 0 0 0 0 0 0 0 0 0 0 0 0 0 0 0 0 0 0 0 0 0 0 0 0 0 0 0 0 0 0 0 0 0 0 0 0 0 0 0 0 0 0 0 0 0 0 0 0 0 0 0 0 0 0 0 0 0 0 0 0 0 0 0 0 0 0 0 0 0 0 0 0 0 0 0 0 0 0 0 0 0 0 0 0 0 0 0 0 0 0 0 0 0 0 0 0 0 0 0 0 0 0 0 0 0 0 0 0 0 0 0 0 0 0 0 0 0 0 0 0 0 0 0 0 0 0 0 0 0 0 0 0 0 0 0 0 0 0 0 0 0 0 0 0 0 0 0 0 0 0 0 0 0 0 0 0 0 0 0 0 0 0 0 0 0 0 0 0 0 0 0 0 0 0 0 0 0 0 0 0 0 0 0 0 0 0 0 0 0 0 0 0 0 0 0 0 0 0 0 0 0 0 0 0 0 0 0 0 0 0 0 0 0 0 0 0 0 0 0 0 0 0 0 0 0 0 0 0 0 0 0 0 0 0 0 0 0 0 0 0 0 0 0 0 0 0 0 0 0 0 0 0 0 0 0 0 0 0 0 0 0 0 0 0 0 0 0 0 0 0 0 0 0 0 0 0 0 0 0 0 0 0 0 0 0 0 0 0 0 0 0 0 0 0 0 0 0 0 0 0 0 0 0 0 0 0 0 0 0 0 0 0 0 0 0 0 0 0 0 0 0 0 0 0 0 0 0 0 0 0 0 0 0 0 0 0 0 0 0 0 0 0 0 0 0 0 0 0 0 0 0 0 0 0 0 0 0 0 0 0 0 0 0 0 0 0 0 0 0 0 0 0 0 0 0 0 0 0 0 0 0 0 0 0 0 0 0 0 0 0 0 0 0 0 0 0 0 0 0 0 0 0 0 0 0 0 0 0 0 0 0 0 0 0 0 0 0 0 0 0 0 0 0 0 0 0 0 0 0 0 0 0 0 0 0 0 0 0 0 0 0 0 0 0 0 0 0 0 0 0 0 0 0 0 0 0 0 0 0 0 0 0 0 0 0 0 0 0 0 0 0 0 0 0 0 0 0 0 0 0 0 0 0 0 0 0 0 0 0 0 0 0 0 0 0 0 0 0 0 0 0 0 0 0 0 0 0 0 0 0 0 0 0 0 0 0 0 0 0 0 0 0 0 0 0 0 0 0 0 0 0 0 0 0 0 0 0 0 0 0 0 0 0 0 0 0 0 0 0 0 0 0 0 0 0 0 0 0 0 0 0 0 0 0 0 0 0 0 0 0 0 0 0 0 0 0 0 0 0 0 0 0 0 0 0 0 0 0 0 0 0 0 0 0 0 0 0 0 0 0 0 0 0 0 0 0 0 0 0 0 0 0 0 0 0 0 0 0 0 0 0 0 0 0 0 0 0 0 0 0 0 0 0 0 0 0 0 0 0 0 0 0 0 0 0 0 0 0 0 0 0 0 0 0 0 0 0 0 0 0 0 0 0 0 0 0 0 0 0 0 0 0 0 0 0 0 0 0 0 0 0 0 0 0 0 0 0 0 0 0 0 0 0 0 0 0 0 0 0 0 0 0 0 0 0 0 0 0 0 0 0 0 0 0 0 0 0 0 0 0 0 0 0 0 0 0 0 0 0 0 0 0 0 0 0 0 0 0 0 0 0 0 0 0 0 0 0 0 0 0 0 0 0 0 0 0 0 0 0 0 0 0 0 0 0 0 0 0 0 0 0 0 0 0 0 0 0 0 0 0 0 0 0 0 0 0 0 0 0 0 0 0 0 0 0 0 0 0 0 0 0 0 0 0 0 0 0 0 0 0 0 0 0 0 0 0 0 0 0 0 0 0 0 0 0 0 0 0 0 0 0 0 0 0 0 0 0 0 0 0 0 0 0 0 0 0 0 0 0 0 0 0 0 0 0 0 0 0 0 0 0 0 0 0 0 0 0 0 0 0 0 0 0 0 0 0 0 0 0 0 0 0 0 0 0 0 0 0 0 0 0 0 0 0 0 0 0 0 0 0 0 0 0 0 0 0 0 0 0 0 0 0 0 0 0 0 0 0 0 0 0 0 0 0 0 0 0 0 0 0 0 0 0 0 0 0 0 0 0 0 0 0 0 0 0 0 0 0 0 0 0 0 0 0 0 0 0 0 0 0 0 0 0 0 0 0 0 0 0 0 0 0 0 0 0 0 0 0 0 0 0 SP226 Bacteria;Firmicutes;Clostridia;Clostridiales;Peptoniphilaceae;Parvimonas;micra 0 0 25 0 1 16 0 0 1 0 12 0 0 3 0 12 14 0 4 6 44 0 0 0 54 53 0 78 2 6 33 0 136 7 0 23 0 0 0 0 0 0 8 0 7 8 1 0 45 20 2 24 10 8 21 0 0 2 0 0 42 6 0 1 12 0 1 0 125 0 0 8 0 5 0 0 0 87 1 1 0 0 0 0 40 0 0 6 568 2 4 97 28 36 0 0 0 31 0 1 0 128 0 0 0 7 0 89 106 0 0 0 8 40 15 2 2 8 252 0 0 63 14 3 6 33 0 0 15 17 16 0 0 11 0 17 147 53 45 40 0 0 0 23 14 9 83 5 0 0 4 0 0 11 30 1 0 0 8 0 0 10 2 39 4 0 145 53 13 0 0 72 174 36 0 0 16 11 0 0 0 0 0 105 0 0 0 44 0 46 0 12 0 104 1 310 113 0 0 0 8 0 77 0 3 7 0 0 9 0 21 1 0 24 17 129 47 163 0 12 0 1 0 13 0 0 48 0 0 2 58 9 71 5 0 34 72 4 16 29 0 0 13 0 40 82 2 0 0 0 8 0 0 20 0 0 1 10 0 0 0 44 24 3 0 0 0 23 0 0 0 0 0 0 0 0 2 0 1 0 4 0 1 15 0 0 0 2 1 0 2 1 9 0 0 0 0 0 0 0 0 0 38 0 0 1 0 0 0 0 0 5 0 0 0 0 0 2 0 0 0 0 0 0 0 0 0 0 0 0 0 0 0 0 0 0 0 0 0 0 0 0 0 0 0 0 0 0 0 0 0 0 0 0 0 0 0 0 0 0 0 2 0 0 0 0 0 0 0 0 2 0 0 0 0 0 0 0 0 0 0 0 0 0 0 0 0 0 0 0 0 0 0 0 0 7 0 0 0 0 0 0 0 0 0 0 0 9 2 0 0 0 0 1 1 1 5 0 3 0 0 0 0 0 2 2 1 0 0 0 0 0 11 1 0 0 0 0 0 0 0 0 0 0 0 0 0 0 3 8 0 0 0 0 0 2 0 0 0 0 0 0 0 0 0 0 0 1 0 0 0 0 2 1 9 0 0 0 1 0 0 0 0 0 2 0 3 3 0 0 0 0 0 0 0 0 0 0 0 0 6 0 0 0 0 0 0 0 0 0 11 0 0 0 0 0 0 0 0 0 0 0 0 0 0 0 0 0 0 0 0 0 0 0 0 0 0 5 0 0 0 0 0 0 0 0 0 14 0 0 0 0 0 2 8 0 0 0 0 1 0 1 0 0 1 0 0 0 0 2 0 0 0 0 0 0 0 0 0 0 0 0 0 0 0 0 9 0 0 1 0 0 0 0 0 0 0 0 0 0 0 0 0 3 0 1 0 1 0 0 2 0 0 0 0 0 0 0 0 0 0 0 0 0 0 0 0 0 2 0 0 0 0 0 0 0 0 0 2 1 0 2 0 0 0 0 0 0 7 0 0 6 1 2 0 0 0 0 0 1 0 0 5 0 0 1 1 2 0 0 0 0 0 0 0 1 4 0 0 3 0 0 0 0 0 1 0 0 3 0 0 0 0 0 0 1 0 0 0 1 16 0 5 0 0 0 0 0 0 0 0 0 0 0 0 0 0 0 0 0 0 0 0 0 0 0 11 0 3 1 0 0 0 1 0 1 2 0 0 1 0 0 0 0 0 0 0 0 0 0 0 2 0 0 0 0 0 0 0 0 0 0 0 0 0 0 0 0 0 15 0 0 0 0 0 0 0 0 91 57 0 0 0 0 0 0 0 0 0 0 1 0 0 0 1 0 0 0 0 0 0 0 0 0 1 0 2 0 0 0 0 0 0 0 7 2 0 2 0 0 6 0 0 0 0 1 0 0 0 3 0 0 1 0 0 0 0 0 0 0 0 22 0 0 2 0 0 0 0 0 0 1 0 0 0 0 0 0 0 0 0 0 0 0 0 1 0 0 0 0 0 0 0 0 0 0 0 0 0 0 0 0 0 0 0 1 0 1 28 0 0 0 0 24 0 0 0 0 0 0 0 0 0 0 0 0 0 0 0 0 0 0 0 0 0 0 0 0 32 0 1 0 0 3 0 0 0 0 0 0 0 2 5 0 0 0 3 0 0 2 1 0 0 0 0 0 3 0 0 0 0 0 1 1 2 0 3 1 0 1 0 0 0 6 0 0 0 1 8 0 0 0 0 0 0 0 0 0 0 0 0 0 0 4 0 0 0 3 0 1 0 0 0 3 0 1 0 0 0 0 1 0 0 0 1 0 0 0 0 0 0 0 0 0 3 0 0 0 1 0 0 0 0 0 0 0 9 0 0 0 0 0 0 1 0 0 0 0 0 0 0 0 0 8 3 0 1 0 0 0 0 0 0 1 0 0 4 0 0 0 0 1 0 0 0 0 1 1 0 0 1 0 0 0 0 0 0 0 0 0 0 2 0 0 0 1 0 0 3 0 1 2 0 0 0 0 0 0 0 0 0 0 0 0 0 4 0 0 0 0 0 0 0 1 0 0 0 0 0 0 0 0 0 0 0 0 0 0 0 7 0 0 0 0 0 0 0 0 0 0 1 0 0 0 0 0 0 8 0 0 2 0 0 0 0 0 1 0 0 0 0 0 0 0 0 0 0 0 0 0 0 9 0 0 0 0 0 0 0 0 0 0 0 0 0 0 0 0 0 0 0 0 0 0 0 0 1 1 0 11 1 1 0 0 0 0 0 1 0 0 1 1 0 0 0 0 0 0 0 1 0 0 0 0 0 0 0 0 0 0 0 0 0 0 7 0 0 1 0 0 0 0 0 0 0 0 0 30 0 0 0 0 0 1 3 0 0 0 0 0 0 0 0 8 0 0 3 2 0 0 0 0 1 1 3 0 0 0 0 0 0 0 0 0 0 0 0 0 1 0 0 1 0 3 0 1 8 0 0 0 0 0 1 1 0 2 0 0 0 0 1 0 0 0 2 0 1 0 0 0 0 0 0 0 2 0 0 0 0 0 1 0 7 0 0 157 0 0 0 1 0 0 0 0 0 0 0 0 0 0 0 0 0 0 0 0 3 0 0 6 0 0 0 0 1 0 0 0 0 0 0 0 0 0 102 2 0 0 0 0 0 0 0 0 0 1 0 0 0 0 1 1 1 0 0 0 0 0 0 0 0 0 0 3 0 0 0 0 0 0 0 0 0 0 0 0 0 4 7 0 0 0 0 0 0 0 0 0 1 0 55 0 0 0 1 0 0 1 0 0 2 0 0 0 1 0 0 1 1 0 2 0 0 9 0 0 0 0 2 0 0 0 0 0 0 3 3 0 0 0 0 0 0 0 0 0 0 0 0 0 0 0 0 0 0 0 0 0 0 0 0 0 0 0 0 0 1 0 0 1 0 0 0 0 0 3 0 0 0 0 0 0 0 0 0 3 8 0 0 0 0 0 0 0 0 0 0 0 0 3 0 0 0 0 0 0 0 0 0 0 5 0 0 0 5 0 0 0 0 0 0 1 0 0 0 2 7 0 0 0 0 0 0 0 6 0 0 0 2 0 0 0 0 0 0 0 0 0 1 0 1 0 0 1 0 0 0 0 0 0 0 0 0 0 0 0 2 0 0 0 1 0 0 0 0 0 0 0 0 0 4 0 0 0 0 0 0 0 0 0 5 0 0 2 1 0 0 1 0 0 0 0 0 2 2 1 3 13 0 0 0 0 0 0 0 0 0 4 0 0 0 0 0 0 0 1 0 0 0 0 0 0 0 0 0 0 0 0 0 0 0 0 0 0 0 0 0 0 0 0 0 0 0 0 0 0 0 0 2 0 6 0 0 0 0 0 0 2 0 0 0 0 0 0 13 0 0 0 0 0 2 0 0 0 0 0 0 0 0 1 0 0 0 1 1 0 0 0 0 1 0 20 1 2 0 0 0 1 0 0 1 0 0 0 0 1 0 0 0 0 0 0 0 0 20 0 0 41 0 0 0 0 0 0 0 0 0 0 0 0 8 0 0 0 8 0 0 0 0 0 1 0 1 0 0 0 0 0 0 0 0 0 0 0 0 0 0 0 0 0 0 0 0 0 0 0 0 0 0 0 0 0 0 0 1 0 0 0 0 0 0 0 0 0 SP227 Bacteria;Saccharibacteria_(TM7);Saccharibacteria_(TM7)_[C-1];Saccharibacteria_(TM7)_[O-1];Saccharibacteria_(TM7)_[F-1];Saccharibacteria_(TM7)_[G-6];bacterium HMT870 43 0 30 219 6 28 0 0 118 338 133 92 0 220 10 8 862 19 3 0 0 0 141 200 269 71 16 0 20 343 109 60 82 28 5 263 184 187 1 18 4 41 0 30 0 0 116 0 818 1 45 37 100 2 230 93 52 307 0 110 0 13 53 4 143 97 2 6 140 50 383 20 5 170 3 4 402 20 176 36 9 426 114 178 0 60 130 338 182 37 4 0 19 51 272 48 0 38 22 1561 46 64 183 0 99 102 70 135 90 3 0 71 904 78 243 42 43 0 280 61 0 173 101 38 152 135 37 2 10 134 38 15 21 1 588 53 457 4 57 8 345 20 1 22 0 321 272 223 16 102 0 818 2 104 1236 647 370 2 14 303 19 1 278 6 95 795 53 0 80 82 1 0 273 146 24 381 25 21 25 116 0 188 189 16 1385 156 316 75 0 616 53 0 495 5 15 127 5 339 400 58 17 0 305 50 17 1 48 49 38 0 53 0 25 48 80 365 10 493 49 46 119 29 75 32 809 0 144 22 209 87 2 15 235 7 1 12 133 1324 31 943 6 3 0 33 15 0 152 10 0 0 1690 65 101 3 0 11 2 133 3 26 63 1 151 201 145 421 29 0 0 5 1 0 16 0 0 1 0 1 32 2 3 0 0 0 0 0 2 0 0 32 4 0 10 0 4 96 0 12 0 67 8 0 50 4 1 0 0 0 44 5 0 0 0 0 0 0 0 0 0 0 0 2 1 0 0 0 0 0 1 0 0 0 0 0 0 0 0 0 0 0 4 0 0 0 0 0 2 0 0 0 5 70 74 0 0 0 0 0 0 0 0 1 0 0 0 2 0 1 9 0 1 0 0 15 0 0 2 4 0 2 0 0 1 0 0 1 0 37 0 0 0 0 0 3 10 0 2 0 4 5 0 0 1 0 0 0 0 0 1 0 0 14 43 0 2 0 0 0 5 0 0 0 1 0 0 0 0 0 1 0 2 67 2 9 0 2 0 1 0 0 0 0 0 0 0 10 0 0 26 6 6 0 24 0 0 1 0 4 0 0 0 0 5 6 0 1 0 0 0 0 1 1 1 2 0 0 11 2 0 7 1 0 0 30 9 68 7 3 0 7 0 0 23 0 30 4 0 0 0 2 40 0 0 0 2 1 0 1 0 0 0 12 1 0 2 1 2 3 1 0 3 7 0 11 0 0 2 2 1 0 0 0 0 0 0 0 0 1 5 0 0 4 0 2 0 1 6 10 0 1 4 0 3 4 2 0 0 1 0 2 0 7 0 0 1 14 0 0 1 1 0 0 0 2 0 0 1 8 3 0 2 189 8 1 3 0 1 3 292 0 1 0 0 0 0 0 0 11 0 0 0 0 0 0 31 65 1 0 12 72 0 0 0 9 0 3 0 0 0 0 0 0 4 0 62 0 13 0 0 2 26 0 0 0 0 0 15 0 1 0 0 115 99 0 0 0 0 59 0 6 1 22 0 3 1 0 1 63 0 0 0 0 1 0 0 0 0 0 10 80 0 0 0 0 0 1 48 0 0 0 1 0 5 6 1 0 0 1 0 5 0 6 0 5 19 0 0 1 0 0 0 0 0 1 22 3 16 1 25 0 0 10 27 7 0 0 0 0 0 1 0 0 0 29 0 1 15 1 1 41 8 0 4 0 1 0 2 0 9 3 7 0 8 1 84 2 0 0 2 2 55 0 10 0 0 0 1 3 6 24 1 4 2 0 0 0 1 0 0 50 1 10 50 0 0 0 18 0 11 0 0 7 0 0 0 0 0 0 0 87 1 0 1 9 15 0 116 0 6 0 0 0 0 0 7 0 1 0 0 11 9 0 0 0 130 15 0 0 0 4 0 1 13 0 0 0 2 1 3 0 1 3 106 0 0 0 0 0 1 0 0 0 3 0 0 0 47 0 0 0 0 49 2 0 0 0 6 0 0 1 2 1 15 37 1 0 3 3 8 1 0 0 11 0 0 0 0 2 5 4 2 0 10 7 0 0 1 1 5 0 0 0 0 0 0 0 0 0 1 0 6 0 0 0 0 0 15 26 24 6 4 10 0 0 0 0 0 1 8 4 0 0 0 24 0 0 0 43 32 0 0 0 0 0 0 48 0 19 0 0 1 0 9 26 0 0 16 0 0 0 0 0 27 4 1 10 4 46 9 3 0 0 1 2 0 1 192 0 12 9 4 0 0 36 2 0 1 3 0 114 3 2 8 47 1 39 0 1 0 15 16 0 0 1 1 0 0 0 0 0 0 3 3 1 0 62 0 0 0 0 0 1 0 1 6 0 0 0 0 0 0 0 0 30 15 0 3 22 36 0 22 16 2 14 1 9 2 9 3 0 77 54 25 2 0 1 38 16 3 1 1 0 2 0 1 0 9 72 0 159 4 1 1 0 3 4 0 310 38 3 13 8 5 0 0 9 5 1 20 0 4 50 0 0 0 3 1 10 0 0 0 6 1 1 0 9 0 0 36 0 0 0 0 3 16 0 0 0 0 0 3 0 0 1 51 0 0 2 0 0 0 0 0 0 17 5 0 4 0 3 32 5 0 0 4 1 3 24 0 0 0 8 0 11 94 5 1 1 0 5 26 8 0 27 24 11 24 12 23 0 3 0 1 1 21 3 2 7 0 10 0 6 19 107 18 0 0 3 0 0 0 3 19 0 0 18 0 5 2 3 0 1 6 1 3 0 28 15 0 4 24 5 8 5 1 0 1 5 3 0 6 2 0 5 16 5 52 32 1 3 11 8 12 9 111 12 5 0 2 5 0 4 0 0 0 4 39 0 0 0 0 3 7 0 31 0 0 5 6 28 0 0 0 10 6 15 26 0 8 4 34 5 0 3 1 0 7 18 16 12 130 7 2 14 31 0 1 22 0 1 3 17 45 3 38 0 5 14 25 2 32 2 1 3 19 0 30 9 86 2 4 7 18 3 74 1 0 0 1 6 43 0 13 31 0 0 6 1 2 35 0 0 0 54 7 0 3 89 5 10 4 3 9 5 1 0 21 6 0 14 4 0 35 18 70 3 4 16 0 0 0 6 85 27 78 135 32 2 2 3 0 102 13 0 58 5 5 0 0 0 98 4 20 21 0 0 28 0 5 3 1 11 0 0 0 0 206 0 5 5 0 5 0 5 12 0 0 11 0 0 18 2 0 0 0 4 2 2 42 1 0 0 4 5 7 20 0 5 0 0 1 0 16 1 0 0 15 25 5 1 11 0 1 19 15 81 16 31 0 0 5 12 14 0 0 0 3 0 16 2 157 11 0 1 1 7 7 4 3 0 34 28 1 12 0 2 8 6 7 160 0 0 10 8 112 21 7 0 79 25 1 1 0 0 0 0 0 81 0 14 0 15 0 0 0 0 6 58 0 22 3 0 9 1 38 5 1 18 0 3 11 54 0 3 13 1 2 0 0 33 0 132 2 6 0 0 2 450 0 12 15 0 0 1 0 46 6 0 52 18 41 24 31 94 59 3 15 10 4 20 8 1 14 25 2 0 2 32 2 1 2 6 12 3 0 8 0 1 1 0 2 30 7 2 2 0 68 36 3 0 40 40 13 7 41 1 1 10 0 0 25 50 0 11 16 14 4 9 6 0 5 5 3 64 1 0 1 21 1 22 4 20 1 25 0 1 10 0 70 0 12 51 58 1 5 0 4 0 4 0 0 4 1 5 9 8 115 15 1 22 14 6 16 11 2 104 5 0 0 5 4 0 0 4 3 2 14 21 26 1 0 24 25 24 15 2 3 0 0 9 0 21 3 0 0 6 1 25 16 0 1 5 7 3 121 1 8 16 5 61 2 4 4 18 0 9 18 32 19 45 6 0 201 8 0 29 38 143 0 3 4 34 0 3 2 0 0 0 1 0 9 5 5 83 3 0 0 1 1 3 0 17 3 0 75 14 31 14 18 0 21 7 0 2 0 0 7 6 0 0 0 0 1 5 1 50 6 6 0 91 0 0 0 0 32 5 29 0 0 4 21 0 32 0 9 11 55 9 14 1 18 2 0 2 0 0 0 0 8 0 3 0 5 0 71 28 0 29 0 0 0 2 0 66 32 27 6 0 1 0 273 0 0 4 36 1 1 0 1 89 44 7 0 10 SP228 Bacteria;Proteobacteria;Gammaproteobacteria;Pasteurellales;Pasteurellaceae;Haemophilus;sputorum 0 3 7 0 62 229 0 0 2 74 12 388 5051 18 265 2 46 34 46 5 0 0 49 0 3 10 2 37 0 161 5 54 12 30 23 54 0 5 39 94 5 189 7 72 25 37 1071 0 0 26 9 0 9 148 23 17 39 27 142 81 0 64 121 0 39 51 2 8 27 21 0 4 102 8 0 6 7 30 0 2 0 9 5 7 5 0 2 12 0 5 0 0 3 21 5 5 198 104 45 5 4 362 7 6 7 8 0 26 15 9 0 6 0 3 18 50 42 1 1 1 73 10 94 0 0 5 0 0 71 0 1 6 0 59 15 29 151 11 0 0 0 10 7 0 0 39 5 20 1 45 9 1 9 4 0 1 0 0 3 4 6 57 13 132 1 0 0 1 3 0 0 0 10 61 0 1 1 1 4 22 29 8 82 19 13 24 19 34 0 6 2 36 2 2 2 17 0 2 2 30 0 14 7 6 2 18 19 0 29 11 2 23 16 0 1 8 2 2 0 0 562 25 13 65 27 0 22 91 0 25 2 14 113 7 17 16 13 5 28 66 0 71 17 52 2 3 5 5 10 0 13 354 4 5 0 1 9 8 0 0 0 0 1 6 2 3 0 0 0 0 0 0 0 0 0 0 0 0 0 0 0 0 0 0 0 0 0 0 0 0 0 0 0 0 0 0 0 0 0 0 0 0 0 0 0 0 0 0 0 0 0 0 0 0 0 0 0 0 0 0 0 0 0 0 0 0 0 0 0 0 0 0 0 0 0 0 0 0 0 0 0 0 0 0 0 0 0 0 0 0 0 0 0 0 0 0 0 0 0 0 0 0 0 0 0 0 0 0 0 0 0 0 0 0 0 0 0 0 0 0 0 0 0 0 0 0 0 0 0 0 0 0 0 0 0 0 0 0 0 0 0 0 0 0 0 0 0 0 0 0 0 0 0 0 0 0 0 0 0 0 0 0 0 0 0 0 0 0 0 0 0 0 0 0 0 0 0 0 0 0 0 0 0 0 0 0 0 0 0 0 0 0 0 0 0 0 0 0 0 0 0 0 0 0 0 0 0 0 0 0 0 0 0 0 0 0 0 0 0 0 0 0 0 0 0 0 0 0 0 0 0 0 0 0 0 0 0 0 0 0 0 0 0 0 0 0 0 0 0 0 0 0 0 0 0 0 0 0 0 0 0 0 0 0 0 0 0 0 0 0 0 0 0 0 0 0 0 0 0 0 0 0 0 0 0 0 0 0 0 0 0 0 0 0 0 0 0 0 0 0 0 0 0 0 0 0 0 0 0 0 0 0 0 0 0 0 0 0 0 0 0 0 0 0 0 0 0 0 0 0 0 0 0 0 0 0 0 0 0 0 0 0 0 0 0 0 0 0 0 0 0 0 0 0 0 0 0 0 0 0 0 0 0 0 0 0 0 0 0 0 0 0 0 0 0 0 0 0 0 0 0 0 0 0 0 0 0 0 0 0 0 0 0 0 0 0 0 0 0 0 0 0 0 0 0 0 0 0 0 0 0 0 0 0 0 0 0 0 0 0 0 0 0 0 0 0 0 0 0 0 0 0 0 0 0 0 0 0 0 0 0 0 0 0 0 0 0 0 0 0 0 0 0 0 0 0 0 0 0 0 0 0 0 0 0 0 0 0 0 0 0 0 0 0 0 0 0 0 0 0 0 0 0 0 0 0 0 0 0 0 0 0 0 0 0 0 0 0 0 0 0 0 0 0 0 0 0 0 0 0 0 0 0 0 0 0 0 0 0 0 0 0 0 0 0 0 0 0 0 0 0 0 0 0 0 0 0 0 0 0 0 0 0 0 0 0 0 0 0 0 0 0 0 0 0 0 0 0 0 0 0 0 0 0 0 0 0 0 0 0 0 0 0 0 0 0 0 0 0 0 0 0 0 0 0 0 0 0 0 0 0 0 0 0 0 0 0 0 0 0 0 0 0 0 0 0 0 0 0 0 0 0 0 0 0 0 0 0 0 0 0 0 0 0 0 0 0 0 0 0 0 0 0 0 0 0 0 0 0 0 0 0 0 0 0 0 0 0 0 0 0 0 0 0 0 0 0 0 0 0 0 0 0 0 0 0 0 0 0 0 0 0 0 0 0 0 0 0 0 0 0 0 0 0 0 0 0 0 0 0 0 0 0 0 0 0 0 0 0 0 0 0 0 0 0 0 0 0 0 0 0 0 0 0 0 0 0 0 0 0 0 0 0 0 0 0 0 0 0 0 0 0 0 0 0 0 0 0 0 0 0 0 0 0 0 0 0 0 0 0 0 0 0 0 0 0 0 0 0 0 0 0 0 0 0 0 0 0 0 0 0 0 0 0 0 0 0 0 0 0 0 0 0 0 0 0 0 0 0 0 0 0 0 0 0 0 0 0 0 0 0 0 0 0 0 0 0 0 0 0 0 0 0 0 0 0 0 0 0 0 0 0 0 0 0 0 0 0 0 0 0 0 0 0 0 0 0 0 0 0 0 0 0 0 0 0 0 0 0 0 0 0 0 0 0 0 0 0 0 0 0 0 0 0 0 0 0 0 0 0 0 0 0 0 0 0 0 0 0 0 0 0 0 0 0 0 0 0 0 0 0 0 0 0 0 0 0 0 0 0 0 0 0 0 0 0 0 0 0 0 0 0 0 0 0 0 0 0 0 0 0 0 0 0 0 0 0 0 0 0 0 0 0 0 0 0 0 0 0 0 0 0 0 0 0 0 0 0 0 0 0 0 0 0 0 0 0 0 0 0 0 0 0 0 0 0 0 0 0 0 0 0 0 0 0 0 0 0 0 0 0 0 0 0 0 0 0 0 0 0 0 0 0 0 0 0 0 0 0 0 0 0 0 0 0 0 0 0 0 0 0 0 0 0 0 0 0 0 0 0 0 0 0 0 0 0 0 0 0 0 0 0 0 0 0 0 0 0 0 0 0 0 0 0 0 0 0 0 0 0 0 0 0 0 0 0 0 0 0 0 0 0 0 0 0 0 0 0 0 0 0 0 0 0 0 0 0 0 0 0 0 0 0 0 0 0 0 0 0 0 0 0 0 0 0 0 0 0 0 0 0 0 0 0 0 0 0 0 0 0 0 0 0 0 0 0 0 0 0 0 0 0 0 0 0 0 0 0 0 0 0 0 0 0 0 0 0 0 0 0 0 0 0 0 0 0 0 0 0 0 0 0 0 0 0 0 0 0 0 0 0 0 0 0 0 0 0 0 0 0 0 0 0 0 0 0 0 0 0 0 0 0 0 0 0 0 0 0 0 0 0 0 0 0 0 0 0 0 0 0 0 0 0 0 0 0 0 0 0 0 0 0 0 0 0 0 0 0 0 0 0 0 0 0 0 0 0 0 0 0 0 0 0 0 0 0 0 0 0 0 0 0 0 0 0 0 0 0 0 0 0 0 0 0 0 0 0 0 0 0 0 0 0 0 0 0 0 0 0 0 0 0 0 0 0 0 0 0 0 0 0 0 0 0 0 0 0 0 0 0 0 0 0 0 0 0 0 0 0 0 0 0 0 0 0 0 0 0 0 0 0 0 0 0 0 0 0 0 0 0 0 0 0 0 0 0 0 0 0 0 0 0 0 0 0 0 0 0 0 0 0 0 0 0 0 0 0 0 0 0 0 0 0 0 0 0 0 0 0 0 0 0 0 0 0 0 0 0 0 0 0 0 0 0 0 0 0 0 0 0 0 0 0 0 0 0 0 0 0 0 0 0 0 0 0 0 0 0 0 0 0 0 0 0 0 0 0 0 0 0 0 0 0 0 0 0 0 0 0 0 0 0 0 0 0 0 0 0 0 0 0 0 0 0 0 0 0 0 0 0 0 0 0 0 0 0 0 0 0 0 0 0 0 0 0 0 0 0 0 0 0 0 0 0 0 0 0 0 0 0 0 0 0 0 0 0 0 0 0 0 0 0 0 0 0 0 0 0 0 0 0 0 0 0 0 0 0 0 0 0 0 0 0 0 0 0 0 0 0 0 0 0 0 0 0 0 0 0 0 0 0 0 0 0 0 0 0 0 0 0 0 0 0 0 0 0 0 0 0 0 0 0 0 0 0 0 0 0 0 0 0 0 0 0 0 0 0 0 0 0 0 0 0 0 SP229 Bacteria;Fusobacteria;Fusobacteriia;Fusobacteriales;Leptotrichiaceae;Leptotrichia;sp. HMT218 29 0 0 0 0 0 0 0 0 0 0 0 0 4 0 0 99 0 0 0 0 0 0 0 0 0 0 0 0 0 0 0 0 0 0 0 0 0 91 0 0 0 1 0 0 0 0 0 0 0 1153 11 5 0 0 0 842 3 0 0 0 0 0 0 0 0 0 0 250 0 0 0 0 0 0 0 82 5 0 21 0 0 0 0 0 0 0 0 0 0 0 0 0 0 0 0 0 0 0 0 0 0 0 0 3 0 0 0 0 0 0 0 0 0 623 1 123 0 0 0 0 0 0 0 44 0 416 0 0 0 6 0 0 0 0 0 0 0 0 0 0 0 0 0 0 160 0 0 1 0 0 0 0 0 0 0 0 0 0 0 0 0 0 0 0 0 0 0 0 0 0 0 0 0 37 0 0 0 0 0 0 0 0 0 0 0 0 0 0 0 0 0 227 0 1 0 0 0 0 0 0 0 0 0 1 8 0 0 0 0 0 0 0 0 0 1 0 0 0 4 0 0 0 0 0 0 0 0 0 0 0 0 4 0 0 0 5 0 0 0 0 0 0 0 0 0 0 0 0 0 79 0 0 0 0 0 0 0 0 8 1 38 0 0 0 0 0 0 0 0 0 0 0 0 0 0 0 0 0 1 2 65 0 0 0 0 0 0 0 0 0 0 1 0 1 0 0 8 0 0 0 0 0 0 0 0 0 0 0 0 0 0 0 0 1 1 0 0 0 0 0 0 0 0 0 0 0 0 0 0 0 0 0 0 0 0 0 0 0 0 0 0 0 0 0 0 0 0 0 0 0 0 0 0 0 0 0 0 0 0 0 0 0 0 0 0 0 9 0 0 0 0 0 0 0 0 0 0 0 0 0 0 0 0 0 0 0 0 0 0 0 0 0 0 0 0 0 0 0 5 0 0 0 0 0 0 0 0 0 0 0 0 0 0 0 0 0 0 0 0 0 0 0 0 0 0 0 0 0 0 0 0 0 0 0 0 0 0 0 0 0 0 0 0 0 0 0 0 0 0 0 0 0 0 0 0 0 0 0 0 0 0 0 0 0 0 0 0 0 0 0 0 0 0 0 0 0 0 0 1 0 0 0 0 0 0 0 0 0 0 0 0 0 0 0 0 0 0 0 0 0 0 0 0 0 0 0 0 0 0 0 0 0 0 0 4 3 0 0 0 0 0 0 0 0 0 0 0 0 0 0 0 0 0 0 0 0 0 0 0 0 0 0 0 0 0 0 0 0 0 0 55 0 0 0 0 0 0 0 22 0 18 1 396 0 0 0 0 0 0 0 0 0 0 0 0 0 0 0 0 0 0 0 0 0 0 0 0 0 0 0 0 0 0 0 0 0 0 0 0 0 0 0 0 0 0 0 0 0 0 0 0 0 0 0 0 0 0 0 0 0 0 0 0 0 0 0 0 0 0 0 0 0 0 0 0 0 0 0 0 0 0 0 0 0 0 0 0 0 0 0 0 0 0 0 0 0 0 0 0 0 0 0 0 0 0 0 0 0 0 0 0 0 3 0 0 0 0 0 0 0 0 0 0 0 0 0 0 0 0 0 0 0 0 0 0 0 0 0 0 0 0 2 0 0 0 0 0 0 0 0 0 0 0 0 0 0 0 0 0 0 0 0 0 0 0 0 0 0 0 0 0 0 0 0 0 0 0 0 18 0 3 0 0 0 0 0 0 0 0 0 0 0 0 0 0 0 0 0 0 0 0 0 0 0 0 0 0 0 186 0 0 0 0 1 0 0 0 0 1 0 0 0 0 2 0 0 0 0 0 0 0 0 0 0 0 0 0 0 0 0 0 0 0 0 0 0 0 0 0 0 0 0 0 0 0 0 0 0 0 0 0 0 0 0 0 2 0 0 0 0 0 0 0 0 0 0 0 0 0 0 0 0 0 0 0 0 0 0 0 0 0 0 0 0 0 0 0 0 0 0 0 0 0 0 0 0 0 0 0 0 5 0 0 0 0 0 0 0 0 0 0 0 0 0 0 0 0 0 0 0 0 0 0 0 0 0 0 0 0 0 0 0 0 0 0 0 0 0 0 0 0 0 0 0 0 0 0 0 0 0 0 0 0 0 0 0 1 0 0 0 0 0 0 0 0 0 0 0 0 0 0 0 0 0 0 0 0 0 0 0 0 6 2 0 0 2 0 0 0 0 0 0 0 0 0 0 0 0 0 0 0 0 0 0 0 0 0 0 0 0 0 0 0 0 0 0 1 0 0 0 0 0 49 0 1 0 0 0 8 0 0 0 0 0 0 0 0 0 0 0 0 0 0 0 0 0 0 2 0 0 0 0 0 0 0 0 0 8 9 0 0 0 0 0 7 0 1 0 0 0 0 0 0 0 0 0 0 0 1 14 0 0 0 0 0 0 0 0 0 0 0 0 0 0 5 0 0 0 0 0 0 0 0 0 0 0 0 0 0 0 0 0 0 0 0 0 0 0 0 0 0 0 0 0 0 0 0 25 0 0 0 0 0 0 0 0 0 0 0 13 0 0 0 0 0 0 0 0 0 0 0 0 0 0 0 0 0 0 0 0 0 0 0 0 0 0 1 0 0 0 0 0 15 0 0 0 2 0 0 0 0 0 0 0 2 0 0 0 0 0 0 0 0 0 0 0 0 0 0 0 0 0 0 0 0 0 0 0 0 0 4 2 0 1 0 0 0 0 0 0 0 0 0 0 0 0 0 0 0 0 0 0 0 0 0 0 0 0 0 0 0 0 1 3 6 0 7 0 0 26 10 3 7 0 0 15 0 0 0 0 75 10 0 0 5 0 0 0 0 0 0 0 0 0 0 1 0 0 0 0 0 0 6 0 0 0 0 0 0 0 0 0 0 0 0 0 0 1 0 0 0 0 0 0 0 0 0 0 0 0 0 0 0 0 0 0 0 33 0 6 0 16 149 0 12 0 0 0 0 0 8 0 0 0 0 0 0 0 0 0 0 0 0 2 10 0 0 0 0 0 0 1 0 0 0 0 0 0 171 0 0 0 0 0 0 0 0 0 0 0 0 0 0 1 0 0 0 0 0 0 0 0 0 0 0 0 0 0 0 0 0 0 0 0 0 0 0 0 0 0 0 0 0 0 0 0 0 0 0 0 0 0 0 0 0 0 0 0 0 0 0 0 0 0 0 0 0 0 1 0 0 0 0 0 0 0 0 0 0 0 0 0 0 0 0 0 0 0 0 0 0 0 0 0 0 0 0 0 0 0 0 0 12 0 0 0 0 1 0 0 0 0 0 0 0 0 0 0 0 0 0 0 0 0 0 0 0 0 0 0 0 0 0 0 0 0 0 0 0 0 0 0 0 0 0 0 0 0 0 0 0 0 0 0 0 0 0 0 0 0 0 0 0 0 0 0 0 0 0 0 0 0 4 0 0 0 0 0 0 0 0 0 0 0 0 0 0 0 4 0 0 0 0 0 0 0 0 0 3 0 0 0 0 0 0 0 0 2 0 0 0 0 0 0 0 0 0 0 0 0 0 0 0 1 0 0 0 0 0 0 0 0 0 0 0 0 0 0 0 0 0 0 0 0 0 1 0 0 0 6 7 0 0 0 2 0 0 0 0 0 0 0 0 0 0 0 0 0 0 10 3 0 0 0 0 0 0 0 0 3 0 0 16 0 0 5 0 0 0 0 0 0 0 1 0 0 0 0 0 0 0 0 0 0 0 0 0 0 0 0 0 0 0 0 0 0 0 2 0 0 0 0 0 0 0 0 0 0 0 0 14 0 0 8 8 0 0 0 0 0 0 0 0 0 20 0 0 0 0 0 0 0 0 0 0 0 0 0 0 0 0 0 0 0 0 0 0 0 0 0 0 0 0 0 0 0 0 0 0 5 3 3 4 0 0 0 0 0 0 0 0 0 0 0 0 10 0 0 0 0 0 0 0 0 0 0 0 2 0 0 0 0 0 0 0 0 0 0 0 0 0 0 0 0 0 0 0 2 0 0 0 0 0 0 0 0 0 0 0 1 0 0 0 7 0 0 0 0 0 1 0 0 0 0 0 0 6 0 0 0 0 546 0 0 0 0 3 0 0 0 96 0 0 0 0 0 0 0 0 0 0 0 0 0 0 0 0 0 0 0 0 0 0 SP23 Bacteria;Fusobacteria;Fusobacteria;Fusobacteriales;Fusobacteriaceae;Fusobacterium;nucleatum 10 37 24 3 10 103 76 22 10 46 8 233 399 10 1841 1 14 51 9 16 6 16 15 311 46 42 35 40 266 730 734 17 897 255 146 22 90 183 24 154 66 58 83 32 8 154 34 2 120 18 11 122 194 54 60 100 27 23 20 31 37 20 79 451 44 25 63 69 1919 529 284 389 1177 21 34 7 1 5 118 19 936 19 39 41 2 38 25 17 23 143 223 20 49 588 16 111 216 634 553 39 38 142 7 134 250 102 14 362 20 33 74 305 71 383 75 25 5 16 36 1397 113 229 20 68 44 9 25 227 69 558 69 147 27 514 67 1345 33 61 10 548 48 554 529 67 133 36 95 132 8 42 45 46 2219 40 1 21 27 7 73 5 100 174 25 34 19 10 46 5 78 2 1 4 13 37 24 3 5 3 2 90 3 11 61 73 17 9 23 196 2 535 4 10 3 30 16 90 4 15 15 176 177 116 1342 13 8 80 51 28 141 110 45 1 41 103 47 57 115 4 13 2 194 37 8 77 83 55 32 241 215 193 245 14 199 1263 2231 38 301 6 15 84 57 47 83 51 45 18 29 78 133 1 136 38 0 20 0 3 4 3 0 2 12 1 1 28 46 1 10 157 0 244 19 0 6 8 43 0 31 41 105 66 154 58 21 107 25 5 6 5 61 6 195 1 6 0 65 68 97 113 0 71 18 51 235 78 55 3 48 2 164 1 63 33 4 1 8 15 76 51 4 2 1 89 96 0 55 0 0 0 1 0 0 5 3 0 0 0 1 8 6 6 5 47 0 4 6 0 0 2 33 0 13 10 0 3 1 1 0 31 1 1 0 1 0 82 1 112 0 15 109 0 69 0 126 529 5 1 0 0 0 168 0 0 1 2 0 12 457 31 0 2 2 1 0 33 10 7 13 0 0 52 209 0 28 138 162 0 0 16 5 4 2 232 10 462 223 0 84 0 719 0 7 5 99 17 2 145 82 1 0 8 0 12 190 90 0 24 23 0 0 1 53 1 9 0 3 77 0 0 30 101 64 11 103 0 1 42 1 31 0 180 96 208 0 1 42 12 0 215 9 1 134 124 10 0 64 0 56 22 16 178 59 26 10 98 324 150 77 183 0 147 38 116 2 571 340 3 44 116 1 134 294 5 0 8 350 0 7 9 7 0 94 129 0 1 3 1 5 65 8 73 0 10 0 0 81 17 0 45 0 7 0 40 125 0 94 0 29 659 0 13 0 57 145 18 5 0 76 98 71 70 36 46 0 0 25 0 0 57 0 81 4 220 2 189 97 221 0 3 0 26 18 0 0 15 38 46 135 5 2 0 0 12 20 0 2 8 82 0 1 0 26 0 0 3 3 181 12 171 0 0 0 0 0 8 152 3 21 0 39 81 2 52 113 0 0 19 13 43 144 112 64 23 11 15 15 153 66 1 7 32 100 4 12 19 63 219 151 0 43 80 3 7 35 163 15 0 0 2 6 0 42 95 6 67 4 16 189 4 32 60 27 0 113 48 15 40 19 0 1 0 88 25 280 111 0 10 31 0 14 2 0 2 96 0 0 94 95 15 2 54 29 0 6 102 10 79 0 6 0 9 279 95 9 14 3 6 28 1 0 36 13 3 108 72 0 2 7 2 37 1 1 4 114 9 25 54 209 167 217 16 121 149 0 11 13 19 11 76 349 86 1 34 193 2 40 0 7 47 524 8 83 8 105 0 1 56 17 27 0 151 67 95 299 15 64 0 238 108 6 361 60 0 249 71 0 44 42 0 126 15 15 38 0 36 2 11 239 19 5 0 2 38 18 17 0 50 97 0 1 3 1 1 1 85 2 10 31 0 182 2 38 1 3 0 4 79 1 4 9 2 9 2 0 1 0 0 5 35 41 0 0 1 1 0 4 9 54 77 3 24 245 64 115 10 7 26 0 14 13 0 0 222 10 23 119 1 570 446 48 0 7 3 84 101 0 2 5 52 67 39 12 395 5 197 126 6 4 3 73 0 14 151 97 95 13 6 4 10 41 70 72 0 0 2 2 0 6 0 44 2 94 1 129 0 0 0 0 48 1074 368 205 182 0 179 57 44 0 63 206 60 0 17 27 182 95 0 1 86 4 131 100 11 44 210 1 54 2 156 26 51 66 1 289 24 0 25 266 8 178 78 109 9 125 413 0 185 106 0 0 1 5 131 0 186 0 10 0 107 134 29 59 190 0 216 58 25 349 100 2 53 16 5 42 15 0 108 0 75 39 252 51 1 100 124 5 53 101 7 0 12 12 87 51 44 121 207 0 0 0 0 0 14 0 0 188 89 0 0 0 0 0 1 3 45 90 0 200 75 38 0 11 49 2 52 54 7 48 2 70 0 68 15 3 0 50 0 19 37 19 0 42 35 0 29 6 0 65 70 0 1 309 41 43 0 64 131 1 6 16 0 17 6 2 0 40 14 30 1 56 0 6 513 35 0 87 65 3 3 9 42 0 26 7 25 0 6 0 6 1 14 16 0 19 6 3 0 5 0 8 6 4 5 32 69 0 40 2 0 1 95 16 1 185 17 134 3 81 48 0 56 27 0 14 56 1 1 50 27 10 25 4 0 0 6 18 1 0 54 9 0 354 16 1 4 57 0 3 42 109 0 1 19 30 33 56 6 40 11 6 124 1 30 279 15 45 24 2 14 1 4 1 76 10 98 53 33 50 34 3 25 189 0 37 100 22 5 69 210 2 260 79 4 17 161 3 34 0 33 27 1 72 38 0 104 15 6 0 23 36 2 1 129 98 4 15 7 2 25 18 47 1 35 51 0 273 86 0 2 18 7 2 3 101 4 4 0 7 36 88 3 0 13 7 30 144 4 40 51 0 144 225 0 4 121 98 0 89 179 2 128 18 0 3 52 40 0 3 47 1 38 3 7 14 16 19 0 88 14 2 6 100 234 0 107 12 0 87 19 0 179 12 25 0 142 3 5 139 18 3 208 97 1 0 27 55 4 2 5 0 6 8 4 6 9 0 177 11 75 0 104 11 0 300 57 102 287 12 0 325 110 34 0 276 56 1 192 18 0 0 7 0 2 7 12 24 3 67 4 1 133 5 1 17 2 98 174 8 64 93 2 130 119 10 6 641 25 22 48 123 24 2 8 1 2 64 0 0 1 70 22 1 73 35 1 0 70 19 14 1 1 49 0 4 87 6 0 11 21 1 1 0 2 141 2 84 232 5 52 2 0 1 3 3 9 6 1 1 16 47 7 187 40 1 4 43 161 6 34 0 14 69 44 4 203 8 0 4 9 134 1 17 84 0 43 151 7 20 22 229 49 15 344 16 413 0 28 25 5 6 44 1 277 19 15 1 52 21 0 2 8 5 55 37 11 0 5 15 0 5 724 1 0 62 0 9 23 25 10 55 12 3 99 620 7 172 447 41 1 0 184 39 10 12 6 0 6 30 0 12 184 11 0 185 9 2 29 69 0 0 32 5 0 48 7 0 191 432 1 16 5 53 64 74 2 67 0 0 0 25 3 0 202 7 110 0 53 107 5 20 5 15 537 3 0 95 151 7 1 183 2 9 71 5 90 22 4 28 136 128 0 8 6 6 12 167 7 66 70 31 0 67 176 0 22 143 2 39 105 0 18 109 103 0 0 1 13 0 181 40 131 69 2 0 74 23 12 0 3 53 0 31 15 3 33 99 2 0 21 65 0 5 92 0 341 260 6 4 54 79 2 0 8 51 0 88 38 0 49 8 2 55 97 14 2 73 19 3 174 6 0 33 8 33 14 80 72 1 433 58 6 17 75 1 5 0 0 0 116 14 9 32 6 2 687 8 0 7 9 11 40 12 58 131 12 14 50 11 21 45 4 12 3 0 79 18 1 29 3 1 1 26 22 0 48 29 7 16 4 30 119 402 5 1 52 113 1 12 12 26 3 0 362 114 46 4 89 143 6 160 20 8 128 1 7 1 0 19 6 0 0 2 21 9 0 239 303 5 27 11 34 40 0 0 400 114 5 9 3 2 26 26 0 213 8 185 0 202 71 0 91 236 1 21 30 31 9 40 97 5 42 21 0 3 22 52 2 89 145 0 0 0 3 0 13 8 10 51 98 20 1 37 4 0 3 4 0 15 2 8 32 53 0 10 0 SP230 Bacteria;Fusobacteria;Fusobacteriia;Fusobacteriales;Leptotrichiaceae;Leptotrichia;hongkongensis 1 15 20 1 0 14 111 0 7 17 0 541 0 0 72 3 2 82 12 3 2 10 7 174 8 3 34 0 60 125 0 0 4 9 24 1 22 4 0 75 13 6 0 4 20 0 63 26 117 2 37 13 24 8 0 1 4 28 4 20 0 6 1 9 0 0 11 0 0 0 56 23 1 17 30 0 4 0 0 7 0 0 0 7 0 0 1 12 0 14 2 7 15 10 0 0 44 3 2 4 6 4 7 0 4 1 0 2 0 6 235 7 7 15 5 2 9 5 0 0 221 0 4 5 1 2 17 5 5 43 0 4 0 64 10 1 0 10 1 0 39 4 319 29 66 3 2 1 0 0 3 0 5 8 0 0 4 0 1 0 1 1 0 0 0 5 0 0 8 0 464 3 0 15 16 2 2 0 0 22 0 1 0 0 8 0 2 0 4 1 35 0 7 2 0 3 0 4 1 2 1 0 3 0 0 1 2 3 5 825 2 0 0 0 0 3 1 5 10 0 13 1 15 10 15 2 0 27 104 28 22 0 0 1 0 0 3 1 2 10 0 2 4 6 22 0 0 3 0 2 1 0 0 2 0 4 0 1 2 2 6 4 2 6 26 3 1 35 386 15 166 0 0 768 325 0 7 1 66 2121 912 503 962 9 162 380 305 164 1316 734 480 1068 27 0 319 105 38 18 0 439 179 3546 21 91 3 126 539 1604 488 145 1279 409 433 5 79 94 0 400 540 1153 1 14 376 0 238 10 3 1 631 0 44 193 0 0 8 0 0 0 10 0 0 163 1 84 645 212 637 590 139 14 1 4 0 250 260 355 259 1127 323 0 0 275 0 86 51 1459 1742 24 4 0 7 1 157 16 0 1110 577 83 9 2 36 0 63 184 9 23 104 53 0 40 6 1108 0 1051 4 1 1 611 2 2 0 1027 428 395 94 573 0 37 3 1 236 286 59 787 1676 526 474 0 1715 44 260 768 528 643 1 92 224 0 37 0 0 11 55 37 14 92 157 0 0 4 92 130 14 35 108 164 5 0 1 11 28 526 493 0 4 6 1471 146 0 118 69 0 0 15 1021 306 1309 176 0 131 914 171 35 0 130 2954 45 61 1712 746 1162 297 223 429 18 28 1 33 1031 153 267 2683 557 54 14 0 260 120 0 127 45 245 0 31 39 0 503 58 722 2112 39 156 0 0 29 1 756 1977 67 553 0 158 3 4 151 984 142 3 1 610 0 0 0 3 5 0 0 1225 195 4 337 139 197 340 173 111 52 119 0 1847 339 543 365 1635 931 2027 0 346 0 124 327 238 0 189 113 114 5 46 0 150 186 0 331 1850 83 0 60 5 1 2 0 4 46 7 2368 17 41 4 434 8 254 0 122 19 72 304 226 144 0 5164 0 3 0 90 360 80 0 49 68 185 57 3 9 0 163 59 97 798 1219 334 31 897 593 1583 1 1 0 74 209 102 618 1977 135 227 470 578 557 235 107 10 2313 0 0 139 20 0 0 32 486 339 2 1 2051 340 436 372 284 7 394 535 340 0 82 139 232 1821 1899 0 1 2 9 8 0 52 545 3 1 4 58 3 176 185 22 0 0 17 89 361 271 141 13 0 23 586 309 273 2 33 3 2 0 1926 82 448 347 33 1521 0 375 306 106 439 140 162 0 12 235 0 253 47 903 230 299 1201 1227 71 26 122 15 52 843 486 711 25 1 93 169 46 101 75 1 46 96 0 101 45 68 257 28 38 2 475 224 141 97 176 0 0 1 133 283 162 0 213 171 1 7 159 630 189 48 1736 179 466 2 109 597 292 286 10 5 18 4678 1886 130 302 482 108 8 0 0 1 6 178 295 404 240 1 3185 0 4 7 5 2597 0 1 101 0 56 1 123 2196 32 113 35 444 18 1 22 551 33 369 586 344 3 15 1446 1293 16 23 5 21 105 1 3 6 0 114 9 67 1320 65 387 219 1119 316 306 151 263 6 11 936 379 1565 73 214 274 64 268 0 231 148 93 119 162 47 422 0 40 19 20 74 389 17 46 21 3 36 21 87 32 343 147 13 554 1387 3209 33 666 578 528 0 0 4 438 287 372 546 28 481 92 248 462 3617 1163 11 1252 242 112 1064 26 114 0 176 127 574 0 227 355 96 67 235 932 1 135 63 1223 1 1 4 33 847 1067 315 7 197 0 129 768 244 651 14 563 529 4 144 376 384 504 1528 423 0 304 234 0 1526 298 412 545 0 325 166 0 159 5 8 372 0 10 191 876 1061 480 81 284 20 516 140 1287 291 203 91 207 1927 6 950 0 406 1 19 269 757 251 12 2 17 51 13 16 88 0 578 0 2171 5 258 0 0 0 0 2 174 3 0 6 3 0 0 18 406 133 69 147 850 1284 2 11 87 70 0 161 108 61 10 70 0 163 17 241 105 192 72 4 0 103 351 67 173 34 1415 509 467 0 367 799 0 24 32 0 20 4 137 435 0 43 14 0 2 151 0 572 216 0 7 46 1416 49 0 0 0 0 0 39 0 531 248 13 0 153 87 163 201 63 15 0 25 46 210 0 45 66 0 24 433 0 0 0 6 19 3 0 0 1129 164 0 82 37 1 84 66 482 25 243 46 175 2 1042 285 3 158 58 1 5 938 1 0 388 932 0 46 8 1 0 1 15 3 0 596 3 0 112 14 0 29 23 0 29 1 19 467 26 8 35 26 9 5 15 3 20 0 0 83 651 12 299 50 37 24 15 5 0 3 1 0 1 12 14 172 6 341 370 32 55 34 333 32 190 221 1 11 140 4 282 317 1 153 37 51 394 48 105 90 4 20 14 1 2 173 130 1 0 537 223 0 291 1123 0 39 135 97 269 939 716 43 98 138 0 72 1008 34 7 264 170 624 3 1 0 370 66 0 0 32 1 0 37 54 152 79 51 349 2 0 4 7 158 0 189 151 9 48 1 0 74 240 20 5 187 438 0 0 0 0 28 52 26 1 124 4 0 15 196 503 6 423 622 0 60 44 0 58 535 98 4 44 0 0 0 6 0 110 82 78 15 88 154 16 2 950 25 0 143 62 0 48 0 546 49 735 26 14 0 0 9 4 144 2 182 0 21 112 418 4 249 1131 74 46 34 0 14 0 23 0 49 1073 15 0 113 1 1 173 23 6 776 5 1197 240 2 78 2217 113 6 0 0 15 553 58 94 238 164 418 110 250 0 56 151 342 1 12 339 290 0 1269 2966 38 96 6 511 275 3 27 13 14 3 39 10 0 2 6 0 10 0 2 9 1 245 34 12 743 14 0 351 174 5 76 147 3 0 4 7 0 0 337 10 1 1 20 21 112 132 0 239 129 2 439 169 0 0 8 121 5 337 167 0 110 38 0 547 0 7 37 10 237 96 370 0 2 10 1 632 82 0 478 213 175 0 105 87 0 0 97 12 233 54 0 24 343 460 0 12 1345 0 4 169 0 2 51 212 70 68 14 0 13 12 2 15 5 34 1 0 49 71 24 10 14 0 17 4 12 292 95 38 2 1326 795 0 866 1187 5 2 49 7 1 239 112 5 116 370 717 4 2 61 2 8 0 13 0 9 13 30 31 0 47 0 8 0 32 107 0 315 170 722 2107 0 0 28 0 0 1 67 0 0 362 8 73 89 175 406 80 571 0 23 169 1 1 100 0 446 542 130 22 585 814 0 234 1219 9 269 469 0 0 308 197 0 31 21 16 0 39 137 128 66 4 0 31 313 155 0 65 839 25 172 29 0 243 104 22 28 8 111 2 107 468 1 120 297 12 0 47 3 0 38 0 300 30 411 15 39 4 2 6 3 46 838 0 277 230 0 40 27 182 231 0 117 1 617 3533 16 1526 301 4 53 343 44 1068 1880 22 0 422 7 0 56 81 1 172 376 0 357 82 35 13 0 12 143 0 58 162 0 129 266 0 134 12 6 764 517 1006 3 4 0 0 57 153 0 124 178 88 18 398 0 166 225 3 0 569 207 1 642 277 123 0 5 85 558 238 3 85 66 4 17 10 41 59 421 41 0 0 8 0 1 61 29 1286 342 2 613 71 515 4 17 0 12 0 0 159 165 318 117 107 0 110 140 0 307 283 411 0 46 273 10 169 4 60 136 98 342 10 149 388 0 176 625 15 10 15 1 10 77 160 0 0 29 53 1 21 32 0 10 28 0 43 18 129 11 28 180 0 203 40 11 4 12 48 122 9 SP233 Bacteria;Proteobacteria;Betaproteobacteria;Neisseriales;Neisseriaceae;Neisseria;sp. HMT018 0 0 0 8 0 0 0 0 0 2 1 170 0 21 0 0 0 0 0 0 0 0 1 0 0 0 588 0 0 4 0 0 0 0 1 0 0 0 1 6 0 0 0 0 8 0 0 0 0 0 0 0 0 0 0 26 2 23 0 0 5 0 0 0 0 0 1 0 1 0 0 0 0 0 0 0 4 2 0 0 4 0 0 0 0 36 2 0 0 0 0 0 0 2 0 0 0 0 0 0 0 0 0 0 0 0 0 0 0 0 0 0 0 0 1 1 1 0 0 0 0 0 0 1 0 0 1 0 0 0 0 0 0 0 50 0 0 0 0 0 0 28 0 1 6 9 23 4 0 0 0 0 0 0 1 0 0 0 0 4 24 0 0 0 13 0 0 0 0 0 0 0 0 0 7 0 0 0 0 18 0 0 0 2 2 2 7 0 1 597 0 0 7 0 0 0 0 1 0 0 0 0 0 0 15 0 1 3 0 0 0 0 0 0 0 0 5 0 0 0 0 0 0 0 0 0 0 0 25 0 0 0 0 0 0 0 81 11 0 0 0 0 0 0 0 0 0 0 0 0 0 0 0 0 0 0 3 0 0 1 0 6 0 0 2 0 0 47 0 21 8 0 178 0 11 0 29 0 0 572 1 0 0 0 37 0 0 0 0 0 3 0 0 0 1 191 0 0 0 0 11 19 0 2 0 5 17 2 0 0 0 0 0 0 0 1 0 0 0 1 0 0 0 0 0 0 0 0 0 0 1 17 1 0 0 0 6 17 0 0 0 0 0 0 71 0 0 0 2 1 4 4 0 18 0 1240 0 1 92 0 1 39 0 3 34 131 176 0 0 0 40 2 113 0 0 0 0 0 0 0 0 0 75 18 0 0 0 0 0 18 0 0 0 0 10 0 0 0 4 50 0 38 0 0 0 0 0 12 359 1 50 16 0 0 0 0 13 0 20 0 3 0 0 0 0 0 0 0 0 0 3 2 0 0 0 3 0 0 0 1 12 0 0 0 0 0 0 0 22 1 0 6 19 0 0 0 0 15 0 0 0 0 0 26 0 19 0 4 101 0 308 0 1 0 11 0 0 0 0 41 364 0 1 17 0 0 181 143 379 0 0 3 0 1 0 0 0 0 0 9 120 292 0 1 18 0 1 15 0 0 0 0 0 0 2 0 0 0 0 479 0 7 0 39 0 0 0 7 6 3 0 84 660 299 29 0 0 187 79 0 0 5 0 0 87 1600 125 14 1 15 2 6 910 0 628 0 0 0 0 77 0 0 0 0 3 5 0 0 0 0 0 0 43 0 234 1 268 0 0 0 1 6 11 0 0 1 83 0 0 0 0 0 0 0 0 6 0 0 0 0 0 22 0 0 25 4 0 0 0 13 273 0 0 20 0 0 95 0 4 1376 0 0 0 2 0 1 25 0 0 20 0 0 0 0 0 1 0 0 0 0 1 9 0 0 0 0 0 0 0 0 4 0 0 52 150 0 22 6 1 0 3 0 0 1 0 1 0 0 0 5 0 0 1 0 0 8 4 1 0 0 0 99 1 0 0 0 0 0 8 1 0 0 0 0 0 0 0 0 0 0 0 826 14 2 0 0 0 0 0 4 1 0 0 2 0 0 21 0 0 0 1 54 55 302 0 1 42 18 6 10 11 0 0 4 29 0 0 0 0 18 0 0 38 0 516 0 24 0 0 28 34 0 0 0 1 0 88 167 0 69 1022 147 0 2 207 0 1 262 0 9 6 111 4 0 0 1 19 1 0 0 14 24 0 0 0 0 14 23 0 0 1 2 0 0 0 3 17 1 0 0 0 0 0 0 0 55 17 1 0 1 320 0 0 1 0 0 0 0 0 22 0 0 0 1 0 1 0 369 17 0 0 13 0 0 3 0 0 0 0 0 0 0 0 0 0 2 0 1 0 1 37 2 1 0 0 0 0 18 15 0 0 0 1 0 0 0 0 1 5 22 0 0 0 0 0 96 0 0 0 0 1 2 1 0 0 0 3 6 196 0 0 0 0 0 0 0 0 0 352 0 0 0 0 0 3 0 33 2 0 0 28 15 0 0 0 83 0 1 0 0 0 0 2 151 366 0 0 9 109 0 94 0 0 94 0 9 1 93 205 0 2 1 1 141 0 3 19 318 0 0 14 1 0 0 0 0 2 0 0 0 6 2 0 0 4 1 1 3 25 0 1 110 0 2 4 0 33 0 0 0 3 0 7 65 1 6 0 0 0 0 0 0 0 2 0 8 16 0 0 0 0 0 1 0 0 0 0 96 0 0 0 0 0 0 0 6 0 0 7 0 0 1 0 7 1 0 122 2 0 0 0 8 3 0 0 0 13 0 0 0 0 0 0 0 1 0 0 0 0 0 2 206 0 3 27 0 0 0 0 0 6 0 0 0 1 0 0 1 0 0 1 2 0 0 176 0 8 0 28 0 0 0 0 0 7 3 0 0 0 0 0 0 0 0 0 0 0 0 0 2 0 0 0 1 0 0 1 0 0 1 42 0 0 0 0 0 1 0 66 0 121 0 0 0 30 0 0 0 0 5 8 0 0 0 6 0 0 1 0 0 0 0 0 1 2 0 0 0 0 0 0 0 0 1 0 0 0 0 2 0 6 0 9 0 0 0 0 0 10 0 0 0 0 0 62 0 0 28 0 0 0 1 63 0 3 3 0 0 0 0 0 0 10 4 0 0 4 5 0 135 0 0 3 0 2 0 0 10 1 0 0 0 0 0 4 0 0 1 16 0 0 0 58 0 0 0 0 3 0 1 8 0 0 0 0 5 0 0 1 0 0 0 0 0 0 0 0 0 12 0 0 0 0 9 46 19 0 0 1 8 0 0 0 2 0 0 4 7 0 0 49 0 0 0 3 0 0 0 0 4 11 0 29 35 0 0 0 2 0 0 0 1 0 0 0 0 4 0 0 0 0 0 0 1 2 0 1 418 5 24 232 2 0 0 1 1 1 35 1 0 14 0 6 98 0 0 1 31 0 0 0 0 197 0 99 0 69 1 0 10 0 0 0 0 0 6 35 0 0 1 0 0 0 1 10 0 3 0 0 12 35 0 0 0 62 814 0 0 11 0 0 0 0 0 0 13 0 0 0 0 0 0 0 0 34 0 0 0 0 22 0 0 0 0 0 1 0 166 6 0 0 0 0 0 0 0 0 0 0 0 0 0 0 0 0 2 0 0 0 0 0 0 0 5 8 0 0 0 0 0 0 0 0 0 0 18 0 153 71 0 0 40 0 0 0 0 0 0 0 0 0 0 0 14 21 0 0 0 0 0 0 0 0 3 0 1 5 0 16 2 0 0 62 0 0 0 0 0 0 3 0 24 10 2 0 1 11 0 0 0 1 0 0 2 0 68 0 0 38 0 0 0 12 1 0 0 0 0 0 1 3 0 0 4 0 0 1 0 116 0 1 0 0 0 1 0 1 0 1 0 1 0 0 1 0 0 0 0 0 0 55 0 33 0 0 0 0 0 4 0 0 3 15 54 0 0 0 0 5 0 0 46 0 0 0 0 0 0 286 0 0 348 1 0 3 0 0 21 80 0 0 0 0 0 9 0 0 0 0 0 23 14 0 1 5 0 0 0 0 0 0 0 0 2 2 23 0 0 34 0 6 1 0 15 0 0 0 0 6 0 0 0 0 0 0 0 0 0 3 0 0 16 0 0 31 7 0 6 0 0 0 0 0 0 26 7 0 0 0 0 0 0 0 0 55 23 0 4 22 0 0 0 0 0 0 0 1 1 2 0 0 0 0 0 0 0 0 12 1 0 0 10 0 6 15 0 0 0 0 0 9 0 0 1 1 2 2 9 5 0 28 4 7 0 13 0 1 0 0 0 19 0 0 0 0 12 0 0 0 0 0 0 0 0 0 0 0 2 0 0 0 66 34 0 0 24 0 0 5 0 0 3 0 0 0 0 0 0 0 0 0 0 0 0 3 0 0 0 0 9 0 0 0 12 0 0 0 0 0 0 13 0 14 0 0 0 0 0 0 0 3 0 0 0 0 0 0 97 0 0 0 0 0 0 0 0 0 5 0 0 4 0 0 0 0 0 0 6 0 0 25 16 0 1 3 0 0 0 0 0 0 0 0 0 SP234 Bacteria;Firmicutes;Bacilli;Lactobacillales;Carnobacteriaceae;Granulicatella;adiacens 1855 8946 4638 4789 1001 1183 7494 3259 4616 2580 1526 1562 2474 8910 723 6805 3500 5914 4465 2830 1981 12392 5954 1715 3855 6741 10781 8519 2877 1816 5026 6219 2655 3631 5883 3414 5485 1587 4740 1931 1815 3013 3492 2966 5652 3093 1624 7461 1204 5508 1007 4043 7902 8557 4585 5846 3026 4339 2174 4297 5030 2416 4367 2564 6845 2882 4127 2144 7207 3469 1860 3951 11721 2870 8557 4414 3640 2600 1740 8576 3861 3143 6530 1951 3004 11439 7829 6758 5166 1297 900 4902 1626 2787 5293 4994 598 2960 5800 3698 7586 1799 8802 4408 522 3068 5410 703 3169 3853 3655 6439 1680 2649 1672 2007 3018 2302 1578 11130 5826 4135 3997 3606 4614 6149 4948 3952 2883 1856 4907 3700 6007 5810 4445 2571 4069 4539 7215 3589 2076 903 1375 5164 662 2544 3403 3101 3373 8690 2446 9485 6964 9528 3320 3322 1278 6055 3936 5742 4473 1630 5836 2998 5807 12291 4222 7254 4990 8999 8 5272 7402 10065 4710 4962 11171 9443 4923 5484 2695 9604 5602 4572 2227 7073 4133 2433 3679 3811 9467 2195 4123 3066 7069 2517 2230 1510 3064 4678 4376 3186 3965 1816 2730 310 978 1354 3767 12805 1479 5803 5175 3918 7178 2197 537 4847 1065 3327 797 6640 1308 4565 3733 1967 1755 2294 5051 1309 3249 6336 7684 4246 6106 3341 3472 3839 3827 4375 4150 1872 2057 6315 1551 6740 4635 2942 3513 5125 1919 1409 3558 1717 6839 7160 8295 14188 2625 6253 5050 4353 8480 3159 6521 9990 5242 8772 0 70 46 75 44 140 78 85 38 108 37 23 82 56 10 105 204 347 135 128 265 213 20 310 200 15 20 112 228 49 0 83 443 48 37 51 21 205 456 313 25 301 35 23 9 57 207 22 0 115 77 48 24 16 171 2 248 17 30 0 19 1 13 217 18 315 22 5 4 14 87 2 1 56 0 3 146 35 134 125 76 191 36 144 219 29 88 272 7 68 12 330 600 329 22 195 142 119 4 132 40 0 196 184 67 102 70 91 198 83 171 360 26 0 60 147 50 149 104 165 2 324 288 0 0 58 28 118 262 2 137 137 224 12 105 241 43 90 1 100 84 118 211 31 154 6 101 8 185 0 41 56 228 128 123 43 12 75 132 2 288 43 90 136 98 49 160 226 120 16 203 20 18 10 29 466 59 198 3 32 38 166 24 202 157 3 98 495 178 112 4 51 165 16 92 99 10 351 169 22 6 2 297 28 11 4 192 106 278 383 86 203 48 138 39 72 59 99 51 77 23 70 54 34 23 39 55 1 160 86 53 138 127 0 87 52 9 3 20 245 27 22 58 123 5 13 8 15 46 102 44 1 75 278 61 339 79 52 13 200 57 245 2 11 25 28 220 0 72 288 164 119 65 21 50 127 51 411 14 261 5 78 66 123 249 218 38 51 14 461 641 93 431 68 11 33 44 28 4 319 9 167 189 3 119 161 92 57 34 25 4 2 194 186 133 0 164 40 224 27 207 1 66 3 155 163 3 107 93 328 0 0 0 41 51 42 52 175 1 470 355 171 11 129 26 25 177 60 148 119 133 12 45 276 521 17 43 61 35 84 302 126 42 12 235 12 121 89 64 25 11 29 95 173 167 35 62 43 1 61 7 21 146 147 89 23 26 86 105 439 9 74 43 304 21 76 106 22 203 337 88 128 2 31 1125 24 30 31 79 124 73 11 47 57 99 72 22 62 31 53 22 44 102 120 578 43 165 23 3 59 10 698 19 53 178 458 158 156 260 188 119 233 68 115 129 35 13 250 15 40 32 44 98 177 105 7 25 121 139 76 102 221 110 208 83 23 85 22 47 45 146 174 3 20 133 140 91 1 12 142 54 265 20 97 24 1 166 13 12 57 3 109 37 56 2 67 515 33 145 225 68 123 156 14 58 31 9 168 66 1 35 40 236 252 1 70 26 50 201 6 100 428 15 11 585 146 104 57 118 0 53 36 35 64 209 15 14 41 68 1 364 18 156 105 6 53 111 92 19 1 11 331 230 342 312 40 26 0 11 380 567 200 48 12 179 3 46 160 8 138 67 623 23 95 109 457 386 90 8 144 219 9 786 384 137 8 41 355 116 144 544 7 303 26 72 130 33 22 34 86 100 27 177 81 10 112 63 74 12 161 98 110 155 62 59 192 68 21 397 162 345 68 203 268 150 145 416 64 84 14 112 136 135 165 21 11 110 17 330 112 66 49 28 156 0 33 25 74 0 170 83 22 103 0 123 34 127 170 12 154 18 0 32 7 24 41 123 81 285 148 43 246 101 99 195 198 7 57 152 2 44 35 257 41 82 78 88 65 79 116 49 8 312 61 8 56 108 2 168 55 14 25 56 70 52 450 71 323 51 183 56 64 33 96 231 91 108 75 0 62 19 62 45 21 104 29 243 79 45 34 118 213 38 17 12 19 212 111 0 39 40 0 1 28 0 31 31 60 31 0 1145 385 115 31 11 226 142 8 78 45 46 36 63 102 26 48 131 140 34 59 72 41 40 10 108 126 105 42 145 292 9 51 268 13 179 44 58 36 170 46 1 13 11 26 60 19 48 98 23 48 2 19 37 85 103 119 35 41 16 152 68 0 52 15 153 224 34 44 29 31 10 24 23 20 58 289 227 120 19 8 124 364 52 65 6 38 92 13 96 11 281 19 43 14 25 44 39 74 277 140 191 138 11 95 128 19 17 342 8 52 12 128 283 1 303 89 25 64 395 49 429 81 355 41 3 90 88 258 44 35 11 14 46 33 107 130 44 70 62 57 102 113 132 74 78 325 185 11 42 65 21 12 51 174 30 90 51 27 82 36 30 240 134 124 22 26 41 40 65 48 22 46 294 26 39 10 69 27 62 88 162 75 47 24 36 288 22 75 51 48 90 21 67 98 3 379 70 9 16 144 59 49 87 68 41 140 101 26 15 222 51 21 27 64 25 24 220 71 58 38 22 44 1 53 18 34 31 16 85 13 25 106 11 167 76 83 108 31 68 74 24 84 24 59 159 12 49 18 117 67 69 160 17 52 24 23 35 1 131 12 50 102 89 87 6 16 22 32 85 30 142 4 84 89 31 111 27 44 16 51 78 66 30 40 70 23 33 69 35 37 89 109 59 19 21 49 87 201 14 34 1 619 365 175 218 52 393 89 78 107 20 174 176 18 35 115 27 73 49 53 8 10 65 364 46 133 209 176 222 68 43 65 129 178 96 65 165 171 261 86 39 61 31 325 68 1363 92 83 435 78 152 126 19 38 139 68 219 40 253 67 103 267 14 210 87 90 3 53 45 52 5 28 1627 117 47 100 21 37 103 107 43 167 231 91 65 33 146 25 541 275 154 19 106 63 33 95 24 32 489 43 5 66 31 185 112 48 74 249 201 171 52 221 1 13 82 166 410 51 87 60 18 316 95 325 75 222 314 745 288 606 162 37 29 90 235 158 104 330 30 49 31 4 65 110 15 22 150 18 45 194 760 204 25 12 45 22 71 69 35 64 17 42 110 20 8 53 25 89 4 95 406 156 87 153 325 52 156 35 62 251 168 14 122 605 40 24 69 161 29 284 11 50 60 523 914 519 86 167 153 77 279 150 278 242 177 174 103 133 76 534 132 127 37 133 292 239 72 154 43 53 149 259 73 14 87 228 24 11 83 123 112 6 258 58 52 21 91 81 33 37 72 275 91 89 153 15 62 15 353 34 7 126 201 86 85 87 32 54 33 24 79 103 34 110 31 16 25 49 211 128 16 90 79 58 15 37 56 52 127 99 41 132 134 76 34 36 57 51 109 80 54 47 135 29 42 50 11 21 27 22 44 42 64 74 66 96 67 50 50 18 21 31 8 48 28 58 172 278 96 69 24 29 26 102 69 45 125 91 134 147 96 178 145 31 83 78 22 33 22 102 147 158 50 82 9 77 133 40 13 52 280 176 169 76 294 46 0 95 268 42 51 272 158 35 59 22 44 22 193 63 122 68 147 131 15 132 393 678 376 466 8 65 30 2 143 41 134 21 176 28 301 196 192 55 87 72 244 109 30 20 19 14 59 42 1 28 14 190 37 28 413 114 110 123 143 31 194 32 109 174 264 343 644 71 69 130 159 292 233 200 593 366 174 123 37 429 226 188 92 86 72 27 9 81 28 24 89 62 16 14 35 38 17 102 157 22 4 26 48 30 11 79 23 77 41 36 57 63 50 23 80 105 44 48 55 241 32 9 44 47 2 0 98 118 246 31 73 84 39 13 494 29 63 15 25 89 259 6 24 46 120 37 129 30 6 68 SP235 Bacteria;Firmicutes;Bacilli;Lactobacillales;Streptococcaceae;Streptococcus;sp. HMT061 2610 230 404 148 114 4 1 199 57 165 50 19 140 74 7 2135 1773 129 435 500 54 479 521 35 380 97 97 251 25 41 1209 356 105 16 248 1087 43 373 264 31 3 28 71 3183 490 801 889 223 2 64 153 1669 205 102 3937 175 1018 1508 14 493 137 82 1304 0 38 49 18 27 1792 138 392 28 100 13 61 28 77 142 114 1258 21 120 735 99 160 49 965 2192 853 247 19 805 25 2920 189 21 72 271 93 563 231 190 135 222 4 88 1504 64 13 2034 33 203 1273 7 50 13745 11 16 104 578 6460 29 1240 490 35 152 1008 2466 928 498 1138 1 1048 1953 525 120 8 146 198 175 25 19 109 133 12 638 3681 466 4371 872 48 300 81 740 120 692 118 1417 6 71 205 19 5 61 686 375 33 1022 17 1707 14 592 38 66 324 182 1501 1496 67 51 65 154 5850 268 357 2862 634 1191 88 36 381 180 86 1909 7834 292 62 64 55 743 52 337 17 58 13 7 90 1367 1019 58 23 78 150 863 177 19 1 342 504 1634 9 472 180 1935 294 69 199 32 35 5 372 30 520 24 57 29 1858 88 17 181 3582 650 133 319 6 316 1165 621 12 363 32 254 371 1287 94 108 1023 251 223 277 325 910 2015 1019 1178 2050 982 596 0 0 0 0 0 0 0 0 0 0 0 0 0 0 0 0 0 0 0 0 0 0 0 0 0 0 0 0 0 0 0 0 0 0 0 0 0 0 0 0 0 0 0 0 0 0 0 0 0 0 0 0 0 0 0 0 0 0 0 0 0 0 0 0 0 0 0 0 0 0 0 0 0 0 0 0 0 0 0 0 0 0 0 0 0 0 0 0 0 0 0 0 0 0 0 0 0 0 0 0 0 0 0 0 0 0 0 0 0 0 0 0 0 0 0 0 0 0 0 0 0 0 0 0 0 0 0 0 0 0 0 0 0 0 0 0 0 0 0 0 0 0 0 0 0 0 0 0 0 0 0 0 0 0 0 0 0 0 0 0 0 0 0 0 0 0 0 0 0 0 0 0 0 0 0 0 0 0 0 0 0 0 0 0 0 0 0 0 0 0 0 0 0 0 0 0 0 0 0 0 0 0 0 0 0 0 0 0 0 0 0 0 0 0 0 0 0 0 0 0 0 0 0 0 0 0 0 0 0 0 0 0 0 0 0 0 0 0 0 0 0 0 0 0 0 0 0 0 0 0 0 0 0 0 0 0 0 0 0 0 0 0 0 0 0 0 0 0 0 0 0 0 0 0 0 0 0 0 0 0 0 0 0 0 0 0 0 0 0 0 0 0 0 0 0 0 0 0 0 0 0 0 0 0 0 0 0 0 0 0 0 0 0 0 0 0 0 0 0 0 0 0 0 0 0 0 0 0 0 0 0 0 0 0 0 0 0 0 0 0 0 0 0 0 0 0 0 0 0 0 0 0 0 0 0 0 0 0 0 0 0 0 0 0 0 0 0 0 0 0 0 0 0 0 0 0 0 0 0 0 0 0 0 0 0 0 0 0 0 0 0 0 0 0 0 0 0 0 0 0 0 0 0 0 0 0 0 0 0 0 0 0 0 0 0 0 0 0 0 0 0 0 0 0 0 0 0 0 0 0 0 0 0 0 0 0 0 0 0 0 0 0 0 0 0 0 0 0 0 0 0 0 0 0 0 0 0 0 0 0 0 0 0 0 0 0 0 0 0 0 0 0 0 0 0 0 0 0 0 0 0 0 0 0 0 0 0 0 0 0 0 0 0 0 0 0 0 0 0 0 0 0 0 0 0 0 0 0 0 0 0 0 0 0 0 0 0 0 0 0 0 0 0 0 0 0 0 0 0 0 0 0 0 0 0 0 0 0 0 0 0 0 0 0 0 0 0 0 0 0 0 0 0 0 0 0 0 0 0 0 0 0 0 0 0 0 0 0 0 0 0 0 0 0 0 0 0 0 0 0 0 0 0 0 0 0 0 0 0 0 0 0 0 0 0 0 0 0 0 0 0 0 0 0 0 0 0 0 0 0 0 0 0 0 0 0 0 0 0 0 0 0 0 0 0 0 0 0 0 0 0 0 0 0 0 0 0 0 0 0 0 0 0 0 0 0 0 0 0 0 0 0 0 0 0 0 0 0 0 0 0 0 0 0 0 0 0 0 0 0 0 0 0 0 0 0 0 0 0 0 0 0 0 0 0 0 0 0 0 0 0 0 0 0 0 0 0 0 0 0 0 0 0 0 0 0 0 0 0 0 0 0 0 0 0 0 0 0 0 0 0 0 0 0 0 0 0 0 0 0 0 0 0 0 0 0 0 0 0 0 0 0 0 0 0 0 0 0 0 0 0 0 0 0 0 0 0 0 0 0 0 0 0 0 0 0 0 0 0 0 0 0 0 0 0 0 0 0 0 0 0 0 0 0 0 0 0 0 0 0 0 0 0 0 0 0 0 0 0 0 0 0 0 0 0 0 0 0 0 0 0 0 0 0 0 0 0 0 0 0 0 0 0 0 0 0 0 0 0 0 0 0 0 0 0 0 0 0 0 0 0 0 0 0 0 0 0 0 0 0 0 0 0 0 0 0 0 0 0 0 0 0 0 0 0 0 0 0 0 0 0 0 0 0 0 0 0 0 0 0 0 0 0 0 0 0 0 0 0 0 0 0 0 0 0 0 0 0 0 0 0 0 0 0 0 0 0 0 0 0 0 0 0 0 0 0 0 0 0 0 0 0 0 0 0 0 0 0 0 0 0 0 0 0 0 0 0 0 0 0 0 0 0 0 0 0 0 0 0 0 0 0 0 0 0 0 0 0 0 0 0 0 0 0 0 0 0 0 0 0 0 0 0 0 0 0 0 0 0 0 0 0 0 0 0 0 0 0 0 0 0 0 0 0 0 0 0 0 0 0 0 0 0 0 0 0 0 0 0 0 0 0 0 0 0 0 0 0 0 0 0 0 0 0 0 0 0 0 0 0 0 0 0 0 0 0 0 0 0 0 0 0 0 0 0 0 0 0 0 0 0 0 0 0 0 0 0 0 0 0 0 0 0 0 0 0 0 0 0 0 0 0 0 0 0 0 0 0 0 0 0 0 0 0 0 0 0 0 0 0 0 0 0 0 0 0 0 0 0 0 0 0 0 0 0 0 0 0 0 0 0 0 0 0 0 0 0 0 0 0 0 0 0 0 0 0 0 0 0 0 0 0 0 0 0 0 0 0 0 0 0 0 0 0 0 0 0 0 0 0 0 0 0 0 0 0 0 0 0 0 0 0 0 0 0 0 0 0 0 0 0 0 0 0 0 0 0 0 0 0 0 0 0 0 0 0 0 0 0 0 0 0 0 0 0 0 0 0 0 0 0 0 0 0 0 0 0 0 0 0 0 0 0 0 0 0 0 0 0 0 0 0 0 0 0 0 0 0 0 0 0 0 0 0 0 0 0 0 0 0 0 0 0 0 0 0 0 0 0 0 0 0 0 0 0 0 0 0 0 0 0 0 0 0 0 0 0 0 0 0 0 0 0 0 0 0 0 0 0 0 0 0 0 0 0 0 0 0 0 0 0 0 0 0 0 0 0 0 0 0 0 0 0 0 0 0 0 0 0 0 0 0 0 0 0 0 0 0 0 0 0 0 0 0 0 0 0 0 0 0 0 0 0 0 0 0 0 0 0 0 0 0 0 0 0 0 0 0 0 0 0 0 0 0 0 0 0 0 0 0 0 0 0 0 0 0 0 0 0 0 0 0 0 0 0 0 0 0 0 0 0 0 0 0 0 0 0 0 0 0 0 0 0 0 0 0 0 0 0 0 0 0 0 0 0 0 0 0 0 0 0 0 0 0 0 0 0 0 0 0 0 0 0 0 0 0 0 0 0 0 0 0 0 0 0 0 0 0 0 0 0 0 0 0 0 0 0 0 0 0 0 0 0 0 0 0 0 0 0 0 0 0 0 0 0 0 0 0 0 0 0 0 0 0 0 0 0 0 0 0 0 0 0 0 0 0 0 0 0 0 0 0 0 0 0 0 0 0 0 0 0 0 0 0 0 0 0 0 0 0 0 0 0 0 0 0 0 0 0 0 0 0 0 0 0 0 0 0 0 0 0 0 0 0 0 0 0 0 0 0 0 0 0 0 0 0 0 0 0 0 0 0 0 0 0 0 SP237 Bacteria;Proteobacteria;Betaproteobacteria;Burkholderiales;Burkholderiaceae;Lautropia;mirabilis 2 245 129 23 60 952 501 38 544 300 12 850 1693 56 762 20 87 357 37 127 12 6 20 83 89 59 244 31 1683 643 9 298 835 41 78 24 67 91 78 56 142 306 32 15 87 40 172 208 36 59 51 10 8 99 103 65 74 189 66 196 58 75 29 2122 29 173 58 29 403 51 243 258 22 38 36 25 16 17 19 23 115 12 97 33 7 63 79 133 26 108 56 10 75 104 41 168 841 222 8 21 65 1203 78 1684 82 509 20 42 47 372 98 414 81 70 40 26 49 87 220 52 183 64 54 110 30 35 30 39 47 1847 274 29 7 751 88 146 45 53 80 11 76 1578 566 394 571 78 40 146 79 127 71 29 58 33 5 31 177 204 55 331 736 257 11 66 61 50 18 107 93 29 10688 52 24 55 58 38 30 26 364 364 42 63 101 222 134 244 46 189 123 69 69 47 55 37 20 26 11 46 20 139 47 36 99 70 156 37 203 47 115 6777 43 107 52 88 24 28 52 2 199 50 884 14 23 191 77 68 60 186 1529 48 134 19 66 31 53 63 161 39 32 283 25 5 72 147 9 186 24 33 43 14 6 48 58 2 1 17 83 0 0 8 24 3 2 25 25 46 41 196 854 622 195 2 611 6 227 0 41 100 33 131 212 352 8 62 912 339 80 402 353 581 218 364 43 8307 1180 938 1278 183 0 218 236 28 70 159 390 669 293 1186 914 44 71 140 7 27 111 171 195 682 729 1 656 255 151 1 459 2 5 1 25 60 238 132 111 90 90 6 1148 60 265 327 1871 288 0 611 124 442 998 88 27 107 4128 1060 3577 296 144 669 116 80 350 2 401 207 110 172 725 242 3 365 435 0 124 212 55 157 230 67 7 318 213 41 43 0 224 745 164 397 257 1091 3 2121 1567 431 0 316 809 169 174 21 640 328 3034 271 0 185 71 13 0 231 336 84 548 179 0 72 65 107 1196 0 182 0 53 130 90 25 0 13 114 0 381 668 434 256 332 86 150 28 104 0 73 57 20 105 1294 5 282 260 35 1191 91 165 12 96 59 213 3 184 643 552 5 265 250 914 498 513 129 170 2 83 155 427 1226 1050 1984 1353 1583 351 201 73 293 469 443 39 27 40 73 413 207 267 659 209 385 1 15 252 412 0 1978 2923 1 417 81 0 5530 557 163 1651 219 1598 48 6 123 2 0 515 55 25 16 57 1711 364 31 207 67 205 39 47 397 115 429 85 887 201 212 82 294 1 369 138 147 410 2085 625 59 0 98 256 153 51 1 80 65 158 912 178 337 85 32 169 628 60 3712 66 107 47 47 23 22 123 0 307 281 0 582 132 282 552 159 183 106 1 881 1352 749 6 4 633 759 34 181 31 18 1 45 325 0 32 13 243 0 209 1 161 80 16 103 267 53 62 298 561 732 169 672 1643 256 1059 166 452 170 1082 546 331 222 76 315 332 1334 206 631 129 106 1273 950 109 259 201 136 0 187 535 177 678 453 150 257 967 0 24 1115 4 11 252 420 363 96 8 52 1043 11 14 25 2 50 149 9 30 38 751 224 980 177 194 0 111 389 452 663 2019 417 14 213 196 172 173 0 1254 172 500 234 26 1493 1 103 320 372 159 13 501 0 252 336 611 175 61 318 321 119 328 8 115 77 1288 18 63 5 913 1339 696 2832 84 681 843 321 87 38 59 423 661 610 970 59 36 35 922 96 173 125 335 209 457 1205 48 157 1607 380 323 96 599 58 181 120 1728 1031 163 659 258 1862 786 0 295 133 1008 0 302 704 888 563 1172 88 80 567 317 82 139 114 209 577 4434 463 358 0 305 0 210 13 104 45 40 1496 734 584 1424 64 34 280 401 167 0 0 1469 1616 2745 526 126 0 1154 405 130 47 19 235 1 2409 833 187 845 657 61 91 405 10 1 806 227 1385 6768 0 163 269 2534 14 163 1119 2 160 648 35 280 246 471 207 93 154 110 23 24 1 522 471 196 1148 198 310 31 196 150 40 333 94 844 131 577 464 32 103 326 49 614 117 223 408 115 479 150 30 1024 108 74 154 0 310 14 54 61 50 0 5 1500 195 196 386 4064 0 1660 3016 335 359 0 225 1604 61 6 7 5 148 2847 416 365 193 237 705 870 1 39 98 557 0 12 79 108 46 754 1107 534 2169 0 1 110 535 251 206 94 51 10 2 478 499 821 95 243 450 470 387 463 42 99 84 78 249 756 571 1138 26 135 0 409 205 305 43 60 75 325 40 252 79 41 564 353 400 0 25 147 0 204 766 782 58 155 213 123 367 462 366 347 31 67 0 38 8 159 100 40 41 99 780 56 433 76 51 63 51 71 802 209 245 6 1 512 32 1 5 331 67 3494 147 657 123 0 20 7 26 8 771 215 176 3 511 44 200 0 41 42 6 67 23 0 105 35 36 6 40 62 3 970 762 11 16 24 5 99 144 57 0 32 101 0 60 80 0 0 80 51 55 0 9 0 0 21 4 2 131 189 1 37 2 29 47 12 43 0 7 99 251 116 11 102 45 0 29 31 50 6 115 11 0 7 219 131 0 64 20 0 29 100 0 1 29 6 0 17 49 22 280 73 1 61 64 0 8 84 30 9 27 19 153 0 252 278 0 32 12 0 148 107 90 0 10 220 0 23 350 0 1 309 116 0 0 68 29 0 10 2 16 9 16 0 2 25 7 486 11 53 70 1 192 33 6 22 28 18 0 34 19 17 1 85 152 80 2 0 0 22 237 14 31 75 6 41 4 86 22 1 80 6 109 23 42 285 22 598 45 3 63 30 52 17 0 94 135 31 23 136 0 17 196 69 2 60 165 0 0 26 187 0 7 11 1 67 0 11 4 21 126 1 12 223 0 14 80 15 8 12 18 70 15 1859 0 367 564 7 2 279 0 43 124 37 145 91 0 46 28 0 506 27 299 0 64 31 0 35 9 0 122 16 17 1 153 147 0 251 75 0 87 71 0 0 36 80 1 2 72 52 0 31 26 0 44 305 0 10 98 28 25 194 35 4 147 130 2 58 163 12 0 8 16 4 72 82 16 11 116 30 503 59 0 50 1033 387 2 156 5 0 186 171 94 98 88 0 16 28 45 45 55 28 0 22 32 0 1 72 6 7 63 39 43 2 100 37 0 249 198 10 129 2 28 322 73 310 76 67 494 159 3 30 45 115 10 38 414 51 10 48 0 123 13 167 1 7 19 192 7 437 96 10 3 180 45 814 19 8 2 9 1 8 119 0 6 1 1 7 7 21 6 0 5 73 6 47 38 1 9 42 28 20 123 2 0 100 248 73 13 388 0 71 25 17 3 182 55 0 14 1790 1 15 40 0 0 8 63 0 83 27 128 34 181 0 17 39 66 294 5 7 1 24 4 18 70 6 110 14 0 90 346 29 0 93 105 3 16 146 0 76 8 14 7 52 536 4 16 17 2 3 59 234 0 60 78 18 53 55 2 96 54 195 12 3 65 22 67 116 215 44 23 31 0 41 176 15 92 18 31 2 50 61 4 97 151 7 0 51 382 68 473 280 8 18 19 19 13 4 71 18 128 3 43 11 2 4 649 29 0 0 33 71 0 45 198 0 41 15 43 46 0 0 8 15 3 48 43 0 649 107 17 418 78 10 16 6 14 0 64 62 1 155 32 0 184 68 142 4 72 47 1 37 34 0 106 167 5 0 18 34 0 5 16 83 2 69 196 5 29 31 0 65 10 21 1 381 129 358 7 54 1 19 113 133 3 115 141 0 1 16 0 28 119 276 1 29 156 0 0 3 26 5 89 4 9 62 165 2 75 9 64 0 311 120 7 58 10 0 85 12 7 2 120 368 14 192 93 10 0 15 3 75 543 0 0 6 48 15 42 27 4 120 93 0 17 13 13 47 10 118 202 18 13 181 5 46 23 0 77 11 11 31 454 14 10 27 11 0 108 17 1 29 65 15 17 169 5 10 65 22 0 58 59 7 28 7 48 0 0 100 30 91 8 27 15 0 39 6 3 102 173 37 256 1 0 0 56 950 22 92 25 0 896 41 80 73 2 404 18 0 0 10 47 158 65 50 10 13 524 0 28 19 17 7 11 17 0 9 26 0 5 1 107 0 14 179 3 19 76 2 3 123 69 3 36 39 1 1 362 87 460 39 5 11 185 149 1 4 9 22 2 47 22 0 53 434 3 121 62 20 123 0 SP24 Bacteria;Firmicutes;Bacilli;Lactobacillales;Carnobacteriaceae;Granulicatella;elegans 20 1178 40 391 25 486 3238 29 121 1665 98 4021 156 414 897 134 502 863 0 14 58 1 747 75 172 56 280 89 76 550 823 199 377 188 298 209 376 1366 55 5067 1038 849 151 751 1227 11 1881 168 4301 275 198 48 85 187 385 497 48 884 340 583 1280 7955 25 47 229 1038 2299 119 3402 415 741 2430 735 231 38 305 927 50 1045 98 143 1149 500 2648 61 773 206 363 381 65 4986 47 5796 2796 304 394 10184 585 2133 770 665 673 1072 80 571 3072 1036 4727 660 22 7 937 311 877 1802 1386 648 32 1040 1468 39 188 98 377 200 300 92 139 234 3541 146 402 171 322 1228 9075 185 106 159 15 3878 1128 945 972 1017 428 761 1860 12 272 21 42 118 54 204 41 61 1060 161 970 2946 1107 94 2083 308 386 579 82 632 429 5 120 1414 704 7 152 445 382 651 2422 45 598 2889 270 797 475 1239 98 225 131 316 376 2339 134 532 263 24 333 1195 183 4916 1229 524 262 294 43 4836 55 4072 63 145 446 42 58 85 1873 10603 502 3321 66 8879 403 717 481 32 87 865 1457 195 1 77 1336 124 2064 25 4 219 300 2057 2136 420 69 22 129 1142 2 70 22 325 23 15 300 3 22 0 36 126 0 34 28 28 2 50 58 1008 1 51 43 2 17 28 321 95 0 22 55 24 3 33 66 15 6 7 11 14 15 53 97 12 85 46 14 81 23 10 56 7 6 0 96 84 44 43 85 48 41 38 25 8 9 10 33 10 19 76 10 15 50 24 5 11 0 12 0 12 0 22 0 26 0 7 5 50 29 9 20 0 8 1 4 11 54 0 3 0 25 70 9 23 6 13 2 13 11 44 43 22 7 12 0 0 5 47 6 3 16 3 4 13 0 132 110 11 146 76 28 26 46 26 52 5 0 28 3 6 18 44 13 1 8 142 8 0 0 25 5 1 5 9 35 13 22 3 45 1 4 2 15 76 4 20 16 30 0 28 189 49 0 11 3 2 7 10 0 240 27 24 18 55 6 362 24 16 99 6 6 4 39 13 47 3 1 16 3 28 11 14 2 16 256 6 4 96 140 1 194 0 131 35 9 13 9 174 63 22 28 0 0 44 7 6 52 42 0 5 25 376 27 20 3 66 5 34 11 76 43 91 48 60 55 4 37 10 29 85 36 3 24 331 31 24 30 0 7 3 29 4 63 28 0 2 3 20 2 262 5 2 36 24 1 474 91 30 71 26 1 0 35 12 4 7 11 31 11 6 0 62 2 35 94 10 3 18 10 7 26 115 45 0 13 48 7 14 7 41 3 31 42 3 7 87 15 4 1 0 145 1 9 3 3 5 6 8 12 16 0 89 178 24 3 108 5 10 123 8 10 14 302 26 0 0 11 0 156 37 16 149 18 0 0 1 0 80 2 21 42 12 8 59 33 30 46 7 11 45 18 0 1 2 17 7 0 18 2 97 29 3 15 5 8 11 3 76 40 16 46 3 73 47 39 121 63 41 14 9 9 0 1 12 35 12 75 18 28 103 6 24 52 25 0 2 0 17 30 123 5 10 0 3 4 5 0 14 2 29 2 7 11 12 33 37 16 46 11 418 1 1 107 17 18 2 719 23 7 42 0 25 36 9 165 475 11 19 19 114 40 4 25 9 22 204 6 26 3 21 0 13 7 0 11 2 0 10 4 1 191 73 63 5 26 0 0 5 19 6 25 44 4 15 36 49 6 231 9 7 26 26 3 5 4 107 15 42 24 11 10 8 108 60 17 55 37 58 9 10 2 40 39 37 66 38 22 19 39 31 0 66 4 46 126 14 10 5 21 4 3 10 7 0 79 146 27 7 14 31 3 13 1 9 6 0 12 21 4 150 56 44 31 23 53 168 5 13 25 22 45 2 3 7 89 69 8 15 6 2 15 16 3 65 13 39 18 12 2 21 6 17 22 3 2 14 15 31 18 0 1 61 15 200 24 11 54 47 25 24 3 111 49 16 8 2 8 4 4 110 51 20 59 67 42 4 15 92 9 25 6 20 26 17 155 7 20 24 2 11 12 14 21 23 3 47 5 445 0 4 70 4 22 9 20 7 58 11 20 6 0 44 26 79 38 2 21 1 51 1 21 0 3 91 26 5 1 33 59 17 0 20 16 61 6 41 42 12 12 10 23 129 15 23 3 39 5 133 24 55 25 24 81 0 36 7 30 8 206 68 33 5 69 65 70 66 27 34 38 5 4 35 2 43 143 5 39 7 9 71 45 15 68 1 79 17 7 5 3 12 3 1 4 7 3 106 34 26 20 4 1 20 1443 3 4 9 1 24 17 1 1 0 0 61 0 1 6 0 8 67 182 59 0 31 6 0 68 19 20 25 7 48 308 297 333 1602 722 972 371 700 440 556 68 625 568 183 647 165 6 38 203 596 146 211 184 253 338 508 42 242 551 638 305 471 327 162 126 111 387 85 82 580 562 186 625 570 310 516 865 92 131 195 486 14 0 462 132 125 0 432 70 175 563 477 161 37 171 188 122 29 139 148 685 199 5 234 59 592 1080 238 99 352 242 89 278 205 275 10 4 458 198 33 230 63 150 40 331 74 186 168 320 56 92 531 908 129 78 30 96 127 315 63 114 370 396 2 881 4 235 325 59 1030 193 516 545 112 1452 726 38 140 158 892 195 293 802 596 433 650 611 136 1344 920 101 401 85 144 189 339 70 50 17 136 289 18 150 236 26 6 176 434 299 200 1055 307 944 73 265 17 53 142 485 1009 434 381 42 329 362 755 66 419 51 373 12 194 586 165 97 194 155 520 663 339 442 446 399 688 376 105 153 637 192 494 92 1049 510 328 255 81 639 87 254 785 923 376 181 510 790 72 278 827 739 470 698 270 486 1314 13 71 932 631 1189 751 352 1035 160 296 286 3 505 135 155 204 68 1044 267 280 180 187 254 555 560 60 19 196 192 678 129 720 607 191 312 25 296 172 857 98 334 228 62 896 318 335 623 378 240 221 283 150 543 477 515 299 255 407 93 248 152 919 589 166 126 373 318 874 523 177 131 285 1264 501 1477 136 196 266 4 2353 567 79 153 341 174 795 1377 424 433 470 45 85 573 260 269 154 927 130 0 29 54 1616 673 107 424 245 1258 765 541 147 565 6 158 58 162 71 5 209 496 160 377 789 99 252 1555 386 944 66 60 4519 302 505 654 16 662 401 418 909 428 39 58 571 589 185 635 92 125 86 203 260 189 138 30 3 205 14 862 529 664 50 147 101 115 6 55 137 1424 66 111 985 144 449 718 158 184 257 19 28 177 0 10 688 33 397 198 1131 186 346 96 97 69 1049 11 67 0 424 25 208 472 435 253 0 164 722 448 761 175 600 111 465 579 20 85 98 742 242 143 49 600 832 5 96 45 275 299 524 292 981 310 412 159 135 464 2 306 342 437 11 10 178 206 110 643 174 2112 1467 356 669 704 602 18 32 32 231 46 101 41 825 54 429 209 6 106 693 836 470 630 65 259 463 589 7 475 618 506 381 86 126 800 4042 202 0 155 536 55 21 153 71 425 18 111 43 361 432 253 144 225 237 191 126 127 134 592 600 31 63 661 192 108 1 93 372 756 209 356 490 164 122 441 8 94 340 125 584 253 274 152 336 492 97 297 474 319 179 338 49 184 211 514 470 199 539 549 464 788 24 223 1045 388 104 673 408 600 50 268 1042 222 151 277 621 756 742 230 128 332 171 15 99 13 291 223 646 463 345 149 1174 419 371 356 760 104 151 40 32 98 646 1232 267 1124 123 579 127 316 26 162 26 105 157 265 230 793 295 151 76 97 342 313 236 162 72 308 122 334 20 54 516 95 146 419 492 151 49 2 76 188 45 219 383 379 199 817 285 53 223 281 22 122 697 796 736 100 193 238 30 50 48 268 69 798 686 1717 927 405 301 412 127 194 182 275 54 154 200 20 41 289 662 251 194 289 111 43 473 33 159 147 17 1 27 62 299 6 152 13 4 338 96 88 3 19 435 1584 178 1318 228 190 123 168 1 17 743 6 793 314 68 114 453 1028 277 470 300 111 270 85 267 585 356 139 533 51 138 214 144 214 69 346 18 286 707 303 293 421 234 232 53 287 541 134 627 274 124 613 61 41 378 406 198 152 1 0 0 92 0 232 112 350 60 38 51 682 19 399 183 95 388 505 484 205 164 543 159 323 699 174 SP25 Bacteria;Actinobacteria;Actinomycetia;Micrococcales;Micrococcaceae;Rothia;aeria 48 282 112 54 37 275 88 203 125 561 85 648 1005 91 308 31 84 23 49 23 59 41 10 344 102 19 671 38 140 93 0 35 87 107 50 73 23 52 193 17 65 362 3 23 231 84 75 501 140 920 68 38 2 44 109 38 94 646 149 288 238 32 284 0 31 18 80 36 171 127 416 195 290 86 422 131 147 96 0 596 176 27 118 32 19 12 73 37 95 48 52 9 46 320 6 449 177 149 76 105 49 35 398 171 18 35 58 155 40 456 157 569 288 235 126 236 22 38 115 90 71 190 5 177 23 245 57 7 2 268 49 36 10 121 21 176 41 91 8 30 239 273 97 219 845 221 57 105 24 0 44 4 52 17 113 34 3 413 103 97 114 220 14 8 16 0 13 17 184 159 0 46 1 10 356 77 195 141 15 43 45 9 33 85 124 137 50 49 2 128 89 259 81 19 3 6 22 15 31 153 117 49 70 36 137 6 207 143 208 2 3 496 23 51 196 73 16 35 45 53 176 2 130 55 64 8 32 1416 1080 74 86 60 171 12 15 15 160 286 45 145 24 22 55 195 74 175 18 142 0 38 30 0 1 18 7 2 133 12 35 21 249 48 107 2 127 49 39 1209 0 73 856 0 1970 106 351 0 115 35 154 965 91 76 74 67 204 166 19 16 756 65 294 4 331 34 261 478 228 148 0 359 166 374 0 140 174 413 186 408 45 125 434 102 0 248 52 152 0 453 443 188 698 127 119 6 63 38 25 0 773 4648 87 148 1084 2458 1538 6 133 554 310 1109 1 80 0 237 504 525 3 560 580 2172 1182 1011 354 577 13 4805 0 153 1147 0 0 170 0 191 375 226 1355 52 227 0 86 191 202 78 1340 611 35 0 105 23 363 0 401 248 1884 1350 278 470 3 3274 272 13 0 71 249 159 222 1852 470 77 0 2629 0 161 324 915 13 127 568 570 382 48 0 39 4 24 12 0 53 0 111 185 27 15 1 81 273 0 781 523 251 541 42 25 1566 74 303 0 375 353 71 2064 24 7 1 8 73 3074 22 23 0 138 11 1078 9 125 30 543 513 48 219 430 718 600 19 354 0 83 825 1181 2266 124 0 672 15 842 70 197 915 421 237 30 87 91 71 87 87 152 3024 267 281 718 7 24 5 0 171 658 1 44 51 0 2 707 432 141 987 1 20 0 15 0 0 169 3481 4649 29 520 0 323 781 342 108 1039 108 223 1 428 804 187 604 283 315 2441 280 1 231 26 22 36 22 98 64 16 1432 732 159 86 0 17 140 314 14 606 1054 279 472 136 0 8 0 17 0 0 3 132 5 122 0 167 60 0 1380 328 254 217 143 1686 278 5 1154 1256 420 4989 100 56 710 146 1111 68 50 0 54 55 0 35 226 214 0 0 1 37 0 229 717 982 824 58 310 511 696 57 1 237 75 1917 577 0 260 162 417 210 81 2978 58 414 291 3939 523 359 187 86 60 566 412 276 135 0 103 14 119 22 120 71 405 0 0 47 1 1145 50 22 256 592 207 13 71 27 681 385 3373 0 154 102 47 144 349 9 38 47 2 149 0 21 1752 101 72 1253 341 332 34 218 80 144 0 236 15 214 384 103 303 0 93 47 653 135 298 801 0 1009 881 547 886 165 589 1504 102 3005 62 124 539 2391 23 48 0 185 1215 7 288 67 3238 424 79 30 394 165 289 580 51 245 43 28 1099 447 849 191 9 152 133 114 172 256 170 49 792 0 915 132 197 220 138 522 278 0 54 164 402 66 0 90 102 48 743 510 856 12 47 232 982 73 522 1438 59 524 0 87 169 9 399 371 6 253 0 115 53 566 73 2676 2061 1 523 625 132 4 1391 36 95 0 0 4 238 402 80 1272 1 1405 544 1 105 1022 656 876 140 1942 8 55 971 192 172 940 10 1 397 2958 1 17 0 1096 555 125 23 112 1071 0 345 145 0 146 0 144 122 622 49 150 7 221 261 210 171 210 286 314 578 1304 147 1 431 155 92 0 66 2525 7 1 107 893 87 218 158 246 210 3 652 11 2 797 0 18 191 1 423 19 42 105 630 0 5 197 676 74 87 538 1 95 0 287 395 0 731 41 43 4335 66 0 172 1 157 364 14 0 525 540 0 0 272 901 0 11 70 0 431 49 3449 15 1434 181 0 10 284 660 377 484 12 59 3 329 1017 221 394 255 668 1236 160 306 106 222 92 1032 252 5 169 7 12 48 0 83 4 287 139 26 57 7 0 25 234 50 2028 188 71 0 52 579 10 167 277 1762 3 119 336 252 175 1237 627 248 1113 46 0 54 6 27 327 3476 16 32 91 88 324 18 70 2335 971 356 158 1 1092 0 0 0 55 0 4 1448 1 258 700 2584 2746 1 50 806 82 16 78 319 439 1 304 26 247 0 75 84 14 9 120 0 137 128 28 11 12 67 0 330 184 56 13 37 27 976 166 37 0 37 268 0 89 27 0 1 44 79 51 0 35 10 0 8 15 6 65 133 17 76 68 178 74 1 120 0 2 0 30 0 36 237 2 1 40 39 1 10 310 112 0 0 118 2 0 35 11 0 21 58 1 1 73 8 0 9 11 0 6 205 1 83 43 0 74 227 82 19 20 150 101 0 111 17 0 35 8 0 195 518 92 0 9 206 1 99 74 0 0 177 176 0 0 47 82 0 12 2 1000 15 56 0 11 30 3 0 23 18 55 0 68 72 0 28 238 1 0 7 10 0 26 8 369 152 65 0 0 7 172 23 19 74 10 29 6 224 33 15 101 17 321 19 65 919 0 338 22 1 166 25 104 35 11 86 387 14 9 287 0 45 83 77 0 176 223 0 0 15 20 0 33 44 0 6 1 62 89 49 67 8 110 96 0 51 42 8 28 5 80 0 29 34 0 130 533 0 4 384 0 72 75 108 46 149 16 152 3 0 162 20 169 0 52 21 0 220 15 0 69 43 25 0 37 223 0 58 93 0 81 27 0 0 74 589 2 0 264 139 0 147 23 0 76 42 0 32 146 410 1 95 30 1 555 472 20 79 158 35 0 20 37 20 96 593 6 0 117 12 9 109 0 9 168 224 7 138 47 0 140 420 324 140 293 0 13 50 38 1 17 200 2 228 44 0 39 23 23 15 96 47 148 3 149 5 11 209 2276 56 260 0 114 550 279 43 181 1336 115 379 13 162 137 107 20 18 11 150 19 41 2 336 23 138 0 0 120 475 20 206 142 161 96 42 28 132 172 13 18 21 0 42 0 0 64 5 0 8 0 33 34 0 15 5 0 11 8 16 91 240 21 59 188 0 0 4 398 0 37 0 30 27 18 6 1 243 312 0 80 245 8 42 495 0 5 8 99 0 88 48 0 81 118 1 17 10 172 8 0 0 6 166 5 11 28 1 140 63 4 2 454 48 4 131 178 3 49 205 1 92 33 14 0 153 193 1 4 75 0 5 75 142 0 48 85 148 91 49 0 14 29 282 72 11 19 8 0 84 64 273 27 90 0 35 195 46 115 244 101 1 241 198 7 59 1393 5 16 219 56 0 1 50 26 16 117 0 37 15 52 16 117 8 5 30 0 0 126 85 0 10 39 64 0 39 20 0 268 102 31 137 0 0 98 23 11 108 68 0 41 863 122 109 209 113 1 2 48 0 38 238 0 198 46 0 347 130 8 11 121 41 1 122 47 5 209 115 1 0 18 30 20 20 129 101 0 52 298 56 76 61 0 20 43 344 0 57 67 0 35 104 0 27 169 18 29 64 131 0 16 241 0 18 55 563 0 19 91 0 0 53 20 5 37 63 0 0 47 0 121 63 225 0 144 615 0 188 55 42 563 48 25 0 140 76 6 176 226 7 2 41 4 6 14 0 1 27 136 1 44 12 1 77 565 2 73 67 32 35 7 72 7 23 5 690 16 122 65 0 215 44 7 75 413 23 50 24 0 0 64 5 0 5 7 22 60 6 0 5 29 3 2 44 23 3 11 56 17 0 0 172 155 54 4 136 51 0 7 5 4 108 1769 38 45 0 0 0 23 0 44 47 103 0 308 3 173 19 4 188 14 0 0 2 69 303 157 37 26 103 154 1 57 49 27 0 44 69 26 30 46 49 51 20 9 0 33 292 0 233 291 10 12 70 44 0 8 40 0 0 6 86 0 85 33 0 379 575 7 61 137 92 50 57 197 0 197 36 1 51 39 27 11 1 SP254 Bacteria;Firmicutes;Bacilli;Lactobacillales;Streptococcaceae;Streptococcus;parasanguinis_clade_411 12334 2497 62 8028 2445 1313 1256 4366 578 827 2187 347 312 1344 863 5616 2598 3503 817 1257 23794 7404 1332 4333 6596 8187 842 10663 89 24 4 4483 176 351 6965 5763 7475 866 3537 527 1 265 260 6566 3287 127 1066 5188 3693 546 3326 17248 4668 880 1100 659 13302 2699 148 2194 1872 414 2263 1359 823 380 1923 1888 3389 165 4302 2295 2018 3557 8847 0 4968 3505 297 876 327 1449 2731 2937 756 818 2770 6472 1680 1628 115 5344 272 270 4390 459 14 166 10 4999 1503 2569 4480 3 790 203 3372 140 6 4135 6276 578 6034 392 2258 203 513 1926 1206 24 4100 2311 2259 1839 2541 3345 2641 925 1155 958 260 1 8697 4326 2414 1 342 3358 93 12 1582 14 1987 496 70 2848 3812 397 7651 4 5663 1262 520 676 5654 363 340 6435 498 3259 452 14 1574 236 679 10855 938 1877 15 3045 15 5665 48 4 4494 8175 451 368 741 448 5384 4444 2 3937 4301 1819 6 420 1 3648 519 725 2763 438 4273 2382 3346 4418 2793 1102 63 8 2974 0 476 5228 1 66 1253 3 766 224 4146 3295 2495 780 314 6623 47 333 908 4857 887 1879 3189 4754 342 724 94 2544 1801 2 6478 454 1453 2 1204 3121 2045 209 1340 14 763 252 390 6938 635 3020 2661 14368 2010 0 6 1396 6829 1509 4322 2322 10030 2997 6546 6435 4415 3267 7535 8090 6409 13207 0 0 0 0 0 0 0 0 0 0 0 0 0 0 0 0 0 0 0 0 0 0 0 0 0 0 0 0 0 0 0 0 0 0 0 0 0 0 0 0 0 0 0 0 0 0 0 0 0 0 0 0 0 0 0 0 0 0 0 0 0 0 0 0 0 0 0 0 0 0 0 0 0 0 0 0 0 0 0 0 0 0 0 0 0 0 0 0 0 0 0 0 0 0 0 0 0 0 0 0 0 0 0 0 0 0 0 0 0 0 0 0 0 0 0 0 0 0 0 0 0 0 0 0 0 0 0 0 0 0 0 0 0 0 0 0 0 0 0 0 0 0 0 0 0 0 0 0 0 0 0 0 0 0 0 0 0 0 0 0 0 0 0 0 0 0 0 0 0 0 0 0 0 0 0 0 0 0 0 0 0 0 0 0 0 0 0 0 0 0 0 0 0 0 0 0 0 0 0 0 0 0 0 0 0 0 0 0 0 0 0 0 0 0 0 0 0 0 0 0 0 0 0 0 0 0 0 0 0 0 0 0 0 0 0 0 0 0 0 0 0 0 0 0 0 0 0 0 0 0 0 0 0 0 0 0 0 0 0 0 0 0 0 0 0 0 0 0 0 0 0 0 0 0 0 0 0 0 0 0 0 0 0 0 0 0 0 0 0 0 0 0 0 0 0 0 0 0 0 0 0 0 0 0 0 0 0 0 0 0 0 0 0 0 0 0 0 0 0 0 0 0 0 0 0 0 0 0 0 0 0 0 0 0 0 0 0 0 0 0 0 0 0 0 0 0 0 0 0 0 0 0 0 0 0 0 0 0 0 0 0 0 0 0 0 0 0 0 0 0 0 0 0 0 0 0 0 0 0 0 0 0 0 0 0 0 0 0 0 0 0 0 0 0 0 0 0 0 0 0 0 0 0 0 0 0 0 0 0 0 0 0 0 0 0 0 0 0 0 0 0 0 0 0 0 0 0 0 0 0 0 0 0 0 0 0 0 0 0 0 0 0 0 0 0 0 0 0 0 0 0 0 0 0 0 0 0 0 0 0 0 0 0 0 0 0 0 0 0 0 0 0 0 0 0 0 0 0 0 0 0 0 0 0 0 0 0 0 0 0 0 0 0 0 0 0 0 0 0 0 0 0 0 0 0 0 0 0 0 0 0 0 0 0 0 0 0 0 0 0 0 0 0 0 0 0 0 0 0 0 0 0 0 0 0 0 0 0 0 0 0 0 0 0 0 0 0 0 0 0 0 0 0 0 0 0 0 0 0 0 0 0 0 0 0 0 0 0 0 0 0 0 0 0 0 0 0 0 0 0 0 0 0 0 0 0 0 0 0 0 0 0 0 0 0 0 0 0 0 0 0 0 0 0 0 0 0 0 0 0 0 0 0 0 0 0 0 0 0 0 0 0 0 0 0 0 0 0 0 0 0 0 0 0 0 0 0 0 0 0 0 0 0 0 0 0 0 0 0 0 0 0 0 0 0 0 0 0 0 0 0 0 0 0 0 0 0 0 0 0 0 0 0 0 0 0 0 0 0 0 0 0 0 0 0 0 0 0 0 0 0 0 0 0 0 0 0 0 0 0 0 0 0 0 0 0 0 0 0 0 0 0 0 0 0 0 0 0 0 0 0 0 0 0 0 0 0 0 0 0 0 0 0 0 0 0 0 0 0 0 0 0 0 0 0 0 0 0 0 0 0 0 0 0 0 0 0 0 0 0 0 0 0 0 0 0 0 0 0 0 0 0 0 0 0 0 0 0 0 0 0 0 0 0 0 0 0 0 0 0 0 0 0 0 0 0 0 0 0 0 0 0 0 0 0 0 0 0 0 0 0 0 0 0 0 0 0 0 0 0 0 0 0 0 0 0 0 0 0 0 0 0 0 0 0 0 0 0 0 0 0 0 0 0 0 0 0 0 0 0 0 0 0 0 0 0 0 0 0 0 0 0 0 0 0 0 0 0 0 0 0 0 0 0 0 0 0 0 0 0 0 0 0 0 0 0 0 0 0 0 0 0 0 0 0 0 0 0 0 0 0 0 0 0 0 0 0 0 0 0 0 0 0 0 0 0 0 0 0 0 0 0 0 0 0 0 0 0 0 0 0 0 0 0 0 0 0 0 0 0 0 0 0 0 0 0 0 0 0 0 0 0 0 0 0 0 0 0 0 0 0 0 0 0 0 0 0 0 0 0 0 0 0 0 0 0 0 0 0 0 0 0 0 0 0 0 0 0 0 0 0 0 0 0 0 0 0 0 0 0 0 0 0 0 0 0 0 0 0 0 0 0 0 0 0 0 0 0 0 0 0 0 0 0 0 0 0 0 0 0 0 0 0 0 0 0 0 0 0 0 0 0 0 0 0 0 0 0 0 0 0 0 0 0 0 0 0 0 0 0 0 0 0 0 0 0 0 0 0 0 0 0 0 0 0 0 0 0 0 0 0 0 0 0 0 0 0 0 0 0 0 0 0 0 0 0 0 0 0 0 0 0 0 0 0 0 0 0 0 0 0 0 0 0 0 0 0 0 0 0 0 0 0 0 0 0 0 0 0 0 0 0 0 0 0 0 0 0 0 0 0 0 0 0 0 0 0 0 0 0 0 0 0 0 0 0 0 0 0 0 0 0 0 0 0 0 0 0 0 0 0 0 0 0 0 0 0 0 0 0 0 0 0 0 0 0 0 0 0 0 0 0 0 0 0 0 0 0 0 0 0 0 0 0 0 0 0 0 0 0 0 0 0 0 0 0 0 0 0 0 0 0 0 0 0 0 0 0 0 0 0 0 0 0 0 0 0 0 0 0 0 0 0 0 0 0 0 0 0 0 0 0 0 0 0 0 0 0 0 0 0 0 0 0 0 0 0 0 0 0 0 0 0 0 0 0 0 0 0 0 0 0 0 0 0 0 0 0 0 0 0 0 0 0 0 0 0 0 0 0 0 0 0 0 0 0 0 0 0 0 0 0 0 0 0 0 0 0 0 0 0 0 0 0 0 0 0 0 0 0 0 0 0 0 0 0 0 0 0 0 0 0 0 0 0 0 0 0 0 0 0 0 0 0 0 0 0 0 0 0 0 0 0 0 0 0 0 0 0 0 0 0 0 0 0 0 0 0 0 0 0 0 0 0 0 0 0 0 0 0 0 0 0 0 0 0 0 0 0 0 0 0 0 0 0 0 0 0 0 0 0 0 0 0 0 0 0 0 0 0 0 0 0 0 0 0 0 0 0 0 0 0 0 0 0 0 0 0 0 0 0 0 0 0 0 0 0 0 0 0 0 0 0 0 0 0 0 0 0 0 0 0 0 0 0 0 0 0 0 0 0 0 0 0 0 0 0 0 0 0 0 0 0 0 0 0 0 0 0 0 0 0 0 0 0 0 0 0 0 0 0 0 0 0 0 0 0 0 0 0 0 0 0 0 0 0 0 0 0 0 0 0 0 0 0 0 0 0 0 0 0 0 0 0 0 0 0 0 0 0 0 0 0 0 0 0 0 0 0 0 0 0 0 0 0 0 SP258 Bacteria;Proteobacteria;Epsilonproteobacteria;Campylobacterales;Campylobacteraceae;Campylobacter;concisus 11 30 13 39 7 199 19 70 7 68 44 28 351 17 6 48 24 7 30 24 20 36 51 63 51 38 7 21 35 6 65 24 4 45 131 54 81 26 57 21 70 12 47 57 7 163 42 32 1 50 184 264 124 16 362 62 76 70 0 194 2 4 21 5 200 17 11 403 34 164 85 42 49 16 15 21 55 15 51 6 341 194 7 23 45 97 137 52 7 259 2 265 7 8 47 11 5 10 3 45 11 35 76 28 2 11 212 4 54 23 37 39 92 78 208 16 120 148 130 5 135 449 64 99 130 20 330 155 320 12 183 168 22 49 110 51 519 313 18 25 17 0 29 17 2 71 88 208 92 13 326 59 189 54 10 24 88 13 8 50 6 2 109 17 14 50 11 17 19 18 1 1 7 25 126 27 4 6 2 6 110 9 47 92 355 20 52 20 7 598 8 6 58 55 22 32 34 182 25 13 3 25 497 96 8 309 0 8 2 1 160 7 16 1 29 57 23 2 0 23 70 19 9 14 179 51 115 14 21 587 231 0 21 6 92 51 188 58 83 16 7 14 223 1 2 8 88 15 517 10 241 4 5 9 4 8 7 1 2 15 29 49 12 18 34 12 159 281 0 3 1 0 1 0 83 1 4 35 34 0 14 27 16 5 12 2 29 0 0 6 16 2 0 0 4 13 5 24 0 11 0 3 19 16 1 0 22 1 16 0 2 0 1 0 20 5 0 6 2 1 0 5 93 0 148 0 0 0 1 0 2 78 0 0 0 0 0 1 0 0 0 2 0 1 28 0 1 4 1 0 3 2 0 11 4 0 1 5 1 0 2 9 0 9 0 2 0 1 9 0 25 0 106 60 0 2 2 7 0 19 0 0 19 3 2 4 12 14 0 1 5 0 0 26 6 12 22 2 3 47 0 0 0 4 3 0 0 9 0 0 6 27 0 84 3 0 1 0 2 0 4 5 104 11 2 145 9 0 2 0 0 9 5 6 1 2 4 1 3 0 6 0 1 0 1 17 0 0 8 12 31 27 13 0 1 0 3 170 3 19 17 0 1 1 6 7 0 24 2 0 6 22 1 5 0 1 7 4 1 46 5 18 14 41 31 19 3 17 0 11 8 1 7 18 1 1 0 0 1 13 51 0 0 1 76 0 0 0 9 0 13 16 1 0 1 0 2 2 0 5 0 27 0 1 5 5 0 30 0 4 0 8 2 0 53 0 1 0 0 4 0 14 52 8 0 1 16 73 0 3 66 2 1 0 7 0 1 4 37 34 0 66 6 56 45 57 0 0 0 47 17 1 0 2 33 0 17 0 0 0 2 1 0 0 1 0 6 0 1 0 95 0 28 0 0 13 14 32 0 0 0 355 0 4 0 0 0 2 11 5 0 3 1 0 0 2 60 0 27 11 6 2 2 6 0 41 0 1 2 19 29 1 4 5 2 5 61 0 3 1 0 13 4 6 17 1 0 48 5 0 3 1 0 21 2 65 79 2 2 28 0 0 8 73 6 2 4 0 2 1 0 4 0 1 0 0 7 0 2 1 2 7 23 1 0 3 7 1 4 24 0 10 4 143 2 13 0 0 100 8 4 1 11 5 0 2 10 2 39 39 6 0 169 42 0 4 0 0 3 1 0 1 10 0 0 17 8 12 10 1 10 7 1 4 0 0 0 17 13 7 0 24 69 1 5 0 0 8 3 0 4 0 56 0 7 64 10 0 1 33 29 2 0 0 0 3 8 33 2 22 4 1 12 5 0 7 26 1 4 1 0 27 2 4 0 1 112 0 0 0 9 2 3 31 0 20 15 0 1 0 0 0 2 4 0 0 10 0 54 0 1 2 0 0 1 6 0 0 1 2 3 1 2 0 0 0 2 12 29 0 6 1 0 0 1 20 1 34 1 2 4 14 112 0 3 9 23 2 34 0 0 69 0 0 28 1 0 40 7 0 3 0 10 50 1 2 0 6 7 7 1 31 0 40 49 0 11 1 2 8 3 8 0 23 16 2 11 2 18 3 5 1 4 0 0 4 0 0 17 0 40 0 1 1 11 2 6 1 113 47 8 8 0 4 1 3 0 127 4 2 0 1 0 0 0 0 0 2 1 0 2 0 9 52 10 9 11 64 72 21 9 0 4 5 0 3 8 0 67 0 8 0 13 23 0 12 19 3 12 6 3 7 1 32 0 3 0 0 10 5 13 9 0 26 13 0 30 11 27 14 0 0 14 32 0 24 0 19 42 16 9 0 10 25 0 19 3 2 35 4 0 7 0 3 9 77 0 0 0 0 0 6 0 1 6 2 0 0 1 11 0 5 2 30 25 0 12 6 17 2 5 11 8 15 21 42 16 3 32 1 74 3 4 8 5 2 14 52 3 7 29 9 21 32 6 3 25 16 0 0 9 12 18 3 12 67 11 8 1 36 37 32 2 11 0 17 12 2 29 0 13 17 9 0 0 14 0 1 7 6 1 5 6 6 3 4 1 0 38 0 2 10 8 4 10 0 2 0 3 1 5 3 0 62 1 16 34 20 3 10 2 0 25 2 1 66 20 15 2 5 46 13 13 13 1 14 22 1 78 10 63 1 1 64 10 47 5 6 0 2 62 0 0 174 348 14 6 0 4 2 30 7 1 18 44 1 2 22 0 0 10 59 0 155 5 0 29 1 0 6 10 29 12 12 15 10 6 5 14 7 8 4 14 4 11 10 4 39 11 13 8 17 9 9 0 0 3 20 3 19 9 9 3 62 0 3 0 15 11 1 32 25 23 32 29 65 44 24 6 26 1 8 12 1 30 26 18 4 20 2 1 11 46 28 0 1 5 15 5 40 1 7 4 9 58 2 12 4 2 15 3 9 7 5 6 0 43 33 5 15 4 10 3 9 5 0 6 11 2 1 2 7 1 1 1 10 32 14 13 1 21 29 10 59 4 15 8 2 9 14 1 13 13 4 2 5 233 4 76 27 31 0 5 16 30 82 7 1 1 0 24 224 0 1 0 5 8 18 0 63 18 0 162 8 1 5 11 10 7 21 16 20 8 10 25 11 16 6 0 9 2 5 0 0 5 4 35 6 5 24 3 11 40 61 19 18 118 2 24 3 1 15 1 12 31 4 13 7 9 48 4 51 3 6 22 3 9 3 0 25 2 32 1 7 0 35 10 46 3 12 8 4 13 6 2 1 6 2 29 4 7 1 21 8 46 31 11 1 1 1 27 9 4 1 2 8 183 70 7 10 16 1 3 244 3 68 1 13 0 22 100 21 8 58 22 13 9 53 106 4 4 24 3 3 5 8 8 9 24 2 15 42 2 24 0 2 6 30 34 7 0 9 11 8 114 9 1 7 2 6 8 4 1 3 2 37 1 0 57 114 0 71 35 12 22 0 7 24 18 1 3 30 89 4 0 48 2 16 3 16 14 35 6 7 8 7 6 0 12 27 1 10 35 14 12 31 15 2 0 25 21 0 15 11 0 26 38 7 125 28 34 0 43 3 6 0 30 14 18 1 23 25 1 2 22 12 3 16 8 5 9 14 3 0 5 4 19 6 24 6 39 17 3 15 10 2 11 322 30 21 10 3 18 12 63 44 33 18 4 7 7 41 0 0 2 6 41 4 4 48 14 7 7 4 1 0 9 2 11 8 9 1 2 16 1 3 18 8 44 3 10 11 15 18 14 0 4 0 4 20 0 5 0 67 15 20 12 25 37 2 11 2 27 5 32 6 70 16 26 13 13 23 18 16 1 0 1 5 10 12 0 47 7 2 17 4 0 24 12 25 26 10 22 0 0 6 24 9 1 4 16 0 4 11 2 1 70 5 4 2 4 7 5 3 11 15 17 34 9 21 1 0 2 7 2 2 10 3 6 1 12 12 11 5 20 4 2 2 3 4 15 15 1 20 6 3 5 16 27 60 13 31 5 4 151 126 8 29 179 90 11 32 4 3 0 24 60 15 5 4 8 4 5 45 4 37 4 5 5 5 6 0 4 62 51 59 1 4 0 17 15 4 16 1 12 4 9 6 2 6 6 2 4 2 6 5 15 3 5 11 13 19 165 40 2 0 9 2 0 0 0 23 9 3 15 42 13 3 53 9 2 0 26 25 21 5 13 2 18 4 10 1 5 1 SP259 Bacteria;Fusobacteria;Fusobacteriia;Fusobacteriales;Leptotrichiaceae;Leptotrichia;sp. HMT225 0 2 85 2 0 4 5 6 2 6 2 201 329 0 30 0 3 4 2 13 2 0 0 0 3 3 7 2 41 146 5 1 60 0 3 4 6 39 1 8 0 20 0 1 0 14 6 0 0 0 14 6 0 8 0 0 5 2 15 26 5 0 6 2 7 12 0 4 5 2 0 1 3 0 0 13 2 0 0 0 1 0 3 2 0 0 6 2 1 7 19 0 4 8 0 0 4 0 17 0 0 13 0 2 7 2 0 6 10 9 0 23 1 13 0 0 0 4 2 0 0 0 0 1 1 0 0 2 10 464 3 7 0 15 0 5 3 0 0 2 1 16 351 5 0 4 13 16 1 3 4 0 14 3 0 0 11 0 0 0 1 21 0 0 1 0 3 0 4 0 0 0 0 10 0 0 0 0 0 3 2 2 24 4 2 0 6 0 0 0 0 0 6 0 3 1 0 0 2 3 2 6 7 1 1 0 1 10 13 4 0 0 1 3 0 0 8 2 2 1 27 2 0 35 3 3 4 12 8 24 0 4 7 13 0 4 3 3 0 22 2 0 2 0 2 0 1 0 16 1 0 3 1 7 0 0 32 1 1 3 0 3 4 9 8 0 0 29 0 234 46 0 3 8 85 0 118 388 44 0 316 47 9 45 84 121 1 50 0 861 216 0 2 0 416 34 173 181 0 76 4 96 199 257 44 0 27 0 393 4 12 0 0 0 55 1 529 4 2 0 0 0 58 0 0 7 0 0 20 0 4 25 17 117 21 0 10 7 0 0 1 2 0 214 186 34 0 1 3 0 5 16 20 55 8 1 0 195 0 0 0 74 0 57 0 1 1 405 2512 0 422 3 91 210 48 4 1 462 0 33 0 0 548 22 0 29 67 505 0 0 0 61 0 5 4 406 476 0 78 375 1620 0 0 5 0 0 3 1163 63 0 39 204 9 4 37 0 8 0 6 0 82 5 0 3 0 67 3 0 12 3 6 164 6 139 0 419 941 0 15 0 29 15 1 0 0 5 0 0 190 164 48 0 23 976 0 32 0 35 0 132 13 1000 0 196 1 11 0 85 32 1 2 69 213 2 103 0 180 2 28 23 5 0 2 5 201 17 142 782 3 741 80 2 0 414 91 0 8 6 0 197 42 13 0 4 1384 0 0 36 0 1 31 8 0 35 46 28 100 3 0 65 0 22 29 36 50 8 0 9 0 29 0 554 1588 1 498 0 36 0 9 0 0 43 259 0 122 36 288 7 63 6 373 30 24 0 50 6 0 48 0 90 70 5 1240 134 35 32 0 0 0 7 11 0 1 119 8 0 138 0 0 0 0 148 76 0 3 141 454 6 2 6 1 0 26 105 252 27 0 58 0 0 0 69 0 253 346 0 0 0 36 483 777 29 614 12 2 0 96 0 145 40 14 0 25 45 4 2181 492 55 2 577 140 32 0 1295 378 58 59 0 3 6 1 178 117 917 467 0 0 737 20 1 83 32 3 19 0 16 95 3 7 16 1 2 61 4 4 0 4 0 80 10 0 969 0 126 3 56 125 1449 340 0 0 45 143 0 0 205 1033 0 104 46 51 0 4 8 133 1 1 2 0 2 12 0 571 45 25 2 31 0 4 3 4 0 10 2 0 28 30 1 1 5 0 111 0 4642 0 16 345 122 29 27 22 1 0 1 1781 0 5 255 298 127 255 381 164 1 96 0 0 87 383 14 254 5 228 7 34 668 213 132 0 227 92 411 719 1 1202 0 1186 256 0 58 82 2 148 3 10 3 8 0 689 158 19 92 0 31 22 0 0 0 6 72 3 89 2 23 0 3 14 0 1 5 93 0 12 0 0 0 0 1025 17 5 203 0 22 5 32 421 1 5 7 126 5 2 0 0 0 0 0 6 237 0 1 365 23 0 10 4 31 1439 33 34 0 0 2 0 0 0 0 49 66 0 2 73 1 0 229 58 155 139 0 54 1 44 371 0 104 14 0 366 319 472 55 278 7 204 24 6 896 8 384 0 2 9 2 75 280 0 14 49 2548 772 24 0 1 0 1 0 0 14 46 1 102 0 78 0 6 0 0 1576 2892 34 976 458 0 1007 1421 326 0 27 49 214 4 1519 0 733 0 0 1 369 44 10 857 0 54 112 0 9 53 155 7 1 11 0 162 113 0 74 308 119 52 0 128 2079 701 1337 0 12 8 5 558 0 2 5 0 154 21 6 1 30 28 0 5 0 0 4 94 0 127 3 0 45 1 0 55 27 0 72 0 111 565 497 104 0 13 203 20 324 17 2 0 0 27 14 4 0 0 52 0 0 0 0 0 10 0 0 257 51 0 0 0 0 1 4 41 8 3 0 178 8 161 0 3 15 4 69 69 0 0 21 22 0 80 6 1 10 360 0 53 1 0 0 9 0 0 0 1 0 256 15 0 0 1 10 13 0 97 44 2 23 22 0 86 10 0 1379 150 387 104 1 288 0 0 1869 6 0 8 515 4 0 7 1 24 74 25 8 0 3 7 21 0 0 0 0 3 2 1 28 23 0 0 12 17 67 0 0 0 18 12 0 6 160 26 2 161 0 175 1 14 421 0 6 0 0 11 41 122 0 1 392 1 1 17 0 0 1140 25 0 0 392 56 0 31 8 0 32 150 0 6 20 70 0 1 59 53 5 135 15 117 59 7 92 0 8 150 121 57 995 0 0 0 0 0 326 5 1 100 24 15 32 0 10 1 0 9 109 3 0 253 215 39 191 12 0 10 0 9 0 0 6 7 0 9 124 0 14 10 22 0 489 36 4 1 11 5 0 4 165 0 0 2 11 1 53 35 0 19 36 0 3 1 46 0 19 129 0 1 0 0 149 27 2 0 14 8 158 210 7 34 18 0 78 117 0 1 51 129 0 48 50 1 251 87 2 2 29 18 8 142 495 0 149 28 0 3 20 1 0 82 85 16 0 950 36 2 188 19 1 45 152 0 9 25 1 0 548 1 2 111 171 0 138 604 0 0 15 3 2 2 0 8 0 109 17 0 119 0 8 0 0 0 567 19 1 382 34 2388 18 84 0 70 25 33 0 347 186 0 575 35 0 2 0 2 0 1 6 54 0 210 2 0 212 25 0 46 0 809 195 23 0 165 8 107 2189 5 18 132 90 70 3 11 47 12 0 1 7 3660 7 0 0 80 11 0 3 4 0 0 6 29 10 224 7 6 0 0 70 10 1 7 2 0 0 1 0 55 0 24 817 0 22 3 1 19 32 2 17 120 0 0 33 334 0 2682 1326 1 12 86 5 13 8 0 0 37 6 0 14 0 0 1 1 44 0 5 12 0 51 151 0 16 42 30 0 0 43 90 118 0 22 25 55 3 4 0 391 10 3 0 30 7 6 0 257 0 15 17 21 0 23 25 0 1 248 1 0 246 10 5 63 66 0 237 181 1 18 154 7 36 179 18 3 9 33 39 31 1 2 0 57 52 0 0 46 18 0 149 55 0 6 23 0 0 8 1 9 356 13 0 253 553 0 48 68 74 12 58 7 471 0 1 0 38 8 0 113 2 381 0 68 168 0 248 19 31 121 0 0 55 920 5 0 248 0 1 530 0 8 210 0 1 213 16 0 13 2 0 39 81 1 30 245 8 0 49 99 0 15 125 2 47 28 17 1 383 246 3 0 1 169 0 239 87 0 9 1 0 14 54 1 0 0 24 0 45 104 0 38 19 0 0 6 30 0 0 16 0 17 171 12 2 177 107 7 0 45 219 0 84 88 0 100 67 0 81 7 0 2 6 0 2 281 5 0 74 12 23 2 93 60 4 150 57 0 5 11 1 0 0 0 0 80 2 0 196 87 1 15 4 0 2 41 2 189 16 7 163 7 58 0 1 2 112 11 7 1 0 0 66 2 0 11 0 1 6 5 3 26 10 14 38 768 33 407 167 21 0 1 1 0 3 16 34 9 0 114 473 701 13 73 504 0 26 20 0 43 252 37 0 0 57 0 0 0 0 0 2 0 29 11 10 123 175 147 7 0 0 25 12 0 4 0 0 78 31 0 128 53 110 5 195 33 0 253 121 1 1 11 0 0 677 4 0 1 28 0 2 24 21 0 3 119 0 0 0 13 0 14 2 0 65 192 0 5 6 3 0 6 4 0 229 6 0 22 102 0 0 0 SP283 Bacteria;Firmicutes;Bacilli;Lactobacillales;Streptococcaceae;Streptococcus;oralis 346 299 66733 212 274 1137 122 3962 292 234 1445 1645 194 158 322 1159 255 865 505 2836 174 50 1043 4359 870 312 1419 834 435 770 248 605 2512 453 63 291 129 2782 188 205 422 194 141 569 1523 163 1735 141 895 59 304 75 69 164 98 57 1027 1299 170 3777 862 185 73 84 1965 1016 458 136 1784 169 406 1668 381 322 1492 903 294 108 1757 4254 200 31 894 1187 40 2265 136 268 1128 482 617 74 1064 900 270 2598 232 498 52 326 349 657 619 1549 1270 1535 570 736 30 1163 1001 1302 394 1235 210 766 388 3491 1163 618 314 2574 70 516 291 610 220 89 193 4200 31 68 57 1121 564 2378 46 272 538 33 2814 303 1319 3562 2099 1862 192 31 430 140 1770 44 3161 890 465 1193 1045 5828 145 93 315 362 171 244 812 780 1563 510 4096 438 10 1557 184 931 644 248 472 445 175 3022 15 93 1778 318 195 417 607 285 26 328 846 91 235 298 156 2301 42 86 1854 1963 4920 24 1171 996 60 22 38 573 611 58 228 111 174 145 334 755 1123 101 579 132 74 351 126 1465 304 823 249 603 1515 78 602 277 883 490 87 41 250 132 687 484 3524 1940 929 99 247 829 89 877 13 179 89 64 31 2116 32 103 474 47 451 2692 9906 39 2788 2265 337 279 155 815 0 0 0 0 0 0 0 0 0 0 0 0 0 0 0 0 0 0 0 0 0 0 0 0 0 0 0 0 0 0 0 0 0 0 0 0 0 0 0 0 0 0 0 0 0 0 0 0 0 0 0 0 0 0 0 0 0 0 0 0 0 0 0 0 0 0 0 0 0 0 0 0 0 0 0 0 0 0 0 0 0 0 0 0 0 0 0 0 0 0 0 0 0 0 0 0 0 0 0 0 0 0 0 0 0 0 0 0 0 0 0 0 0 0 0 0 0 0 0 0 0 0 0 0 0 0 0 0 0 0 0 0 0 0 0 0 0 0 0 0 0 0 0 0 0 0 0 0 0 0 0 0 0 0 0 0 0 0 0 0 0 0 0 0 0 0 0 0 0 0 0 0 0 0 0 0 0 0 0 0 0 0 0 0 0 0 0 0 0 0 0 0 0 0 0 0 0 0 0 0 0 0 0 0 0 0 0 0 0 0 0 0 0 0 0 0 0 0 0 0 0 0 0 0 0 0 0 0 0 0 0 0 0 0 0 0 0 0 0 0 0 0 0 0 0 0 0 0 0 0 0 0 0 0 0 0 0 0 0 0 0 0 0 0 0 0 0 0 0 0 0 0 0 0 0 0 0 0 0 0 0 0 0 0 0 0 0 0 0 0 0 0 0 0 0 0 0 0 0 0 0 0 0 0 0 0 0 0 0 0 0 0 0 0 0 0 0 0 0 0 0 0 0 0 0 0 0 0 0 0 0 0 0 0 0 0 0 0 0 0 0 0 0 0 0 0 0 0 0 0 0 0 0 0 0 0 0 0 0 0 0 0 0 0 0 0 0 0 0 0 0 0 0 0 0 0 0 0 0 0 0 0 0 0 0 0 0 0 0 0 0 0 0 0 0 0 0 0 0 0 0 0 0 0 0 0 0 0 0 0 0 0 0 0 0 0 0 0 0 0 0 0 0 0 0 0 0 0 0 0 0 0 0 0 0 0 0 0 0 0 0 0 0 0 0 0 0 0 0 0 0 0 0 0 0 0 0 0 0 0 0 0 0 0 0 0 0 0 0 0 0 0 0 0 0 0 0 0 0 0 0 0 0 0 0 0 0 0 0 0 0 0 0 0 0 0 0 0 0 0 0 0 0 0 0 0 0 0 0 0 0 0 0 0 0 0 0 0 0 0 0 0 0 0 0 0 0 0 0 0 0 0 0 0 0 0 0 0 0 0 0 0 0 0 0 0 0 0 0 0 0 0 0 0 0 0 0 0 0 0 0 0 0 0 0 0 0 0 0 0 0 0 0 0 0 0 0 0 0 0 0 0 0 0 0 0 0 0 0 0 0 0 0 0 0 0 0 0 0 0 0 0 0 0 0 0 0 0 0 0 0 0 0 0 0 0 0 0 0 0 0 0 0 0 0 0 0 0 0 0 0 0 0 0 0 0 0 0 0 0 0 0 0 0 0 0 0 0 0 0 0 0 0 0 0 0 0 0 0 0 0 0 0 0 0 0 0 0 0 0 0 0 0 0 0 0 0 0 0 0 0 0 0 0 0 0 0 0 0 0 0 0 0 0 0 0 0 0 0 0 0 0 0 0 0 0 0 0 0 0 0 0 0 0 0 0 0 0 0 0 0 0 0 0 0 0 0 0 0 0 0 0 0 0 0 0 0 0 0 0 0 0 0 0 0 0 0 0 0 0 0 0 0 0 0 0 0 0 0 0 0 0 0 0 0 0 0 0 0 0 0 0 0 0 0 0 0 0 0 0 0 0 0 0 0 0 0 0 0 0 0 0 0 0 0 0 0 0 0 0 0 0 0 0 0 0 0 0 0 0 0 0 0 0 0 0 0 0 0 0 0 0 0 0 0 0 0 0 0 0 0 0 0 0 0 0 0 0 0 0 0 0 0 0 0 0 0 0 0 0 0 0 0 0 0 0 0 0 0 0 0 0 0 0 0 0 0 0 0 0 0 0 0 0 0 0 0 0 0 0 0 0 0 0 0 0 0 0 0 0 0 0 0 0 0 0 0 0 0 0 0 0 0 0 0 0 0 0 0 0 0 0 0 0 0 0 0 0 0 0 0 0 0 0 0 0 0 0 0 0 0 0 0 0 0 0 0 0 0 0 0 0 0 0 0 0 0 0 0 0 0 0 0 0 0 0 0 0 0 0 0 0 0 0 0 0 0 0 0 0 0 0 0 0 0 0 0 0 0 0 0 0 0 0 0 0 0 0 0 0 0 0 0 0 0 0 0 0 0 0 0 0 0 0 0 0 0 0 0 0 0 0 0 0 0 0 0 0 0 0 0 0 0 0 0 0 0 0 0 0 0 0 0 0 0 0 0 0 0 0 0 0 0 0 0 0 0 0 0 0 0 0 0 0 0 0 0 0 0 0 0 0 0 0 0 0 0 0 0 0 0 0 0 0 0 0 0 0 0 0 0 0 0 0 0 0 0 0 0 0 0 0 0 0 0 0 0 0 0 0 0 0 0 0 0 0 0 0 0 0 0 0 0 0 0 0 0 0 0 0 0 0 0 0 0 0 0 0 0 0 0 0 0 0 0 0 0 0 0 0 0 0 0 0 0 0 0 0 0 0 0 0 0 0 0 0 0 0 0 0 0 0 0 0 0 0 0 0 0 0 0 0 0 0 0 0 0 0 0 0 0 0 0 0 0 0 0 0 0 0 0 0 0 0 0 0 0 0 0 0 0 0 0 0 0 0 0 0 0 0 0 0 0 0 0 0 0 0 0 0 0 0 0 0 0 0 0 0 0 0 0 0 0 0 0 0 0 0 0 0 0 0 0 0 0 0 0 0 0 0 0 0 0 0 0 0 0 0 0 0 0 0 0 0 0 0 0 0 0 0 0 0 0 0 0 0 0 0 0 0 0 0 0 0 0 0 0 0 0 0 0 0 0 0 0 0 0 0 0 0 0 0 0 0 0 0 0 0 0 0 0 0 0 0 0 0 0 0 0 0 0 0 0 0 0 0 0 0 0 0 0 0 0 0 0 0 0 0 0 0 0 0 0 0 0 0 0 0 0 0 0 0 0 0 0 0 0 0 0 0 0 0 0 0 0 0 0 0 0 0 0 0 0 0 0 0 0 0 0 0 0 0 0 0 0 0 0 0 0 0 0 0 0 0 0 0 0 0 0 0 0 0 0 0 0 0 0 0 0 0 0 0 0 0 0 0 0 0 0 0 0 0 0 0 0 0 0 0 0 0 0 0 0 0 0 0 0 0 0 0 0 0 0 0 0 0 0 0 0 0 0 0 0 0 0 0 0 0 0 0 0 0 0 0 0 0 0 0 0 0 0 0 0 0 0 0 0 0 0 0 0 0 0 0 0 0 0 0 0 0 0 0 0 0 0 0 0 0 0 0 0 0 0 0 0 0 0 0 0 0 0 0 0 0 0 0 0 0 0 0 0 0 0 0 0 0 0 0 0 0 0 0 0 0 0 0 0 0 0 0 0 0 0 0 0 0 0 0 0 0 0 0 0 0 0 0 SP284 Bacteria;Firmicutes;Bacilli;Lactobacillales;Streptococcaceae;Streptococcus;sanguinis 41 1220 337 503 103 489 284 440 1292 3707 269 1498 2534 46 502 75 204 1137 594 135 249 87 150 647 540 178 695 380 1595 2024 36 496 649 209 994 395 297 1052 72 359 452 618 346 277 340 91 632 928 577 2026 316 56 96 407 167 101 210 962 780 1019 371 292 282 917 138 2672 638 135 804 292 455 683 126 433 521 343 93 240 95 988 203 41 626 127 23 80 169 1182 84 46 381 361 736 891 450 335 1063 410 53 310 316 556 234 4434 463 876 39 280 179 1699 2052 2772 455 358 136 169 114 268 464 152 507 488 13 778 257 234 134 25 141 2267 295 87 158 2541 165 161 112 158 1219 148 343 1273 5343 676 1800 918 164 370 126 136 348 476 797 654 1022 194 166 1147 210 422 722 1228 142 50 177 412 1508 105 854 823 7485 31 194 541 150 306 847 702 274 1228 101 1443 475 518 596 999 0 323 656 609 346 185 679 180 215 53 78 266 337 422 730 251 372 265 933 92 223 311 1663 2946 107 700 164 109 254 278 68 121 1830 112 667 104 658 1274 2 143 46 338 3452 1 220 351 359 87 66 24 306 277 173 1169 328 29 149 891 427 336 253 123 249 50 367 40 130 132 17 854 239 24 294 165 921 264 1029 133 729 256 53 864 4100 799 703 7 614 717 923 2 166 975 241 1515 1488 2290 542 445 797 2283 301 1158 1549 1655 1295 6292 2619 2451 3143 1796 2424 2578 1 669 1394 559 340 335 965 3222 913 6178 3233 546 347 773 433 959 1305 1521 1594 566 3455 448 4812 3133 943 4 1134 144 10 1 519 20 935 531 2118 354 367 5 1130 173 697 779 4329 506 2 4255 968 889 751 1505 2315 626 2304 690 996 1404 961 3203 9276 1241 1932 1 2632 1108 3635 1037 2299 751 3743 3065 1392 3 752 1898 327 1376 1747 841 90 4 579 753 8112 0 651 1751 586 1873 1163 2415 8 2696 1694 1937 2 1437 1561 1560 1368 1016 1900 1122 752 910 1449 893 500 675 14 444 1545 4300 2137 519 4494 566 1334 1439 2288 0 466 2948 609 2073 288 206 15 114 3084 7184 384 1890 871 596 1523 1154 7745 1694 623 3163 2728 1008 64 930 4170 955 1295 928 122 1359 603 887 243 500 280 913 46 608 2143 461 3537 530 1782 5455 288 1233 57 2055 404 319 506 1527 2494 3761 4090 3290 1629 1218 1067 2899 1439 1393 1653 2553 1367 273 501 550 666 670 1677 1371 1445 3165 152 1273 1005 609 6366 6518 340 2002 490 2810 105 6134 341 3072 3552 2424 384 38 969 641 1983 2468 161 1561 604 724 997 3468 592 834 1683 1090 2073 466 2218 1156 730 1345 4854 1361 237 934 647 3 3768 729 948 1589 1969 1662 162 571 1622 1039 308 164 994 757 1431 842 4028 1380 1212 1318 252 651 349 203 5488 584 1207 326 282 77 67 1896 3491 1350 1217 3 1859 843 2272 4218 347 3287 194 6 1623 1320 1490 820 778 882 3146 148 1554 134 162 6618 2195 1911 3316 426 4720 2637 4 2764 1 176 5900 987 1869 906 3126 718 1020 788 1643 716 5123 1122 3312 1378 539 5544 3544 2442 3392 5300 1009 952 1751 711 1637 562 1164 551 918 4992 1923 422 1605 689 342 2203 793 1452 1599 667 389 558 1298 5430 1 872 458 566 1024 3077 1506 1866 1015 114 190 1549 2328 42 930 1800 157 793 1922 646 1927 837 4291 2803 2132 1826 7423 473 2642 1117 887 2249 4730 261 2809 742 130 358 860 2311 429 447 702 254 2700 2 1506 2458 1010 1212 352 2672 224 2009 568 3766 5725 819 3412 762 1098 2267 865 264 353 5875 717 191 580 6767 5500 10 2709 603 4411 2224 1340 295 2170 743 458 891 3060 2465 1008 787 1223 913 2089 850 1611 2014 700 886 595 2169 536 5190 3073 1585 1628 2621 2064 2077 3314 4447 3004 8032 2387 964 7021 4355 4284 1171 1802 2970 681 1807 1226 7625 1473 2457 2808 497 3615 244 608 1463 2265 1273 1092 942 5353 5415 540 241 2153 749 485 2893 174 95 3024 1277 1478 1794 4146 222 2789 1608 959 33 567 2802 3195 6269 2118 279 909 3583 408 1368 243 215 660 567 2515 563 161 459 4561 139 59 1270 427 290 636 1705 688 1148 1909 870 720 2494 163 824 1491 9 762 2650 2039 1299 1120 2165 1026 1510 687 4986 2995 1939 317 1013 742 222 1292 1084 1306 4394 1310 3621 3605 1480 1617 4986 3748 1917 2168 385 841 1033 1173 931 683 524 730 629 1528 1303 188 3680 206 1631 1250 1058 1432 235 2038 679 328 3306 1165 7320 599 569 1462 780 16 3449 3932 1814 976 4121 514 2266 373 897 257 3553 1904 1912 1669 1500 637 2087 1645 1302 0 1093 3075 599 0 269 807 1464 1813 4687 4975 498 1648 3525 3229 1096 817 3703 889 1250 861 156 2749 4636 3490 622 755 4990 2670 9987 3109 1623 224 1102 1347 1159 1221 59 4652 3436 544 712 2369 2402 937 1345 1310 300 813 2155 9030 567 981 302 2388 1376 2025 566 531 1694 5760 3796 1253 2598 755 746 2017 1345 1855 3639 1325 2186 3453 1190 0 1260 165 1543 888 823 502 702 1489 186 239 127 206 3192 516 1893 1408 103 2545 287 0 3026 114 0 8 810 4005 4871 335 2860 1336 1 2668 653 2029 84 1599 1554 1027 496 1950 352 1810 53 125 215 110 324 328 38 307 195 335 181 194 334 47 3687 1037 189 132 536 108 722 437 350 13 989 573 20 294 152 15 83 1062 488 577 3 245 40 18 68 35 15 472 605 80 90 135 1369 264 40 452 2 22 1373 1215 108 326 968 110 47 305 423 201 347 675 497 28 113 939 322 13 257 221 34 178 811 12 24 288 55 86 76 291 12 889 336 136 396 241 12 192 300 1119 65 100 247 1581 49 986 778 15 160 104 67 538 1106 348 41 54 831 23 105 428 67 2 563 535 77 15 940 95 5 326 60 1083 172 161 10 50 266 140 363 135 104 494 65 429 92 126 295 83 102 46 194 300 302 124 2046 141 146 956 64 26 251 1184 448 169 469 156 107 55 628 519 25 558 84 928 116 154 915 147 2338 463 64 522 552 103 96 42 540 1014 127 184 1897 9 232 396 56 36 1089 740 28 25 296 728 28 92 451 39 1038 33 97 110 424 967 73 255 165 14 375 484 679 56 101 179 640 195 510 23 400 803 64 48 1636 41 409 371 60 294 431 45 507 280 32 1625 108 837 10 394 271 33 1248 743 38 410 490 507 336 805 668 6 2034 1387 23 187 288 54 146 318 273 41 101 816 330 224 1049 156 39 226 539 34 481 1259 520 112 467 327 16 434 307 93 861 209 60 24 159 212 91 291 1285 36 10 936 113 2219 622 34 275 1042 2005 21 997 150 5 809 861 1029 802 489 30 244 281 414 144 336 379 172 254 113 27 69 445 49 130 128 230 485 20 192 51 61 1244 717 92 732 256 262 1023 663 1694 894 317 1128 627 54 110 308 205 213 139 1329 642 41 364 121 772 102 554 34 75 158 1044 7 1198 540 67 273 188 853 2139 276 150 56 128 26 137 1870 18 106 53 27 44 6 323 425 7 274 1145 72 260 106 70 546 455 164 151 828 34 48 118 2009 1698 209 1126 137 106 287 332 22 361 997 42 240 876 25 132 215 24 37 26 297 57 862 335 153 80 811 29 215 78 418 2710 187 170 152 391 77 92 937 102 461 241 5 456 276 73 36 352 399 32 35 426 38 494 369 39 67 651 474 8 44 321 1030 77 2196 526 9 229 458 205 128 296 26 357 286 721 287 89 397 48 302 1602 670 208 199 495 122 127 496 244 317 924 171 37 759 929 80 143 1112 53 22 446 172 640 5472 413 80 148 449 1901 171 30 341 279 278 33 295 73 33 125 557 40 31 182 117 295 38 136 779 27 441 206 385 763 38 10 75 301 163 835 145 43 2512 1137 402 970 813 355 123 76 175 341 229 631 18 252 186 49 2443 850 109 239 729 702 29 534 714 42 1472 2875 76 22 570 198 54 43 228 108 77 247 716 175 273 214 14 333 268 275 37 346 555 24 182 933 125 431 1752 110 82 214 737 3 141 636 106 451 979 685 34 286 554 47 80 335 240 84 869 274 30 807 495 63 240 114 770 60 1659 756 8 334 127 48 697 46 326 45 780 1994 979 745 170 67 160 560 188 238 773 176 37 246 180 48 771 76 32 1066 411 26 465 349 81 468 88 290 812 50 246 903 60 309 214 91 560 50 99 201 1199 356 151 142 123 39 136 185 15 189 214 62 101 802 523 255 650 265 7 444 196 104 353 373 444 34 96 558 122 778 79 148 395 98 180 34 55 273 1242 139 740 47 15 42 130 2520 171 456 264 122 1310 187 1662 156 218 958 57 28 34 248 299 1072 500 191 42 265 827 46 984 371 429 49 291 240 19 265 265 47 190 721 302 86 364 2269 54 176 700 75 50 301 454 14 354 324 13 9 3800 572 168 354 156 146 984 3273 120 76 799 146 58 351 331 20 521 360 117 342 491 137 160 210 SP285 Bacteria;Proteobacteria;Betaproteobacteria;Neisseriales;Neisseriaceae;Eikenella;halliae 0 0 0 0 0 0 0 0 0 0 0 0 0 0 0 0 0 0 0 0 0 0 0 0 0 0 0 0 0 0 0 0 0 0 0 0 0 0 0 0 0 0 0 0 0 0 0 0 0 0 0 0 0 0 0 0 0 0 0 0 0 0 0 0 0 0 0 0 0 0 0 0 0 0 0 0 0 0 0 0 0 0 0 0 0 0 0 0 0 0 0 0 0 0 0 0 0 0 0 0 0 0 0 0 0 0 0 0 0 0 0 0 0 0 0 0 0 0 0 0 0 0 0 0 0 0 0 0 0 0 0 0 0 0 0 0 0 0 0 0 0 0 0 0 0 0 0 0 0 0 0 0 0 0 0 0 0 0 0 0 0 0 0 0 0 0 0 0 0 0 0 0 0 0 0 0 0 0 0 0 0 0 0 0 0 0 0 0 0 0 0 0 0 0 0 0 0 0 0 0 0 0 0 0 0 0 0 0 0 0 0 0 0 0 0 0 0 0 0 0 0 0 0 0 0 0 0 0 0 0 0 0 0 0 0 0 0 0 0 0 0 0 0 0 0 0 0 0 0 0 0 0 0 0 0 0 0 0 0 0 0 0 0 0 0 0 0 0 6 13 4 0 62 0 4 0 3 0 9 7 11 25 2 1 9 2 0 4 46 8 7 8 0 5 31 21 7 3 0 10 1 11 1 2 1 1 11 15 5 0 4 2 1 2 0 2 0 30 4 5 3 0 2 0 4 0 0 0 1 0 2 13 1 3 28 0 0 2 1 21 1 1 0 3 11 2 12 1 3 44 68 3 30 0 14 24 0 4 6 0 1 11 3 6 3 4 10 4 6 0 7 1 9 9 5 3 4 0 0 1 0 0 6 1 3 4 8 2 0 1 28 14 0 17 3 1 13 4 3 5 40 18 1 0 2 6 0 8 29 24 10 6 1 24 20 41 2 0 9 0 17 18 21 1 0 6 3 2 2 6 0 20 11 1 0 3 5 1 2 0 4 4 14 1 60 0 0 0 2 1 1 5 4 15 0 1 0 4 0 10 0 13 0 5 2 11 0 4 0 12 80 7 38 5 23 22 2 2 12 10 12 1 1 0 3 11 8 4 26 7 7 5 4 7 6 0 1 16 0 4 3 0 0 12 8 0 1 48 0 0 16 0 5 12 0 3 42 9 7 14 0 0 2 9 9 9 5 33 4 7 4 14 30 24 3 0 5 1 2 0 0 1 2 1 4 10 3 1 8 1 6 4 10 14 5 7 0 12 0 7 33 1 0 3 1 3 0 0 0 4 0 0 12 2 3 2 14 3 0 0 0 10 1 6 4 10 6 0 4 0 1 0 0 4 1 5 5 7 0 7 0 6 0 5 20 11 6 2 11 13 20 0 2 1 1 14 10 4 6 27 9 4 13 37 1 2 51 1 3 21 11 7 0 39 9 9 8 0 0 0 15 7 5 14 8 12 0 0 56 21 10 0 32 11 12 0 7 2 3 10 12 0 13 18 5 19 2 0 1 2 4 18 0 2 8 8 13 153 0 0 1 6 3 0 0 9 0 14 3 0 13 0 0 7 17 4 0 0 0 1 0 26 2 1 6 2 0 30 1 6 1 5 0 0 0 1 14 0 19 1 1 13 8 21 1 0 8 12 7 8 1 2 6 1 2 3 2 2 2 8 23 6 2 0 3 0 11 4 1 0 3 16 21 1 8 3 6 6 5 9 14 20 2 1 17 10 2 8 6 2 22 24 8 8 19 0 20 4 18 16 1 13 2 11 3 4 9 7 26 8 0 31 1 19 8 4 22 0 0 13 27 1 0 50 1 97 51 50 0 27 17 0 59 34 0 30 9 0 3 5 2 5 12 6 0 1 1 7 3 2 0 3 7 0 2 0 4 4 0 3 7 0 0 19 2 1 4 7 5 0 1 3 6 1 2 11 1 2 2 4 0 5 4 3 2 0 6 4 8 2 3 0 4 4 0 2 0 0 3 1 7 2 4 0 5 11 0 8 7 8 32 0 0 2 9 15 4 0 14 26 1 0 8 1 4 2 7 16 7 18 9 12 0 11 1 11 0 11 1 12 3 24 50 20 45 0 2 2 6 17 8 7 5 6 0 0 1 7 20 1 9 0 2 4 0 8 5 9 17 14 11 35 3 4 0 3 4 0 1 0 33 5 3 2 21 1 11 1 1 0 14 10 2 1 13 36 1 1 0 5 4 6 6 6 1 1 0 2 2 1 7 24 1 5 4 51 8 0 0 4 0 7 1 24 1 3 0 0 0 0 0 18 0 14 0 7 0 0 1 4 1 0 28 8 10 0 7 0 9 0 1 0 0 0 0 0 0 0 2 0 0 0 0 6 8 0 0 1 0 7 0 1 0 0 0 0 0 0 0 0 0 1 4 0 1 0 0 0 1 0 0 2 0 1 4 10 4 0 1 0 0 0 5 0 0 1 0 0 2 0 1 1 8 2 0 0 3 5 0 1 2 0 1 1 0 0 0 1 0 0 0 0 1 0 0 1 0 0 3 2 1 0 1 0 10 0 8 5 0 2 0 0 0 11 0 0 0 3 0 0 1 0 0 0 1 0 0 2 2 0 8 0 0 0 0 0 0 0 0 0 0 0 2 0 0 1 1 0 1 1 0 0 0 0 0 5 0 2 0 0 0 0 1 0 0 1 0 1 0 2 0 0 8 1 1 0 3 4 0 4 0 1 1 0 0 0 0 5 4 0 0 6 0 0 2 1 0 2 0 0 0 1 2 0 0 0 0 0 0 1 2 0 4 0 2 4 0 0 1 0 0 0 1 0 0 1 0 3 14 0 0 4 0 0 3 0 4 1 0 0 1 0 0 0 1 0 2 0 0 1 0 0 5 2 0 0 6 1 0 1 0 0 0 0 0 0 0 1 0 0 5 0 0 0 0 0 0 0 0 0 5 1 0 0 0 0 0 2 0 4 5 0 1 0 0 0 0 4 0 0 0 4 9 3 0 2 6 6 0 2 1 0 5 0 24 4 0 0 0 0 0 0 0 2 0 0 2 0 0 0 0 0 1 0 0 0 7 0 0 1 3 1 1 1 1 7 1 4 8 7 5 5 0 0 4 2 0 0 34 1 0 4 0 0 12 0 0 0 0 2 0 3 2 1 0 0 0 6 0 1 0 0 0 1 1 0 0 0 0 0 2 0 0 0 0 0 1 0 0 0 0 0 0 2 3 0 0 0 6 2 0 1 0 0 0 2 0 11 2 0 0 3 0 3 1 0 0 0 1 0 3 4 0 1 2 0 0 0 0 10 0 0 1 0 0 0 1 0 5 0 0 3 11 0 0 1 2 0 0 0 0 2 0 0 0 0 5 0 0 5 1 0 2 7 0 3 2 0 0 1 0 1 7 0 0 1 3 0 0 0 1 0 0 0 0 0 0 0 2 0 0 0 0 1 1 6 9 0 0 0 0 0 4 0 0 0 2 0 0 0 1 1 4 0 0 0 0 0 6 0 0 0 0 3 0 1 5 0 1 0 0 3 0 0 0 0 0 0 2 0 0 6 2 0 1 0 0 1 5 0 0 1 0 0 1 0 5 0 4 0 3 14 0 0 1 0 3 2 0 0 0 2 1 0 1 0 0 2 3 0 1 0 0 1 0 3 0 0 5 0 0 1 0 2 0 0 0 0 0 0 2 3 0 0 1 3 0 0 1 0 0 0 2 1 1 0 0 1 0 0 4 1 1 0 9 2 0 0 0 0 4 0 1 0 4 10 0 6 1 0 0 0 0 1 15 1 0 0 0 0 0 0 0 5 2 0 2 0 3 1 0 0 0 0 0 8 0 0 0 0 3 0 0 6 3 0 0 0 0 0 3 0 0 0 0 1 0 3 1 0 0 0 0 0 6 0 0 0 0 0 0 5 2 2 0 2 1 0 1 0 1 2 6 0 0 0 0 0 0 12 1 2 0 0 7 0 0 2 0 4 0 0 0 0 0 0 0 0 0 0 7 0 0 2 2 0 2 0 0 0 1 1 1 1 0 0 0 4 0 4 4 0 0 0 1 0 1 5 0 0 14 0 1 0 0 0 4 10 0 0 0 0 0 0 5 0 1 8 0 3 0 0 1 0 SP286 Bacteria;Actinobacteria;Actinobacteria;Propionibacteriales;Propionibacteriaceae;Arachnia;propionica 27 48 88 5 13 17 46 24 87 34 9 92 56 83 43 15 58 95 6 30 9 35 81 9 62 21 66 25 229 361 7 29 209 55 25 12 18 984 28 85 234 523 7 3 1 0 112 68 66 21 9 28 2 10 9 4 28 50 19 56 10 40 15 50 7 186 67 6 182 7 7 10 17 15 11 33 3 22 33 62 8 11 20 19 1 5 8 32 47 1 16 14 70 200 0 13 52 209 21 10 9 128 49 365 124 18 17 97 5 58 6 137 29 22 23 5 12 7 11 16 13 36 3 36 8 9 1 20 5 437 2 42 10 42 7 11 11 17 30 7 60 172 17 77 134 10 33 92 5 28 11 24 59 21 6 15 16 23 27 12 46 133 4 66 43 5 61 16 69 73 1 17 50 107 34 62 41 14 10 270 1 19 76 25 6 15 25 5 19 8 73 94 15 6 5 4 0 2 13 112 68 4 16 8 3 0 42 25 108 68 1 15 35 21 33 10 99 71 16 23 20 14 19 114 8 31 11 29 60 10 31 19 105 14 4 3 25 24 6 31 1 2 1 39 65 27 19 1 3 13 4 7 9 39 4 21 219 28 12 17 56 0 33 9 15 8 10 46 0 2 43 0 2 0 0 0 5 0 5 0 0 1 0 7 4 0 0 0 0 4 6 2 1 0 7 1 2 10 0 1 2 0 4 6 1 0 1 0 5 0 1 1 0 0 2 2 0 4 0 0 0 0 0 0 0 0 0 0 0 0 0 0 0 0 0 0 0 0 0 0 0 0 0 15 0 17 0 0 0 0 0 0 0 2 11 0 0 0 0 0 0 0 0 1 0 0 0 0 1 0 1 0 0 4 0 0 0 0 0 4 0 0 0 0 0 1 0 1 0 0 3 1 0 2 0 1 3 0 0 1 0 0 5 0 0 0 0 1 0 0 2 4 0 2 8 0 2 0 2 0 2 0 0 1 0 0 3 0 0 0 0 3 5 0 0 0 0 0 0 0 0 1 5 0 14 6 0 0 1 4 1 0 1 0 0 0 0 2 0 1 0 0 0 1 2 0 0 1 6 0 0 2 0 6 2 0 0 4 0 0 0 0 0 1 19 7 4 16 0 0 0 0 0 1 2 0 4 5 0 0 0 0 0 0 0 0 0 0 0 0 1 0 0 0 0 0 0 0 0 0 0 0 0 0 0 2 0 0 0 0 0 6 5 0 4 0 1 0 0 4 0 2 8 0 0 0 0 5 0 0 0 0 0 0 1 0 0 0 0 0 0 0 0 2 1 1 0 0 0 0 0 0 0 0 0 0 8 0 1 0 0 0 1 0 0 2 2 0 0 0 3 0 0 1 0 0 0 5 0 0 0 5 0 3 1 1 0 0 0 2 1 1 8 0 0 0 0 0 0 0 0 3 0 0 0 0 0 0 1 1 0 13 4 0 3 1 0 0 0 4 0 2 1 13 1 0 0 22 2 0 0 0 0 0 0 0 0 0 0 1 0 0 4 0 0 0 0 0 3 3 0 3 0 0 0 0 2 0 0 0 0 9 5 0 0 1 1 0 1 0 3 0 0 0 5 0 0 0 0 0 4 0 6 0 0 0 0 0 0 0 0 0 0 0 0 0 2 0 0 0 0 1 3 0 0 5 3 6 2 0 3 2 0 0 0 0 0 7 2 0 0 0 0 5 6 0 0 4 13 0 3 0 1 0 2 9 4 10 0 1 0 1 0 1 3 0 5 5 0 1 6 0 4 5 0 0 0 0 4 2 0 1 0 1 0 0 0 0 0 0 0 5 0 0 0 0 2 0 0 0 0 0 0 0 0 0 0 0 0 0 2 0 0 0 0 7 0 1 5 0 1 0 0 0 0 0 0 0 1 0 0 18 0 0 1 12 0 3 0 0 7 0 0 0 0 0 0 0 0 0 0 0 0 0 7 0 7 10 0 0 0 0 34 0 0 0 0 2 0 2 8 1 0 0 0 0 29 0 1 0 1 0 0 0 2 0 0 0 8 6 0 1 0 20 2 0 0 0 0 0 0 0 0 0 0 0 0 4 27 0 4 0 0 0 0 0 0 0 4 0 0 3 0 3 2 0 0 2 6 0 9 0 0 2 0 1 0 4 2 2 6 1 3 0 0 4 2 0 0 30 1 0 4 10 0 0 1 3 0 0 1 8 0 7 0 1 0 1 10 0 0 0 0 2 2 0 1 0 1 0 0 0 3 0 0 7 0 1 0 7 7 0 1 4 0 0 3 0 0 0 0 0 2 0 0 0 0 0 0 0 0 0 0 0 7 0 0 0 0 0 1 0 1 0 0 0 0 0 0 0 0 0 0 1 0 0 1 0 0 0 0 0 0 1 0 0 0 0 0 0 0 0 0 0 0 0 1 0 0 0 1 0 0 0 0 0 1 0 0 0 0 0 0 0 1 0 1 0 0 0 0 21 0 0 0 1 0 0 0 0 0 0 1 0 0 0 0 1 0 1 0 0 0 0 0 1 0 0 0 0 0 0 0 0 0 0 0 0 0 0 0 0 0 0 0 0 0 1 0 0 0 0 0 0 0 0 0 0 0 0 0 0 0 0 0 0 0 0 0 0 0 0 0 0 0 0 0 0 0 0 0 0 0 0 0 0 0 0 0 1 0 0 0 0 0 0 0 0 0 0 0 1 0 0 0 0 0 0 0 1 0 0 0 1 0 0 0 0 0 1 1 0 0 0 0 0 0 0 0 0 0 1 0 0 0 0 0 0 0 0 0 0 0 0 0 0 0 0 0 1 0 0 0 0 1 0 0 0 0 0 0 1 0 0 0 0 0 0 0 0 0 0 0 0 0 0 0 0 0 0 0 0 0 0 0 0 0 0 0 0 0 0 0 0 0 0 1 0 0 0 0 0 0 0 0 0 3 0 0 0 0 0 0 0 0 0 0 0 0 0 0 0 0 1 0 0 0 0 0 2 1 0 0 0 1 0 0 0 0 0 0 0 1 0 0 0 0 0 0 3 0 0 2 1 0 2 1 0 0 0 0 0 1 3 0 0 0 0 0 0 0 0 0 2 0 0 1 0 0 0 1 0 0 0 0 0 0 0 0 0 1 0 0 0 0 0 0 1 0 0 0 0 0 0 0 0 0 0 0 0 0 0 0 0 0 1 0 0 0 0 0 0 0 2 0 0 0 1 0 0 0 0 0 0 0 1 0 0 0 0 1 0 0 0 0 0 0 0 3 0 3 10 0 0 1 0 0 0 0 0 0 0 0 0 0 0 0 0 0 0 0 0 0 0 0 0 0 0 0 0 0 0 3 3 0 0 0 0 0 0 0 0 0 0 0 0 0 0 0 1 0 0 0 3 0 0 0 0 0 5 0 0 3 0 0 0 1 0 0 0 0 0 2 0 1 0 0 0 0 0 0 0 1 0 0 0 0 0 0 0 0 0 0 0 0 0 0 0 0 1 1 0 0 0 0 0 1 0 0 0 0 0 0 0 0 1 0 0 0 1 0 0 0 2 0 0 0 0 0 0 1 0 0 0 0 0 0 0 0 0 10 1 0 0 0 0 0 1 0 0 0 0 0 0 0 0 0 0 2 0 0 1 0 0 0 0 0 0 0 0 0 0 0 0 0 0 0 1 2 0 0 0 0 0 0 0 0 0 0 0 0 0 0 0 0 0 0 0 0 0 0 0 0 1 1 0 0 1 2 0 0 0 0 0 0 0 0 0 0 0 0 0 0 0 0 0 0 0 0 0 0 0 0 0 2 0 0 1 0 0 0 0 0 0 0 0 0 1 1 0 0 0 0 1 0 0 0 0 0 0 0 0 3 0 0 0 0 0 0 0 0 0 0 1 0 0 0 0 0 0 0 0 0 0 0 0 1 0 0 0 0 0 0 0 0 0 1 1 0 0 0 1 2 0 0 0 2 0 0 0 0 0 1 0 0 0 0 0 0 0 0 0 0 0 6 2 0 0 1 2 0 0 0 0 0 0 0 0 0 0 0 0 1 0 0 0 1 0 0 1 0 0 0 0 0 0 1 1 0 1 0 0 0 0 0 0 0 0 0 0 1 0 0 0 0 0 0 0 0 1 1 0 0 0 0 0 0 0 0 0 1 0 0 0 SP287 Bacteria;Firmicutes;Clostridia;Clostridiales;Lachnospiraceae_[XIV];Oribacterium;asaccharolyticum 0 6 0 2 1 0 0 18 0 0 43 0 5 0 0 40 0 0 68 43 40 0 0 13 3 16 0 0 5 0 12 2 0 4 7 15 64 0 8 1 12 0 0 34 3 0 0 16 0 0 171 113 31 0 25 0 41 12 2 21 0 0 0 1 1 0 0 76 7 64 11 29 0 0 0 0 2 10 2 7 0 0 2 0 38 70 21 1 3 126 0 0 1 0 0 30 0 0 0 5 1 0 0 0 0 0 61 5 1 1 4 0 16 0 21 3 3 49 168 0 1 0 7 16 41 57 32 57 64 0 9 30 3 1 0 0 501 38 2 0 0 0 0 2 0 50 43 21 51 0 133 0 9 5 0 8 159 0 10 16 0 0 12 0 0 192 0 22 0 8 0 0 0 1 215 46 1 6 0 8 0 0 1 121 587 34 0 0 0 46 0 4 7 24 16 6 19 33 9 1 0 18 46 0 1 208 0 0 0 0 0 0 6 9 4 5 0 254 0 2 0 9 0 5 158 23 177 0 0 96 29 0 2 0 0 0 56 45 178 1 10 0 276 1 0 65 21 0 66 0 47 0 0 6 0 0 1 12 0 0 4 101 2 10 21 44 116 37 0 0 0 0 0 0 0 0 0 0 0 0 0 0 0 0 0 0 0 0 0 0 3 0 0 0 0 0 0 0 0 1 0 0 2 0 0 0 0 0 0 0 0 0 0 0 0 0 0 0 0 0 0 0 0 0 0 0 0 0 0 0 0 0 0 0 0 0 0 0 0 0 0 0 0 0 0 0 0 0 0 0 0 0 0 0 0 0 0 0 0 0 0 0 0 0 0 0 0 0 0 0 0 0 0 0 0 0 0 0 0 0 0 0 0 0 0 0 0 0 0 0 0 0 0 0 2 0 0 0 0 0 2 0 0 1 0 0 0 0 0 0 0 0 0 0 0 0 0 0 0 0 0 0 0 0 0 0 0 0 0 0 0 0 0 0 0 0 0 0 0 0 0 0 0 1 0 0 0 0 0 0 0 0 0 0 0 0 0 0 0 0 0 0 0 1 1 0 0 0 0 0 0 1 1 0 0 0 0 0 0 0 0 0 4 0 0 0 1 0 0 0 0 0 0 0 0 0 0 0 1 0 0 0 0 0 0 0 0 0 0 0 0 0 0 0 0 0 0 0 0 0 0 0 0 0 0 0 0 0 0 0 0 0 0 0 0 0 0 0 0 1 0 0 0 0 0 0 0 20 0 0 3 0 0 0 0 0 1 0 0 2 0 1 0 0 6 2 0 0 0 0 0 0 0 0 0 0 0 0 0 0 0 0 0 0 0 0 0 0 0 0 0 0 0 0 0 0 0 0 0 0 0 1 0 0 0 0 0 0 0 0 0 0 0 0 1 0 0 0 0 0 0 0 0 0 0 0 0 0 0 0 0 0 0 0 0 1 0 0 0 0 0 0 0 0 0 0 0 0 0 0 0 0 0 0 0 0 0 0 0 0 0 0 0 0 0 0 1 0 0 0 0 0 0 0 0 0 1 0 0 0 0 0 0 0 0 0 0 0 0 0 0 1 1 1 0 0 0 0 0 0 0 0 0 0 0 0 0 0 0 1 2 0 0 0 0 0 0 0 0 0 0 0 0 0 0 0 0 1 0 0 0 0 0 0 0 1 0 0 0 0 0 1 0 0 0 0 0 0 0 0 0 0 0 0 0 0 0 0 0 0 0 0 0 0 0 0 0 0 0 0 0 0 0 0 0 0 0 0 0 0 0 0 0 0 0 0 0 0 0 0 1 0 0 0 0 0 0 0 1 0 0 0 0 0 0 0 0 0 1 0 0 0 0 0 0 0 0 0 0 0 0 0 0 0 0 0 0 0 0 0 0 0 0 0 0 1 0 0 0 0 0 0 0 0 0 0 0 0 0 0 0 0 0 0 0 0 0 0 0 0 0 0 0 2 0 0 0 0 0 0 0 0 0 0 0 0 1 0 0 1 0 0 0 1 0 0 0 0 0 0 0 0 0 0 0 0 0 0 0 0 0 0 0 0 0 0 1 0 0 0 0 0 0 0 0 0 0 0 0 0 0 0 0 0 0 0 0 0 0 0 0 0 0 0 0 0 0 1 0 0 0 0 0 0 0 0 0 0 0 0 0 0 0 0 0 0 0 0 0 0 0 0 0 0 0 0 0 0 0 0 0 0 0 0 0 0 0 0 3 0 0 0 0 0 0 0 0 0 0 0 0 0 0 0 0 0 0 0 0 0 1 0 0 0 1 0 0 0 0 0 0 0 0 0 0 0 0 0 0 1 0 0 0 0 0 0 1 0 0 0 0 1 1 2 0 7 0 0 0 0 1 0 2 1 0 0 3 5 0 1 3 0 1 7 5 3 4 1 0 0 0 0 10 0 1 0 0 0 1 0 12 0 0 3 1 0 0 0 2 0 3 0 1 0 1 6 0 0 1 0 0 0 1 1 0 0 0 0 3 0 0 0 0 1 0 0 1 0 2 0 0 2 1 5 0 0 1 3 1 1 0 0 7 0 0 3 2 1 0 1 4 2 0 0 0 0 6 0 0 0 13 0 1 4 0 2 0 0 0 0 0 0 0 4 19 2 0 0 1 1 9 3 0 3 9 1 0 1 0 0 0 0 0 0 0 0 1 0 0 0 0 0 0 0 0 0 0 0 0 1 0 0 1 0 1 0 1 2 1 1 0 0 0 0 0 0 0 1 0 0 3 0 0 0 0 2 1 2 0 1 1 1 0 1 12 1 6 0 0 0 0 2 2 0 4 2 0 0 0 0 0 0 2 0 1 0 0 0 0 1 0 0 1 0 1 0 0 0 0 0 0 0 0 0 0 1 0 0 0 0 0 0 0 0 0 0 1 0 0 0 0 1 1 0 0 1 0 0 0 0 3 0 1 0 0 1 1 0 0 0 0 1 1 0 0 0 0 0 0 0 0 0 0 1 2 2 0 1 0 0 5 11 0 0 0 0 4 4 0 12 3 0 0 0 0 0 0 3 0 1 0 1 1 5 0 0 0 0 0 2 0 3 0 0 0 0 2 0 0 0 0 2 0 0 0 1 23 0 0 0 0 1 0 1 0 2 1 0 0 9 0 15 1 0 0 1 0 1 0 1 0 2 1 0 0 2 0 0 0 0 1 3 9 0 0 0 1 2 0 0 0 0 0 2 3 0 0 0 0 0 1 0 0 0 0 2 5 27 1 0 0 0 0 76 0 0 0 0 0 0 1 1 2 4 0 0 0 24 1 0 0 1 0 1 2 7 0 1 2 0 0 2 0 3 4 0 0 4 2 1 0 0 0 0 0 0 1 0 0 3 3 0 0 0 0 2 0 0 5 0 0 1 1 0 1 0 0 0 1 0 0 0 0 0 0 1 0 15 1 2 0 2 6 0 0 0 3 0 1 0 0 0 2 0 0 7 8 0 0 2 1 0 0 6 0 1 0 0 6 3 0 0 0 0 1 1 6 1 0 0 0 0 0 0 1 0 0 0 0 1 0 0 0 0 0 0 1 0 0 0 0 0 0 1 0 0 3 0 2 0 5 0 0 0 0 2 0 0 0 0 0 0 0 0 0 1 0 0 0 2 0 0 0 0 0 1 0 0 0 0 0 0 0 3 0 1 1 1 0 0 0 2 0 2 0 0 0 0 0 0 0 1 0 0 0 2 1 2 0 0 1 0 5 0 3 1 6 1 0 0 1 2 0 3 0 0 0 0 0 0 0 5 4 0 2 1 1 1 3 1 3 0 1 0 0 0 0 0 0 4 0 0 1 0 0 0 9 0 0 0 0 0 0 0 1 1 9 5 0 0 0 0 0 1 0 0 1 1 0 0 4 3 1 1 2 0 0 1 0 0 1 1 0 0 0 0 1 3 2 14 1 0 0 0 35 1 0 6 5 2 0 6 0 0 0 0 0 0 4 1 0 0 0 0 0 2 0 0 0 0 0 0 0 2 1 1 0 0 0 0 7 0 0 0 0 0 0 0 0 0 0 0 0 0 1 0 0 0 0 1 0 0 6 8 0 0 0 1 0 0 0 2 0 2 1 0 0 1 3 0 0 0 23 2 0 0 0 0 3 0 3 1 0 0 SP289 Bacteria;Firmicutes;Clostridia;Clostridiales;Peptostreptococcaceae_[XI];Peptostreptococcus;stomatis 248 91 12 42 6 981 2 4220 7 0 1496 39 146 486 96 854 175 25 3139 2886 0 5 187 2 1435 1459 2 263 0 2 3497 1150 823 918 1734 340 0 6 20 10 3742 68 1884 177 13 827 0 0 5 178 33 0 0 32 2432 362 60 270 9 1880 12 6 281 11 2324 26 10 5070 237 3671 4 796 403 0 0 1117 981 891 24 69 2143 1099 150 255 1948 948 300 156 71 249 659 172 12 268 31 746 0 1200 32 0 68 4 0 461 11 114 729 23 3622 34 1 66 16 1779 861 75 2659 2205 3303 2178 86 5343 1078 1594 1804 986 354 2347 1427 1 4785 2955 61 23 1296 383 2374 192 224 2126 4 1 5 94 2 160 3947 2920 902 133 201 2121 92 160 14 1035 3573 15 1061 806 287 50 225 8 91 55 58 685 69 8 7 13 336 235 7 459 1353 1418 68 25 1 26 361 2272 428 1142 2051 617 237 1923 1607 994 1543 1274 1137 25 23 884 252 139 2 1443 1471 2995 643 211 7 2 5 0 540 789 516 288 254 1500 16 2317 0 2517 16 8 79 142 1144 1216 2679 108 0 709 1223 0 202 1 571 3267 1158 238 2563 48 54 1519 2221 7 16 650 756 150 2431 1 1889 130 414 295 373 123 2602 565 0 341 18 60 601 218 255 120 688 0 0 0 0 0 0 0 0 0 2 0 0 0 0 0 0 0 1 0 1 1 0 0 6 0 0 0 1 0 0 0 0 0 1 0 15 0 0 0 0 0 0 0 0 0 0 0 0 0 0 0 0 0 0 0 0 0 0 0 0 0 0 0 0 0 0 1 0 0 0 0 0 0 0 0 0 0 0 0 0 0 0 0 0 0 0 0 0 0 0 0 0 0 0 0 0 0 0 0 0 0 0 0 0 0 0 0 1 0 0 0 0 0 0 0 0 0 0 0 0 12 0 0 0 0 0 0 0 0 0 0 0 0 0 1 0 0 0 0 0 2 0 0 1 0 0 2 0 0 0 0 1 0 1 0 0 0 0 0 1 0 0 1 0 0 1 1 0 0 0 0 0 0 0 1 0 0 0 0 0 1 0 0 0 0 0 0 0 0 0 0 0 0 0 0 0 0 0 0 0 0 0 0 0 0 1 0 1 0 0 1 0 0 0 0 0 0 0 0 0 0 0 0 0 0 0 0 0 0 0 0 0 6 10 0 0 0 0 0 0 0 0 0 16 0 0 0 1 0 0 0 0 0 0 0 0 0 0 0 0 0 0 6 0 0 0 0 0 0 0 0 0 1 0 0 0 0 0 0 0 4 0 0 0 1 0 0 0 0 0 0 0 0 0 0 0 0 3 0 0 0 0 0 0 0 0 1 0 0 0 0 0 0 0 0 0 0 0 0 0 0 0 2 0 0 0 0 0 5 0 0 0 0 0 7 0 2 0 0 0 0 0 0 2 0 0 0 0 0 0 0 1 0 0 0 0 0 0 0 0 1 0 0 0 0 0 0 1 0 0 0 0 0 0 2 0 0 0 0 0 0 0 0 0 0 0 2 0 1 0 0 0 1 1 2 0 0 0 1 1 0 0 1 0 0 0 0 0 0 0 0 0 0 0 0 0 0 0 1 0 0 0 0 0 2 0 0 0 0 0 0 0 0 0 0 0 0 0 0 0 0 0 0 0 0 0 0 0 0 0 0 0 0 0 0 0 0 0 1 0 6 0 0 0 0 0 0 0 0 0 0 3 0 0 0 0 0 0 0 0 2 4 0 0 0 0 0 0 0 0 0 0 0 0 0 0 0 1 0 0 0 0 0 0 0 0 0 0 0 0 0 0 0 0 0 0 1 0 0 0 0 0 0 4 0 0 0 0 0 1 0 0 0 0 0 1 0 3 0 2 0 0 0 0 0 0 1 0 0 0 0 0 5 0 0 0 0 1 0 0 0 0 0 42 0 0 0 0 0 0 1 0 1 0 0 0 0 0 0 1 0 0 0 0 0 1 0 0 0 0 0 0 0 0 0 0 3 0 0 1 0 0 0 0 0 0 5 0 0 32 0 0 3 0 2 0 0 0 0 1 0 0 0 0 0 0 0 0 0 0 0 0 0 1 0 0 0 0 0 0 0 0 0 0 0 0 0 0 0 0 0 0 0 0 0 0 1 0 0 0 0 0 0 0 0 0 0 0 0 0 0 0 0 0 0 0 0 0 0 1 0 0 0 0 0 0 0 0 12 1 0 1 0 2 0 0 0 0 0 0 0 0 0 0 0 0 0 0 0 3 0 0 0 0 0 0 0 0 3 0 5 0 0 0 0 0 1 0 0 0 0 1 0 0 0 1 0 1 0 0 0 5 0 1 0 0 1 3 2 0 0 0 3 1 0 0 0 0 0 0 0 0 0 0 0 0 3 0 0 0 1 0 0 0 0 0 2 0 0 1 0 0 0 0 0 0 0 0 0 5 0 0 0 0 0 0 0 1 2 0 1 0 0 0 0 2 1 0 0 0 2 3 0 2 0 1 0 0 6 1 0 0 0 0 4 0 0 0 0 0 0 3 0 0 0 0 0 0 0 0 0 1 0 0 2 0 0 0 0 5 1 0 2 0 0 20 0 0 0 1 2 0 0 0 7 0 0 0 0 0 0 0 0 71 0 0 5 0 0 0 2 0 0 1 0 0 0 44 2 1 0 1 0 0 1 0 1 1 0 2 5 0 0 0 15 1 0 0 0 0 0 0 0 0 0 1 1 1 0 1 1 0 1 0 0 1 1 0 0 1 7 1 0 3 2 0 0 0 2 1 0 0 0 5 0 0 0 0 0 0 0 0 0 0 0 1 1 0 0 4 4 2 0 0 0 0 0 2 1 0 0 0 5 0 0 1 0 0 2 4 0 0 0 0 7 0 0 0 0 0 0 0 0 0 0 1 0 1 1 5 7 3 2 0 0 1 0 0 0 0 0 0 4 0 1 0 0 1 0 8 4 6 0 1 0 0 21 0 0 16 0 0 0 1 6 0 1 0 1 0 2 0 1 0 0 0 4 2 0 2 0 0 1 0 11 0 0 1 0 2 0 0 0 0 0 0 3 0 0 0 0 1 0 1 0 0 0 0 1 0 0 0 1 2 5 0 0 0 0 3 0 0 0 0 1 1 1 0 0 21 0 0 0 0 0 0 0 23 2 1 0 0 1 0 1 1 3 0 4 0 1 1 0 0 1 1 1 0 0 0 0 1 0 6 3 0 16 0 0 1 2 1 0 0 1 0 2 0 0 0 0 0 0 1 0 1 0 0 0 0 3 0 0 132 0 0 2 0 0 0 4 0 2 0 0 0 5 1 3 0 0 1 0 0 0 0 0 0 1 3 9 2 0 0 15 0 0 5 0 0 0 0 0 0 0 0 0 5 0 0 0 0 0 1 0 0 1 0 3 0 0 25 0 0 0 2 1 4 0 0 2 3 0 0 18 0 3 0 204 0 13 0 1 1 0 0 0 0 12 5 0 0 1 0 0 0 0 1 1 0 0 0 0 0 0 0 0 0 4 0 0 1 0 0 0 0 5 1 0 0 0 1 0 0 4 0 0 1 2 0 0 0 2 0 0 0 0 0 0 0 0 0 0 0 2 0 1 3 0 1 0 0 0 1 0 6 0 1 0 0 0 0 0 0 0 0 0 0 0 0 0 0 0 1 0 0 0 0 0 0 1 1 0 0 1 0 3 0 0 0 0 0 0 1 5 1 0 0 0 0 0 0 0 0 0 0 0 1 3 3 0 1 1 0 0 14 0 1 4 0 14 4 0 6 1 0 6 0 0 1 1 0 0 0 13 0 0 0 0 0 0 10 1 2 0 0 2 0 0 0 0 0 10 10 1 3 1 0 0 2 0 0 0 0 1 0 1 0 4 0 7 0 1 0 1 0 0 0 1 0 0 1 0 4 0 2 0 1 0 0 0 0 0 4 2 0 0 0 0 0 0 1 12 0 16 1 0 5 0 0 8 4 16 0 2 0 0 0 0 0 2 0 0 2 0 1 0 0 1 1 0 1 1 0 0 0 2 0 2 0 0 0 0 0 0 1 0 31 0 0 0 0 0 0 0 1 0 0 0 0 0 0 0 0 0 0 6 0 0 14 2 0 0 0 12 0 0 1 0 3 0 9 0 0 1 37 0 0 0 0 0 0 0 0 0 0 0 SP3 Bacteria;Bacteroidetes;Flavobacteriia;Flavobacteriales;Flavobacteriaceae;Capnocytophaga;gingivalis 7 129 6 0 1 108 9 135 1 43 3 9 38 6 19 1 23 95 651 154 0 0 0 74 10 1 10 0 327 132 5 84 99 0 30 21 9 3 17 45 314 4 141 10 31 332 64 2 1 47 3 0 3 2 63 80 6 46 12 47 26 27 6 56 1745 34 40 82 158 951 71 11 321 1 1 205 101 82 14 14 2223 0 9 113 30 132 63 29 2 29 58 0 221 235 1 53 762 44 4 3 0 1 27 319 2 8 112 23 656 52 0 4 5 139 48 172 19 17 36 16 4 18 8 67 5 2 18 0 4 19 198 1461 2 46 6 131 70 11 11 531 13 20 206 77 158 149 12 21 58 5 20 19 68 21 1 30 162 3 1 5 24 19 2 15 88 17 11 50 37 1 18 0 15 2 15 0 13 10 6 59 1 1 62 24 21 84 208 21 105 16 4 79 111 84 1 0 0 345 65 59 343 12 3 33 111 4 3 0 130 353 6 1 3 2 17 64 2 4 0 73 171 6 0 57 9 12 186 225 237 18 3 11 9 3 5 1765 6 10 93 42 104 240 62 140 2 12 5 26 711 2 9 54 12 52 0 26 47 5 0 35 23 13 10 5 6 1 4 8 0 81 8 0 54 0 2 0 1 58 105 96 86 111 0 24 50 0 4 7 4 96 3 0 49 1 160 144 46 39 0 58 36 1 26 45 723 15 7 0 74 5 52 81 3 3 19 33 582 317 40 261 4 7 76 0 25 0 0 0 18 0 0 10 3 0 7 0 1 4 15 80 1 90 0 2 43 4 27 1 85 432 36 51 13 5 25 0 1 93 75 0 0 57 332 17 8 1 0 12 4 0 170 1 16 77 78 38 1 104 0 32 3 0 70 92 54 3 235 28 0 0 0 20 1 54 110 9 47 0 18 106 159 211 2 24 69 0 0 50 25 0 55 33 0 179 12 230 25 0 110 0 5 7 29 1 0 19 24 70 26 28 6 24 161 29 11 200 13 0 41 2 13 6 16 0 17 24 0 0 68 22 1 51 41 2362 0 39 2 5 0 5 8 675 1 33 2 19 1 33 1 106 0 110 683 390 108 142 3 2 146 71 162 35 1 0 14 7 64 80 103 119 95 51 133 81 60 379 53 135 0 69 15 11 0 6 65 27 2 18 1 1 1 12 105 6 1 2 0 86 621 9 0 36 21 4 48 39 345 52 1 303 421 1 0 0 45 0 8 138 1 2 54 27 7 254 122 167 12 11 1106 382 21 19 4 40 153 279 5 92 0 15 28 14 14 17 7 17 0 1 0 24 5 0 2 10 49 72 7 0 4 0 0 53 3 2 1 4 21 6 162 3 0 0 19 163 198 11 0 9 0 698 0 3 0 6 31 2 535 0 230 24 150 25 94 41 27 1 21 586 15 629 106 7 2 1142 0 97 81 11 194 268 53 10 20 706 16 124 15 802 14 3 3 114 22 36 24 309 0 39 0 189 6 0 1 123 18 3 11 0 517 31 60 70 23 27 89 29 12 0 10 46 52 26 0 12 42 51 6 0 3 0 0 6 81 0 0 22 13 25 51 8 160 1 1 12 1 42 0 0 0 5 8 0 7 3 0 0 3 42 4 222 6 92 6 31 0 4 225 1071 158 4 79 46 0 4 0 2 170 80 69 122 10 29 49 11 35 24 20 23 35 24 2 53 59 17 384 0 188 175 37 63 64 34 52 3 63 10 31 23 0 67 312 27 5 155 276 40 118 241 24 22 43 31 22 88 1051 9 46 0 7 12 34 199 0 27 4 30 6 3 85 27 3 19 2 9 12 29 9 0 0 3 37 27 8 0 0 4 72 40 19 8 220 0 38 0 14 20 0 0 1 19 2 1 82 46 0 0 6 67 120 3 0 38 65 0 9 10 0 1 4 28 74 2 19 0 77 46 319 17 1 1 4 186 3 0 85 8 122 34 15 15 80 0 46 51 6 17 0 24 81 39 0 41 56 2 12 2 126 1 23 35 76 5 104 16 76 104 0 15 416 33 3 0 0 22 1 0 62 0 20 72 14 0 1 0 345 9 9 143 20 103 118 60 0 190 95 189 0 42 61 1237 0 0 0 113 257 0 1579 110 26 176 265 92 30 50 1 7 8 59 159 36 56 0 131 64 1 22 49 7 68 59 11 2 22 50 0 150 24 1 33 4 132 2 0 27 1 9 1 36 33 0 62 258 220 11 45 96 96 28 291 186 2 16 14 92 13 22 1 43 6 32 17 1 15 34 1 60 71 0 7 2 2 21 18 0 0 3 0 30 0 1 0 23 0 13 2 0 21 0 9 62 0 2 78 253 19 1 49 73 26 1 40 16 0 29 26 9 23 21 3 0 10 27 11 456 10 2 16 5 5 50 25 39 0 0 0 0 3 5 0 1 8 9 289 0 31 3 0 2 16 0 6 7 8 3 15 48 5 1 0 0 0 0 48 0 11 62 13 7 13 12 0 0 2 10 0 1 88 32 2 2 0 0 2 24 12 3 4 0 2 1 7 3 0 3 0 28 2 2 1 24 22 3 16 7 44 0 5 17 1 60 19 0 0 259 20 0 8 87 0 0 6 0 0 9 17 1 0 21 51 0 96 2 2 2 8 0 4 2 5 25 0 4 27 5 12 3 25 19 3 41 0 14 22 114 0 0 0 9 0 3 0 3 14 66 0 49 32 3 0 4 6 2 65 8 25 0 53 130 1 79 71 1 1 13 3 0 0 57 34 0 16 33 0 10 3 0 0 26 27 1 0 47 23 0 1 20 0 5 2 69 6 19 77 0 41 23 0 0 4 0 0 6 0 0 1 4 0 95 20 12 0 15 0 41 41 8 31 3 0 74 17 4 14 7 81 0 45 11 0 35 20 0 7 6 11 0 29 8 0 31 20 0 15 12 5 0 14 1 1 10 43 80 0 16 2 0 5 1 0 8 284 12 0 38 1 2 6 1 0 89 433 0 0 4 8 2 3 0 4 19 0 2 0 51 0 20 5 0 0 37 3 0 53 22 179 9 35 0 2 47 5 0 27 3 24 19 27 0 0 6 0 0 3 21 21 0 50 2 0 31 53 17 3 3 21 376 29 34 32 26 0 84 7 1 135 106 2 16 11 93 17 28 0 12 8 10 0 0 4 39 0 136 197 25 27 0 0 34 9 1 2 0 0 38 1 0 1 2 1 0 3 5 16 1 26 44 4 19 0 0 15 11 1 9 14 0 0 4 1 44 6 0 1 1 5 40 11 98 31 1 13 70 2 6 8 1 1 1 3 3 1 1 0 8 22 11 5 2 3 19 11 3 6 21 6 8 33 0 120 20 0 2 9 8 0 1 0 0 1 9 10 37 12 1 0 30 102 10 11 0 0 0 25 69 9 6 1 0 64 10 0 2 5 5 26 1 14 0 0 5 9 47 4 0 0 9 1 0 1 7 2 0 2 1 1 12 39 0 1 7 2 0 20 6 2 14 7 0 4 0 29 38 19 0 1 2 0 0 42 10 0 13 19 86 0 7 44 2 28 3 0 1 3 0 1 23 8 1 110 0 69 584 34 137 59 27 1 54 85 0 0 3 1 3 17 0 24 107 66 0 89 119 0 43 19 1 42 16 0 0 43 30 1 1 7 16 0 68 20 0 9 1 0 7 114 11 0 1 14 0 1 2 0 31 26 6 0 17 29 1 1 27 1 8 49 12 0 6 72 0 0 7 52 4 104 14 0 0 8 0 10 3 0 0 20 3 1 9 6 0 36 5 25 10 115 167 0 104 20 3 0 9 1 0 1 0 0 7 2 1 43 0 3 99 4 0 5 6 24 3 28 6 110 59 5 83 0 33 37 15 37 3 3 23 5 58 4 1 0 0 37 1 4 0 6 13 21 44 15 0 15 9 0 0 48 0 4 2 8 0 1 16 53 25 7 1 1 1 95 61 7 14 12 4 0 0 0 0 0 6 0 12 30 1 111 8 5 19 8 120 0 0 0 29 74 56 32 2 0 4 26 1 44 30 19 0 26 14 0 6 12 0 53 12 15 0 51 178 5 38 27 3 5 1 1 0 4 35 0 0 219 3 0 9 2 31 0 0 1 2 19 110 0 20 7 0 8 0 0 4 1 5 4 0 SP30 Bacteria;Firmicutes;Clostridia;Eubacteriales;Lachnospiraceae;Lachnospiraceae_[G-3];bacterium HMT100 0 3 15 0 10 27 0 7 12 8 0 21 73 9 99 0 1 5 29 29 1 1 0 1 2 5 14 6 0 115 115 0 452 8 0 0 2 1 4 1 2 3 1 2 1 0 1 4 0 22 1 6 0 7 2 0 1 0 1 6 2 0 0 0 65 9 7 2 54 1202 2 2 0 0 0 19 0 11 0 2 4 0 2 4 2 13 4 4 2 7 29 0 4 108 5 12 24 89 4 0 17 24 0 3 84 2 0 20 358 25 0 23 0 8 0 0 0 4 1 0 3 2 2 2 0 0 0 2 8 50 0 58 5 2 0 51 1115 4 12 439 1 3 84 6 11 5 7 11 5 149 0 69 27 4 0 37 86 1 7 7 71 32 0 3 2 1 11 22 32 0 0 0 75 12 2 2 19 13 1 9 0 0 321 1 0 28 200 4 0 1 0 20 2 5 4 3 1 0 0 39 40 8 27 2 0 0 9 13 2 0 1 0 5 1 1 10 2 0 0 0 18 3 4 18 0 9 456 12 1 11 10 8 19 4 5 116 4 0 0 23 4 2 3 21 6 4 0 0 60 7 1 78 29 8 0 0 0 0 0 0 1 0 0 5 0 0 0 0 0 50 0 0 0 0 7 0 10 9 23 0 30 10 0 15 4 0 0 1 7 3 13 0 8 1 32 0 17 40 0 4 0 12 28 8 1 0 2 0 9 0 19 1 0 0 0 1 0 7 0 0 1 0 2 0 0 0 1 0 0 0 0 0 2 0 0 0 0 0 0 0 0 0 0 7 0 0 0 3 0 0 0 0 1 1 0 0 0 0 0 0 3 2 0 6 0 7 0 0 21 0 3 0 0 10 1 0 0 0 0 2 0 0 29 3 0 0 14 0 0 0 0 0 0 43 3 10 15 0 3 26 0 0 0 14 74 0 0 14 0 0 0 43 0 28 0 0 1 0 2 0 0 0 0 1 0 5 0 0 0 0 0 21 31 52 0 16 20 0 0 0 1 0 0 0 21 0 3 0 61 14 27 0 3 0 0 0 0 0 0 46 8 0 0 1 0 3 0 28 1 0 4 5 0 205 0 0 18 0 2 11 7 0 0 0 13 7 104 83 4 36 1 0 0 125 107 0 0 0 0 11 14 0 0 0 1 0 0 0 0 0 2 7 0 0 0 0 0 1 2 0 0 1 0 0 11 2 0 5 0 1 0 4 6 0 5 0 5 11 0 15 0 8 34 0 3 0 23 3 6 0 33 0 0 0 0 0 0 2 0 54 0 2 20 20 10 6 0 0 0 2 0 0 0 2 5 1 13 2 1 0 0 2 1 0 0 19 35 0 1 0 1 0 0 3 10 29 0 3 0 0 0 25 0 52 1 0 0 0 3 11 19 8 5 0 0 0 25 0 0 0 0 0 0 0 38 13 1 0 0 15 11 7 0 38 78 15 0 0 3 5 0 39 21 119 12 0 0 6 0 0 0 0 0 7 5 1 5 0 0 3 0 132 29 1 0 4 5 0 9 1 0 0 0 17 0 0 0 0 1 0 0 7 27 0 0 9 14 1 2 8 21 0 1 0 7 45 0 0 0 0 6 0 1 0 0 0 1 0 0 12 1 0 42 11 0 0 0 0 3 0 0 1 14 3 0 2 30 50 5 1 4 0 0 3 0 7 5 4 66 5 9 13 42 0 3 0 0 9 45 0 6 0 40 0 3 40 1 19 0 68 9 17 61 2 0 0 20 8 0 8 11 8 35 10 0 2 6 0 38 13 0 0 0 7 0 0 0 8 1 0 0 0 0 4 0 2 6 0 1 0 1 0 0 0 0 0 4 8 5 0 0 0 0 0 0 3 0 0 4 5 2 0 0 1 0 0 0 1 8 0 2 1 0 0 1 0 0 29 7 0 43 0 6 0 0 0 0 0 7 0 0 7 0 0 22 0 15 24 0 0 1 1 6 0 5 0 0 58 4 11 5 18 8 30 29 0 103 1 13 1 2 6 3 22 0 0 1 0 46 20 5 0 0 1 8 0 0 0 10 0 3 0 4 0 5 0 0 1 56 4 19 6 0 2 23 9 0 0 6 24 0 0 0 15 2 0 0 35 8 30 29 0 1 2 0 3 0 7 0 1 0 0 17 4 0 7 5 0 3 0 0 0 7 23 0 1 0 0 0 0 0 1 0 80 0 2 0 0 26 1 0 8 0 1 18 0 15 3 0 3 1 0 3 1 0 3 0 8 0 30 20 0 0 29 5 16 24 0 1 0 0 7 10 11 0 10 0 0 0 0 0 0 0 0 69 4 0 0 0 0 0 0 0 2 1 0 10 6 13 0 1 1 0 22 3 0 0 2 3 0 9 2 0 111 0 0 2 1 0 0 0 1 0 0 0 0 12 4 0 0 40 1 2 0 15 46 0 0 0 0 3 1 0 0 23 2 29 0 11 0 1 0 0 0 0 7 0 0 2 0 0 8 4 2 0 0 0 3 0 0 1 0 12 0 0 2 0 0 0 0 2 0 0 0 0 5 1 0 2 10 8 1 156 3 33 0 26 2 0 11 0 0 0 1 2 0 1 0 0 2 0 0 0 16 11 0 0 26 2 0 40 1 0 3 3 0 4 1 24 0 0 0 0 0 1 0 1 39 2 3 0 0 9 2 27 0 0 2 0 0 0 65 2 0 31 6 0 0 0 3 0 0 20 70 0 0 14 70 0 13 8 0 0 1 4 2 0 15 0 0 6 3 0 2 0 2 0 4 1 0 0 5 0 0 0 0 0 2 0 35 0 7 11 0 24 7 0 0 0 1 0 1 22 0 1 1 0 17 7 0 0 5 0 16 20 0 5 1 0 32 12 0 0 12 0 0 5 7 0 6 1 0 0 23 3 0 12 22 0 6 2 0 3 0 4 0 16 1 0 0 29 19 0 1 0 0 14 1 0 13 1 0 0 38 0 0 76 6 0 26 37 0 0 2 1 0 0 0 2 4 1 0 17 9 0 0 0 6 0 10 0 0 24 3 19 15 0 0 36 12 4 0 137 14 0 9 7 0 0 0 0 0 2 1 1 0 10 0 0 47 2 0 6 0 11 1 0 0 0 1 115 11 0 0 55 2 4 0 0 0 1 1 0 0 0 0 0 0 9 0 0 1 7 0 0 6 0 0 1 0 4 0 0 27 1 0 0 0 0 0 0 0 2 0 13 21 0 12 0 0 0 8 0 3 3 0 0 3 0 0 25 3 0 1 6 12 0 4 0 0 2 0 0 2 2 0 0 1 1 0 9 7 0 1 1 1 1 3 23 1 2 5 16 2 0 5 1 1 0 1 0 0 0 0 0 6 0 0 0 0 0 9 6 0 0 0 0 0 0 14 0 0 0 1 0 4 4 1 3 2 0 18 25 0 77 10 11 0 0 7 2 0 1 0 0 12 2 0 0 2 1 0 0 1 0 12 15 0 0 12 0 0 1 2 0 15 14 0 0 0 15 15 19 0 7 0 0 0 4 1 0 9 2 7 0 1 9 10 1 0 0 22 0 0 15 11 0 0 28 0 0 9 0 2 6 0 0 36 0 0 0 0 0 0 4 0 8 32 0 0 4 15 0 2 1 0 7 1 0 0 1 8 2 0 0 0 0 8 8 0 0 0 0 16 2 0 0 0 10 0 11 1 0 3 22 0 0 4 6 0 0 21 0 10 38 0 1 6 10 0 0 1 14 0 6 0 0 4 3 0 5 9 0 0 3 1 1 2 0 0 15 1 1 12 5 10 0 77 11 0 0 2 0 0 0 0 0 0 0 0 15 1 0 7 0 0 0 4 2 16 3 3 8 16 0 0 0 0 7 0 9 1 0 0 1 1 0 1 0 0 0 0 0 1 2 0 21 6 1 26 31 1 0 0 7 0 0 1 1 1 0 14 17 8 0 7 35 0 12 0 0 9 0 1 1 0 0 0 3 0 0 0 1 0 3 13 0 10 1 7 7 0 0 27 3 0 0 0 0 4 5 0 4 0 20 0 7 11 0 2 20 0 1 0 2 0 9 20 0 7 0 0 0 2 5 0 3 13 0 0 0 1 0 4 0 4 14 8 0 2 2 0 0 0 0 0 4 0 0 2 0 0 0 0 SP305 Bacteria;Firmicutes;Bacilli;Lactobacillales;Streptococcaceae;Streptococcus;oralis_subsp._tigurinus_clade_070 4 10 222 3 1 14 0 3 7 9 10 11 22 1 6 157 3 4 67 37 3 0 5 44 13 2 9 0 2 4 1215 51 6 1 4 12 97 2 0 3 14 96 2 1 0 6 2 8 35 18 1 4 30 3 11 0 5 30 1 28 17 5 4 0 448 15 1 15 449 9 2 973 22 2 12 52 12 37 0 15 9 4 3121 7 558 2 5 494 7 0 0 4 692 9 0 5 3 7 0 1 16 49 0 4 4 1 485 0 23 8 9 10 1 4 1 9 0 4 0 47 4 352 2 21 3 1 4 6 62 24 42 3 4 7 3 2 3 6 0 5 3 1 24 1 7 29 56 9 8 0 13 3 0 15 7 13 4 83 4 17 4 2 4 0 7 14 1272 10 2 8 1 8 1489 7 3 7 45 33 15 50 3 4 871 215 4 33 4 2 0 0 2 2 77 2 28 4 0 8 18 7 0 1 9 0 2 0 0 989 17 4 57 2 2 2 2 2 1 1 4 26 2 64 3 23 1 1 7 17 15 0 11 6 14 0 196 5 32 4 0 3 6 10 0 20 69 3 8 30 2689 4 14 0 0 9 1 5 385 7 1 30 125 1 995 4 14 13 2610 15 0 0 0 0 0 0 0 0 0 0 0 0 0 0 0 0 0 0 0 0 0 0 0 0 0 0 0 0 0 0 0 0 0 0 0 0 0 0 0 0 0 0 0 0 0 0 0 0 0 0 0 0 0 0 0 0 0 0 0 0 0 0 0 0 0 0 0 0 0 0 0 0 0 0 0 0 0 0 0 0 0 0 0 0 0 0 0 0 0 0 0 0 0 0 0 0 0 0 0 0 0 0 0 0 0 0 0 0 0 0 0 0 0 0 0 0 0 0 0 0 0 0 0 0 0 0 0 0 0 0 0 0 0 0 0 0 0 0 0 0 0 0 0 0 0 0 0 0 0 0 0 0 0 0 0 0 0 0 0 0 0 0 0 0 0 0 0 0 0 0 0 0 0 0 0 0 0 0 0 0 0 0 0 0 0 0 0 0 0 0 0 0 0 0 0 0 0 0 0 0 0 0 0 0 0 0 0 0 0 0 0 0 0 0 0 0 0 0 0 0 0 0 0 0 0 0 0 0 0 0 0 0 0 0 0 0 0 0 0 0 0 0 0 0 0 0 0 0 0 0 0 0 0 0 0 0 0 0 0 0 0 0 0 0 0 0 0 0 0 0 0 0 0 0 0 0 0 0 0 0 0 0 0 0 0 0 0 0 0 0 0 0 0 0 0 0 0 0 0 0 0 0 0 0 0 0 0 0 0 0 0 0 0 0 0 0 0 0 0 0 0 0 0 0 0 0 0 0 0 0 0 0 0 0 0 0 0 0 0 0 0 0 0 0 0 0 0 0 0 0 0 0 0 0 0 0 0 0 0 0 0 0 0 0 0 0 0 0 0 0 0 0 0 0 0 0 0 0 0 0 0 0 0 0 0 0 0 0 0 0 0 0 0 0 0 0 0 0 0 0 0 0 0 0 0 0 0 0 0 0 0 0 0 0 0 0 0 0 0 0 0 0 0 0 0 0 0 0 0 0 0 0 0 0 0 0 0 0 0 0 0 0 0 0 0 0 0 0 0 0 0 0 0 0 0 0 0 0 0 0 0 0 0 0 0 0 0 0 0 0 0 0 0 0 0 0 0 0 0 0 0 0 0 0 0 0 0 0 0 0 0 0 0 0 0 0 0 0 0 0 0 0 0 0 0 0 0 0 0 0 0 0 0 0 0 0 0 0 0 0 0 0 0 0 0 0 0 0 0 0 0 0 0 0 0 0 0 0 0 0 0 0 0 0 0 0 0 0 0 0 0 0 0 0 0 0 0 0 0 0 0 0 0 0 0 0 0 0 0 0 0 0 0 0 0 0 0 0 0 0 0 0 0 0 0 0 0 0 0 0 0 0 0 0 0 0 0 0 0 0 0 0 0 0 0 0 0 0 0 0 0 0 0 0 0 0 0 0 0 0 0 0 0 0 0 0 0 0 0 0 0 0 0 0 0 0 0 0 0 0 0 0 0 0 0 0 0 0 0 0 0 0 0 0 0 0 0 0 0 0 0 0 0 0 0 0 0 0 0 0 0 0 0 0 0 0 0 0 0 0 0 0 0 0 0 0 0 0 0 0 0 0 0 0 0 0 0 0 0 0 0 0 0 0 0 0 0 0 0 0 0 0 0 0 0 0 0 0 0 0 0 0 0 0 0 0 0 0 0 0 0 0 0 0 0 0 0 0 0 0 0 0 0 0 0 0 0 0 0 0 0 0 0 0 0 0 0 0 0 0 0 0 0 0 0 0 0 0 0 0 0 0 0 0 0 0 0 0 0 0 0 0 0 0 0 0 0 0 0 0 0 0 0 0 0 0 0 0 0 0 0 0 0 0 0 0 0 0 0 0 0 0 0 0 0 0 0 0 0 0 0 0 0 0 0 0 0 0 0 0 0 0 0 0 0 0 0 0 0 0 0 0 0 0 0 0 0 0 0 0 0 0 0 0 0 0 0 0 0 0 0 0 0 0 0 0 0 0 0 0 0 0 0 0 0 0 0 0 0 0 0 0 0 0 0 0 0 0 0 0 0 0 0 0 0 0 0 0 0 0 0 0 0 0 0 0 0 0 0 0 0 0 0 0 0 0 0 0 0 0 0 0 0 0 0 0 0 0 0 0 0 0 0 0 0 0 0 0 0 0 0 0 0 0 0 0 0 0 0 0 0 0 0 0 0 0 0 0 0 0 0 0 0 0 0 0 0 0 0 0 0 0 0 0 0 0 0 0 0 0 0 0 0 0 0 0 0 0 0 0 0 0 0 0 0 0 0 0 0 0 0 0 0 0 0 0 0 0 0 0 0 0 0 0 0 0 0 0 0 0 0 0 0 0 0 0 0 0 0 0 0 0 0 0 0 0 0 0 0 0 0 0 0 0 0 0 0 0 0 0 0 0 0 0 0 0 0 0 0 0 0 0 0 0 0 0 0 0 0 0 0 0 0 0 0 0 0 0 0 0 0 0 0 0 0 0 0 0 0 0 0 0 0 0 0 0 0 0 0 0 0 0 0 0 0 0 0 0 0 0 0 0 0 0 0 0 0 0 0 0 0 0 0 0 0 0 0 0 0 0 0 0 0 0 0 0 0 0 0 0 0 0 0 0 0 0 0 0 0 0 0 0 0 0 0 0 0 0 0 0 0 0 0 0 0 0 0 0 0 0 0 0 0 0 0 0 0 0 0 0 0 0 0 0 0 0 0 0 0 0 0 0 0 0 0 0 0 0 0 0 0 0 0 0 0 0 0 0 0 0 0 0 0 0 0 0 0 0 0 0 0 0 0 0 0 0 0 0 0 0 0 0 0 0 0 0 0 0 0 0 0 0 0 0 0 0 0 0 0 0 0 0 0 0 0 0 0 0 0 0 0 0 0 0 0 0 0 0 0 0 0 0 0 0 0 0 0 0 0 0 0 0 0 0 0 0 0 0 0 0 0 0 0 0 0 0 0 0 0 0 0 0 0 0 0 0 0 0 0 0 0 0 0 0 0 0 0 0 0 0 0 0 0 0 0 0 0 0 0 0 0 0 0 0 0 0 0 0 0 0 0 0 0 0 0 0 0 0 0 0 0 0 0 0 0 0 0 0 0 0 0 0 0 0 0 0 0 0 0 0 0 0 0 0 0 0 0 0 0 0 0 0 0 0 0 0 0 0 0 0 0 0 0 0 0 0 0 0 0 0 0 0 0 0 0 0 0 0 0 0 0 0 0 0 0 0 0 0 0 0 0 0 0 0 0 0 0 0 0 0 0 0 0 0 0 0 0 0 0 0 0 0 0 0 0 0 0 0 0 0 0 0 0 0 0 0 0 0 0 0 0 0 0 0 0 0 0 0 0 0 0 0 0 0 0 0 0 0 0 0 0 0 0 0 0 0 0 0 0 0 0 0 0 0 0 0 0 0 0 0 0 0 0 0 0 0 0 0 0 0 0 0 0 0 0 0 0 0 0 0 0 0 0 0 0 0 0 0 0 0 0 0 0 0 0 0 0 0 0 0 0 0 0 0 0 0 0 0 0 0 0 0 0 0 0 0 SP31 Bacteria;Firmicutes;Bacilli;Lactobacillales;Streptococcaceae;Streptococcus;mitis 367 9376 1664 1079 410 12498 5201 983 2075 5234 764 10916 2974 5550 1923 1125 9405 5600 1600 693 2978 2032 9047 8491 3487 814 18676 1353 17942 24084 2023 1921 5827 707 1750 4959 1892 17146 1261 8357 882 9003 1604 8098 6003 2041 13176 1918 37611 5575 912 345 613 9150 1445 1883 1722 8354 9648 5753 2023 11168 1387 26625 911 4947 3734 1657 9234 1902 4815 2142 4317 1700 4211 1543 1486 547 20229 5317 6287 1706 6455 11715 44 12986 2105 830 12000 174 13000 1327 13089 16194 4223 9820 29670 2364 7953 4612 1078 12996 9685 263 17035 20254 2817 8619 1394 3317 6325 460 4857 12916 16908 18371 1632 4762 3673 5831 593 3921 2410 2572 2566 3081 917 1734 3238 27089 1860 1666 635 9798 4919 14112 591 983 1836 623 31952 20140 18941 2799 19389 7405 1567 5587 3603 2324 477 1678 1829 1856 6992 4030 1494 12367 1350 1525 4168 11486 1202 9846 8806 2689 3431 7338 24774 2026 10370 2245 10304 15570 134 1984 3537 3398 3548 4934 432 5101 9039 2014 2534 766 2327 5470 1208 927 2833 993 1313 441 832 10287 498 1560 3527 2037 22894 3528 1231 1659 1022 102 6311 716 5050 17757 891 3066 475 2211 6077 2033 30632 3224 21862 1291 3946 2476 8423 6802 1174 1185 617 5263 20199 68 1220 22355 1895 2028 194 81 2860 4987 3808 1963 21463 1378 1307 2842 27571 1568 352 1667 877 2012 532 572 189 778 41 445 5150 69 2824 1246 1318 368 13462 450 3369 146 1076 888 0 0 0 0 0 0 0 0 0 0 0 0 0 0 0 0 0 0 0 0 0 0 0 0 0 0 0 0 0 0 0 0 0 0 0 0 0 0 0 0 0 0 0 0 0 0 0 0 0 0 0 0 0 0 0 0 0 0 0 0 0 0 0 0 0 0 0 0 0 0 0 0 0 0 0 0 0 0 0 0 0 0 0 0 0 0 0 0 0 0 0 0 0 0 0 0 0 0 0 0 0 0 0 0 0 0 0 0 0 0 0 0 0 0 0 0 0 0 0 0 0 0 0 0 0 0 0 0 0 0 0 0 0 0 0 0 0 0 0 0 0 0 0 0 0 0 0 0 0 0 0 0 0 0 0 0 0 0 0 0 0 0 0 0 0 0 0 0 0 0 0 0 0 0 0 0 0 0 0 0 0 0 0 0 0 0 0 0 0 0 0 0 0 0 0 0 0 0 0 0 0 0 0 0 0 0 0 0 0 0 0 0 0 0 0 0 0 0 0 0 0 0 0 0 0 0 0 0 0 0 0 0 0 0 0 0 0 0 0 0 0 0 0 0 0 0 0 0 0 0 0 0 0 0 0 0 0 0 0 0 0 0 0 0 0 0 0 0 0 0 0 0 0 0 0 0 0 0 0 0 0 0 0 0 0 0 0 0 0 0 0 0 0 0 0 0 0 0 0 0 0 0 0 0 0 0 0 0 0 0 0 0 0 0 0 0 0 0 0 0 0 0 0 0 0 0 0 0 0 0 0 0 0 0 0 0 0 0 0 0 0 0 0 0 0 0 0 0 0 0 0 0 0 0 0 0 0 0 0 0 0 0 0 0 0 0 0 0 0 0 0 0 0 0 0 0 0 0 0 0 0 0 0 0 0 0 0 0 0 0 0 0 0 0 0 0 0 0 0 0 0 0 0 0 0 0 0 0 0 0 0 0 0 0 0 0 0 0 0 0 0 0 0 0 0 0 0 0 0 0 0 0 0 0 0 0 0 0 0 0 0 0 0 0 0 0 0 0 0 0 0 0 0 0 0 0 0 0 0 0 0 0 0 0 0 0 0 0 0 0 0 0 0 0 0 0 0 0 0 0 0 0 0 0 0 0 0 0 0 0 0 0 0 0 0 0 0 0 0 0 0 0 0 0 0 0 0 0 0 0 0 0 0 0 0 0 0 0 0 0 0 0 0 0 0 0 0 0 0 0 0 0 0 0 0 0 0 0 0 0 0 0 0 0 0 0 0 0 0 0 0 0 0 0 0 0 0 0 0 0 0 0 0 0 0 0 0 0 0 0 0 0 0 0 0 0 0 0 0 0 0 0 0 0 0 0 0 0 0 0 0 0 0 0 0 0 0 0 0 0 0 0 0 0 0 0 0 0 0 0 0 0 0 0 0 0 0 0 0 0 0 0 0 0 0 0 0 0 0 0 0 0 0 0 0 0 0 0 0 0 0 0 0 0 0 0 0 0 0 0 0 0 0 0 0 0 0 0 0 0 0 0 0 0 0 0 0 0 0 0 0 0 0 0 0 0 0 0 0 0 0 0 0 0 0 0 0 0 0 0 0 0 0 0 0 0 0 0 0 0 0 0 0 0 0 0 0 0 0 0 0 0 0 0 0 0 0 0 0 0 0 0 0 0 0 0 0 0 0 0 0 0 0 0 0 0 0 0 0 0 0 0 0 0 0 0 0 0 0 0 0 0 0 0 0 0 0 0 0 0 0 0 0 0 0 0 0 0 0 0 0 0 0 0 0 0 0 0 0 0 0 0 0 0 0 0 0 0 0 0 0 0 0 0 0 0 0 0 0 0 0 0 0 0 0 0 0 0 0 0 0 0 0 0 0 0 0 0 0 0 0 0 0 0 0 0 0 0 0 0 0 0 0 0 0 0 0 0 0 0 0 0 0 0 0 0 0 0 0 0 0 0 0 0 0 0 0 0 0 0 0 0 0 0 0 0 0 0 0 0 0 0 0 0 0 0 0 0 0 0 0 0 0 0 0 0 0 0 0 0 0 0 0 0 0 0 0 0 0 0 0 0 0 0 0 0 0 0 0 0 0 0 0 0 0 0 0 0 0 0 0 0 0 0 0 0 0 0 0 0 0 0 0 0 0 0 0 0 0 0 0 0 0 0 0 0 0 0 0 0 0 0 0 0 0 0 0 0 0 0 0 0 0 0 0 0 0 0 0 0 0 0 0 0 0 0 0 0 0 0 0 0 0 0 0 0 0 0 0 0 0 0 0 0 0 0 0 0 0 0 0 0 0 0 0 0 0 0 0 0 0 0 0 0 0 0 0 0 0 0 0 0 0 0 0 0 0 0 0 0 0 0 0 0 0 0 0 0 0 0 0 0 0 0 0 0 0 0 0 0 0 0 0 0 0 0 0 0 0 0 0 0 0 0 0 0 0 0 0 0 0 0 0 0 0 0 0 0 0 0 0 0 0 0 0 0 0 0 0 0 0 0 0 0 0 0 0 0 0 0 0 0 0 0 0 0 0 0 0 0 0 0 0 0 0 0 0 0 0 0 0 0 0 0 0 0 0 0 0 0 0 0 0 0 0 0 0 0 0 0 0 0 0 0 0 0 0 0 0 0 0 0 0 0 0 0 0 0 0 0 0 0 0 0 0 0 0 0 0 0 0 0 0 0 0 0 0 0 0 0 0 0 0 0 0 0 0 0 0 0 0 0 0 0 0 0 0 0 0 0 0 0 0 0 0 0 0 0 0 0 0 0 0 0 0 0 0 0 0 0 0 0 0 0 0 0 0 0 0 0 0 0 0 0 0 0 0 0 0 0 0 0 0 0 0 0 0 0 0 0 0 0 0 0 0 0 0 0 0 0 0 0 0 0 0 0 0 0 0 0 0 0 0 0 0 0 0 0 0 0 0 0 0 0 0 0 0 0 0 0 0 0 0 0 0 0 0 0 0 0 0 0 0 0 0 0 0 0 0 0 0 0 0 0 0 0 0 0 0 0 0 0 0 0 0 0 0 0 0 0 0 0 0 0 0 0 0 0 0 0 0 0 0 0 0 0 0 0 0 0 0 0 0 0 0 0 0 0 0 0 0 0 0 0 0 0 0 0 0 0 0 0 0 0 0 0 0 0 0 0 0 0 0 0 0 0 0 0 0 0 0 0 0 0 0 0 0 0 0 0 0 0 0 0 0 0 0 0 0 0 0 0 0 0 0 0 0 0 0 0 0 0 0 0 0 0 0 0 0 0 0 0 0 0 0 0 0 0 0 0 0 0 0 0 0 0 0 0 0 0 0 0 0 0 0 0 0 0 0 0 0 0 0 0 0 0 0 0 0 0 0 0 0 0 0 0 0 0 0 0 0 0 0 0 0 0 0 0 0 0 0 0 0 0 0 0 0 0 0 0 0 0 0 0 0 0 0 0 0 0 0 0 0 0 0 0 0 0 0 0 0 0 0 0 0 0 0 0 0 0 0 0 0 0 0 0 0 0 0 0 0 0 0 0 0 0 0 0 0 0 0 0 0 0 0 0 SP32 Bacteria;Bacteroidetes;Flavobacteriia;Flavobacteriales;Flavobacteriaceae;Capnocytophaga;granulosa 0 9 29 4 0 2 1 2 1 2 4 109 10 0 326 1 1 30 51 14 0 0 1 40 10 8 11 1 1 0 0 2 62 6 23 6 5 14 2 1 0 0 6 4 25 0 24 5 23 21 27 6 2 18 3 38 8 64 9 8 15 40 0 4 6 0 10 0 94 12 2 92 10 0 16 4 5 5 3 3 76 1 1 24 2 35 8 31 12 9 51 2 22 19 1 5 17 217 10 1 2 1 14 0 1 0 5 21 2 25 0 7 13 77 3 2 0 14 3 3 0 5 0 13 2 8 6 0 6 162 16 181 0 0 40 0 410 6 2 1 5 0 189 154 4 6 9 7 1 1 4 2 120 1 1 0 17 0 4 0 1 11 0 0 0 2 15 36 3 0 1 1 3 0 15 1 3 0 5 29 1 0 1 9 9 7 57 62 1 54 0 37 6 0 2 3 0 182 9 9 12 0 8 0 1 4 0 3 1 17 8 13 1 1 4 6 7 1 0 21 15 133 2 71 2 10 734 122 165 10 5 0 13 0 0 0 34 3 6 69 15 0 5 17 3 12 0 1 4 0 1 1 0 0 1 0 4 1 0 9 83 13 1 5 11 0 2 75 1 120 1 0 39 0 198 0 22 23 254 0 163 143 0 277 46 128 22 4 1340 26 19 272 2 3 83 214 15 85 0 173 64 55 36 89 120 1 14 727 269 3 175 4 1 0 2 1 0 78 45 14 1 364 52 0 38 0 1 0 0 0 0 25 17 6 1 0 0 2 0 23 8 3 0 5 12 1 770 48 34 5 8 5 1 4 0 407 0 7 17 0 0 23 1 1 0 3149 0 0 162 0 4 0 102 88 202 0 2 0 2 19 0 0 181 219 0 108 87 5 0 14 66 2 0 151 128 5 24 6 93 147 1 405 0 0 592 486 0 88 69 401 4 78 0 9 0 513 0 0 0 0 13 7 140 12 1 164 1 0 5 1 7 245 46 30 2 255 136 0 0 0 138 0 29 1 385 1 0 138 100 126 0 16 35 0 1 2 0 1 3 388 72 1 0 71 0 273 0 193 0 2 1190 161 0 366 112 1 7 5 0 249 263 48 7 125 18 32 160 277 51 242 155 6 10 128 38 0 4 8 0 14 67 137 0 1 297 0 17 67 0 0 26 0 0 0 0 0 6 32 1 0 0 59 2 5 2 54 0 87 1 166 0 624 336 924 99 0 24 2 0 17 0 8 4 21 5 77 567 241 30 4 230 0 263 0 208 1313 0 5 0 131 933 134 17 0 5 13 0 0 0 53 4 0 26 4 362 32 402 109 0 0 16 66 55 40 27 62 87 0 1 1 4 0 0 5 2 100 0 16 0 1 0 2 73 26 86 2 19 0 28 167 105 12 1 0 12 209 161 5 0 65 0 0 0 78 113 70 236 0 3 79 117 43 5 61 184 174 290 0 4 3 531 20 65 366 270 0 0 2 166 17 0 0 0 11 1348 12 226 4 25 473 85 0 217 76 52 8 3 0 0 20 0 380 0 442 0 7 4 42 31 0 0 15 131 1 0 23 1 595 9 264 189 0 0 4 3509 225 0 0 0 6 28 69 19 131 127 2 378 1086 1 130 1 1 68 237 1 4 33 0 52 18 0 20 173 1157 0 1 656 169 88 6 108 6 0 80 91 6 7 59 257 16 87 317 278 0 111 17 1 245 72 1 9 28 670 0 19 48 4 79 0 304 271 241 37 85 138 450 66 207 85 28 488 3128 149 404 0 25 95 388 7 30 14 38 0 10 1 50 104 0 0 83 0 2 1 251 539 30 48 0 0 28 11 0 1 0 0 12 193 2 14 0 21 0 5 844 0 40 44 0 1 593 0 34 33 0 0 71 1 231 194 17 0 3 3 0 0 2 0 6 1 5 20 2 248 1 7 9 1085 82 49 13 0 32 22 423 0 0 0 52 0 273 1 10 6 8 1 2 108 174 53 292 11 0 7 110 62 0 118 2 47 2 19 468 103 50 14 1 2 4 190 191 159 0 0 0 17 45 28 0 228 498 17 0 3 4 73 0 62 26 16 49 360 147 0 272 105 128 0 495 46 62 12 31 169 916 59 8 16 58 130 0 134 1 86 224 1 12 0 103 48 18 86 2 10 24 0 54 125 0 86 32 36 142 104 98 0 13 45 4 17 0 1 17 0 36 0 13 1408 0 27 0 280 246 0 21 106 6 105 22 206 535 38 0 16 71 0 12 0 58 0 21 54 880 6 195 4 57 3 1 5 10 0 15 1 60 0 3 0 0 0 0 0 15 0 19 54 5 0 0 6 0 0 86 13 76 79 0 79 3 95 0 28 51 20 31 35 1 16 59 15 6 130 20 0 245 31 1 19 5 81 0 204 104 1 6 11 0 16 5 0 2 254 12 0 0 72 113 0 0 0 0 16 17 1 290 387 671 272 0 1 0 0 0 25 0 16 47 7 0 25 3 3 16 56 8 0 0 0 4 0 6 15 0 52 11 0 1 0 0 0 0 7 0 1 0 0 35 1 0 195 49 121 0 22 17 149 0 14 38 3 21 1 0 3 46 27 0 11 14 0 4 3 0 0 108 85 0 0 28 33 0 60 2 6 7 5 0 3 0 100 0 8 4 20 0 15 8 21 1 11 81 0 89 22 22 146 0 2 36 3 0 0 19 6 0 11 13 0 23 0 13 7 0 187 237 35 0 165 201 0 89 2 0 14 4 0 3 0 203 49 0 5 49 0 18 0 9 0 89 22 0 0 14 4 0 3 2 0 8 2 123 0 23 51 0 572 75 0 12 2 0 1 1 8 65 0 0 0 15 164 1 0 5 0 25 52 2 86 53 0 28 5 0 0 5 17 0 28 13 2 13 0 0 0 135 5 0 38 13 0 2 5 0 7 41 0 0 7 0 0 0 80 200 0 11 0 0 22 5 0 55 92 3 0 178 1 6 540 21 3 63 217 20 0 9 7 0 2 277 0 0 2 0 0 36 1 19 3 1105 0 11 0 0 182 3 1 19 5 0 28 103 4 0 110 18 4 26 21 0 6 15 1 4 2 3 10 0 102 1 0 97 0 0 18 0 75 220 0 10 10 2 259 157 3 0 279 14 11 3 60 14 3 22 0 0 442 0 0 0 17 96 0 37 30 4 50 9 8 10 1 18 3 2 1 2 0 0 0 0 0 0 0 2 21 0 53 10 0 13 0 1 64 0 0 16 48 0 0 4 40 0 0 20 0 0 0 73 0 8 76 0 31 21 0 43 13 0 0 3 25 1 22 11 0 33 36 0 0 6 2 16 18 3 453 1 1 15 57 0 10 9 0 11 0 42 2 23 13 0 1 12 0 139 11 5 0 0 39 0 1 113 0 0 1 23 0 21 29 52 5 37 0 12 72 1 63 17 12 1 3 4 6 143 2 2 0 26 1 0 10 68 3 0 26 34 0 20 21 0 0 67 14 0 7 8 20 16 108 1 62 0 95 2 58 1 12 0 0 0 25 7 0 16 19 107 0 2 12 0 17 26 1 122 0 0 10 3 0 0 175 0 1 301 0 31 14 0 26 588 79 0 1 4 0 1 28 0 139 167 192 1 11 115 0 21 33 0 6 11 4 0 5 23 0 10 4 5 0 426 84 17 9 4 0 64 61 76 0 2 21 62 0 1 0 6 13 0 7 7 11 0 5 231 0 3 116 3 0 8 157 0 0 28 8 3 29 23 1 2 3 0 55 82 0 0 427 17 0 0 0 0 165 0 9 1 282 46 6 511 117 1 0 149 3 17 492 0 0 71 1 0 41 9 1 209 5 0 17 0 31 66 1 0 6 1 178 208 0 76 5 0 198 14 7 13 142 30 1 1 0 0 5 5 0 6 5 4 77 98 0 4 32 1 0 7 4 0 27 137 15 1 0 276 285 97 1 87 4 3 68 6 2 32 5 49 0 0 0 0 0 0 12 10 16 0 12 60 104 26 6 139 10 0 0 60 37 8 30 4 0 8 256 0 28 31 22 0 35 111 16 4 144 4 15 7 2 1 21 20 0 16 196 0 3 1 5 0 16 6 1 0 25 1 0 10 0 2 11 21 0 125 50 73 0 3 44 0 27 0 6 2 7 12 5 4 SP33 Bacteria;Fusobacteria;Fusobacteriia;Fusobacteriales;Leptotrichiaceae;Leptotrichia;sp. HMT215 339 469 7 308 11 343 195 386 253 10 311 88 248 46 356 710 27 130 2104 843 781 344 48 19 164 131 5 44 86 227 744 582 300 751 787 466 20 40 589 514 2971 159 1261 108 0 5746 148 0 0 34 38 39 16 2 1063 506 84 106 3 184 238 67 837 26 669 122 274 1765 26 1959 0 1224 1298 26 0 115 376 83 159 40 2020 487 56 339 462 186 403 151 8 858 97 487 247 1475 92 42 113 914 408 113 319 92 1 437 1 18 259 32 564 14 0 54 5 1050 563 653 221 1087 363 1671 143 672 744 734 184 46 327 1457 1375 23 959 1634 3 153 1110 876 4155 244 0 111 55 1 15 96 7 440 246 609 90 8 436 131 1841 16 6 28 164 31 137 670 1119 66 348 11 117 32 6 71 92 5 4 2 10 132 82 2 83 54 126 77 211 171 40 931 76 297 198 351 336 49 616 37 324 119 131 26 555 392 40 1545 104 881 633 405 328 2 9 1 5 13 563 1454 1266 461 2208 1696 2 71 6 308 252 1687 38 355 279 351 2372 974 39 178 2468 69 107 1 387 1118 305 70 574 1124 987 1954 2617 11 9 148 1007 683 3436 46 1154 0 5 277 6 66 1075 339 13 611 5 147 20 480 53 10 519 9 0 6 8 1 2 0 12 0 2 0 1 0 48 2 14 0 24 0 0 2 2 5 5 10 13 0 5 1 61 3 0 40 3 23 404 97 22 1 111 0 1 0 2 11 25 0 54 3 1 3 0 0 0 0 3 0 0 0 5 0 2 0 6 4 0 1 0 0 0 1 2 2 0 41 0 9 3 1 8 0 0 0 15 5 1 1 121 0 41 6 1 0 0 0 0 3 1 0 6 1 0 0 9 2 0 21 101 1 0 0 0 6 5 0 59 5 0 1 0 0 0 5 6 0 0 1 9 7 5 0 0 6 5 0 26 13 0 0 0 1 0 0 20 0 1 0 2 3 5 0 9 0 0 0 263 1 0 9 9 0 0 0 0 2 9 3 4 1 0 3 16 0 7 1 15 0 9 75 1 0 91 3 2 1 1 0 0 23 1 2 0 3 3 2 2 1 10 1 1 32 0 0 20 0 7 12 67 0 9 9 0 2 0 9 0 0 2 4 8 34 1 4 0 0 1 0 13 2 0 0 13 286 131 0 1 1 0 0 2 0 5 5 9 15 0 2 3 2 10 69 3 0 0 1 0 2 3 24 0 17 1 0 0 0 1 1 3 0 4 67 6 5 41 13 6 18 1 0 1 2 0 43 0 4 0 3 0 0 0 0 480 1 0 7 398 54 60 40 1 0 17 15 2 0 0 35 0 1 0 1 1 0 1 1 0 0 0 15 3 3 3 0 0 0 21 12 5 23 0 2 0 6 0 0 14 1 3 3 0 0 10 3 1 9 13 17 1 3 16 0 1 0 0 8 0 0 5 5 1 1 2 2 2 0 0 2 26 1 0 0 8 3 0 3 4 17 9 5 0 5 302 0 0 0 4 0 5 1 34 1 3 0 1 0 1 0 2 1 21 9 7 3 0 3 3 0 0 0 1 2 1 0 0 0 2 0 1 4 0 2 2 0 1 19 0 3 1 0 0 6 0 2 0 7 2 0 0 0 2 2 5 1 13 0 88 9 0 0 3 0 0 0 0 2 3 1 0 0 5 1 3 74 92 154 0 0 3 1 12 0 0 35 0 0 6 1 0 0 3 2 7 17 13 6 2 3 18 1 4 3 1 1 2 0 2 3 2 3 0 2 0 7 0 0 0 0 7 7 1 0 17 7 0 1 0 3 0 4 0 12 0 1 2 0 0 0 16 9 0 0 5 0 7 2 3 0 22 1 0 3 2 1 1 0 0 1 52 8 47 1 0 16 7 1 0 7 0 0 2 0 0 9 4 3 21 0 9 8 2 51 44 4 35 0 1 0 3 0 0 0 0 2 0 11 2 0 14 3 1 19 3 2 33 0 3 2 13 14 1 1 2 0 3 84 4 66 7 0 0 16 51 44 1 0 0 2 3 2 24 1 0 0 2 43 13 2 1 13 0 0 0 1 3 0 2 0 24 0 11 6 19 0 7 8 0 5 0 0 0 4 8 0 1 0 0 1 1 0 1 4 0 3 1 0 2 7 17 22 7 38 3 1 14 0 16 2 0 1 26 3 0 1 0 1 8 44 2 33 9 9 4 5 1 24 2 0 1 0 0 1 1 4 0 0 0 76 7 0 505 120 1 0 0 0 24 1 0 72 0 4 11 2 0 0 251 122 10 2 116 0 2 1 3 0 1 61 12 25 0 2 1 0 0 5 0 110 6 0 0 0 0 0 1 0 2 85 2 0 7 182 8 5 6 31 4 76 41 483 20 7 65 0 8 0 109 18 180 0 31 28 0 12 13 1 0 0 0 0 23 46 0 6 7 13 107 0 14 122 31 16 4 0 21 12 70 17 6 1 4 14 15 0 100 0 296 12 8 42 1 2 6 14 1 13 0 63 12 25 0 0 91 33 20 6 1 13 296 1 4 0 283 2 3 10 16 0 91 3 3 77 8 56 0 3 162 0 3 329 24 19 5 137 195 1 5 0 9 332 102 0 45 40 104 1 0 9 22 11 34 4 1 31 13 5 15 32 1 77 25 4 80 1 118 2 15 41 28 0 8 23 2 0 180 5 12 13 9 1 0 8 0 158 33 60 9 198 25 32 81 118 0 5 69 0 3 5 39 5 6 26 70 11 269 2 5 75 33 13 1 3 28 12 40 21 23 2 12 5 0 12 9 44 28 84 0 132 57 11 103 91 11 1 12 20 8 5 20 35 37 0 0 3 0 8 11 31 4 0 66 7 2 280 1 18 532 23 40 20 16 2 0 33 16 69 1 6 14 2 23 65 9 47 36 4 4 2 7 5 26 4 308 7 7 82 0 5 8 7 8 38 56 15 18 53 0 8 0 36 12 6 0 41 1 59 92 12 31 94 11 18 73 2 37 2 5 27 18 173 19 4 9 31 55 706 1 2 0 15 4 23 162 37 97 26 16 170 0 8 12 39 30 7 49 182 30 54 53 23 98 22 0 2 8 35 16 33 1 137 48 10 0 7 5 123 19 36 14 5 183 12 4 6 7 23 59 30 8 11 93 4 1 919 11 21 22 44 3 5 31 47 3 2 4 3 1 6 2 2 1 4 18 16 72 14 0 14 5 0 8 16 62 2 1 7 4 165 20 0 37 21 2 26 38 6 12 8 11 18 11 83 18 306 8 204 0 11 28 2 67 131 7 778 2 25 65 0 8 0 129 187 1 20 0 3 22 18 41 136 71 41 22 6 159 111 5 23 0 16 1 182 10 9 2 20 17 1 109 32 0 34 1 4 440 1 0 18 5 71 3 0 73 2 0 3 5 21 691 1 0 172 160 2 89 63 9 4 177 97 39 12 4 1 9 81 29 10 0 8 5 2 125 21 1 3 22 0 43 28 10 0 0 26 1 2 9 7 3 51 4 5 18 64 9 2 14 36 7 6 0 74 105 4 20 4 2 5 17 27 2 40 28 10 0 4 86 0 21 7 184 11 6 79 11 15 26 12 12 10 29 2 6 2 11 24 24 23 19 1 13 9 5 1 14 9 0 0 15 83 0 0 89 345 70 92 26 10 10 36 42 15 10 0 3 2 1 25 1 3 0 1 4 0 29 130 55 0 10 13 7 5 0 31 0 6 1 40 104 30 55 67 11 7 9 0 3 50 30 5 2 180 27 324 55 68 22 667 11 1 33 25 96 0 28 71 0 182 23 9 8 5 54 198 55 18 142 0 0 0 5 17 0 225 28 19 139 23 115 6 26 30 6 3 53 35 34 754 5 206 33 9 1 20 0 0 1 30 13 0 69 12 47 14 47 20 35 46 59 30 9 32 60 35 21 250 5 1 0 0 3 2 50 225 8 12 75 10 174 15 272 316 39 662 0 1 4 6 335 21 11 52 2 12 84 0 25 60 15 153 9 12 14 18 1 0 8 223 42 2 0 0 0 4 2 80 16 1 1 15 20 31 0 115 48 3 12 84 0 21 37 12 255 18 0 0 229 248 10 9 32 50 0 0 27 64 0 10 117 807 33 2 504 31 20 0 0 15 0 5 10 1 57 14 71 3 0 0 SP34 Bacteria;Firmicutes;Negativicutes;Selenomonadales;Selenomonadaceae;Selenomonas;noxia 2 2 74 2 9 24 39 5 16 16 0 86 182 2 85 6 13 0 2 0 2 2 7 173 15 3 20 4 87 24 0 1 225 1 23 7 6 580 2 1 0 20 2 25 2 0 15 11 58 7 6 34 0 2 0 0 0 4 2 12 2 0 1 43 0 0 5 0 211 0 2 0 8 3 4 2 1 0 2 20 0 0 0 3 0 0 3 18 1 7 9 1 142 163 7 0 1 74 3 1 13 15 75 0 16 17 0 216 0 22 13 50 1 3 0 0 0 0 3 3 0 11 0 10 2 1 0 0 11 69 4 41 0 3 2 11 0 30 5 0 22 2 83 5 8 3 23 1 0 1 19 0 50 2 1 1 2 0 3 3 3 9 0 42 1 1 7 1 73 2 0 3 0 0 0 0 0 3 0 4 0 0 9 2 2 0 0 0 0 1 1 1 1 3 3 1 0 0 0 12 18 3 7 0 0 5 0 26 3 2 9 1 3 2 15 1 45 2 0 4 8 25 2 21 0 2 2 19 6 15 44 9 23 25 14 1 3 0 4 215 3 0 9 0 14 5 4 5 0 0 3 3 1 4 0 0 0 0 0 0 10 0 2 3 0 0 0 24 0 59 0 0 0 0 0 0 373 55 163 0 41 15 7 131 4 7 30 0 0 9 17 0 0 0 37 3 14 157 0 50 10 61 73 10 0 0 6 0 1 0 0 0 4 0 3 53 0 1 2 0 0 0 0 0 202 0 0 0 0 0 0 8 0 0 0 0 0 0 0 0 0 1 0 24 21 0 0 1 0 0 1 0 0 21 0 8 0 0 0 0 0 1 0 20 0 0 0 0 0 0 35 0 111 24 0 0 0 0 0 7 0 0 4 5 0 0 1 9 1 0 0 0 0 13 0 0 0 0 0 56 0 0 0 24 3 0 0 35 0 0 0 1 0 24 0 0 0 0 2 0 39 33 210 127 0 2 17 0 0 0 0 32 40 1 0 2 106 0 0 0 101 1 0 0 1 10 0 0 47 0 0 0 21 0 0 13 0 0 0 172 72 0 0 3 0 1 0 231 1 0 6 6 0 0 0 0 0 0 0 16 0 19 5 21 71 0 0 0 0 40 52 0 0 123 3 0 1 0 0 5 60 0 0 0 0 0 0 0 2 1 3 1 0 0 0 0 0 0 0 0 0 20 0 0 0 0 0 25 0 1 0 1 0 0 15 0 0 32 0 5 0 73 226 0 0 0 17 189 0 0 53 0 0 0 0 0 0 0 0 103 0 99 0 62 93 74 0 0 0 25 3 0 0 0 5 0 16 0 0 0 0 1 0 0 0 0 54 0 0 0 278 0 117 0 0 189 0 0 0 0 0 0 0 97 0 0 0 0 0 1 0 6 11 0 0 0 13 0 17 1 0 1 1 0 0 0 0 0 0 24 1 18 7 1 6 17 246 0 6 12 0 0 0 261 30 0 0 34 22 16 136 0 0 0 0 168 144 0 0 144 0 0 82 113 46 1 19 0 8 0 0 8 0 4 0 1 19 0 1 0 0 99 120 0 0 8 42 0 0 121 0 0 0 25 0 306 0 0 0 0 157 1 16 28 0 0 24 0 143 34 3 0 67 123 0 0 0 0 2 387 0 1 19 0 0 387 10 2 2 0 7 8 0 1 0 7 1 11 19 1 0 94 101 0 0 0 0 10 78 0 9 0 0 0 2 0 0 0 0 34 0 44 0 0 0 0 2 24 0 186 1 0 123 4 0 2 17 0 0 0 63 18 0 3 1 0 71 0 0 0 0 0 1 61 0 1 19 0 0 0 0 0 0 0 0 0 0 0 119 0 0 0 0 0 0 0 0 0 20 0 18 43 1 0 0 0 0 1 2 0 0 2 0 0 0 0 0 1 1 0 12 14 0 0 4 1 0 0 4 0 0 5 0 0 39 1 0 0 0 0 0 0 3 0 1 0 0 12 18 1 177 9 0 11 152 0 20 0 38 0 6 163 0 158 4 0 0 0 0 1 1 0 0 0 1 0 2 0 0 0 63 0 335 0 0 0 0 7 186 344 14 14 0 1 0 0 0 12 3 0 0 8 0 18 12 0 0 25 14 0 10 0 11 46 0 0 0 0 0 5 0 0 1 1 0 4 18 0 3 0 11 0 30 18 0 6 10 1 24 0 0 9 0 41 0 35 0 1 7 0 76 13 0 10 23 0 33 0 0 57 1 0 7 1 0 6 0 70 162 29 27 0 10 38 0 15 4 0 112 0 8 0 0 0 0 0 0 0 0 0 0 0 0 0 0 0 0 0 0 0 0 2 1 36 0 0 0 0 13 0 2 7 1 8 0 0 2 0 1 0 9 0 0 8 2 0 1 0 3 0 1 1 0 27 2 0 15 0 0 0 2 0 0 0 2 93 0 0 0 0 4 3 0 6 0 17 13 0 5 0 0 1 0 0 0 0 0 0 2 0 0 14 0 0 0 0 0 0 0 1 0 0 15 0 0 0 0 0 0 0 0 0 20 0 0 0 0 0 0 9 1 2 253 0 0 0 35 0 0 0 0 0 28 7 0 0 3 6 0 13 2 0 0 4 5 0 0 40 0 0 30 0 0 0 1 0 53 0 2 0 0 0 0 1 3 0 0 1 0 0 0 0 1 0 2 0 0 0 0 0 0 208 0 0 74 1 0 0 0 0 6 0 14 3 4 0 2 2 0 0 0 0 2 8 0 1 0 20 1 0 5 0 0 11 0 0 0 0 2 0 0 3 1 0 53 14 0 0 4 41 0 4 2 0 44 4 0 3 2 0 0 0 32 0 0 0 0 6 0 0 0 0 0 0 1 0 9 0 0 0 1 0 0 1 2 0 2 22 0 17 0 0 0 0 1 0 0 0 0 0 0 0 2 0 11 0 0 0 0 0 10 3 0 5 0 0 11 0 0 0 0 0 0 2 0 0 4 0 0 20 4 0 0 2 0 0 0 1 2 0 1 0 0 0 0 2 0 0 0 1 1 0 132 5 8 4 0 0 235 0 3 0 127 4 0 5 0 0 0 0 0 0 0 0 0 0 0 0 1 14 0 1 18 0 30 2 0 0 4 0 0 0 0 0 33 1 1 46 25 0 0 0 0 1 755 0 0 0 3 0 0 0 0 0 0 43 4 1 0 0 15 0 0 171 0 0 0 0 0 0 0 0 5 0 9 4 0 10 0 0 84 20 0 3 1 0 0 8 1 0 2 8 0 0 0 1 0 0 0 0 102 8 0 11 2 0 0 0 11 0 0 1 0 0 0 0 0 4 22 0 0 10 0 2 0 14 0 0 2 0 0 0 0 0 0 0 0 0 0 1 0 7 0 2 0 0 0 0 0 110 2 0 127 0 0 1 0 0 0 0 0 9 125 0 0 230 2 1 0 0 4 0 1 0 0 7 0 0 0 6 1 0 3 16 0 52 0 0 0 1 0 0 0 0 0 64 181 0 0 0 21 0 23 0 2 1 0 0 0 0 0 190 4 3 0 14 1 0 0 0 0 0 0 0 40 2 0 0 119 0 0 1 0 0 0 0 5 0 1 0 0 0 0 0 0 0 4 1 0 0 0 2 0 1 6 0 0 1 0 0 0 4 0 0 0 0 0 0 0 0 19 0 0 0 1 0 0 0 3 0 0 0 0 1 9 0 0 3 0 0 0 0 0 1 27 0 0 33 6 0 0 0 293 0 0 2 0 0 0 0 3 0 0 0 1 0 0 8 0 0 0 1 0 0 2 27 0 4 9 0 0 1 0 0 6 0 0 31 0 0 0 0 0 49 0 0 4 0 0 1 0 0 2 0 3 0 0 4 0 0 2 0 1 76 0 0 0 0 0 0 2 1 0 1 0 1 0 0 0 1 147 0 0 0 1 0 39 0 1 0 0 6 0 0 0 0 12 0 25 0 0 13 0 0 0 0 0 0 0 0 0 3 0 0 5 164 2 0 3 0 3 0 0 5 5 0 9 0 0 5 0 0 3 0 82 1 0 14 0 4 1 0 0 0 1 0 5 1 0 4 17 0 0 0 0 0 0 0 0 0 0 0 0 0 0 0 0 0 0 1 0 1 0 0 0 0 3 0 0 0 0 0 0 0 SP35 Bacteria;Proteobacteria;Epsilonproteobacteria;Campylobacterales;Campylobacteraceae;Campylobacter;gracilis 1 0 2 0 1 4 28 0 0 5 0 1 33 2 13 1 8 4 3 0 2 3 3 35 4 7 1 4 46 25 0 1 15 14 3 5 2 101 0 5 0 0 3 5 1 24 16 10 26 0 0 17 16 19 0 2 1 4 0 2 19 0 2 7 3 3 7 0 46 0 5 3 1 0 3 1 0 0 7 1 6 0 0 2 1 0 1 1 1 5 7 0 34 51 0 0 13 7 6 3 1 3 6 13 2 9 0 22 3 6 38 28 4 1 7 1 0 0 1 0 8 8 5 3 0 0 0 1 9 11 0 10 0 8 2 5 0 17 0 0 19 0 81 6 2 0 1 6 0 2 13 0 4 0 1 3 0 1 4 0 0 5 0 40 1 0 3 1 1 2 0 0 8 14 1 0 0 0 0 1 3 0 29 7 0 1 0 0 0 0 0 0 0 0 1 0 5 0 0 5 12 0 1 0 1 0 0 5 3 3 1 0 3 4 4 1 2 1 0 0 0 1 0 9 0 0 3 1 8 10 10 0 6 8 6 0 7 1 2 6 0 1 3 4 8 1 3 0 9 0 5 1 0 0 0 0 0 0 0 0 5 0 0 0 6 0 3 15 0 0 7 0 0 27 67 0 104 3 75 0 12 29 0 249 19 8 41 2 7 6 32 0 1 0 14 2 9 73 0 15 18 0 71 23 1 0 41 0 17 0 0 7 14 0 13 24 0 16 17 27 0 0 0 0 3 9 0 0 0 0 0 11 0 0 0 0 0 0 1 1 0 1 0 23 3 26 0 10 68 0 7 1 0 10 184 7 0 20 4 0 3 0 0 3 1 0 0 0 0 0 0 0 5 13 0 0 0 0 0 31 0 0 4 13 0 5 30 25 0 0 0 0 0 0 0 47 14 0 0 27 0 0 0 7 56 0 0 1 0 0 1 77 0 78 167 0 18 0 175 0 5 27 31 200 0 90 43 0 0 0 0 0 48 5 0 0 5 0 0 1 439 0 0 0 0 7 0 0 2 37 0 6 42 0 110 14 0 11 0 163 32 0 0 22 0 0 0 274 0 2 4 11 0 0 2 0 37 42 0 13 14 6 21 62 27 25 5 3 0 13 26 0 8 13 3 0 2 13 0 23 40 0 0 0 1 0 0 0 0 0 31 32 0 0 0 0 0 12 0 0 0 1 0 0 5 13 0 5 0 0 0 14 20 1 10 0 5 91 0 192 0 20 108 0 3 0 8 131 0 125 10 12 0 1 18 0 0 0 0 8 0 90 0 139 114 117 0 3 0 6 56 0 0 4 0 3 27 0 4 0 0 9 5 0 3 2 22 0 0 4 382 0 51 0 0 27 0 10 0 0 0 19 0 59 0 0 0 0 2 2 0 13 62 0 0 0 9 0 14 9 0 1 1 1 0 53 4 0 11 5 0 6 0 30 18 6 64 0 13 13 3 18 43 2 0 0 0 10 10 0 50 6 0 1 11 33 24 0 0 204 33 0 117 199 6 18 53 0 0 0 0 5 0 14 0 1 2 0 1 0 0 49 60 0 0 2 41 0 20 24 2 0 7 79 0 38 0 0 0 3 105 0 27 67 0 0 12 0 3 10 4 0 33 47 0 10 0 0 3 45 0 1 16 0 0 86 19 3 59 1 35 71 0 2 0 35 1 49 38 9 0 87 25 0 2 0 0 0 11 0 15 0 11 0 19 18 15 25 0 8 5 61 0 0 0 0 6 119 0 92 6 0 17 10 0 4 7 0 60 72 9 0 0 7 5 0 10 0 0 1 2 9 0 3 0 0 0 0 0 0 0 0 0 0 0 1 4 0 47 1 0 0 0 0 2 1 0 0 15 0 1 5 4 3 3 0 0 1 0 0 0 41 0 0 1 0 0 3 7 0 26 37 65 0 5 13 1 2 6 0 0 13 7 0 37 0 6 27 4 0 3 0 14 0 0 0 0 3 1 0 57 109 0 1 173 0 16 0 8 0 73 162 0 4 31 0 76 1 31 2 45 9 0 65 7 0 17 0 20 0 28 0 383 0 11 0 0 1 3 0 1 1 0 0 9 1 0 16 198 21 1 2 0 26 1 9 0 0 4 0 11 0 23 45 0 8 5 37 10 33 12 0 6 4 0 12 18 0 7 160 34 0 50 60 0 13 11 0 2 0 7 5 0 26 0 10 0 13 51 0 65 14 0 49 148 0 28 27 0 29 24 0 19 37 0 16 0 85 69 39 92 0 18 42 0 0 8 0 9 0 2 0 22 0 0 92 0 0 0 0 0 2 0 0 146 4 0 0 0 0 1 6 0 17 7 0 24 0 28 0 1 7 0 14 1 0 12 0 16 0 1 0 0 7 11 0 5 9 15 0 10 1 0 19 16 0 22 6 0 0 6 5 0 0 11 64 0 0 3 0 11 17 0 0 0 3 6 0 5 0 0 32 0 0 2 0 0 0 9 2 0 23 4 0 0 1 0 0 0 2 0 0 2 0 0 2 1 0 0 0 4 0 25 16 0 1 1 0 0 33 0 0 16 2 0 0 20 15 0 37 0 0 25 3 0 0 10 5 0 9 1 0 0 2 0 0 0 59 3 0 13 0 0 5 0 0 15 1 0 0 0 0 0 0 0 0 0 0 0 7 0 5 42 0 0 0 0 0 1 0 0 16 4 0 25 10 0 18 0 28 63 0 6 19 13 0 13 3 0 16 1 0 17 56 0 0 0 3 7 0 10 4 0 12 0 0 0 11 6 0 0 4 8 0 13 7 0 0 2 27 0 2 14 0 96 9 0 4 23 0 0 12 24 0 0 0 0 9 4 0 0 2 0 4 14 0 6 30 0 13 1 0 0 1 10 0 3 16 0 1 1 0 0 0 9 0 2 5 0 0 2 0 0 0 2 0 195 4 0 0 14 6 0 16 1 0 9 0 0 0 0 3 0 153 0 1 8 3 0 15 0 0 0 0 19 0 0 24 1 0 3 3 15 0 0 39 3 0 0 84 0 0 52 4 2 545 1 0 52 6 2 0 17 5 0 7 3 0 0 1 0 0 4 23 1 0 2 1 0 4 0 0 7 0 35 24 0 0 3 0 2 4 0 0 101 3 1 27 0 0 0 0 0 4 425 5 0 0 4 4 0 24 46 0 0 80 4 6 0 0 5 0 0 37 10 1 0 1 0 0 0 0 8 0 96 10 0 30 1 0 43 12 0 9 11 0 0 0 1 0 63 9 0 0 3 0 0 5 0 0 21 1 0 8 11 0 0 3 35 0 16 138 0 40 3 0 4 7 212 0 0 4 10 170 0 7 2 0 0 6 0 27 4 0 0 18 0 0 0 6 0 7 29 0 0 7 15 0 0 53 0 0 36 0 0 1 0 0 5 0 0 6 16 0 0 70 1 0 0 99 18 0 0 0 0 6 18 0 0 15 3 0 63 20 0 51 5 0 0 113 2 0 30 0 0 67 92 0 0 0 3 2 3 0 3 0 0 0 0 1 0 68 0 2 0 11 5 0 9 0 35 5 0 0 72 3 0 0 320 1 0 0 0 32 1 0 21 16 12 0 0 1 0 6 4 0 57 3 10 0 16 25 0 5 28 0 4 7 0 0 6 2 0 0 0 0 0 18 10 0 30 1 0 7 8 0 0 0 5 0 3 0 0 3 8 0 0 9 2 0 0 6 0 95 11 0 0 19 30 0 0 0 75 0 0 5 0 1 2 0 2 1 0 0 2 3 0 16 0 0 1 1 0 0 31 18 0 18 9 0 1 4 0 15 1 1 0 14 2 0 10 1 0 37 0 0 9 4 0 0 0 9 15 0 9 0 0 3 0 0 24 3 0 24 5 0 3 0 0 0 4 4 0 5 1 0 14 0 0 31 147 2 0 24 21 0 17 0 5 0 0 26 0 3 0 13 8 0 87 3 0 6 0 6 70 0 0 0 0 2 0 131 0 0 235 25 1 25 0 2 89 0 0 18 20 1 15 12 0 14 61 0 6 0 65 0 9 17 0 28 9 0 2 1 1 0 157 23 0 13 44 0 0 1 2 0 1 11 0 0 0 0 0 1 0 0 6 0 0 0 2 0 0 1 12 0 2 0 0 0 0 1 0 0 SP356 Bacteria;Proteobacteria;Gammaproteobacteria;Cardiobacteriales;Cardiobacteriaceae;Cardiobacterium;valvarum 0 0 24 0 0 0 0 4 0 0 0 3 71 0 20 2 0 34 2 9 0 0 1 3 2 0 0 2 12 4 0 1 3 2 3 0 0 0 2 0 2 0 0 0 2 0 0 0 77 0 1 2 0 2 0 0 2 12 2 1 10 0 0 0 2 15 4 0 7 3 0 4 6 0 0 2 0 0 0 0 2 1 4 1 0 2 1 0 1 0 1 0 9 18 0 1 6 25 2 0 0 0 2 0 0 2 1 27 0 0 0 0 0 6 5 1 1 0 2 0 10 0 2 8 1 1 0 5 0 14 1 20 0 10 0 3 0 16 0 1 3 8 0 3 16 0 0 12 0 1 0 0 34 0 0 0 2 0 0 1 0 7 2 3 1 0 1 1 5 0 0 0 1 2 0 0 3 0 0 0 0 0 0 6 0 3 1 0 0 5 0 1 0 0 0 0 0 0 0 13 2 1 0 0 1 0 0 1 3 0 0 2 0 0 1 0 0 2 1 6 2 1 1 7 0 19 1 0 8 0 14 0 1 1 2 2 3 2 0 4 0 0 0 0 0 0 1 0 0 0 1 0 0 1 0 0 16 0 0 3 1 0 1 0 0 1 0 0 0 39 4 0 2 0 24 0 6 1 50 0 34 70 0 7 13 0 0 0 3 19 69 0 1 0 66 4 5 34 0 0 1 830 2 8 0 4 9 0 88 0 67 8 0 0 0 6 0 29 3 0 0 8 0 0 0 0 0 0 0 0 0 0 1 0 0 0 0 0 0 0 0 0 0 53 0 2 83 0 20 0 2 5 0 0 0 0 0 1 4 0 0 1 0 11 1 10 0 10 104 0 0 0 0 43 22 0 0 0 0 0 0 0 31 6 0 86 108 0 2 0 0 0 0 86 230 30 7 0 6 12 0 0 0 2 874 0 0 13 4 0 1 11 0 18 0 0 1 0 0 0 3 2 2 10 0 0 0 0 1 0 0 0 1 19 0 60 61 0 0 0 11 5 0 0 0 0 0 0 54 7 0 0 3 0 0 1 0 2 0 91 5 0 1 33 16 1 0 2 4 0 1 14 0 41 0 0 0 0 10 0 25 0 0 1 148 25 81 415 0 0 0 0 24 27 61 0 0 3 0 1 1 0 0 0 0 0 1 1 0 1 1 1 1 0 0 0 1 6 0 2 0 3 2 0 0 0 0 0 0 15 0 116 0 0 77 0 11 1 0 1 0 12 0 0 10 4 47 5 0 0 20 1 0 0 3 11 0 3 0 43 0 3 0 2 0 8 0 0 0 14 6 0 2 0 0 4 488 0 2 0 0 16 21 0 0 0 53 0 124 0 0 0 0 0 0 3 0 5 0 0 0 0 0 263 47 0 0 0 0 2 0 19 116 0 0 45 0 0 1 15 79 0 0 0 2 0 0 0 1 11 110 5 1 2 27 0 1 0 25 0 0 0 0 2 0 0 0 5 0 0 4 1 0 10 79 0 0 0 224 5 138 0 222 106 72 104 23 0 9 4 0 0 0 9 0 3 1 0 2 0 0 27 25 0 0 26 46 0 25 47 17 0 0 2 0 0 0 0 0 0 271 16 5 8 0 0 2 0 0 38 3 6 17 0 0 0 0 0 33 2 0 0 6 0 0 0 119 32 11 0 1 0 10 6 0 7 1 12 57 6 75 95 83 0 48 0 0 42 56 1 28 5 34 0 21 422 17 58 0 69 9 28 0 1 0 0 31 3 0 1 40 0 19 34 0 0 11 0 108 188 12 4 0 1 0 10 0 3 5 0 0 21 0 2 0 1 3 0 0 0 1 0 0 0 0 43 47 0 7 5 7 0 0 0 0 7 0 0 43 3 0 0 45 30 0 0 0 0 0 0 0 14 1 0 1 0 0 0 0 14 0 0 0 0 0 1 0 0 1 0 0 1 0 0 20 1 0 0 1 0 1 0 0 0 4 1 0 9 6 2 114 46 0 7 0 2 0 0 72 0 22 6 0 0 0 0 0 1 252 6 8 0 0 1 0 0 1 0 90 2 9 0 6 0 0 0 0 4 4 0 5 2 0 0 192 85 0 0 0 5 1 0 0 182 0 0 0 50 172 0 45 11 14 60 0 0 0 4 3 0 1 0 30 7 0 122 1 0 34 0 5 0 13 113 0 33 10 0 0 0 0 8 0 9 0 2 0 15 135 0 52 2 0 36 136 0 3 1 0 0 0 0 51 30 4 0 0 37 0 9 56 0 0 17 0 2 12 0 0 0 1 152 37 0 0 2 0 0 0 0 0 0 0 0 391 34 0 0 0 0 0 0 49 3 0 0 12 1 12 0 0 14 1 4 0 0 14 0 10 0 8 4 0 18 0 0 1 0 25 1 5 4 0 0 1 0 68 4 0 0 116 2 0 0 13 0 0 0 7 0 0 13 0 0 13 12 50 0 0 0 0 0 0 0 0 13 0 0 5 0 0 2 26 6 0 0 87 0 0 0 0 0 25 4 0 1 2 0 0 7 2 0 0 0 0 4 0 0 35 0 0 0 1 3 0 0 1 0 0 4 0 0 1 76 21 0 0 5 0 0 4 0 0 0 0 0 0 85 24 0 1 1 0 0 29 0 0 0 3 0 0 0 1 0 0 0 0 3 2 2 0 0 0 1 12 0 0 0 0 0 0 5 0 0 5 7 0 0 0 0 0 0 14 0 11 0 17 40 0 17 1 0 0 0 0 0 1 14 19 0 1 6 0 0 1 1 0 9 5 0 0 36 0 0 0 0 0 0 0 97 0 4 12 0 6 10 0 0 0 0 0 5 10 0 0 0 0 44 6 0 0 1 0 7 47 1 0 5 0 11 2 0 2 8 12 0 13 9 0 16 3 0 0 1 5 0 27 145 0 6 3 0 5 1 1 0 2 0 0 0 24 51 0 16 0 0 0 2 0 1 13 2 0 11 0 0 10 0 0 8 5 1 0 0 27 0 1 0 1 0 0 0 0 2 0 61 13 0 0 103 0 0 62 0 0 38 2 0 53 127 0 0 49 3 0 115 3 0 0 6 1 0 1 2 0 0 0 2 0 7 3 1 0 0 4 1 8 0 2 0 0 0 0 0 15 4 6 2 0 0 0 0 0 1 0 11 0 0 2 2 0 10 131 0 0 7 1 0 0 0 0 0 0 0 0 0 0 0 0 0 0 0 1 0 0 0 0 1 0 0 0 0 0 1 15 0 0 2 10 0 3 0 0 0 5 0 0 38 2 0 3 0 0 3 28 0 0 2 19 0 2 6 0 1 1 0 0 37 0 0 0 0 42 3 0 0 3 0 0 0 0 2 1 0 0 9 12 0 1 22 0 3 0 1 0 0 0 0 0 0 0 0 0 0 0 3 1 0 7 3 0 13 16 4 0 0 2 0 0 2 2 0 0 0 0 0 2 0 0 4 5 0 4 0 0 30 13 0 0 25 1 0 0 7 0 7 20 0 1 0 20 0 3 0 14 1 0 0 4 3 0 9 1 3 0 3 28 0 6 0 0 14 0 0 2 1 0 0 9 0 0 30 0 59 3 1 0 0 112 0 0 6 1 2 0 0 0 0 0 0 46 15 0 33 0 0 16 0 0 0 11 28 0 0 0 0 0 18 1 0 3 0 0 31 0 1 0 1 6 0 7 2 0 0 0 0 0 6 13 0 8 0 0 11 14 7 0 6 14 0 0 1 1 0 6 1 0 0 1 0 0 13 0 0 2 4 0 11 0 0 16 1 5 0 9 131 0 64 25 0 0 6 0 0 0 0 0 0 0 0 12 4 0 114 0 0 2 3 0 0 0 4 50 0 5 19 0 7 0 0 72 24 0 0 7 7 0 0 0 0 0 0 0 2 0 0 25 0 0 1 26 1 0 0 0 0 3 18 0 0 0 0 19 18 0 2 4 0 8 0 0 0 0 1 0 0 0 0 0 0 0 6 1 0 31 0 0 0 0 62 54 0 0 0 2 0 0 0 0 12 7 0 2 0 6 0 2 14 0 3 3 2 9 1 0 0 10 3 0 12 17 0 0 3 8 0 10 4 0 0 0 0 0 0 0 0 33 82 0 0 7 2 0 0 0 0 5 0 0 0 0 1 0 0 SP358 Bacteria;Actinobacteria;Actinomycetia;Micrococcales;Micrococcaceae;Rothia;mucilaginosa 11463 44999 13955 20412 32108 29060 37726 20349 32616 21035 6336 2553 9039 12988 12183 13990 34661 10696 8027 6949 12092 21508 25479 6262 16005 10270 11283 18416 21066 3268 5908 6872 17779 12251 13771 24646 10223 5800 10901 5760 8957 10690 9536 11411 16825 4057 11626 10334 4197 18361 8013 3622 3835 15179 14486 11908 21012 29815 12668 4689 28747 15240 23207 13315 18257 6843 16941 4004 35557 8931 8543 11897 15278 12334 17978 7364 11748 7683 9437 8472 10872 16317 13516 4821 14832 9514 9944 15148 10455 6594 6502 9732 4949 9572 24641 31618 6773 15301 11904 13763 12172 3694 12184 18931 20615 15577 17867 6148 8045 13456 11964 32173 5058 14451 6997 7382 6996 17168 3701 14192 14502 4034 4914 11439 6967 18088 9625 8637 7757 5698 8274 8084 9872 10772 2775 5204 4793 11582 71373 16989 4089 3637 6285 19416 5609 7958 7570 3395 14191 26219 6511 14277 11745 15637 16476 19885 4935 19130 11469 11765 29730 5259 27566 7150 14236 25973 10603 21551 10679 32088 1767 30325 25000 22423 32816 29570 19146 17026 35325 36464 13057 32426 26258 7279 9424 25877 13670 12344 18802 15660 13327 40568 10285 7230 25069 5956 10162 14428 12762 31685 18793 10706 11807 11496 11710 2482 3849 4437 12866 36078 6100 8491 8144 13516 18777 10907 3636 11074 11586 13179 2516 11469 26584 9890 9179 12335 9904 36854 10597 5957 10345 11328 31699 5908 53374 16780 6500 17887 6288 9290 11990 8198 4608 18424 15970 19869 8924 8404 3789 11092 8186 6957 19355 3615 28676 20591 9473 22171 13372 11756 13028 12257 15011 14653 15350 13786 16554 21064 1 2 1 591 10 0 15 53 3 1 4 23 3 3 3 9 3 4 3 10 0 31 3 2 1 32 1 5 10 6 0 4 4 28 0 2 9 29 7 19 4 82 1 6 2 4 0 0 4 9 1 32 3 2 0 0 0 20 3 0 1 0 1 5 0 5 0 3 1 1 1 0 3 3 0 1 2 3 25 23 102 2 4 2 4 7 8 7 0 5 6 370 2 11 84 28 2 1 0 11 2 0 1 0 1 2 42 9 23 17 4 1 1 0 1 3 34 12 2 0 0 19 6 1 0 1 1 0 1 5 8 0 3 0 1 5 9 0 0 20 12 0 3 2 12 1 1 9 5 0 3 6 5 10 8 0 22 0 2 7 4 3 2 1 4 2 6 6 1 11 7 2 0 1 0 6 5 27 7 168 0 4 3 12 1 2 0 3 0 252 11 3 0 0 166 18 3 33 11 1 1 0 7 0 13 5 10 28 4 17 1 7 4 1 74 12 3 29 2 2 1 3 2 6 1 0 0 0 5 1 393 10 9 1 8 2 0 11 3 2 14 0 0 0 2 5 3 11 0 0 0 0 17 1 1 5 1 3 0 1 4 2 0 3 0 2 0 0 3 0 0 6 23 0 1 63 6 8 6 7 2 0 3 0 0 0 4 0 3 2 9 2 9 0 4 0 4 4 0 0 0 3 13 0 34 80 0 1 0 0 8 0 2 15 3 0 42 4 1 4 4 3 2 16 0 2 6 4 3 0 0 0 0 0 585 2 2 6 0 3 13 10 2 19 1 5 3 65 5 4 0 0 5 1 7 0 3 17 1 3 4 0 12 0 9 0 11 1 3 43 1 16 9 2 2 2 2 10 0 4 1 4 1 2 1 2 2 5 4 5 5 8 39 73 8 2 0 0 34 1 6 1 3 2 4 0 20 2 0 9 2 11 3 6 2 49 28 2 1 3 3 0 0 142 8 2 0 2 28 3 4 1 4 2 6 6 0 14 1 47 15 4 68 47 0 0 342 10 0 10 5 5 2 1 1 5 2 10 3 12 2 25 1 0 65 21 0 8 42 2 3 0 1 29 10 5 2 0 1 1 9 3 3 8 4 0 2 2 4 10 15 3 6 0 3 12 2 4 1 8 19 3 3 1 1 6 28 2 1 1 4 8 66 2 0 2 0 12 1 0 3 11 12 11 4 1 2 0 0 0 4 6 5 0 80 1 4 8 1 1 1 4 2 17 10 5 0 1 3 7 3 7 46 9 2 28 376 801 11 18 3 29 21 1 6 0 16 12 0 0 0 0 0 1 12 0 3 9 1 56 6 2 4 4 15 8 1 1 4 6 1 0 2 0 0 0 55 19 14 0 0 2 4 1 0 0 0 0 4 10 6 156 9 48 4 1 14 4 5 1 4 3 3 15 226 18 3 2 3 0 3 9 3 33 1 7 5 10 4 0 1 0 0 1 0 4 4 14 0 12 2 2 2 0 1 1 18 7 30 1 0 1 5 1 1 1 81 1 1 3 1 0 1 0 18 2 10 3 0 7 1 0 0 8 3 67 6 2 0 95 1 6 1 3 11 2 0 0 9 6 2 25 24 4 95 164 7 0 1 0 3 1 2 2 1 4 1 4 0 1 2 5 12 24 1 1 16 0 0 3 1 9 17 0 8 1 1 0 2 5 31 6 3 0 13 4 1 12 1 0 21 33 1 1 1 2 1 10 136 45 48 652 524 240 85 45 87 133 157 127 25 182 38 1 229 339 181 490 230 100 11 59 833 20 680 553 186 115 310 288 77 32 4 24 71 61 85 133 91 47 9 41 85 353 118 78 42 342 5 662 56 0 47 22 129 855 51 45 83 185 29 160 186 32 141 445 251 80 26 17 111 563 438 228 10 15 41 5 19 27 127 43 18 25 6 71 41 247 305 673 557 216 9 412 87 269 19 992 20 62 26 236 314 327 414 94 33 323 855 156 1132 142 1839 196 12 51 62 802 794 20 8 26 30 14 471 563 127 73 141 85 113 252 354 295 181 150 588 18 15 150 47 2 216 176 8 394 133 37 591 90 929 723 198 82 101 52 10 28 96 64 965 112 91 191 441 6 111 114 43 51 354 161 53 1047 88 102 12 120 300 485 135 135 172 128 13 389 26 52 18 683 58 240 512 27 72 453 295 24 191 265 20 28 124 142 14 146 174 125 332 47 3 67 56 392 48 129 1 18 207 37 68 366 43 629 144 31 80 79 114 63 693 127 21 73 826 10 77 115 124 74 103 368 13 147 42 18 8 3 34 5 50 44 74 246 29 14 3 91 83 36 530 22 31 115 133 93 11 76 12 0 318 56 17 66 277 58 23 33 32 32 142 247 16 60 99 36 215 309 18 44 3 543 597 157 36 27 1461 150 128 149 120 856 286 14 4 290 2 46 59 139 10 7 64 595 13 318 926 445 1002 154 147 493 423 148 56 10 1150 335 548 83 569 35 26 1084 16 1581 124 94 630 380 48 473 15 113 188 151 140 37 517 132 218 191 129 993 228 174 30 24 97 92 4 52 3320 186 79 196 32 105 66 97 43 198 143 222 52 12 89 129 690 124 222 28 965 29 0 27 75 1 261 100 5 62 40 655 83 20 25 614 708 682 152 432 11 32 551 457 1525 72 96 78 16 419 57 358 120 611 942 2942 294 1432 178 27 96 34 1395 131 106 194 200 36 44 0 68 253 3 170 1099 44 4 391 961 264 136 68 92 57 173 156 13 176 55 69 198 67 28 166 106 367 10 476 2464 343 760 567 151 82 279 20 29 697 267 0 206 892 18 139 60 188 44 1802 20 64 36 202 1430 705 552 441 302 116 1340 305 2 798 115 68 302 495 180 1320 430 426 73 337 589 635 214 173 1 67 668 696 114 3 81 994 62 10 261 358 152 5 567 82 113 8 376 134 13 40 125 437 157 1 232 31 112 11 214 141 2 495 140 106 111 58 54 45 194 5 32 394 145 13 440 80 2 342 163 193 29 213 36 8 298 4 14 124 349 86 126 315 40 89 27 61 418 55 452 76 33 130 170 58 255 86 5 109 149 133 26 482 71 84 107 277 137 160 238 42 43 245 61 100 156 38 230 590 146 49 8 68 183 221 45 121 92 60 521 155 257 321 220 43 47 138 179 54 31 218 187 487 106 217 5 80 275 20 44 52 958 553 453 21 477 1188 127 1238 483 72 97 320 115 16 180 11 96 57 190 84 300 152 149 403 8 325 1121 833 1915 1131 4 161 73 1 638 114 74 59 202 55 360 806 423 108 158 213 499 100 14 17 20 0 14 43 1 40 9 137 15 83 735 497 724 26 526 19 131 10 55 484 780 756 240 65 108 174 9 675 21 474 671 37 268 256 71 1421 215 264 260 55 35 39 8 736 167 69 14 150 40 8 272 4 46 94 248 27 10 45 329 161 176 140 4 409 131 22 8 398 83 22 211 303 22 260 317 1774 32 19 311 41 2100 31 94 151 136 201 63 80 44 50 1079 213 22 23 130 167 796 20 116 127 408 44 140 7 5 1053 SP359 Bacteria;Actinobacteria;Actinomycetia;Actinomycetales;Actinomycetaceae;Actinomyces;johnsonii 1 6 595 11 20 18 2 62 28 3 5 39 228 11 245 25 39 198 2 7 3 15 19 227 35 0 34 44 227 306 0 11 300 15 11 11 0 61 4 198 0 0 4 15 1 0 20 185 176 10 9 56 2 54 0 1 0 3 26 0 24 12 4 0 0 39 68 5 6 3 60 44 31 0 4 1 10 0 0 64 0 5 27 3 1 13 12 21 0 18 4 4 37 68 3 52 28 25 10 7 12 63 0 0 41 20 1 50 1 63 46 30 0 11 0 0 4 0 8 0 2 53 3 12 2 1 1 1 3 729 3 26 0 14 0 51 17 49 22 0 0 62 1 0 0 11 46 7 1 2 15 8 61 0 16 1 4 1 9 24 1 138 2 19 37 0 113 6 723 0 5 12 0 6 21 2 6 3 2 0 1 35 11 8 1 10 0 9 0 3 1 6 8 0 11 0 0 1 8 35 10 12 6 0 1 0 1 204 117 2 9 5 47 0 32 22 0 21 11 17 19 1 36 606 5 0 3 137 180 9 35 25 216 0 31 0 11 23 11 6 0 1 7 18 105 38 9 13 0 17 0 7 4 11 5 9 9 5 0 1 16 0 4 6 3 15 0 0 0 0 0 0 0 0 0 0 0 0 0 0 0 0 0 0 0 0 0 0 0 0 0 0 0 0 0 0 0 0 0 0 0 0 0 0 0 0 0 0 0 0 0 0 0 0 0 0 0 0 0 0 0 0 0 0 0 0 0 0 0 0 0 0 0 0 0 0 0 0 0 0 0 0 0 0 0 0 0 0 0 0 0 0 0 0 0 0 0 0 0 0 0 0 0 0 0 0 0 0 0 0 0 0 0 0 0 0 0 0 0 0 0 0 0 0 0 0 0 0 0 0 0 0 0 0 0 0 0 0 0 0 0 0 0 0 0 0 0 0 0 0 0 0 0 0 0 0 0 0 0 0 0 0 0 0 0 0 0 0 0 0 0 0 0 0 0 0 0 0 0 0 0 0 0 0 0 0 0 0 0 0 0 0 0 0 0 0 0 0 0 0 0 0 0 0 0 0 0 0 0 0 0 0 0 0 0 0 0 0 0 0 0 0 0 0 0 0 0 0 0 0 0 0 0 0 0 0 0 0 0 0 0 0 0 0 0 0 0 0 0 0 0 0 0 0 0 0 0 0 0 0 0 0 0 0 0 0 0 0 0 0 0 0 0 0 0 0 0 0 0 0 0 0 0 0 0 0 0 0 0 0 0 0 0 0 0 0 0 0 0 0 0 0 0 0 0 0 0 0 0 0 0 0 0 0 0 0 0 0 0 0 0 0 0 0 0 0 0 0 0 0 0 0 0 0 0 0 0 0 0 0 0 0 0 0 0 0 0 0 0 0 0 0 0 0 0 0 0 0 0 0 0 0 0 0 0 0 0 0 0 0 0 0 0 0 0 0 0 0 0 0 0 0 0 0 0 0 0 0 0 0 0 0 0 0 0 0 0 0 0 0 0 0 0 0 0 0 0 0 0 0 0 0 0 0 0 0 0 0 0 0 0 0 0 0 0 0 0 0 0 0 0 0 0 0 0 0 0 0 0 0 0 0 0 0 0 0 0 0 0 0 0 0 0 0 0 0 0 0 0 0 0 0 0 0 0 0 0 0 0 0 0 0 0 0 0 0 0 0 0 0 0 0 0 0 0 0 0 0 0 0 0 0 0 0 0 0 0 0 0 0 0 0 0 0 0 0 0 0 0 0 0 0 0 0 0 0 0 0 0 0 0 0 0 0 0 0 0 0 0 0 0 0 0 0 0 0 0 0 0 0 0 0 0 0 0 0 0 0 0 0 0 0 0 0 0 0 0 0 0 0 0 0 0 0 0 0 0 0 0 0 0 0 0 0 0 0 0 0 0 0 0 0 0 0 0 0 0 0 0 0 0 0 0 0 0 0 0 0 0 0 0 0 0 0 0 0 0 0 0 0 0 0 0 0 0 0 0 0 0 0 0 0 0 0 0 0 0 0 0 0 0 0 0 0 0 0 0 0 0 0 0 0 0 0 0 0 0 0 0 0 0 0 0 0 0 0 0 0 0 0 0 0 0 0 0 0 0 0 0 0 0 0 0 0 0 0 0 0 0 0 0 0 0 0 0 0 0 0 0 0 0 0 0 0 0 0 0 0 0 0 0 0 0 0 0 0 0 0 0 0 0 0 0 0 0 0 0 0 0 0 0 0 0 0 0 0 0 0 0 0 0 0 0 0 0 0 0 0 0 0 0 0 0 0 0 0 0 0 0 0 0 0 0 0 0 0 0 0 0 0 0 0 0 0 0 0 0 0 0 0 0 0 0 0 0 0 0 0 0 0 0 0 0 0 0 0 0 0 0 0 0 0 0 0 0 0 0 0 0 0 0 0 0 0 0 0 0 0 0 0 0 0 0 0 0 0 0 0 0 0 0 0 0 0 0 0 0 0 0 0 0 0 0 0 0 0 0 0 0 0 0 0 0 0 0 0 0 0 0 0 0 0 0 0 0 0 0 0 0 0 0 0 0 0 0 0 0 0 0 0 0 0 0 0 0 0 0 0 0 0 0 0 0 0 0 0 0 0 0 0 0 0 0 0 0 0 0 0 0 0 0 0 0 0 0 0 0 0 0 0 0 0 0 0 0 0 0 0 0 0 0 0 0 0 0 0 0 0 0 0 0 0 0 0 0 0 0 0 0 0 0 0 0 0 0 0 0 0 0 0 0 0 0 0 0 0 0 0 0 0 0 0 0 0 0 0 0 0 0 0 0 0 0 0 0 0 0 0 0 0 0 0 0 0 0 0 0 0 0 0 0 0 0 0 0 0 0 0 0 0 0 0 0 0 0 0 0 0 0 0 0 0 0 0 0 0 0 0 0 0 0 0 0 0 0 0 0 0 0 0 0 0 0 0 0 0 0 0 0 0 0 0 0 0 0 0 0 0 0 0 0 0 0 0 0 0 0 0 0 0 0 0 0 0 0 0 0 0 0 0 0 0 0 0 0 0 0 0 0 0 0 0 0 0 0 0 0 0 0 0 0 0 0 0 0 0 0 0 0 0 0 0 0 0 0 0 0 0 0 0 0 0 0 0 0 0 0 0 0 0 0 0 0 0 0 0 0 0 0 0 0 0 0 0 0 0 0 0 0 0 0 0 0 0 0 0 0 0 0 0 0 0 0 0 0 0 0 0 0 0 0 0 0 0 0 0 0 0 0 0 0 0 0 0 0 0 0 0 0 0 0 0 0 0 0 0 0 0 0 0 0 0 0 0 0 0 0 0 0 0 0 0 0 0 0 0 0 0 0 0 0 0 0 0 0 0 0 0 0 0 0 0 0 0 0 0 0 0 0 0 0 0 0 0 0 0 0 0 0 0 0 0 0 0 0 0 0 0 0 0 0 0 0 0 0 0 0 0 0 0 0 0 0 0 0 0 0 0 0 0 0 0 0 0 0 0 0 0 0 0 0 0 0 0 0 0 0 0 0 0 0 0 0 0 0 0 0 0 0 0 0 0 0 0 0 0 0 0 0 0 0 0 0 0 0 0 0 0 0 0 0 0 0 0 0 0 0 0 0 0 0 0 0 0 0 0 0 0 0 0 0 0 0 0 0 0 0 0 0 0 0 0 0 0 0 0 0 0 0 0 0 0 0 0 0 0 0 0 0 0 0 0 0 0 0 0 0 0 0 0 0 0 0 0 0 0 0 0 0 0 0 0 0 0 0 0 0 0 0 0 0 0 0 0 0 0 0 0 0 0 0 0 0 0 0 0 0 0 0 0 0 0 0 0 0 0 0 0 0 0 0 0 0 0 0 0 0 0 0 0 0 0 0 0 0 0 0 0 0 0 0 0 0 0 0 0 0 0 0 0 0 0 0 0 0 0 0 0 0 0 0 0 0 0 0 0 0 0 0 0 0 0 0 0 0 0 0 0 0 0 0 0 0 0 0 0 0 0 0 0 0 0 0 0 0 0 0 0 0 0 0 0 0 0 0 0 0 0 0 0 0 0 0 0 0 0 0 0 0 0 0 0 0 0 0 0 0 0 0 0 0 0 0 0 0 0 0 0 0 0 0 0 0 0 0 0 0 0 0 0 0 0 0 0 SP36 Bacteria;Firmicutes;Clostridia;Clostridiales;Lachnospiraceae_[XIV];Lachnoanaerobaculum;orale 43 160 0 78 1 17 0 90 0 29 168 2 6 2 1 181 1 4 560 520 68 7 13 99 80 269 2 165 7 0 1 264 3 20 171 56 109 32 11 2 120 0 1 470 53 29 37 82 0 0 652 982 1013 2 364 11 369 38 1 54 0 4 1 12 41 2 1 1571 13 11 202 75 0 23 24 0 31 29 36 13 9 65 32 106 856 92 108 58 3 763 0 65 3 3 106 14 0 0 1 143 44 84 11 0 2 0 346 6 3 4 12 7 42 49 141 2 44 159 379 21 21 46 50 49 460 142 523 279 403 1 14 2 101 3 139 35 958 36 6 1 5 0 9 0 0 560 40 54 148 0 578 0 109 86 38 88 83 11 35 206 0 3 15 7 2 212 16 220 4 26 2 7 0 3 436 14 2 2 0 3 25 1 4 941 1049 0 66 12 67 497 16 0 254 94 332 102 1339 632 68 5 0 1 188 0 21 3949 0 0 6 4 336 8 171 36 159 353 17 466 0 19 36 193 48 27 1107 64 87 6 22 1562 364 0 104 5 93 0 396 201 139 8 8 7 1178 44 2 101 89 12 2897 84 421 0 0 43 1 1 0 22 90 176 22 446 2 38 57 47 1154 1451 0 0 2 1 0 0 1 2 0 0 23 1 6 16 63 10 4 2 6 0 0 9 0 7 2 10 0 0 0 0 0 29 5 4 34 28 3 1 16 0 2 0 2 0 1 0 26 6 0 1 1 87 0 0 6 0 63 0 0 0 0 2 4 0 0 0 0 0 0 0 3 0 0 3 0 0 0 0 3 0 1 0 0 0 0 0 1 0 0 1 0 0 1 0 0 7 0 0 0 1 0 0 0 0 128 0 0 0 2 1 0 0 0 0 0 0 1 0 0 0 0 0 0 0 0 0 0 0 0 0 0 2 0 0 0 2 0 0 0 0 0 0 1 0 0 0 0 0 0 0 0 0 0 0 66 0 0 1 1 1 0 0 0 0 0 1 0 0 2 1 0 0 11 3 3 0 0 0 0 2 4 2 19 2 3 0 52 0 0 0 1 0 0 0 0 0 0 0 134 4 0 0 11 0 1 3 0 0 2 2 1 8 2 15 25 1 3 0 1 0 0 0 1 1 83 1 1 0 0 0 2 0 12 0 0 2 0 0 5 0 2 12 0 27 1 0 0 1 7 2 0 0 0 8 0 0 1 1 0 0 0 0 0 0 0 2 0 0 0 5 0 0 0 0 1 7 0 0 0 8 0 3 0 3 0 0 0 0 0 1 1 13 0 7 2 8 9 59 0 0 0 0 19 0 0 1 0 0 0 0 0 0 0 0 0 0 1 0 0 0 0 2 17 0 1 0 0 1 0 0 0 0 0 23 0 1 0 0 0 1 1 0 0 0 0 0 1 0 3 0 2 0 0 0 0 0 0 2 0 0 0 4 0 0 0 0 0 0 12 0 3 0 4 1 0 0 1 0 0 0 1 2 1 0 0 1 1 19 5 1 0 26 1 0 8 7 0 0 0 0 0 1 0 0 0 0 0 1 0 0 0 1 6 0 0 0 0 0 0 0 0 0 0 0 9 0 0 14 0 0 41 0 0 0 26 0 0 0 11 0 47 41 4 0 2 1 1 0 0 0 0 4 1 0 1 0 0 2 0 0 0 1 1 31 0 0 0 1 0 1 0 1 0 0 0 0 0 0 0 0 0 0 0 0 0 0 0 0 0 0 0 1 0 0 0 0 1 0 0 2 1 9 1 0 1 0 0 3 0 0 0 0 0 0 0 35 7 3 0 0 0 0 0 0 0 0 1 0 33 0 29 0 0 0 4 3 0 0 0 0 0 0 0 0 0 0 0 0 0 0 0 0 10 0 1 2 0 0 0 0 1 2 0 0 0 0 0 0 0 1 0 0 1 2 0 0 3 0 59 0 0 0 0 0 0 0 0 1 1 0 0 0 6 0 0 9 0 1 0 0 4 0 0 0 0 2 4 0 0 1 0 3 0 2 0 11 17 0 21 0 0 0 0 3 2 0 1 7 1 0 1 0 4 0 15 0 3 0 8 0 0 0 0 0 0 0 0 0 0 1 0 0 0 0 1 0 0 2 1 0 0 0 0 0 5 0 4 0 0 0 1 1 2 1 0 2 0 0 0 2 2 0 8 0 25 2 0 1 5 0 0 0 0 2 1 1 1 0 1 0 0 0 29 0 4 1 0 0 15 8 142 4 0 0 0 3 0 2 0 8 1 0 0 0 25 0 0 1 0 1 100 2 6 1 0 102 0 15 0 0 0 0 0 1 0 0 0 1 0 0 0 1 0 1 0 0 25 0 0 7 2 8 1 26 4 3 12 61 2 0 4 1 0 1 12 1 0 0 3 9 2 13 3 0 17 85 1 13 7 5 0 2 0 0 15 4 2 18 6 1 0 25 2 4 0 0 0 2 0 0 0 0 4 0 0 0 3 3 0 0 2 1 1 1 1 0 17 1 1 0 9 1 1 1 0 0 0 0 0 0 0 0 1 6 0 14 0 0 27 27 3 3 0 0 2 0 1 134 1 1 0 0 4 87 2 0 0 0 14 0 15 0 34 0 0 1 0 6 0 0 0 1 2 0 0 72 49 8 0 0 1 0 3 0 0 0 1 0 0 0 1 0 0 6 0 16 1 0 3 0 0 4 5 0 0 0 1 0 0 0 3 0 13 0 0 0 5 33 0 0 1 1 12 5 0 19 0 1 0 2 1 48 2 2 0 2 0 0 1 1 0 0 17 4 5 10 30 4 30 0 0 39 7 15 3 3 11 9 33 3 4 0 0 3 0 13 0 16 0 2 0 47 0 0 0 0 0 0 2 0 1 2 0 0 0 0 0 0 1 2 3 3 0 9 0 0 0 0 0 0 0 0 0 0 0 0 4 10 0 0 10 0 2 2 5 18 0 6 1 0 18 0 0 3 14 0 0 1 4 0 38 0 1 0 3 6 6 178 2 0 0 0 4 26 2 0 0 0 0 0 0 13 3 0 0 1 7 0 0 0 1 0 4 0 0 14 6 0 0 1 0 0 0 1 0 0 2 0 1 1 0 0 0 5 10 37 5 5 66 0 0 0 0 0 0 0 1 1 0 19 1 2 0 7 1 0 7 0 5 0 0 3 0 4 2 1 0 2 2 0 0 1 4 7 27 0 6 0 0 0 0 0 4 2 0 6 47 1 2 1 0 0 0 1 2 0 1 12 30 11 0 0 0 1 1 260 0 4 0 1 3 0 5 2 2 18 1 0 0 16 7 2 0 0 0 1 0 1 2 1 2 1 0 0 0 0 25 0 0 22 4 1 0 3 0 1 19 0 0 0 0 1 3 0 0 0 3 0 0 0 35 10 0 8 3 2 0 0 0 0 0 0 0 0 0 0 0 1 1 9 1 9 0 0 6 1 14 3 1 0 1 4 0 8 0 3 3 9 7 42 2 4 0 0 0 0 0 1 3 0 8 4 0 0 0 1 2 1 72 1 0 0 5 0 0 0 0 0 0 0 4 0 1 0 6 0 0 0 1 3 17 50 0 0 0 0 0 0 10 0 0 22 0 3 0 1 0 33 3 3 0 19 0 0 0 0 2 6 4 9 0 42 11 2 0 0 0 0 1 1 2 4 1 1 4 16 0 5 12 2 7 0 2 3 17 3 1 0 6 0 0 2 0 1 2 2 0 0 4 0 0 0 22 0 3 3 1 2 40 0 0 13 3 0 3 3 0 0 0 0 0 0 0 17 2 1 5 1 0 0 1 0 9 1 53 0 0 10 28 6 1 17 2 0 0 0 0 0 11 0 2 1 0 0 0 0 1 0 9 8 1 16 0 0 0 0 0 1 0 0 0 0 12 7 4 1 6 1 0 10 0 1 0 5 0 0 4 0 5 9 9 106 2 0 0 0 239 0 1 5 7 10 6 10 1 0 4 33 0 1 1 0 1 0 4 41 1 4 0 1 1 0 0 4 3 5 8 2 1 0 1 0 2 0 5 0 3 10 1 0 0 6 0 2 0 3 2 0 5 3 0 4 0 12 88 5 2 0 1 4 0 0 0 0 0 1 8 3 0 0 27 0 0 0 32 5 11 3 0 0 3 0 0 1 0 7 SP360 Bacteria;Saccharibacteria_(TM7);Saccharibacteria_(TM7)_[C-1];Saccharibacteria_(TM7)_[O-1];Saccharibacteria_(TM7)_[F-1];Saccharibacteria_(TM7)_[G-1];bacterium HMT346 2 0 1 11 92 85 0 6 1001 1 1 30 1252 5 0 0 27 0 0 3 9 1 0 0 28 42 0 0 50 131 7 0 0 61 0 9 6 1985 0 0 0 1 2 1 0 0 0 0 92 57 1 55 9 25 3 0 0 2 0 30 0 0 0 0 0 4 0 0 551 5 1 2 31 0 0 9 8 1 2 111 0 0 16 7 6 7 1 13 0 5 0 0 413 338 4 2 0 26 73 6 11 79 0 0 28 16 0 218 3 2 1 135 24 22 9 0 0 0 5 0 0 3 2 19 1 5 5 6 2 69 1 14 0 0 1 2 0 0 32 5 3 1 0 26 3 3 34 5 5 0 0 0 75 23 7 1 0 0 14 0 3 0 0 233 12 0 53 17 80 9 0 0 0 98 4 0 18 11 0 0 0 0 0 9 0 0 4 0 0 3 1 8 4 14 11 0 0 0 2 13 3 4 14 0 0 0 0 0 75 3 1 0 18 7 64 3 34 28 1 32 4 26 0 3 0 0 5 0 0 8 0 2 1893 51 18 21 62 10 10 78 1 0 0 0 39 26 16 9 0 0 10 0 0 26 2 0 50 107 0 2 0 3 57 23 3 14 0 27 0 0 0 0 2 0 0 0 9 0 41 0 3 0 0 83 0 0 0 0 0 0 0 0 0 0 0 0 0 0 0 0 0 0 92 21 0 0 2 0 3 0 0 0 0 0 1 52 0 0 0 0 0 1 0 0 0 0 0 0 0 0 0 0 0 0 0 0 0 0 0 0 0 0 0 0 0 0 0 0 0 0 0 0 0 0 0 0 0 0 0 0 0 1 0 0 0 0 0 0 0 0 0 0 0 8 0 0 0 0 0 0 0 0 0 0 0 0 0 0 0 0 0 0 0 0 0 0 0 0 0 0 0 0 0 0 0 0 0 5 0 0 0 0 0 0 0 0 0 0 0 0 0 0 3 0 0 0 0 0 0 0 0 0 15 0 0 0 0 0 0 0 15 0 0 0 0 0 0 0 9 6 0 0 0 0 0 0 0 0 0 61 0 0 0 0 0 0 0 20 0 0 0 0 0 1 0 0 0 0 0 0 0 0 0 0 7 3 5 0 0 4 0 0 0 60 8 0 0 0 0 0 14 0 0 0 0 0 0 0 0 0 1 0 0 0 0 0 0 0 0 0 0 0 0 0 0 0 0 0 0 0 0 0 0 0 0 0 0 1 0 0 0 1 0 0 0 0 33 94 0 0 4 2 0 0 0 0 0 0 0 24 0 15 0 65 122 0 0 0 0 0 0 0 0 0 0 0 0 0 0 0 0 0 0 0 0 0 15 0 0 0 0 0 0 0 0 43 0 0 0 0 0 0 0 86 0 0 0 0 0 0 0 2 0 0 0 0 0 0 5 0 0 0 0 0 0 0 0 0 0 0 0 0 0 0 0 0 45 0 12 0 0 0 0 1 0 1 0 0 0 0 34 0 0 0 0 0 19 0 0 0 0 0 26 0 0 0 4 0 0 0 0 0 0 0 0 0 2 0 0 0 0 2 57 0 0 0 0 0 0 34 0 0 0 0 0 0 0 0 0 0 216 0 0 0 0 0 1 0 15 0 0 0 237 0 0 0 0 0 0 0 0 0 0 0 0 68 4 11 1 0 26 6 0 0 0 0 0 8 58 0 0 0 0 0 0 0 0 0 32 0 5 0 0 0 0 0 0 0 0 37 0 0 0 0 0 0 4 0 0 113 0 0 26 1 0 0 0 0 13 6 0 0 0 0 0 0 0 0 0 0 0 0 0 0 0 1 1 0 0 0 0 0 1 0 0 0 0 0 8 0 0 0 0 0 0 0 0 0 7 1 21 202 0 0 0 0 0 0 0 0 0 0 0 1 0 0 0 0 0 0 0 0 0 0 0 0 0 0 0 0 0 0 0 0 1 0 0 0 0 0 0 0 0 0 0 0 0 0 0 0 2 21 0 0 94 0 0 1 0 0 1 1 0 2 0 0 0 0 1 0 0 0 0 0 0 0 0 0 38 0 17 0 0 0 0 0 0 0 0 0 0 0 0 0 0 0 0 0 0 0 0 0 0 2 0 0 0 0 0 0 0 0 0 0 0 0 0 0 0 0 0 0 0 0 0 0 3 0 0 0 0 0 67 12 0 1 0 0 0 0 0 0 0 21 0 1 0 0 1 0 0 0 0 2 2 0 3 16 0 9 0 0 2 0 0 0 0 39 0 6 21 0 0 37 0 0 0 0 0 0 0 0 0 0 0 26 0 0 0 1 0 0 0 0 0 0 0 0 0 0 0 0 0 0 0 0 34 0 0 0 0 0 0 4 0 0 2 1 0 0 0 0 0 12 0 0 0 0 0 0 0 0 0 0 0 0 3 0 0 0 3 0 0 0 15 0 0 0 0 0 0 0 0 0 0 0 0 0 0 0 1 0 0 0 0 0 0 0 3 0 0 9 0 0 0 0 0 0 0 0 0 0 0 0 0 1 0 0 0 0 0 0 0 0 0 0 0 0 0 0 0 1 224 0 0 0 0 0 0 0 0 0 0 0 0 0 1 0 0 0 0 0 0 3 0 0 0 33 0 0 0 0 0 0 0 0 0 0 0 0 0 0 0 0 2 0 0 0 0 3 0 0 0 0 0 0 0 0 0 0 0 0 0 0 0 0 0 0 0 1 0 0 2 0 0 0 0 5 0 39 0 0 2 1 0 0 0 0 0 0 1 1 0 0 0 0 0 0 0 0 0 0 0 0 0 0 0 0 0 18 0 0 0 0 13 3 0 0 0 0 0 0 0 0 0 0 0 0 0 0 0 0 0 2 0 0 13 0 0 0 0 0 0 0 0 0 2 5 0 3 0 0 0 0 0 0 0 0 0 0 0 0 1 0 3 0 80 0 0 0 0 1 0 15 0 0 1 0 0 6 0 0 0 0 0 1 0 0 0 0 0 0 0 0 0 0 0 0 0 0 0 0 0 2 0 0 0 0 0 0 0 0 12 0 0 0 0 0 152 0 2 0 8 0 0 0 0 0 0 0 0 0 0 0 0 0 0 0 0 3 0 0 0 0 14 1 0 0 0 0 0 0 0 0 0 2 0 0 1 0 0 0 0 0 0 0 0 0 0 0 0 0 0 0 0 0 0 0 0 0 0 0 0 20 0 0 0 0 0 0 0 0 0 0 28 0 0 0 0 0 0 0 0 0 0 0 0 1 0 0 8 3 0 0 2 0 0 0 0 0 17 0 0 1 0 0 0 0 0 0 0 164 0 1 0 0 0 0 0 0 0 0 0 0 0 7 0 0 0 0 0 7 0 0 0 0 0 0 0 0 0 0 1 0 0 0 0 0 0 0 0 0 0 0 0 0 2 0 0 0 0 0 0 0 0 40 0 0 0 0 1 0 0 0 0 0 2 1 0 1 0 0 0 1 0 0 2 0 0 3 0 0 0 1 0 27 0 0 0 0 0 0 1 0 0 0 0 0 0 0 0 36 1 4 0 0 0 0 1 1 0 0 0 0 41 0 0 0 81 0 0 0 0 0 0 0 0 39 0 0 0 0 0 0 0 0 0 0 3 0 0 0 0 0 14 0 0 0 0 0 3 0 0 0 0 0 0 2 0 0 4 0 0 10 0 0 0 0 0 0 0 0 0 0 0 0 0 0 0 0 0 0 0 16 3 0 0 39 13 0 0 0 0 0 0 0 0 0 0 0 0 0 0 0 0 0 0 0 0 0 1 0 0 0 1 0 0 1 1 0 0 11 0 5 0 0 0 0 0 0 0 0 0 0 0 0 0 0 1 0 0 0 0 0 0 0 0 2 0 0 0 0 0 0 0 0 0 0 0 0 0 0 0 3 0 0 2 0 0 0 34 0 0 0 0 0 0 0 2 0 0 1 0 0 0 0 0 0 0 0 0 4 0 0 0 0 0 0 0 0 0 0 0 0 1 0 0 1 0 0 2 0 0 2 2 0 2 0 0 1 0 0 1 0 168 0 9 0 0 0 20 0 0 0 0 0 0 0 0 0 0 0 0 0 0 0 0 0 0 0 0 0 0 1 0 0 0 0 0 0 0 0 0 0 0 0 0 0 0 0 0 0 0 0 SP367 Bacteria;Firmicutes;Bacilli;Lactobacillales;Streptococcaceae;Streptococcus;periodonticum 25 1414 2 1 55 17 0 4 5 2646 237 41 33 2 0 1 1022 135 594 1207 23 11343 2062 45 776 2896 265 46 188 28 57 253 232 11 0 3304 1154 2 2 34 0 224 0 2 23 2 234 3285 5 26 108 622 3236 836 208 3 7 351 10 103 1728 223 41 75 1131 1 26 1 89 1 1 223 4 0 1197 49 1 252 0 2 1 6 1648 98 511 601 13 4789 16 1153 26 79 66 2717 2474 5 13 7 64 2876 1101 72 5368 1 15 126 18 2 85 2205 6 778 5 74 1366 60 4 404 174 179 7448 34 2286 398 823 2062 16 7381 0 1561 47 0 20 4883 9 690 5 1235 5 852 199 33 5 2 4 157 1123 94 790 3 116 3 1903 5381 1562 1701 403 76 0 449 601 201 1586 52 27 5912 6 8 2 1655 4 5 3524 432 3 43 15 14 129 198 0 7 28 579 114 1133 133 182 0 52 268 12 2 2385 1234 14 0 84 49 0 12 1 5 1005 0 2 0 43 2169 43 9 8 1497 74 133 563 26 0 7 587 1 55 12 5 3 0 0 2 9 72 927 83 91 1 813 383 951 10 337 1014 297 1405 295 15 171 6248 2454 0 1430 1 79 1 2 68 0 0 976 3 0 82 18 88 37 704 2415 6391 14 2 0 0 0 0 0 0 0 0 0 0 0 0 0 0 0 0 0 0 0 0 0 0 0 0 0 0 0 0 0 0 0 0 0 0 0 0 0 0 0 0 0 0 0 0 0 0 0 0 0 0 0 0 0 0 0 0 0 0 0 0 0 0 0 0 0 0 0 0 0 0 0 0 0 0 0 0 0 0 0 0 0 0 0 0 0 0 0 0 0 0 0 0 0 0 0 0 0 0 0 0 0 0 0 0 0 0 0 0 0 0 0 0 0 0 0 0 0 0 0 0 0 0 0 0 0 0 0 0 0 0 0 0 0 0 0 0 0 0 0 0 0 0 0 0 0 0 0 0 0 0 0 0 0 0 0 0 0 0 0 0 0 0 0 0 0 0 0 0 0 0 0 0 0 0 0 0 0 0 0 0 0 0 0 0 0 0 0 0 0 0 0 0 0 0 0 0 0 0 0 0 0 0 0 0 0 0 0 0 0 0 0 0 0 0 0 0 0 0 0 0 0 0 0 0 0 0 0 0 0 0 0 0 0 0 0 0 0 0 0 0 0 0 0 0 0 0 0 0 0 0 0 0 0 0 0 0 0 0 0 0 0 0 0 0 0 0 0 0 0 0 0 0 0 0 0 0 0 0 0 0 0 0 0 0 0 0 0 0 0 0 0 0 0 0 0 0 0 0 0 0 0 0 0 0 0 0 0 0 0 0 0 0 0 0 0 0 0 0 0 0 0 0 0 0 0 0 0 0 0 0 0 0 0 0 0 0 0 0 0 0 0 0 0 0 0 0 0 0 0 0 0 0 0 0 0 0 0 0 0 0 0 0 0 0 0 0 0 0 0 0 0 0 0 0 0 0 0 0 0 0 0 0 0 0 0 0 0 0 0 0 0 0 0 0 0 0 0 0 0 0 0 0 0 0 0 0 0 0 0 0 0 0 0 0 0 0 0 0 0 0 0 0 0 0 0 0 0 0 0 0 0 0 0 0 0 0 0 0 0 0 0 0 0 0 0 0 0 0 0 0 0 0 0 0 0 0 0 0 0 0 0 0 0 0 0 0 0 0 0 0 0 0 0 0 0 0 0 0 0 0 0 0 0 0 0 0 0 0 0 0 0 0 0 0 0 0 0 0 0 0 0 0 0 0 0 0 0 0 0 0 0 0 0 0 0 0 0 0 0 0 0 0 0 0 0 0 0 0 0 0 0 0 0 0 0 0 0 0 0 0 0 0 0 0 0 0 0 0 0 0 0 0 0 0 0 0 0 0 0 0 0 0 0 0 0 0 0 0 0 0 0 0 0 0 0 0 0 0 0 0 0 0 0 0 0 0 0 0 0 0 0 0 0 0 0 0 0 0 0 0 0 0 0 0 0 0 0 0 0 0 0 0 0 0 0 0 0 0 0 0 0 0 0 0 0 0 0 0 0 0 0 0 0 0 0 0 0 0 0 0 0 0 0 0 0 0 0 0 0 0 0 0 0 0 0 0 0 0 0 0 0 0 0 0 0 0 0 0 0 0 0 0 0 0 0 0 0 0 0 0 0 0 0 0 0 0 0 0 0 0 0 0 0 0 0 0 0 0 0 0 0 0 0 0 0 0 0 0 0 0 0 0 0 0 0 0 0 0 0 0 0 0 0 0 0 0 0 0 0 0 0 0 0 0 0 0 0 0 0 0 0 0 0 0 0 0 0 0 0 0 0 0 0 0 0 0 0 0 0 0 0 0 0 0 0 0 0 0 0 0 0 0 0 0 0 0 0 0 0 0 0 0 0 0 0 0 0 0 0 0 0 0 0 0 0 0 0 0 0 0 0 0 0 0 0 0 0 0 0 0 0 0 0 0 0 0 0 0 0 0 0 0 0 0 0 0 0 0 0 0 0 0 0 0 0 0 0 0 0 0 0 0 0 0 0 0 0 0 0 0 0 0 0 0 0 0 0 0 0 0 0 0 0 0 0 0 0 0 0 0 0 0 0 0 0 0 0 0 0 0 0 0 0 0 0 0 0 0 0 0 0 0 0 0 0 0 0 0 0 0 0 0 0 0 0 0 0 0 0 0 0 0 0 0 0 0 0 0 0 0 0 0 0 0 0 0 0 0 0 0 0 0 0 0 0 0 0 0 0 0 0 0 0 0 0 0 0 0 0 0 0 0 0 0 0 0 0 0 0 0 0 0 0 0 0 0 0 0 0 0 0 0 0 0 0 0 0 0 0 0 0 0 0 0 0 0 0 0 0 0 0 0 0 0 0 0 0 0 0 0 0 0 0 0 0 0 0 0 0 0 0 0 0 0 0 0 0 0 0 0 0 0 0 0 0 0 0 0 0 0 0 0 0 0 0 0 0 0 0 0 0 0 0 0 0 0 0 0 0 0 0 0 0 0 0 0 0 0 0 0 0 0 0 0 0 0 0 0 0 0 0 0 0 0 0 0 0 0 0 0 0 0 0 0 0 0 0 0 0 0 0 0 0 0 0 0 0 0 0 0 0 0 0 0 0 0 0 0 0 0 0 0 0 0 0 0 0 0 0 0 0 0 0 0 0 0 0 0 0 0 0 0 0 0 0 0 0 0 0 0 0 0 0 0 0 0 0 0 0 0 0 0 0 0 0 0 0 0 0 0 0 0 0 0 0 0 0 0 0 0 0 0 0 0 0 0 0 0 0 0 0 0 0 0 0 0 0 0 0 0 0 0 0 0 0 0 0 0 0 0 0 0 0 0 0 0 0 0 0 0 0 0 0 0 0 0 0 0 0 0 0 0 0 0 0 0 0 0 0 0 0 0 0 0 0 0 0 0 0 0 0 0 0 0 0 0 0 0 0 0 0 0 0 0 0 0 0 0 0 0 0 0 0 0 0 0 0 0 0 0 0 0 0 0 0 0 0 0 0 0 0 0 0 0 0 0 0 0 0 0 0 0 0 0 0 0 0 0 0 0 0 0 0 0 0 0 0 0 0 0 0 0 0 0 0 0 0 0 0 0 0 0 0 0 0 0 0 0 0 0 0 0 0 0 0 0 0 0 0 0 0 0 0 0 0 0 0 0 0 0 0 0 0 0 0 0 0 0 0 0 0 0 0 0 0 0 0 0 0 0 0 0 0 0 0 0 0 0 0 0 0 0 0 0 0 0 0 0 0 0 0 0 0 0 0 0 0 0 0 0 0 0 0 0 0 0 0 0 0 0 0 0 0 0 0 0 0 0 0 0 0 0 0 0 0 0 0 0 0 0 0 0 0 0 0 0 0 0 0 0 0 0 0 0 0 0 0 0 0 0 0 0 0 0 0 0 0 0 0 0 0 0 0 0 0 0 0 0 0 0 0 0 0 0 0 0 0 0 0 0 0 0 0 0 0 0 0 0 0 0 0 0 0 0 0 0 0 0 0 0 0 0 0 0 0 0 0 0 0 0 0 0 0 0 0 0 0 0 0 0 0 0 0 0 0 0 0 0 0 0 0 0 0 0 0 0 0 0 0 0 0 0 0 0 0 0 0 0 0 0 0 0 0 0 0 0 SP37 Bacteria;Gracilibacteria_(GN02);Gracilibacteria_(GN02)_[C-1];Gracilibacteria_(GN02)_[O-1];Gracilibacteria_(GN02)_[F-1];Gracilibacteria_(GN02)_[G-1];bacterium HMT872 0 0 0 0 0 0 0 4 176 17 2 2 18 3 27 6 0 10 1 2 0 0 1 19 6 2 23 1 0 14 0 0 2 2 0 0 0 0 2 5 7 30 0 0 0 0 0 0 0 1 6 9 0 9 0 3 0 0 5 25 7 0 0 0 1 0 1 0 0 0 5 0 19 0 0 2 2 0 0 0 8 0 2 4 0 2 0 1 3 0 0 0 18 0 0 8 7 10 0 1 0 3 0 27 0 0 3 1 1 0 0 11 8 2 0 0 0 0 5 0 0 3 0 1 0 2 0 1 4 146 5 23 0 0 4 0 0 4 12 0 0 35 0 27 17 2 5 4 9 3 0 1 0 0 0 1 17 7 9 0 12 0 0 3 10 0 4 1 0 0 0 0 1 5 9 0 0 1 0 21 0 1 10 4 0 1 3 0 0 6 0 7 0 2 0 2 0 0 1 24 0 0 0 4 0 0 0 10 12 0 0 10 5 1 0 0 0 1 2 7 0 7 0 2 0 0 1 56 18 0 2 9 3 0 0 0 0 0 9 1 0 0 0 14 7 1 2 0 0 0 0 2 4 6 0 0 0 0 3 0 10 0 3 0 0 0 0 0 0 14 1 0 10 0 0 0 15 2 1 0 5 0 0 1 0 0 0 0 0 3 32 0 6 0 2 2 0 1 0 5 2 2 0 4 1 0 0 14 11 0 2 0 0 0 0 0 0 0 0 0 0 0 0 0 0 0 0 0 0 0 0 0 0 0 0 0 0 0 0 0 0 0 0 3 1 0 0 0 2 0 4 0 0 0 0 0 0 0 3 0 0 0 0 0 0 0 0 0 19 0 0 0 0 0 3 0 0 0 0 0 0 0 15 14 0 19 13 0 1 2 0 0 0 147 27 0 0 0 3 40 0 0 0 1 3 2 2 0 0 0 0 3 0 0 0 0 0 0 3 0 0 0 0 0 0 2 0 0 0 0 0 20 2 0 0 5 16 0 0 0 3 0 1 0 0 0 0 0 10 10 0 0 0 0 0 0 0 0 0 4 4 0 0 0 0 0 0 7 1 0 0 4 0 0 1 0 1 3 0 0 0 0 0 1 0 0 29 13 13 17 6 7 0 0 0 0 0 0 0 1 19 0 0 0 21 0 0 0 0 0 0 0 0 0 0 0 0 0 0 0 0 1 0 1 0 0 0 0 0 10 0 21 0 28 5 0 0 7 3 1 0 0 0 11 17 48 8 2 0 0 5 0 0 0 0 125 0 66 0 8 0 1 0 0 0 3 0 0 0 0 0 0 4 0 26 1 43 0 0 0 0 6 14 8 0 11 0 0 25 0 0 0 0 0 0 0 0 2 0 0 0 0 0 0 0 0 0 0 0 13 44 0 0 0 0 0 23 0 1 1 0 0 0 0 0 80 4 0 0 0 1 0 0 64 48 11 0 0 0 4 0 0 17 74 19 0 0 4 0 0 0 0 113 0 0 0 2 0 7 0 11 0 32 1 14 0 0 0 1 0 0 12 0 74 73 0 0 0 3 0 0 20 9 0 0 0 3 0 8 14 2 0 0 0 7 0 0 0 0 0 0 31 0 1 0 0 0 0 0 19 4 0 0 5 0 0 16 0 0 0 0 1 7 0 0 0 19 12 0 0 0 0 38 10 0 3 0 0 2 0 8 3 5 0 18 1 0 7 12 0 14 0 20 0 0 0 2 0 0 3 49 2 50 4 55 0 27 13 0 0 18 0 0 15 0 1 7 0 19 6 1 15 0 0 0 5 6 0 0 12 0 1 0 0 0 0 13 0 0 0 0 0 0 0 0 1 68 0 0 1 23 0 1 0 1 39 0 0 0 33 0 0 0 2 0 0 0 7 18 0 0 4 0 0 1 0 0 0 0 0 34 0 1 0 0 0 0 0 0 0 0 0 0 109 34 0 0 0 5 0 0 0 0 0 0 0 0 51 5 109 9 2 24 2 0 0 0 0 5 0 12 0 0 1 0 0 0 0 104 0 0 0 0 0 4 0 0 0 26 0 0 0 0 0 0 0 0 5 43 0 56 1 0 0 0 15 0 2 114 18 1 0 0 1 0 0 0 9 23 0 19 0 5 13 0 0 1 6 0 0 3 0 0 3 0 1 0 0 11 0 0 0 0 2 0 0 6 0 1 0 0 0 0 2 1 0 70 0 11 0 0 7 0 0 11 0 0 1 0 7 1 0 0 1 0 0 0 16 0 7 2 37 0 2 0 36 10 0 0 0 0 22 0 0 0 0 0 0 0 0 0 19 0 0 20 0 0 0 1 0 0 1 5 0 0 0 0 1 3 0 8 0 0 0 3 0 0 0 0 1 2 0 0 0 3 0 3 7 11 0 0 0 0 1 1 0 0 0 0 0 35 6 0 0 0 0 0 0 3 0 4 0 0 0 0 3 0 0 13 0 0 0 0 0 7 12 4 0 0 0 0 3 2 0 0 0 6 10 0 0 0 0 2 1 0 0 0 0 0 0 4 0 0 0 0 0 0 0 12 0 9 0 8 0 17 0 0 0 0 5 2 0 0 53 3 0 0 6 0 1 0 0 0 1 20 0 0 0 3 0 2 0 0 2 2 0 0 0 0 0 0 0 3 0 2 0 0 0 0 2 0 2 34 0 2 0 0 0 0 0 0 1 1 0 1 2 0 3 0 0 0 1 1 0 6 0 5 9 0 2 0 0 0 0 0 0 0 2 9 0 0 0 0 0 0 0 0 1 2 0 0 1 0 0 0 0 0 0 0 3 0 5 0 0 0 1 0 0 0 0 0 0 1 0 0 0 0 3 0 0 0 1 0 4 0 4 1 2 0 0 0 0 0 3 0 0 0 0 0 0 3 0 0 3 0 0 0 0 0 2 0 0 0 0 0 0 8 1 0 0 14 5 0 0 0 0 1 4 0 0 2 0 0 7 0 0 5 0 0 21 12 3 0 0 0 1 0 0 0 0 0 0 0 0 0 0 1 0 0 0 0 0 0 0 0 0 12 0 0 10 7 0 3 2 2 3 3 0 0 0 0 0 0 3 0 0 0 1 0 0 2 0 1 0 4 4 0 0 1 0 0 53 0 0 0 0 1 0 0 1 0 11 0 1 0 1 0 0 0 3 0 7 3 0 0 3 0 1 19 0 1 1 0 6 0 0 0 0 0 0 0 0 0 0 0 0 0 2 0 0 2 0 0 5 7 0 0 2 1 0 0 1 0 0 0 0 0 0 0 0 0 1 0 0 4 0 0 0 0 0 0 2 0 0 0 0 0 0 1 0 0 0 0 0 0 1 3 0 0 5 0 0 0 1 0 0 0 0 0 4 0 4 2 0 0 0 15 0 0 0 0 0 0 0 0 0 1 0 4 10 0 1 39 2 10 0 1 0 0 0 0 1 2 0 0 0 0 0 1 4 2 0 0 1 0 1 13 0 0 1 0 0 0 2 0 0 1 0 34 0 0 1 0 0 3 1 0 0 6 1 0 1 1 12 0 1 2 0 0 1 0 0 0 0 1 5 0 0 53 0 0 22 0 0 5 0 0 0 16 0 2 1 0 4 1 0 0 6 0 0 1 16 0 0 1 0 2 1 0 0 0 2 0 0 0 3 0 9 10 0 1 0 0 0 0 2 0 0 0 0 0 1 0 0 1 0 0 1 1 0 0 4 0 0 1 2 0 1 5 0 0 1 2 0 8 9 0 0 4 0 3 3 0 0 37 13 0 0 1 0 9 1 0 0 5 61 0 35 0 0 0 0 3 1 0 0 0 0 2 0 1 0 0 0 0 0 0 0 0 4 1 0 0 0 0 0 0 3 1 0 16 0 0 0 0 1 0 1 0 0 2 0 0 0 0 0 2 0 0 0 2 0 0 0 0 0 0 0 1 0 0 0 6 0 0 5 0 0 0 0 0 1 0 1 0 0 0 0 0 0 0 0 0 0 1 0 0 2 0 15 0 0 0 1 0 0 0 0 0 0 8 0 1 0 14 0 1 1 1 0 2 1 2 0 0 0 0 1 0 0 0 0 0 0 0 0 0 3 0 0 0 1 0 0 0 0 2 8 0 0 0 1 0 0 0 0 1 0 0 0 11 0 2 0 SP38 Bacteria;Firmicutes;Bacilli;Lactobacillales;Aerococcaceae;Abiotrophia;defectiva 6 1563 3874 82 117 264 1472 288 296 1194 216 1806 292 159 496 38 533 690 175 112 42 13 328 519 188 18 759 0 2658 3120 239 175 868 110 407 41 396 1888 85 191 192 2839 174 48 274 125 1053 147 467 129 164 34 5 280 53 26 171 453 890 1085 254 148 9 3580 12 1765 226 12 949 52 886 596 68 118 296 262 28 28 412 990 171 65 233 167 7 88 32 208 690 74 136 26 312 190 135 1810 1773 177 37 137 539 1440 15 166 378 226 223 102 69 210 338 473 104 131 162 48 142 170 331 49 58 30 24 237 90 407 35 0 18 1385 129 32 12 280 91 184 84 93 2012 75 447 2125 1197 1272 1447 1007 41 363 64 136 154 117 21 1173 204 15 182 266 388 296 364 562 27 41 359 187 413 78 402 341 21470 158 105 684 25 366 155 114 329 971 32 307 87 87 43 680 123 61 973 412 304 1141 191 41 377 1190 9 74 126 685 454 13 168 51 91 16 258 772 355 3640 21 102 167 30 34 107 168 83 373 59 2363 83 473 1042 77 296 79 845 1611 63 261 336 388 36 23 31 207 322 46 1304 38 1 71 445 118 4 21 149 46 71 4 42 71 89 28 141 481 37 276 94 144 19 332 66 501 37 9 26 159 171 48 0 130 25 29 0 19 233 14 744 275 338 57 53 436 705 30 554 108 549 214 431 421 856 203 114 441 106 0 214 276 158 44 84 242 88 275 49 328 169 25 416 364 144 175 195 427 272 125 14 132 387 132 0 15 8 2 1 106 0 82 84 1284 135 26 5 77 22 2 331 583 32 0 289 12 217 614 20 24 73 217 141 903 194 89 77 53 249 126 2 1363 213 546 128 182 69 553 335 206 0 67 583 26 204 415 161 15 159 192 66 307 0 84 196 21 304 216 228 1 774 510 1145 0 117 247 166 284 33 314 115 294 9 316 148 10 5 1 303 364 71 131 70 1 27 151 156 734 0 72 9 49 40 46 1 0 4 311 123 54 485 187 18 464 247 730 153 102 0 252 121 23 415 296 28 138 129 4 7 160 150 16 36 87 14 0 298 46 20 263 176 231 360 8 319 37 336 2 14 60 165 190 238 824 551 941 42 330 256 106 267 125 56 5 7 122 193 219 185 97 92 246 863 1 79 252 0 119 21 5 352 249 2815 0 304 21 0 380 447 41 7 74 41 199 195 41 356 52 105 889 451 117 220 235 344 85 121 1499 264 214 71 518 250 35 149 168 0 104 39 195 527 323 483 41 584 27 183 51 12 456 22 65 72 783 226 113 71 14 95 0 49 40 45 343 75 30 40 27 574 379 304 11 0 170 198 47 136 33 756 18 0 519 384 544 0 11 114 173 34 119 7 0 869 8 131 1046 49 670 203 0 0 0 22 87 40 90 399 988 52 294 182 205 133 312 1415 136 431 61 26 555 432 201 230 51 66 614 208 763 19 452 126 106 634 145 7 210 121 175 217 112 148 15 309 62 59 233 805 0 53 520 172 8 171 89 164 166 8 22 156 29 1 6 0 12 17 38 27 58 1 426 771 332 139 0 68 678 276 656 976 170 17 165 142 40 154 576 193 41 118 129 40 1504 0 119 250 196 153 8 592 1 592 60 314 174 49 890 135 34 160 109 38 40 517 35 11 1 82 336 366 48 44 208 315 182 29 171 62 195 280 547 803 76 28 16 51 680 59 473 197 150 320 403 62 51 201 370 428 152 69 355 591 521 2503 995 1904 125 120 229 694 1486 213 75 559 816 148 923 829 171 544 387 87 356 144 187 59 596 488 65 3769 567 434 3 78 0 65 19 369 22 20 191 1101 92 400 93 56 79 418 115 0 53 430 1303 1257 338 5 925 417 95 505 66 65 68 19 723 231 200 359 765 5 21 202 98 7 95 64 0 0 90 86 232 1035 27 74 1304 1 356 443 554 137 200 242 96 53 58 150 47 10 17 196 84 34 75 85 232 42 240 743 255 110 254 0 91 111 195 30 51 169 100 180 91 165 252 18 1883 339 41 95 143 182 455 448 103 3 123 290 45 1584 15 430 53 294 369 655 0 11 304 134 12 8 58 330 36 7 44 137 97 194 347 698 114 182 369 367 0 147 141 102 0 13 115 105 84 486 838 60 366 2 81 117 121 133 111 106 83 33 164 177 181 198 45 141 203 0 528 330 462 678 150 161 142 251 539 488 61 36 2391 446 97 121 185 122 29 315 1587 284 317 8 308 352 178 163 11 44 48 245 303 19 113 116 179 304 48 436 472 246 576 55 0 41 42 76 138 398 62 115 801 34 72 11 22 105 49 528 54 139 372 8 0 434 33 0 5 44 1 1220 34 527 114 0 73 21 42 2 361 183 62 17 394 132 236 2 64 43 16 89 110 3 29 33 161 0 26 28 1 492 434 1 32 46 9 43 81 37 0 4 1 0 88 45 0 3 35 62 70 0 26 2 0 39 14 0 54 58 5 9 61 57 16 2 131 0 2 136 119 0 89 58 46 0 56 133 10 17 49 44 0 10 29 255 0 95 57 0 5 254 0 6 63 1 4 24 46 4 65 45 7 79 10 0 18 150 10 2 11 5 177 0 44 174 0 46 93 0 90 62 33 0 20 93 0 8 159 0 0 54 42 0 0 46 7 0 62 3 42 12 20 0 2 58 37 108 22 50 157 1 70 26 12 18 19 6 0 38 33 30 13 371 24 21 3 2 0 23 199 28 26 74 33 16 10 61 46 1 33 7 110 36 44 93 1 441 131 8 50 54 92 62 0 34 123 32 35 217 1 59 227 56 8 113 137 6 0 172 146 3 3 54 1 142 36 5 6 120 184 7 155 70 0 71 33 30 0 53 14 47 59 231 8 57 35 4 3 414 0 55 101 11 37 40 4 79 118 0 122 22 5 0 73 96 12 243 180 7 243 162 89 56 101 71 0 173 138 0 33 78 10 0 5 42 2 7 87 92 6 145 17 0 59 118 0 26 60 163 7 52 91 1 165 81 0 41 49 19 0 290 58 1 26 20 15 4 79 14 658 78 0 13 118 272 3 97 18 0 69 132 91 127 121 1 22 23 43 11 109 136 69 10 13 0 0 5 7 14 29 64 133 2 100 7 0 90 165 6 175 0 55 117 29 69 50 36 428 89 7 0 39 67 7 37 131 48 4 24 1 41 3 58 0 3 18 83 15 517 61 7 12 54 37 121 28 17 3 14 0 6 175 0 2 6 0 12 2 39 25 0 14 92 10 29 10 11 64 29 40 22 45 0 0 8 232 310 29 136 35 13 37 46 4 38 402 0 14 247 0 12 4 0 0 0 12 3 49 24 0 18 207 0 25 8 52 115 16 81 38 11 0 5 134 36 60 44 0 2 25 2 1 53 60 2 1 55 3 41 11 2 1 9 22 5 3 6 69 10 37 112 0 114 34 8 12 44 1 231 46 62 59 5 90 15 34 47 115 47 37 43 1 22 177 50 27 24 32 4 41 67 7 15 49 5 1 47 12 44 134 83 12 34 112 117 17 1 44 31 216 11 7 7 1 6 97 2 0 45 32 76 0 14 76 1 92 49 34 111 0 0 3 50 35 110 39 0 121 202 37 27 137 60 14 0 98 24 35 83 0 21 20 0 132 69 165 0 254 165 2 522 75 0 193 212 1 0 98 27 38 9 31 71 4 61 158 15 64 9 4 69 41 19 2 123 54 135 29 159 17 114 121 1 15 17 74 0 8 15 0 32 141 47 3 19 104 0 3 6 94 6 257 50 1 169 65 2 86 25 62 2 204 173 2 54 13 1 251 2 197 1 162 194 162 127 16 3 29 92 3 0 0 8 0 11 66 1 135 34 2 52 64 4 32 97 3 38 16 25 128 12 12 99 8 34 30 24 34 6 39 23 242 14 24 7 1 0 35 11 2 24 18 14 13 74 81 19 20 12 0 18 15 4 19 8 49 3 2 30 12 251 7 24 179 21 33 3 6 67 187 29 307 0 0 0 6 135 7 48 83 0 175 23 52 63 36 73 7 0 0 42 37 94 107 6 5 64 154 3 137 151 22 12 53 35 2 63 60 4 52 78 0 6 15 148 0 43 17 4 1 26 72 4 12 131 0 0 312 86 0 123 100 9 48 209 2 22 121 5 2 20 29 1 80 106 1 125 108 10 16 2 SP390 Bacteria;Firmicutes;Clostridia;Negativicutes;Veillonellaceae;Veillonella;rogosae 15 3 8 32 60 402 5 766 1 0 31 982 3138 321 60 196 123 120 1262 2154 92 0 0 293 28 142 0 226 249 313 666 1220 127 52 732 55 1 18 93 112 572 224 619 24 0 363 0 1 44 697 15 0 15 234 798 107 2 225 69 110 143 54 463 0 927 356 89 1172 675 1478 0 390 280 17 0 1056 494 194 293 121 148 1170 171 335 536 142 1499 398 0 89 793 2 43 129 0 85 19 992 233 0 0 285 38 1098 1 42 1 115 1975 71 4 90 0 992 611 61 1348 5 660 184 189 158 1 674 577 63 87 90 73 3 1283 1206 2 205 1 633 3493 114 222 1620 0 2 264 514 0 360 1011 1453 202 291 134 444 811 141 13 144 1361 0 6 248 21 112 533 215 188 0 21 1243 178 210 15 14 169 3131 1 7 1225 941 41 641 2 126 1590 2469 20 1309 2258 660 609 0 837 1522 1533 547 297 5 3 737 529 1599 72 2289 188 1535 63 215 115 0 5 64 41 708 170 22 388 957 25 65 0 565 1818 114 1 696 4 1682 3531 378 0 646 31 43 1368 6 130 6356 453 384 238 476 37 1289 1418 46 54 210 2131 230 1058 0 187 136 288 262 2 85 652 28 9 1546 10 105 162 2790 271 65 167 24 0 0 0 0 0 0 0 0 0 0 0 0 0 0 0 0 0 0 0 0 0 0 0 0 0 0 0 0 0 0 0 0 0 0 0 0 0 0 0 0 0 0 0 0 0 0 0 0 0 0 0 0 0 0 0 0 0 0 0 0 0 0 0 0 0 0 0 0 0 0 0 0 0 0 0 0 0 0 0 0 0 0 0 0 0 0 0 0 0 0 0 0 0 0 0 0 0 0 0 0 0 0 0 0 0 0 0 0 0 0 0 0 0 0 0 0 0 0 0 0 0 0 0 0 0 0 0 0 0 0 0 0 0 0 0 0 0 0 0 0 0 0 0 0 0 0 0 0 0 0 0 0 0 0 0 0 0 0 0 0 0 0 0 0 0 0 0 0 0 0 0 0 0 0 0 0 0 0 0 0 0 0 0 0 0 0 0 0 0 0 0 0 0 0 0 0 0 0 0 0 0 0 0 0 0 0 0 0 0 0 0 0 0 0 0 0 0 0 0 0 0 0 0 0 0 0 0 0 0 0 0 0 0 0 0 0 0 0 0 0 0 0 0 0 0 0 0 0 0 0 0 0 0 0 0 0 0 0 0 0 0 0 0 0 0 0 0 0 0 0 0 0 0 0 0 0 0 0 0 0 0 0 0 0 0 0 0 0 0 0 0 0 0 0 0 0 0 0 0 0 0 0 0 0 0 0 0 0 0 0 0 0 0 0 0 0 0 0 0 0 0 0 0 0 0 0 0 0 0 0 0 0 0 0 0 0 0 0 0 0 0 0 0 0 0 0 0 0 0 0 0 0 0 0 0 0 0 0 0 0 0 0 0 0 0 0 0 0 0 0 0 0 0 0 0 0 0 0 0 0 0 0 0 0 0 0 0 0 0 0 0 0 0 0 0 0 0 0 0 0 0 0 0 0 0 0 0 0 0 0 0 0 0 0 0 0 0 0 0 0 0 0 0 0 0 0 0 0 0 0 0 0 0 0 0 0 0 0 0 0 0 0 0 0 0 0 0 0 0 0 0 0 0 0 0 0 0 0 0 0 0 0 0 0 0 0 0 0 0 0 0 0 0 0 0 0 0 0 0 0 0 0 0 0 0 0 0 0 0 0 0 0 0 0 0 0 0 0 0 0 0 0 0 0 0 0 0 0 0 0 0 0 0 0 0 0 0 0 0 0 0 0 0 0 0 0 0 0 0 0 0 0 0 0 0 0 0 0 0 0 0 0 0 0 0 0 0 0 0 0 0 0 0 0 0 0 0 0 0 0 0 0 0 0 0 0 0 0 0 0 0 0 0 0 0 0 0 0 0 0 0 0 0 0 0 0 0 0 0 0 0 0 0 0 0 0 0 0 0 0 0 0 0 0 0 0 0 0 0 0 0 0 0 0 0 0 0 0 0 0 0 0 0 0 0 0 0 0 0 0 0 0 0 0 0 0 0 0 0 0 0 0 0 0 0 0 0 0 0 0 0 0 0 0 0 0 0 0 0 0 0 0 0 0 0 0 0 0 0 0 0 0 0 0 0 0 0 0 0 0 0 0 0 0 0 0 0 0 0 0 0 0 0 0 0 0 0 0 0 0 0 0 0 0 0 0 0 0 0 0 0 0 0 0 0 0 0 0 0 0 0 0 0 0 0 0 0 0 0 0 0 0 0 0 0 0 0 0 0 0 0 0 0 0 0 0 0 0 0 0 0 0 0 0 0 0 0 0 0 0 0 0 0 0 0 0 0 0 0 0 0 0 0 0 0 0 0 0 0 0 0 0 0 0 0 0 0 0 0 0 0 0 0 0 0 0 0 0 0 0 0 0 0 0 0 0 0 0 0 0 0 0 0 0 0 0 0 0 0 0 0 0 0 0 0 0 0 0 0 0 0 0 0 0 0 0 0 0 0 0 0 0 0 0 0 0 0 0 0 0 0 0 0 0 0 0 0 0 0 0 0 0 0 0 0 0 0 0 0 0 0 0 0 0 0 0 0 0 0 0 0 0 0 0 0 0 0 0 0 0 0 0 0 0 0 0 0 0 0 0 0 0 0 0 0 0 0 0 0 0 0 0 0 0 0 0 0 0 0 0 0 0 0 0 0 0 0 0 0 0 0 0 0 0 0 0 0 0 0 0 0 0 0 0 0 0 0 0 0 0 0 0 0 0 0 0 0 0 0 0 0 0 0 0 0 0 0 0 0 0 0 0 0 0 0 0 0 0 0 0 0 0 0 0 0 0 0 0 0 0 0 0 0 0 0 0 0 0 0 0 0 0 0 0 0 0 0 0 0 0 0 0 0 0 0 0 0 0 0 0 0 0 0 0 0 0 0 0 0 0 0 0 0 0 0 0 0 0 0 0 0 0 0 0 0 0 0 0 0 0 0 0 0 0 0 0 0 0 0 0 0 0 0 0 0 0 0 0 0 0 0 0 0 0 0 0 0 0 0 0 0 0 0 0 0 0 0 0 0 0 0 0 0 0 0 0 0 0 0 0 0 0 0 0 0 0 0 0 0 0 0 0 0 0 0 0 0 0 0 0 0 0 0 0 0 0 0 0 0 0 0 0 0 0 0 0 0 0 0 0 0 0 0 0 0 0 0 0 0 0 0 0 0 0 0 0 0 0 0 0 0 0 0 0 0 0 0 0 0 0 0 0 0 0 0 0 0 0 0 0 0 0 0 0 0 0 0 0 0 0 0 0 0 0 0 0 0 0 0 0 0 0 0 0 0 0 0 0 0 0 0 0 0 0 0 0 0 0 0 0 0 0 0 0 0 0 0 0 0 0 0 0 0 0 0 0 0 0 0 0 0 0 0 0 0 0 0 0 0 0 0 0 0 0 0 0 0 0 0 0 0 0 0 0 0 0 0 0 0 0 0 0 0 0 0 0 0 0 0 0 0 0 0 0 0 0 0 0 0 0 0 0 0 0 0 0 0 0 0 0 0 0 0 0 0 0 0 0 0 0 0 0 0 0 0 0 0 0 0 0 0 0 0 0 0 0 0 0 0 0 0 0 0 0 0 0 0 0 0 0 0 0 0 0 0 0 0 0 0 0 0 0 0 0 0 0 0 0 0 0 0 0 0 0 0 0 0 0 0 0 0 0 0 0 0 0 0 0 0 0 0 0 0 0 0 0 0 0 0 0 0 0 0 0 0 0 0 0 0 0 0 0 0 0 0 0 0 0 0 0 0 0 0 0 0 0 0 0 0 0 0 0 0 0 0 0 0 0 0 0 0 0 0 0 0 0 0 0 0 0 0 0 0 0 0 0 0 0 0 0 0 0 0 0 0 0 0 0 0 0 0 0 0 0 0 0 0 0 0 0 0 0 0 0 0 0 0 0 0 0 0 0 0 0 0 0 0 0 0 0 0 0 0 0 0 0 0 0 0 0 0 0 0 0 0 0 0 0 0 0 0 0 0 0 0 0 0 0 0 0 0 0 0 0 0 0 0 0 0 0 0 0 0 0 0 0 0 0 0 0 0 0 0 0 0 0 0 0 0 0 0 0 0 0 0 0 SP4 Bacteria;Fusobacteria;Fusobacteria;Fusobacteriales;Fusobacteriaceae;Fusobacterium;nucleatum_subsp._vincentii 0 0 0 0 0 0 0 0 0 1 0 4 0 0 0 0 3 21 4 0 0 0 0 0 0 0 0 1 0 0 2 0 5 68 0 0 1 0 1 0 0 1 20 2 11 67 0 0 0 5 2 0 1 0 3 0 10 0 10 0 8 0 0 0 3 18 18 15 58 1 0 0 0 0 4 5 0 3 17 5 8 0 0 14 1 0 0 0 0 22 1 3 3 2 0 0 0 56 0 0 4 55 0 13 16 0 0 1 1 0 0 52 0 0 91 1 0 0 7 0 1 16 0 5 2 11 0 4 11 1 0 0 0 9 0 1 0 0 4 0 0 0 2 0 6 2 19 73 0 695 1 0 0 3 4 3 5 0 3 0 46 12 0 6 0 0 4 9 0 0 0 0 2 0 3 0 1 4 0 0 4 26 0 48 0 10 0 0 0 12 0 1 0 3 0 27 0 0 2 7 3 0 3 0 1 0 0 0 16 0 18 0 3 5 0 3 0 5 0 0 4 12 0 37 0 0 0 0 22 2 0 0 68 5 11 0 10 6 0 2 0 0 2 2 1 19 9 0 11 1 12 373 0 0 0 0 0 0 0 2 0 0 0 0 0 0 0 3 0 0 0 0 0 0 0 0 0 0 21 0 6 0 0 16 0 0 0 0 0 0 0 0 0 0 0 0 5 0 0 3 0 0 35 0 0 1 0 0 4 0 0 0 0 0 1 2 0 0 0 0 0 0 0 0 0 0 0 0 0 0 0 0 0 0 0 0 0 0 0 0 0 0 0 0 0 0 0 2 2 0 0 0 0 0 0 0 0 0 0 0 0 0 0 0 0 0 0 0 0 0 0 0 0 8 0 0 0 0 0 0 0 0 3 5 0 0 20 0 0 0 0 0 0 0 0 0 20 0 0 0 0 0 0 0 0 0 0 0 0 0 0 1 0 0 0 0 81 0 7 0 0 0 0 0 0 1 0 0 0 0 0 0 36 0 0 0 0 0 0 13 11 0 0 0 0 0 0 0 0 0 0 0 4 0 0 0 0 0 0 0 0 0 0 24 0 0 0 10 0 0 0 0 0 0 0 0 6 0 0 0 0 0 0 0 1 0 0 0 0 1 0 0 0 0 0 0 0 0 0 0 3 0 0 0 0 0 0 0 3 0 1 0 0 0 0 0 0 0 0 0 0 1 0 0 0 0 0 0 0 0 0 5 0 0 0 0 52 34 0 85 0 0 0 0 3 0 3 119 0 1 0 1 0 0 0 0 0 0 0 15 0 1 0 0 0 0 0 0 0 1 8 0 0 0 0 0 0 0 10 0 0 0 1 0 0 25 14 1 0 1 0 0 0 0 0 0 0 0 0 0 0 0 0 0 0 0 0 0 1 2 0 0 0 0 0 0 0 0 0 0 0 0 0 0 0 0 0 0 2 0 0 0 0 0 0 0 0 0 0 1 0 0 0 0 0 0 0 1 0 0 0 1 0 3 0 0 0 0 0 1 0 0 0 2 0 1 1 0 0 0 0 0 0 0 0 0 27 0 0 3 0 0 7 0 0 4 0 0 0 0 0 0 5 23 0 0 0 0 0 12 0 0 0 0 0 0 0 0 0 0 0 0 11 0 0 0 0 0 0 0 0 0 0 0 0 0 0 0 0 0 40 0 0 8 0 104 0 0 0 0 0 72 2 0 0 0 0 0 0 0 0 0 0 0 0 14 0 49 0 0 0 0 0 0 0 0 0 0 0 38 0 0 21 2 0 0 0 0 0 1 0 0 0 1 0 0 1 0 0 0 0 0 0 0 0 0 0 0 0 0 0 0 3 0 0 0 0 0 0 0 0 0 0 0 0 0 0 0 0 0 3 0 0 0 0 0 0 0 0 0 0 0 0 0 0 0 0 0 0 0 0 0 0 0 0 2 1 0 2 0 0 0 0 0 2 0 0 0 0 0 0 0 1 0 0 0 0 0 0 0 0 0 0 0 11 0 0 0 8 0 294 15 0 0 0 0 0 0 0 1 0 0 0 0 0 0 0 0 0 0 0 0 0 0 0 0 0 0 0 0 0 0 0 1 0 0 0 0 1 0 1 0 0 0 0 0 0 0 0 0 0 1 0 23 0 0 3 3 1 10 0 0 0 0 0 9 0 0 0 0 0 0 3 0 0 14 10 0 0 0 0 0 0 4 0 2 0 10 15 0 0 0 0 1 0 0 27 0 0 6 0 0 0 1 0 0 0 0 0 0 0 0 0 5 0 7 12 0 0 0 0 0 0 0 0 0 0 0 0 0 0 0 0 0 0 0 0 0 0 0 4 0 0 0 0 0 0 0 15 0 1 0 0 6 4 0 0 0 0 0 2 0 0 0 0 0 4 12 2 0 0 0 1 0 1 1 0 0 0 0 0 0 0 0 0 0 0 0 0 0 120 0 0 0 1 0 0 0 0 0 0 0 0 0 0 0 0 0 0 9 0 1 0 0 0 0 1 0 0 0 0 0 0 0 0 5 8 0 0 0 0 0 0 1 0 4 1 0 0 1 0 0 0 0 0 0 0 1 0 137 0 0 0 0 0 0 0 0 0 0 0 0 0 0 0 0 0 25 0 0 3 0 0 0 0 0 0 0 1 0 0 0 0 0 0 0 0 0 0 0 0 0 1 0 0 0 0 0 6 0 0 0 0 0 0 0 0 0 0 0 0 0 5 0 3 0 0 0 0 0 0 0 2 0 0 0 0 5 10 0 1 1 0 0 0 0 0 10 4 0 0 0 3 0 1 0 0 0 5 17 0 0 7 0 1 3 0 1 0 0 0 0 1 0 0 0 0 0 0 0 0 0 0 0 0 0 0 0 0 0 0 0 0 0 0 0 1 2 0 0 1 0 0 0 0 0 0 21 0 4 4 0 0 0 0 0 33 0 0 0 0 0 1 25 0 0 4 0 0 0 0 0 0 3 0 0 3 0 0 2 1 1 0 0 0 0 0 0 0 0 0 0 0 0 0 0 0 0 0 0 0 0 0 0 0 1156 0 0 4 18 0 0 1 0 0 2 0 0 0 0 0 0 5 0 10 0 0 0 0 8 0 0 0 0 4 0 0 0 0 0 0 0 0 0 111 0 0 0 0 0 0 0 0 0 0 0 0 0 0 0 0 6 0 0 1 9 0 0 0 0 0 0 0 192 0 0 0 0 0 0 0 0 0 0 12 0 0 0 0 0 0 5 0 8 0 0 0 0 0 0 180 0 0 0 0 0 0 18 0 0 4 0 0 0 0 0 0 0 2 0 0 30 0 0 8 0 0 0 52 0 0 0 0 1 0 3 0 0 0 0 0 1 0 0 0 0 0 0 0 7 0 1 12 0 0 2 0 0 4 1 0 0 0 0 0 0 0 0 0 0 0 2 0 0 1 41 0 2 0 70 2 0 0 0 0 9 0 0 0 1 0 0 0 0 0 1 0 0 0 3 0 0 0 2 0 1 0 0 0 0 23 1 44 0 0 1 0 0 0 0 0 37 0 2 0 14 20 0 0 0 4 0 0 0 0 0 0 2 58 0 0 0 0 0 0 0 0 0 13 0 0 0 0 12 2 0 1 8 0 0 9 0 0 1 3 0 0 0 0 0 1 0 0 0 0 0 0 0 0 0 7 0 0 13 1 0 0 0 0 0 0 0 0 2 2 0 0 3 1 0 0 0 0 1 1 0 0 0 0 0 0 0 2 0 0 0 0 0 1 0 2 0 0 0 0 0 0 0 0 0 5 0 0 1 0 1 0 0 0 0 0 3 1 41 0 0 0 1 0 0 0 0 0 0 0 0 0 23 3 0 0 0 0 0 0 0 0 8 0 1 1 2 0 0 0 0 0 0 0 0 92 0 0 2 0 0 0 0 0 0 0 0 0 0 0 0 0 0 1 0 0 3 7 0 1 0 6 0 293 0 0 0 0 0 0 0 0 0 0 0 0 0 0 0 2 0 0 0 0 0 0 0 0 8 6 0 2 0 0 0 1 0 0 1 132 0 0 0 0 1 3 0 0 2 0 0 13 2 0 30 1 0 1 0 0 0 74 0 0 0 0 0 0 0 0 0 0 0 0 0 0 0 0 1 0 0 0 0 0 2 0 0 0 0 SP402 Bacteria;Firmicutes;Bacilli;Lactobacillales;Streptococcaceae;Streptococcus;sp. HMT057 193 58 11 1147 21 40 112 320 13 35 120 6 214 45 16 509 63 52 71 169 701 2044 90 79 134 1836 109 328 1 2 13 1721 0 317 122 173 205 517 154 3 102 29 108 71 28 117 18 89 117 197 229 686 1559 15 300 11 261 53 10 8 48 6 237 11 359 5 29 8 53 3 53 12 548 430 668 0 277 120 178 128 3 34 50 17 86 124 462 137 488 89 0 235 26 12 1105 7 0 6 1 179 51 97 65 7 50 35 51 9 30 379 101 4 318 24 480 9 146 261 10 28 287 69 47 136 36 80 159 299 9 10 233 21 963 177 337 0 34 377 36 1 260 1 83 2 10 789 128 33 407 0 173 24 10 714 123 127 45 696 169 149 66 0 42 82 16 413 185 236 0 340 0 216 138 1 255 394 67 92 14 4 458 81 49 1582 261 54 0 6 4 249 32 34 91 945 116 498 1079 33 34 11 2 70 216 0 3 1842 0 1 19 0 31 3 55 751 65 90 10 172 0 193 181 66 13 43 32 71 380 24 5 212 248 3 73 2 248 2 68 146 68 43 87 0 33 2 14 578 170 30 24 450 40 0 0 305 111 36 64 281 216 182 678 173 55 1416 138 186 135 742 0 0 0 0 0 0 0 0 0 0 0 0 0 0 0 0 0 0 0 0 0 0 0 0 0 0 0 0 0 0 0 0 0 0 0 0 0 0 0 0 0 0 0 0 0 0 0 0 0 0 0 0 0 0 0 0 0 0 0 0 0 0 0 0 0 0 0 0 0 0 0 0 0 0 0 0 0 0 0 0 0 0 0 0 0 0 0 0 0 0 0 0 0 0 0 0 0 0 0 0 0 0 0 0 0 0 0 0 0 0 0 0 0 0 0 0 0 0 0 0 0 0 0 0 0 0 0 0 0 0 0 0 0 0 0 0 0 0 0 0 0 0 0 0 0 0 0 0 0 0 0 0 0 0 0 0 0 0 0 0 0 0 0 0 0 0 0 0 0 0 0 0 0 0 0 0 0 0 0 0 0 0 0 0 0 0 0 0 0 0 0 0 0 0 0 0 0 0 0 0 0 0 0 0 0 0 0 0 0 0 0 0 0 0 0 0 0 0 0 0 0 0 0 0 0 0 0 0 0 0 0 0 0 0 0 0 0 0 0 0 0 0 0 0 0 0 0 0 0 0 0 0 0 0 0 0 0 0 0 0 0 0 0 0 0 0 0 0 0 0 0 0 0 0 0 0 0 0 0 0 0 0 0 0 0 0 0 0 0 0 0 0 0 0 0 0 0 0 0 0 0 0 0 0 0 0 0 0 0 0 0 0 0 0 0 0 0 0 0 0 0 0 0 0 0 0 0 0 0 0 0 0 0 0 0 0 0 0 0 0 0 0 0 0 0 0 0 0 0 0 0 0 0 0 0 0 0 0 0 0 0 0 0 0 0 0 0 0 0 0 0 0 0 0 0 0 0 0 0 0 0 0 0 0 0 0 0 0 0 0 0 0 0 0 0 0 0 0 0 0 0 0 0 0 0 0 0 0 0 0 0 0 0 0 0 0 0 0 0 0 0 0 0 0 0 0 0 0 0 0 0 0 0 0 0 0 0 0 0 0 0 0 0 0 0 0 0 0 0 0 0 0 0 0 0 0 0 0 0 0 0 0 0 0 0 0 0 0 0 0 0 0 0 0 0 0 0 0 0 0 0 0 0 0 0 0 0 0 0 0 0 0 0 0 0 0 0 0 0 0 0 0 0 0 0 0 0 0 0 0 0 0 0 0 0 0 0 0 0 0 0 0 0 0 0 0 0 0 0 0 0 0 0 0 0 0 0 0 0 0 0 0 0 0 0 0 0 0 0 0 0 0 0 0 0 0 0 0 0 0 0 0 0 0 0 0 0 0 0 0 0 0 0 0 0 0 0 0 0 0 0 0 0 0 0 0 0 0 0 0 0 0 0 0 0 0 0 0 0 0 0 0 0 0 0 0 0 0 0 0 0 0 0 0 0 0 0 0 0 0 0 0 0 0 0 0 0 0 0 0 0 0 0 0 0 0 0 0 0 0 0 0 0 0 0 0 0 0 0 0 0 0 0 0 0 0 0 0 0 0 0 0 0 0 0 0 0 0 0 0 0 0 0 0 0 0 0 0 0 0 0 0 0 0 0 0 0 0 0 0 0 0 0 0 0 0 0 0 0 0 0 0 0 0 0 0 0 0 0 0 0 0 0 0 0 0 0 0 0 0 0 0 0 0 0 0 0 0 0 0 0 0 0 0 0 0 0 0 0 0 0 0 0 0 0 0 0 0 0 0 0 0 0 0 0 0 0 0 0 0 0 0 0 0 0 0 0 0 0 0 0 0 0 0 0 0 0 0 0 0 0 0 0 0 0 0 0 0 0 0 0 0 0 0 0 0 0 0 0 0 0 0 0 0 0 0 0 0 0 0 0 0 0 0 0 0 0 0 0 0 0 0 0 0 0 0 0 0 0 0 0 0 0 0 0 0 0 0 0 0 0 0 0 0 0 0 0 0 0 0 0 0 0 0 0 0 0 0 0 0 0 0 0 0 0 0 0 0 0 0 0 0 0 0 0 0 0 0 0 0 0 0 0 0 0 0 0 0 0 0 0 0 0 0 0 0 0 0 0 0 0 0 0 0 0 0 0 0 0 0 0 0 0 0 0 0 0 0 0 0 0 0 0 0 0 0 0 0 0 0 0 0 0 0 0 0 0 0 0 0 0 0 0 0 0 0 0 0 0 0 0 0 0 0 0 0 0 0 0 0 0 0 0 0 0 0 0 0 0 0 0 0 0 0 0 0 0 0 0 0 0 0 0 0 0 0 0 0 0 0 0 0 0 0 0 0 0 0 0 0 0 0 0 0 0 0 0 0 0 0 0 0 0 0 0 0 0 0 0 0 0 0 0 0 0 0 0 0 0 0 0 0 0 0 0 0 0 0 0 0 0 0 0 0 0 0 0 0 0 0 0 0 0 0 0 0 0 0 0 0 0 0 0 0 0 0 0 0 0 0 0 0 0 0 0 0 0 0 0 0 0 0 0 0 0 0 0 0 0 0 0 0 0 0 0 0 0 0 0 0 0 0 0 0 0 0 0 0 0 0 0 0 0 0 0 0 0 0 0 0 0 0 0 0 0 0 0 0 0 0 0 0 0 0 0 0 0 0 0 0 0 0 0 0 0 0 0 0 0 0 0 0 0 0 0 0 0 0 0 0 0 0 0 0 0 0 0 0 0 0 0 0 0 0 0 0 0 0 0 0 0 0 0 0 0 0 0 0 0 0 0 0 0 0 0 0 0 0 0 0 0 0 0 0 0 0 0 0 0 0 0 0 0 0 0 0 0 0 0 0 0 0 0 0 0 0 0 0 0 0 0 0 0 0 0 0 0 0 0 0 0 0 0 0 0 0 0 0 0 0 0 0 0 0 0 0 0 0 0 0 0 0 0 0 0 0 0 0 0 0 0 0 0 0 0 0 0 0 0 0 0 0 0 0 0 0 0 0 0 0 0 0 0 0 0 0 0 0 0 0 0 0 0 0 0 0 0 0 0 0 0 0 0 0 0 0 0 0 0 0 0 0 0 0 0 0 0 0 0 0 0 0 0 0 0 0 0 0 0 0 0 0 0 0 0 0 0 0 0 0 0 0 0 0 0 0 0 0 0 0 0 0 0 0 0 0 0 0 0 0 0 0 0 0 0 0 0 0 0 0 0 0 0 0 0 0 0 0 0 0 0 0 0 0 0 0 0 0 0 0 0 0 0 0 0 0 0 0 0 0 0 0 0 0 0 0 0 0 0 0 0 0 0 0 0 0 0 0 0 0 0 0 0 0 0 0 0 0 0 0 0 0 0 0 0 0 0 0 0 0 0 0 0 0 0 0 0 0 0 0 0 0 0 0 0 0 0 0 0 0 0 0 0 0 0 0 0 0 0 0 0 0 0 0 0 0 0 0 0 0 0 0 0 0 0 0 0 0 0 0 0 0 0 0 0 0 0 0 0 0 0 0 0 0 0 0 0 0 0 0 0 0 0 0 0 0 0 0 0 0 0 0 0 0 0 0 0 0 0 0 0 0 0 0 0 0 0 0 0 0 0 0 0 0 0 0 SP403 Bacteria;Firmicutes;Clostridia;Clostridiales;Peptostreptococcaceae_[XI];Peptostreptococcaceae_[XI][G-1];[Eubacterium]_sulci 76 0 1 41 10 99 0 406 5 4 356 1 43 51 6 709 76 0 640 426 63 0 88 5 245 279 0 41 1 4 714 233 3 432 299 31 0 8 44 3 2226 4 33 193 0 407 0 0 0 75 100 163 0 4 1646 4 398 77 0 281 0 1 47 2 635 2 0 2398 98 439 6 28 13 0 1 60 77 297 16 24 0 222 19 13 948 118 245 58 7 1409 0 1155 2 0 9 199 1 22 1 64 15 120 0 177 18 18 66 0 749 6 0 24 22 800 663 1 252 1339 1680 235 51 0 288 992 1675 59 418 1067 1730 0 4459 2315 14 24 1196 63 3348 321 40 1350 1 1 2 18 3 259 771 366 308 2 593 147 77 32 45 89 273 0 755 349 27 1 71 5 12 14 3 120 5 0 0 3 29 74 40 134 238 205 0 0 4 3 160 460 146 206 256 88 37 544 274 30 160 191 131 13 1491 145 19 43 1 329 1034 997 55 56 0 1 9 0 0 22 162 60 68 925 14 820 0 204 17 240 109 27 573 1098 229 1 0 684 1546 2 89 0 23 5305 386 77 57 79 23 457 4605 2 4 159 377 9 1951 20 1397 6 24 217 0 6 1102 276 0 275 62 141 23 143 104 97 298 193 0 0 0 0 0 0 0 0 0 0 0 0 0 0 0 0 0 0 0 0 0 0 1 0 0 1 0 0 0 0 0 0 0 0 0 0 0 0 0 0 0 0 0 0 0 0 0 0 0 0 0 0 0 0 1 0 0 0 0 0 0 0 0 0 0 0 0 0 0 0 0 0 0 0 0 0 0 0 0 0 0 0 0 0 0 0 0 0 0 0 0 0 0 0 0 0 0 0 0 0 0 0 0 0 0 0 0 0 0 0 0 0 0 0 0 0 0 0 0 0 0 0 0 0 0 0 0 0 0 0 0 0 0 0 0 0 0 0 0 0 0 0 0 0 0 0 0 0 0 0 0 0 0 0 0 0 0 0 0 0 0 0 0 0 0 0 0 0 0 0 0 0 0 0 0 0 0 0 0 0 1 0 0 0 0 0 0 0 0 0 0 0 0 0 0 0 0 0 0 0 0 0 0 0 0 0 0 0 0 0 0 0 0 0 0 0 0 0 0 0 0 1 0 0 0 0 0 0 0 0 0 0 0 0 0 0 0 0 0 0 0 0 0 0 0 0 0 0 0 0 0 0 0 0 0 0 0 0 0 0 0 0 0 0 0 0 0 0 0 0 0 0 0 0 1 0 0 0 0 0 0 0 0 0 0 0 0 0 0 0 0 0 0 0 0 0 0 0 0 0 0 0 0 0 0 0 0 0 0 0 0 0 0 0 0 0 0 0 0 0 0 0 0 0 0 0 0 0 0 0 0 0 0 0 0 0 0 0 0 0 0 0 0 0 0 0 0 0 0 0 0 0 0 0 0 0 0 0 0 0 0 0 0 0 0 0 0 0 0 0 1 0 0 0 0 0 0 0 0 0 0 0 0 0 0 0 0 0 0 0 0 0 0 0 1 0 0 0 0 0 0 1 0 0 0 0 0 0 0 0 0 0 0 0 0 0 0 0 0 0 0 0 0 0 0 0 0 0 0 0 0 0 0 0 0 0 0 0 0 0 0 0 0 0 0 0 0 0 0 0 0 0 0 0 0 0 0 0 0 0 0 0 0 0 0 0 0 0 1 0 0 0 0 0 0 0 0 0 0 1 0 0 0 0 0 0 0 0 0 0 0 0 0 0 0 0 0 0 0 0 0 0 0 0 0 0 0 0 0 0 0 0 0 0 0 0 0 0 0 0 0 0 1 0 0 0 0 0 0 0 0 0 0 0 0 0 0 0 0 0 0 0 0 0 0 0 0 0 0 0 0 0 0 0 0 0 0 0 0 0 0 0 1 0 0 0 0 0 0 0 0 0 0 0 0 0 0 0 0 0 0 0 0 0 0 0 0 0 0 0 0 0 0 0 0 0 0 0 0 0 0 0 0 0 0 0 0 0 0 0 0 0 0 0 0 0 0 0 0 0 0 0 0 0 0 0 0 0 0 0 0 0 0 0 0 0 0 0 0 0 0 0 0 0 0 0 0 0 0 0 0 0 0 0 0 0 0 0 0 0 0 0 1 0 0 0 0 0 0 0 0 0 0 0 0 0 0 0 0 0 0 0 0 0 0 0 0 0 0 0 0 0 0 0 0 1 0 0 0 0 0 0 0 0 0 0 0 0 0 0 0 0 0 0 0 0 0 0 0 0 0 0 0 0 0 0 0 0 0 0 0 0 0 0 0 0 0 0 0 0 0 0 0 0 0 0 0 0 0 0 0 0 0 0 0 0 0 0 0 0 0 0 0 1 0 0 0 0 0 0 0 0 0 0 0 0 0 0 2 0 0 0 0 0 0 0 0 0 1 0 0 0 0 0 0 0 0 1 0 0 0 0 1 0 0 0 0 0 0 0 4 0 0 0 0 0 0 9 0 0 0 0 0 1 0 0 0 0 0 0 2 0 0 0 0 0 0 0 0 0 0 0 0 2 0 0 0 0 0 1 0 0 0 0 0 0 0 0 0 0 0 0 0 0 0 0 0 0 1 0 0 0 0 0 0 0 0 0 0 0 0 0 0 0 0 0 9 1 0 0 0 0 0 0 0 0 0 0 0 4 0 0 0 0 0 0 0 0 0 0 0 0 0 0 0 0 0 0 0 0 0 0 0 0 0 0 0 0 0 0 0 0 0 0 0 0 1 0 0 0 0 0 0 0 0 0 0 0 0 1 0 0 0 0 0 0 0 0 1 0 0 0 0 0 0 0 0 0 0 0 0 0 0 0 3 0 0 0 2 0 0 0 0 0 0 1 0 0 0 0 0 0 0 0 0 0 0 0 0 0 0 0 0 0 1 0 0 0 0 0 0 0 0 0 0 0 0 0 0 1 3 0 0 0 0 0 0 0 0 0 0 0 0 2 0 0 0 0 0 3 0 0 0 0 0 3 0 0 1 0 0 0 0 7 0 0 0 0 0 0 0 1 1 0 0 3 0 0 0 0 0 0 0 0 0 1 0 0 0 0 0 0 0 0 0 0 0 0 1 0 0 0 0 0 0 0 0 0 1 0 0 0 0 0 0 0 1 0 1 0 0 0 0 2 0 0 0 0 0 0 0 0 0 0 0 0 0 0 0 1 0 2 1 1 0 0 0 0 0 0 0 0 0 0 0 0 0 0 0 0 0 0 0 1 0 0 0 0 0 4 0 0 10 0 0 6 0 0 0 1 0 0 0 1 0 9 0 0 0 10 0 0 0 0 0 0 0 0 0 0 1 0 0 0 0 0 0 1 0 2 0 0 0 1 0 0 0 1 0 0 0 0 0 0 0 0 0 2 0 0 4 0 0 0 0 0 0 0 0 0 0 0 0 1 0 0 0 0 0 5 0 0 0 0 0 0 0 1 1 0 0 0 0 0 0 0 0 1 1 0 0 0 0 0 0 0 0 0 0 0 1 0 1 0 0 0 0 0 0 1 0 1 0 0 0 0 0 0 0 0 0 0 0 0 0 0 0 0 0 0 0 0 0 1 0 1 0 0 0 0 0 0 0 0 0 0 0 0 0 0 0 0 0 0 0 0 0 0 0 0 0 19 0 0 0 0 1 0 0 0 0 0 0 0 0 4 0 2 0 0 0 0 1 1 4 0 0 0 0 0 0 0 0 0 0 0 0 1 0 0 0 0 0 0 0 0 0 0 0 0 1 0 1 0 0 0 0 0 0 0 0 0 0 10 0 0 1 0 0 0 3 0 0 0 0 0 0 0 0 0 0 0 1 0 1 0 0 0 1 0 0 0 0 0 0 0 0 0 0 0 0 0 0 0 0 0 0 0 0 0 0 0 0 0 1 0 1 1 0 0 0 0 1 1 0 0 0 0 0 0 0 2 0 0 0 0 7 0 0 0 1 5 0 0 0 0 0 0 0 0 0 0 0 0 0 0 0 1 0 0 0 0 0 0 0 0 0 0 0 0 0 0 0 0 0 0 0 0 0 0 0 0 0 0 0 0 0 0 0 2 0 0 0 0 1 5 0 0 1 0 0 0 0 4 0 0 0 0 0 0 0 0 0 0 10 0 0 0 0 0 0 0 0 0 0 0 SP405 Bacteria;Saccharibacteria_(TM7);Saccharibacteria_(TM7)_[C-1];Saccharibacteria_(TM7)_[O-1];Saccharibacteria_(TM7)_[F-1];Saccharibacteria_(TM7)_[G-1];bacterium HMT347 2 1 3 54 0 1 32 7 9 156 0 0 0 0 0 0 2 4 0 1 0 0 10 0 24 5 1 0 0 0 0 0 8 7 6 0 1 0 0 0 2 1 0 2 0 0 30 28 8 0 0 0 0 0 0 4 1 2 0 18 13 0 2 0 6 4 11 0 9 4 0 11 0 12 0 0 0 0 39 36 0 0 0 0 0 0 3 21 0 0 0 2 7 0 24 3 0 8 0 13 392 19 0 0 9 0 2 0 3 0 18 7 39 6 2 0 0 0 14 0 1 0 0 0 6 0 0 0 0 0 0 0 8 0 0 0 0 4 8 0 34 0 1406 13 0 0 10 12 3 5 19 3 24 25 2 1 1 235 4 0 8 0 0 0 1 0 44 0 37 0 6 1 0 0 0 15 1 0 0 0 4 0 14 0 2 3 1 0 1 0 0 0 0 0 0 12 0 0 5 0 13 0 5 0 11 1 0 0 14 36 0 0 1 0 11 4 0 3 1 0 58 0 0 0 0 1 0 0 0 13 0 0 0 0 10 0 2 6 1 0 0 0 1 71 3 13 0 1 0 4 8 3 2 0 0 0 4 1 19 9 40 0 3 6 0 0 0 0 0 2 30 0 0 88 13 0 0 0 9 39 18 7 1782 43 7 10 1 0 94 0 3 186 4 0 0 1 0 0 0 0 18 51 21 18 184 725 6 0 28 10 40 0 4 3 109 49 545 0 20 0 0 0 1 0 5 0 2 0 26 1 13 47 31 0 0 0 385 0 0 0 0 160 0 0 0 0 0 73 0 0 0 0 0 0 0 0 0 0 1 0 0 0 0 15 49 146 0 267 0 0 1 13 4 15 0 0 0 0 1 2 1 0 0 0 0 2 0 10 0 0 0 0 0 3 33 0 0 0 0 0 0 0 3518 4 15 0 1 1 0 5 5 177 0 0 0 0 4 0 22 2 0 0 0 3 0 19 161 0 0 0 0 0 0 0 1 0 36 0 0 42 18 0 0 55 0 1 147 0 4 31 244 0 0 0 0 9 0 11 0 0 4 0 0 0 0 1 0 25 0 0 0 0 0 4 15 0 14 0 26 13 2 55 6 0 34 7 1 0 0 85 1 2 0 1 0 0 217 95 0 0 22 0 0 0 0 0 0 5 0 34 0 106 0 2 0 0 0 9 0 0 0 3 37 3 0 358 312 14 0 4 0 0 0 0 3 0 0 83 0 0 8 0 2 106 27 0 9 15 465 127 0 1 0 0 0 393 28 256 0 1 0 6 0 4 299 922 0 0 0 38 0 0 0 149 1 0 0 0 0 0 0 0 14 0 755 0 1 8 0 5 22 0 750 0 189 21 0 9 0 0 0 3 0 4 0 0 0 0 1 21 127 0 0 0 2 1 49 0 25 27 1563 1 6 3 52 86 13 8 77 33 43 2 4 14 4 0 2 0 0 620 372 28 0 117 2 1 0 411 6 5 1 0 896 15 151 0 6 934 246 0 1 0 0 0 240 0 0 0 2 0 89 142 0 1 0 590 72 0 68 26 0 0 0 0 0 238 229 0 2 0 0 0 6 0 11 5 5 16 0 2 0 0 24 20 32 30 109 0 74 4 26 0 18 55 0 0 0 0 0 13 230 36 40 0 810 546 0 3 42 5 2 19 172 30 0 3 5 3 0 6 3 100 1 0 0 0 0 0 104 136 1 0 1 85 0 0 4 0 0 0 89 3 379 0 23 0 3 1 0 5 28 0 2 5 0 8 0 1 2 0 0 0 0 0 0 17 32 0 3 38 0 0 587 16 0 4 1 0 1 0 0 0 12 192 0 114 1 0 92 146 164 1359 2 0 10 6 0 12 57 1 379 35 7 21 62 0 787 2 8 0 1 2727 64 1 0 44 0 85 2 1 350 71 2 0 11 0 0 93 1 0 0 9 0 0 60 89 3 4 0 0 0 0 1818 0 0 0 1046 1 9 13 60 13 6 1 3 0 430 0 0 0 91 0 1081 0 33 0 0 6 6 22 1 0 0 0 0 0 53 0 0 2 108 1190 331 0 170 0 10 237 24 0 0 1 0 0 0 4 0 191 117 0 0 0 1 0 83 7 0 0 0 121 0 0 0 1 0 15 10 11 47 5 0 0 18 81 0 6 36 1 78 0 123 2 7 8 0 17 0 4 2 1 0 70 0 0 3 0 0 2 0 0 0 0 0 12 0 0 9 2 202 3 115 52 0 30 0 24 0 17 2 0 0 0 96 0 0 15 54 71 9 362 0 27 155 0 4 3 0 0 0 0 0 0 0 0 0 0 0 0 0 397 519 2 0 151 406 0 47 7 1 0 0 1 0 3 3 0 31 1 2 0 3 0 0 0 38 0 0 13 2 0 2 8 0 1 0 0 33 1 0 2 0 0 8 0 1 0 0 0 0 0 29 5 0 0 1 43 0 0 0 1 0 0 140 0 0 0 2 0 0 0 0 1 1 0 0 0 2 0 0 0 0 0 0 6 0 0 0 0 8 1 0 0 0 0 0 27 0 0 0 10 2 0 0 1 4 0 0 0 0 2 0 0 0 0 0 0 7 4 0 10 0 0 0 0 0 0 0 0 2 0 0 0 0 0 6 0 4 0 1 14 2 2 4 0 0 0 0 0 0 0 0 22 36 0 0 0 0 3 2 0 0 30 0 4 1 0 1 1 0 0 16 0 0 0 114 5 2 2 0 64 2 0 0 24 0 0 0 0 138 0 2 38 1 0 0 0 0 13 0 0 0 5 1 0 2 5 0 1 2 5 1 1 15 7 12 4 0 0 0 3 0 0 0 26 0 0 0 0 0 0 0 0 0 0 0 0 5 0 0 0 0 0 10 4 9 0 1 3 0 113 5 0 0 0 0 2 0 0 0 0 0 0 0 0 3 0 1 0 0 0 0 0 0 5 0 0 0 24 0 0 42 2 1 0 0 0 0 0 0 0 0 10 0 1 1 1 0 0 0 0 0 0 0 0 0 17 3 22 0 2 0 0 1 6 0 79 7 0 0 0 0 0 0 2 1 9 0 0 0 0 0 0 0 0 3 0 0 0 0 0 0 0 0 0 2 14 41 0 1 0 105 37 0 4 0 0 18 0 0 0 0 0 0 0 0 0 1 0 0 0 0 16 0 0 0 4 0 0 0 0 0 0 0 0 0 0 0 0 0 0 0 2 2 0 0 21 0 0 0 0 4 0 0 0 0 0 0 3 17 0 15 71 0 0 2 0 2 0 122 0 10 0 2 0 0 0 0 0 0 2 0 0 0 1 0 0 26 0 0 0 0 1 36 304 1 2 0 16 1 0 0 0 0 0 0 0 0 0 0 0 0 0 3 0 0 0 0 0 0 0 0 0 304 0 0 1 0 40 0 1 0 0 0 1 1 2 11 0 0 23 0 0 0 0 0 0 0 1 0 0 2 0 274 38 0 30 1 0 2 0 0 0 0 0 0 27 100 0 0 0 8 0 3 0 44 3 0 0 0 0 0 0 0 0 0 4 61 0 0 0 35 16 0 0 0 0 0 1 4 0 0 0 0 0 0 0 0 0 2 0 0 0 0 0 4 0 0 0 0 0 8 141 0 2 10 0 12 66 0 0 1 0 13 0 0 10 0 1 0 0 1 0 0 2 0 1 0 2 0 0 5 0 0 0 0 0 0 0 0 0 0 0 0 58 95 18 0 0 0 0 3 6 2 0 6 6 0 0 0 0 13 3 67 0 4 4 0 9 12 14 2 0 10 0 1 168 0 3 0 0 1 6 0 1 0 6 0 0 0 0 43 16 1 0 1 0 0 0 0 2 1 0 0 0 28 0 0 27 0 6 6 1 0 0 0 140 0 3 0 0 0 0 0 0 3 2 0 9 0 1 7 1 0 5 0 0 0 0 11 5 0 1 0 23 0 0 0 0 4 0 1 1 9 0 0 0 0 0 0 0 0 0 0 0 5 289 13 1 16 38 0 0 0 1 1 12 4 44 0 0 0 0 19 0 70 0 0 0 0 59 0 0 0 24 3 0 64 207 0 0 26 0 0 0 2 0 1 0 0 0 1 1 0 0 0 0 0 0 0 1 0 1 0 1 0 0 0 0 0 0 0 0 6 0 SP409 Bacteria;Fusobacteria;Fusobacteriia;Fusobacteriales;Leptotrichiaceae;Leptotrichia;sp. HMT219 0 0 0 0 0 0 0 0 0 0 0 6 0 0 0 0 0 22 1 3 0 0 0 0 0 2 0 0 0 0 0 0 0 0 1 0 1 0 3 1 0 0 0 0 0 3 0 0 0 0 1 0 0 0 0 0 0 0 4 1 0 0 0 2 0 9 1 0 2 0 0 0 0 0 0 0 0 0 1 0 0 0 0 0 0 0 0 0 0 0 1 0 0 9 0 0 13 11 0 0 0 0 0 0 0 0 0 3 0 0 0 0 0 1 0 0 0 0 0 0 7 0 0 1 0 0 0 1 0 6 0 0 0 0 2 0 0 0 0 0 0 76 0 0 4 0 0 5 0 0 0 0 0 0 0 0 1 0 0 0 0 1 0 0 0 0 0 0 0 0 0 0 0 0 0 0 0 0 0 3 0 0 0 0 0 1 0 0 0 0 0 3 0 0 0 0 0 0 0 3 0 0 0 0 1 0 0 0 0 0 0 0 0 0 0 0 2 0 0 0 0 0 0 0 0 0 0 3 0 3 0 6 0 0 0 0 13 2 0 0 0 0 0 0 0 0 0 0 0 0 0 0 0 0 0 0 0 0 0 0 0 0 0 0 0 0 0 0 0 43 8 0 0 0 13 0 11 0 0 0 28 13 0 0 11 0 0 0 0 0 194 0 0 0 0 161 0 0 0 2 6 6 0 52 3 0 0 1 0 0 0 1 0 0 0 0 0 0 0 0 0 0 0 0 0 0 0 0 0 0 0 0 0 0 0 0 1 0 0 0 0 0 0 0 0 0 0 0 5 0 2 1 0 0 0 0 0 1 0 0 0 0 0 1 1 6 0 0 0 0 0 0 0 0 0 0 0 0 0 2 0 0 5 0 0 1 0 22 0 0 0 0 0 21 367 0 0 0 1 12 0 0 0 0 7 0 0 1 0 0 0 0 0 0 0 0 1 0 2 0 0 0 0 0 0 0 0 0 0 0 0 0 0 0 0 0 0 0 0 0 0 8 0 0 0 0 0 0 7 0 2 0 0 0 0 0 0 1 0 20 1 0 0 0 0 1 0 0 29 0 0 0 0 0 3 0 0 0 0 0 22 0 0 8 7 1 34 62 66 0 0 0 0 32 80 0 0 0 0 0 1 0 0 0 0 0 0 12 0 0 0 0 0 0 0 0 1 0 0 0 0 0 0 0 0 0 0 0 0 2 0 0 0 0 1 0 9 1 0 15 0 0 0 0 63 227 0 0 0 1 6 0 0 0 7 43 0 0 0 0 0 0 0 0 0 6 0 0 0 0 0 0 13 0 88 1 0 0 0 0 0 14 56 0 0 0 5 0 0 0 0 0 0 0 0 0 0 0 0 0 0 0 0 0 0 0 0 1 0 0 118 0 0 0 0 17 0 0 0 0 0 1 0 2 4 0 0 0 0 0 0 1 0 18 98 0 1 0 7 2 0 0 6 7 0 0 0 0 1 0 0 0 0 8 0 0 8 0 0 0 17 0 0 0 1 0 0 0 0 1 0 0 0 9 0 0 0 0 0 0 0 5 2 0 0 2 0 75 0 0 10 0 1 0 0 0 0 0 0 0 0 0 1 1 0 0 0 0 0 0 0 0 0 0 0 1 0 376 15 0 0 0 0 0 0 0 0 0 3 2 4 0 0 1 5 0 8 3 1 2 0 71 99 10 38 0 1 45 1 4 0 50 24 86 0 0 22 2 0 1 329 87 0 17 0 0 0 3 0 0 10 0 0 63 0 1 5 0 0 0 0 0 0 0 0 1 0 2 0 0 0 0 0 0 0 0 0 0 0 1 1 0 0 0 0 1 0 0 1 0 0 0 0 0 0 70 0 0 0 8 0 0 0 0 0 0 0 0 0 0 0 0 0 0 1 1 20 1 1 0 0 0 0 0 0 1 1 0 0 0 0 0 0 0 0 0 0 0 0 0 0 0 0 0 0 1 0 38 6 0 2 3 5 0 1 0 0 0 23 0 0 0 0 0 0 0 0 1 0 0 0 0 0 0 0 0 0 0 1 0 0 0 0 0 0 0 0 0 0 0 2 2 0 0 15 15 0 0 0 0 0 0 0 0 0 0 0 0 0 0 10 0 0 2 1 3 0 0 0 2 0 0 0 1 0 2 3 0 1 0 36 0 0 0 0 0 0 0 10 0 0 0 0 0 0 0 0 19 23 0 0 44 0 0 0 0 0 0 0 0 10 0 0 8 0 0 0 0 0 2 2 0 0 0 0 1 0 1 0 0 0 55 107 0 0 0 0 0 0 0 0 0 0 0 0 0 0 0 0 0 0 0 1 0 0 0 5 0 0 0 18 8 0 1 6 0 0 0 0 0 0 0 0 0 2 0 0 0 0 0 4 2 0 0 5 0 5 0 0 0 48 6 0 1 0 0 0 0 29 0 13 3 0 54 71 15 0 0 0 0 0 0 0 0 0 0 37 0 0 0 0 1 7 0 0 1 50 0 0 0 0 0 7 25 0 0 0 0 0 0 12 0 0 0 0 0 0 0 46 0 47 0 0 0 9 0 0 0 0 2 1 0 0 0 16 0 0 4 0 0 10 0 0 0 0 0 0 0 15 0 0 2 0 0 0 0 0 0 0 0 0 0 0 0 0 0 0 0 2 0 0 5 0 0 32 0 1 0 0 0 0 0 4 0 0 23 0 0 2 2 0 0 12 1 5 0 0 0 0 12 0 0 2 0 1 0 0 14 3 0 2 1 0 0 0 0 0 14 9 0 0 0 0 0 1 4 0 0 0 0 0 34 23 0 0 4 0 0 0 0 0 0 31 0 0 0 1 0 97 0 0 0 0 5 1 21 0 2 0 5 16 0 1 4 0 0 0 2 0 0 0 0 0 7 0 1 0 0 0 10 3 0 0 8 0 0 0 0 0 0 415 12 0 38 0 0 5 3 0 0 19 0 0 28 0 0 0 0 0 22 0 0 0 1 26 0 1 14 1 0 0 0 0 3 0 0 16 21 0 0 0 0 0 0 4 0 2 0 0 261 20 0 35 0 0 132 69 0 0 5 0 0 1 33 6 0 1 1 0 11 2 0 0 0 0 0 0 28 21 1 48 1 0 0 25 0 0 1 10 0 2 0 0 1 45 24 0 0 2 0 0 0 20 0 0 0 0 0 9 0 0 0 0 5 0 0 0 0 0 0 0 4 30 0 0 0 0 0 1 0 0 0 0 0 11 0 0 2 58 0 0 26 0 0 0 0 0 249 0 0 0 7 0 0 2 0 0 2 0 0 0 0 0 5 0 0 0 0 4 0 0 0 0 0 0 0 0 0 1 0 0 0 0 36 0 1 0 0 0 0 0 8 1 3 0 2 0 2 0 0 0 0 0 0 0 3 2 0 28 14 0 128 391 3 434 0 0 0 0 3 7 0 0 0 0 0 0 0 0 3 0 0 0 0 0 1 0 0 0 0 0 0 0 0 0 0 0 0 5 0 21 0 5 0 10 3 0 0 18 8 0 3 0 112 0 6 4 2 0 0 0 50 0 0 9 0 0 0 0 0 2 27 0 103 1 0 0 8 6 0 1 0 0 1 0 0 1 0 6 0 0 47 0 2 0 0 0 32 0 0 0 0 0 0 7 0 0 30 3 8 5 0 0 4 1 8 0 1 0 0 0 0 0 0 0 0 0 5 14 0 0 8 0 0 44 6 0 0 0 0 0 0 0 0 0 0 0 2 0 0 0 14 0 0 163 0 0 0 0 0 162 1 1 1 136 162 0 13 0 2 0 0 0 0 0 0 0 0 1 0 30 1 0 0 0 0 12 4 8 47 10 0 0 0 0 43 0 1 18 0 48 46 0 7 11 10 0 0 0 0 0 0 0 0 0 0 22 20 6 25 0 21 0 0 0 0 0 2 0 0 0 0 70 0 1 5 1 0 0 0 0 0 0 0 0 0 0 0 0 0 0 5 3 0 19 0 1 0 0 116 0 0 0 4 0 0 0 0 0 2 14 0 0 9 1 0 1 7 0 0 0 0 25 0 0 0 0 0 0 0 0 0 0 1 18 0 5 0 0 0 5 1 0 0 0 0 0 0 0 0 0 0 0 0 0 0 5 0 0 2 12 0 0 0 SP41 Bacteria;Fusobacteria;Fusobacteriia;Fusobacteriales;Leptotrichiaceae;Leptotrichia;wadei 0 45 1 2 6 13 22 647 12 44 0 5 18 0 1 1 0 2 244 195 6 0 10 1744 1 5 3 4 152 26 0 0 0 2 0 8 6 974 2 0 0 0 1 20 52 0 48 35 144 1 1 35 14 0 3 0 0 5 0 11 0 8 0 0 34 1 0 2 5 11 47 0 3 11 17 0 5 16 0 2 0 3 0 3 0 0 1 7 0 45 4 1 13 37 0 3 0 0 0 2 2 3 7 40 3 0 0 0 1 1 111 0 49 11 23 0 4 0 164 11 18 0 0 67 2 3 12 1 14 0 1 0 0 7 0 0 142 10 0 0 9 0 0 8 0 0 0 0 0 0 13 0 10 2 0 5 3 2 1 0 0 0 0 4 0 0 0 0 0 1 6 0 0 0 0 0 0 2 0 2 1 0 2 0 222 12 0 0 0 7 1 0 16 0 0 0 1 3 1 4 0 1 1 0 0 172 0 4 4 1 1 1 0 1 3 0 2 1 0 1 0 8 0 0 10 0 93 0 6 59 2 0 2 12 18 0 0 0 0 37 0 0 1 0 0 8 3 1 65 5 1 0 0 5 0 0 0 0 1 3 3 5 0 3 12 1 2 12 0 0 0 0 2 478 125 0 0 0 747 0 42 94 23 103 0 125 82 0 69 53 24 0 0 0 0 0 0 4 0 164 103 0 51 228 6 38 94 0 0 0 0 0 0 1 58 11 1 2 144 4 0 7 0 0 436 0 0 0 0 0 0 2 0 0 0 0 1 0 0 0 0 0 0 0 0 1 1 45 1 0 0 0 0 0 0 0 0 0 0 0 0 0 0 0 0 0 0 1 0 0 0 0 0 0 1 0 0 0 1 0 0 0 0 0 0 0 0 0 0 0 0 0 0 20 0 0 0 0 1 0 1 0 0 0 0 0 0 0 0 0 0 0 1 127 10 0 0 0 0 0 0 2 848 1493 0 546 6 0 0 0 0 0 5 73 0 50 387 0 0 1 251 0 0 22 0 0 0 0 14 47 124 19 0 0 25 0 0 27 0 0 9 0 0 0 0 25 39 1340 0 0 1 0 0 0 0 0 18 24 12 19 0 78 547 562 0 1 0 0 1 4 0 0 1 1 8 0 0 0 0 1 14 0 0 0 0 0 1 0 19 693 5 7 0 0 0 0 0 9 1 0 0 86 0 0 0 361 0 0 0 0 0 0 0 0 0 0 0 0 0 0 0 13 0 0 0 0 1 218 0 695 6 45 0 0 0 0 0 0 0 2 0 212 0 211 633 40 0 0 0 0 0 0 0 5 0 0 0 0 0 0 0 1 0 0 0 0 0 0 0 24 3 0 7 0 1 55 0 108 0 0 0 0 0 10 0 0 0 0 0 0 0 8 3 0 13 0 6 0 0 5 0 0 52 0 0 0 0 0 0 0 0 2 0 0 0 0 683 0 193 13 0 0 0 96 1 0 0 0 0 1 24 0 1 0 0 557 77 0 1 539 0 0 24 544 0 0 25 0 0 0 0 0 0 16 0 0 0 0 0 0 1 1 147 0 0 0 7 0 0 119 0 0 3 4 0 461 0 0 106 0 0 0 11 3 0 0 1127 0 812 1 78 0 32 1 0 1 0 0 0 261 0 2 0 0 0 535 3 45 0 0 165 449 0 4 0 0 2 0 9 4 0 10 5 0 0 0 0 0 0 0 1 0 0 0 4690 207 0 0 0 0 0 0 3 0 0 0 0 0 0 360 0 0 98 0 0 0 0 0 0 0 0 0 0 9 391 0 0 0 0 0 0 0 0 0 0 2 0 0 0 0 0 0 0 0 0 0 0 0 1 0 0 0 0 0 0 0 0 0 0 0 75 14 8 0 1 0 11 1 0 0 0 0 0 0 0 0 0 0 0 0 1071 2 291 0 7 1 28 0 9 0 0 0 2 0 0 4 0 21 3 0 2 0 0 0 0 0 0 0 0 0 77 0 0 22 39 1 0 6 0 0 2 0 0 1 1 0 1 1 0 20 0 0 4 0 0 0 75 0 2 1 61 0 19 0 1 0 0 0 0 0 0 0 0 0 0 0 0 1376 4 1 0 0 0 6 1 468 0 3 0 0 0 0 194 51 0 9 0 0 0 0 0 0 1 11 0 0 37 0 67 0 0 0 165 660 0 7 8 6 135 0 1 3 0 3 0 0 0 0 2 0 31 0 0 4 0 0 171 110 190 51 1 0 0 19 0 12 0 28 1 0 0 0 188 1 0 0 3 1 0 0 0 0 0 0 0 8 0 0 0 0 0 5 0 0 0 0 0 0 0 0 3 1 0 0 50 0 0 0 3 0 2 31 0 2 1 0 121 0 13 0 0 0 0 0 0 0 10 24 18 1 33 2 0 605 37 1 0 0 0 0 6 1 0 0 0 2 0 0 0 0 0 2 0 0 0 83 0 0 11 0 1 0 0 0 0 0 0 0 192 349 5 240 0 0 0 2 0 1 0 0 0 1 0 0 0 0 0 0 0 0 0 3 106 0 0 0 0 0 0 171 0 0 0 0 0 0 204 3 0 1 0 0 0 2 0 0 90 40 7 168 27 0 0 1 0 0 0 3 0 0 20 1 0 20 37 0 0 0 0 0 0 0 0 0 0 0 0 0 0 0 2 240 8 1 0 0 0 0 30 1 0 26 0 0 0 0 0 0 0 18 117 0 10 0 0 0 6 22 0 0 0 0 17 109 0 1 0 15 0 0 13 0 0 5 0 1 0 0 0 0 0 38 2 0 51 563 0 0 30 307 0 6 12 0 18 4 0 87 193 0 0 2 9 0 0 0 0 0 0 0 0 0 0 0 0 0 0 0 0 0 0 0 0 0 0 0 0 1 0 0 0 0 1 0 0 0 845 97 0 0 0 0 0 0 3 0 115 0 0 0 1 0 0 50 12 0 4 0 0 4 0 8 0 0 0 0 0 0 0 0 0 0 0 4 5 0 0 0 0 0 0 0 0 0 0 0 0 0 0 21 1 0 4 0 0 0 0 0 99 1 0 0 4 1 0 0 1 0 0 0 0 0 0 0 0 0 1 0 0 0 0 0 87 0 2 3 0 0 285 0 0 0 0 0 28 0 0 163 10 3 0 0 0 3 0 0 1 0 0 1 0 62 0 0 3 112 448 0 0 0 1 0 0 159 0 0 0 0 0 0 0 1 0 0 741 0 0 0 0 0 0 0 0 1 0 0 0 16 0 0 0 0 0 6 0 1 0 0 0 9 525 15 0 65 0 0 0 1 8 0 4 86 0 0 0 0 3 0 2 0 0 0 203 0 0 16 2 1 5 0 0 166 0 92 0 0 1 0 0 0 0 33 56 0 1 0 0 0 11 0 0 0 0 0 0 0 0 0 0 0 0 0 0 1 0 198 1 0 0 179 9 0 2 0 0 8 0 0 0 0 0 0 10 21 0 0 42 0 0 1 0 0 9 0 0 4 0 0 0 0 0 0 0 0 0 0 0 0 0 0 1 258 0 10 0 44 0 0 15 0 69 27 0 0 0 0 0 0 357 0 0 0 0 0 2 0 30 3 6 0 2 9 0 2 0 0 0 0 1 2 1 1 0 0 355 0 39 1 0 2 9 7 0 0 0 0 0 0 0 0 137 0 0 2 13 0 1 6 2 0 0 0 0 0 0 4 0 0 1 0 179 0 0 0 0 0 0 0 0 0 0 1 0 0 91 2 0 0 0 0 0 0 0 0 1 0 0 0 0 0 1 0 0 0 2 0 0 0 0 0 33 31 0 106 1 0 0 310 0 0 0 0 0 0 0 0 110 0 0 0 1 0 14 0 523 0 0 41 14 0 1 0 1 365 0 0 0 0 0 0 0 0 0 32 11 0 0 0 0 0 2 0 0 26 0 0 85 50 0 0 0 134 0 21 6 0 0 0 50 1 0 0 0 0 0 1 0 0 0 0 0 10 5 0 95 78 0 0 0 0 0 0 0 65 211 6 47 0 0 0 91 0 0 2 17 0 0 0 0 93 0 0 0 0 77 0 104 0 2 10 532 0 4 2 0 0 2 0 0 0 0 1 0 39 17 0 0 0 2 0 0 0 0 0 0 0 0 0 0 0 0 2 0 0 SP410 Bacteria;Firmicutes;Bacilli;Lactobacillales;Streptococcaceae;Streptococcus;peroris 6 0 17 22 563 7 3 2 7 154 13 25 6 3 3 11 46 27 7 8 41 17 34 51 22 12 0 91 9 46 3 8 4 4 29 17 186 23 17 15 1 51 4 15 29 0 463 15 576 15 37 7 5083 4 8 31 26 10 26 24 24 41 20 0 32 61 47 15 19 5 40 20 260 1560 379 2 36 26 14 85 33 65 119 99 0 10 47 220 108 0 12 6287 16 3 1 4 17 0 0 1058 8 158 3 1 84 33 14 1 4 258 400 103 113 5 8 12 12 2 12 292 5 29 10 5 23 30 6 2 9 73 2 1 5 115 21 5 14 37 5 2 574 102 30 89 34 1 7 3 67 18 11 9 3 63 116 163 13 64 52 102 13 6 5 0 2 414 5 22 10 59 1937 11 4 6 6 27 46 43 3 23 17 118 14 12 32 54 45 19 0 10 3 14 30 37 180 261 8 94 59 13 4 2 36 0 1 7 37 0 14 0 0 28 20 2 0 13 6 7 84 1 35 26 50 64 46 6 12 31 40 2 20 5 11 18 13 4 2 5 19 11 5 1 0 1 0 23 20 0 11 4 2 5 0 11 1 0 8 4 83 0 28 0 1 14 6 10 29 9 0 0 0 0 0 0 0 0 0 0 0 0 0 0 0 0 0 0 0 0 0 0 0 0 0 0 0 0 0 0 0 0 0 0 0 0 0 0 0 0 0 0 0 0 0 0 0 0 0 0 0 0 0 0 0 0 0 0 0 0 0 0 0 0 0 0 0 0 0 0 0 0 0 0 0 0 0 0 0 0 0 0 0 0 0 0 0 0 0 0 0 0 0 0 0 0 0 0 0 0 0 0 0 0 0 0 0 0 0 0 0 0 0 0 0 0 0 0 0 0 0 0 0 0 0 0 0 0 0 0 0 0 0 0 0 0 0 0 0 0 0 0 0 0 0 0 0 0 0 0 0 0 0 0 0 0 0 0 0 0 0 0 0 0 0 0 0 0 0 0 0 0 0 0 0 0 0 0 0 0 0 0 0 0 0 0 0 0 0 0 0 0 0 0 0 0 0 0 0 0 0 0 0 0 0 0 0 0 0 0 0 0 0 0 0 0 0 0 0 0 0 0 0 0 0 0 0 0 0 0 0 0 0 0 0 0 0 0 0 0 0 0 0 0 0 0 0 0 0 0 0 0 0 0 0 0 0 0 0 0 0 0 0 0 0 0 0 0 0 0 0 0 0 0 0 0 0 0 0 0 0 0 0 0 0 0 0 0 0 0 0 0 0 0 0 0 0 0 0 0 0 0 0 0 0 0 0 0 0 0 0 0 0 0 0 0 0 0 0 0 0 0 0 0 0 0 0 0 0 0 0 0 0 0 0 0 0 0 0 0 0 0 0 0 0 0 0 0 0 0 0 0 0 0 0 0 0 0 0 0 0 0 0 0 0 0 0 0 0 0 0 0 0 0 0 0 0 0 0 0 0 0 0 0 0 0 0 0 0 0 0 0 0 0 0 0 0 0 0 0 0 0 0 0 0 0 0 0 0 0 0 0 0 0 0 0 0 0 0 0 0 0 0 0 0 0 0 0 0 0 0 0 0 0 0 0 0 0 0 0 0 0 0 0 0 0 0 0 0 0 0 0 0 0 0 0 0 0 0 0 0 0 0 0 0 0 0 0 0 0 0 0 0 0 0 0 0 0 0 0 0 0 0 0 0 0 0 0 0 0 0 0 0 0 0 0 0 0 0 0 0 0 0 0 0 0 0 0 0 0 0 0 0 0 0 0 0 0 0 0 0 0 0 0 0 0 0 0 0 0 0 0 0 0 0 0 0 0 0 0 0 0 0 0 0 0 0 0 0 0 0 0 0 0 0 0 0 0 0 0 0 0 0 0 0 0 0 0 0 0 0 0 0 0 0 0 0 0 0 0 0 0 0 0 0 0 0 0 0 0 0 0 0 0 0 0 0 0 0 0 0 0 0 0 0 0 0 0 0 0 0 0 0 0 0 0 0 0 0 0 0 0 0 0 0 0 0 0 0 0 0 0 0 0 0 0 0 0 0 0 0 0 0 0 0 0 0 0 0 0 0 0 0 0 0 0 0 0 0 0 0 0 0 0 0 0 0 0 0 0 0 0 0 0 0 0 0 0 0 0 0 0 0 0 0 0 0 0 0 0 0 0 0 0 0 0 0 0 0 0 0 0 0 0 0 0 0 0 0 0 0 0 0 0 0 0 0 0 0 0 0 0 0 0 0 0 0 0 0 0 0 0 0 0 0 0 0 0 0 0 0 0 0 0 0 0 0 0 0 0 0 0 0 0 0 0 0 0 0 0 0 0 0 0 0 0 0 0 0 0 0 0 0 0 0 0 0 0 0 0 0 0 0 0 0 0 0 0 0 0 0 0 0 0 0 0 0 0 0 0 0 0 0 0 0 0 0 0 0 0 0 0 0 0 0 0 0 0 0 0 0 0 0 0 0 0 0 0 0 0 0 0 0 0 0 0 0 0 0 0 0 0 0 0 0 0 0 0 0 0 0 0 0 0 0 0 0 0 0 0 0 0 0 0 0 0 0 0 0 0 0 0 0 0 0 0 0 0 0 0 0 0 0 0 0 0 0 0 0 0 0 0 0 0 0 0 0 0 0 0 0 0 0 0 0 0 0 0 0 0 0 0 0 0 0 0 0 0 0 0 0 0 0 0 0 0 0 0 0 0 0 0 0 0 0 0 0 0 0 0 0 0 0 0 0 0 0 0 0 0 0 0 0 0 0 0 0 0 0 0 0 0 0 0 0 0 0 0 0 0 0 0 0 0 0 0 0 0 0 0 0 0 0 0 0 0 0 0 0 0 0 0 0 0 0 0 0 0 0 0 0 0 0 0 0 0 0 0 0 0 0 0 0 0 0 0 0 0 0 0 0 0 0 0 0 0 0 0 0 0 0 0 0 0 0 0 0 0 0 0 0 0 0 0 0 0 0 0 0 0 0 0 0 0 0 0 0 0 0 0 0 0 0 0 0 0 0 0 0 0 0 0 0 0 0 0 0 0 0 0 0 0 0 0 0 0 0 0 0 0 0 0 0 0 0 0 0 0 0 0 0 0 0 0 0 0 0 0 0 0 0 0 0 0 0 0 0 0 0 0 0 0 0 0 0 0 0 0 0 0 0 0 0 0 0 0 0 0 0 0 0 0 0 0 0 0 0 0 0 0 0 0 0 0 0 0 0 0 0 0 0 0 0 0 0 0 0 0 0 0 0 0 0 0 0 0 0 0 0 0 0 0 0 0 0 0 0 0 0 0 0 0 0 0 0 0 0 0 0 0 0 0 0 0 0 0 0 0 0 0 0 0 0 0 0 0 0 0 0 0 0 0 0 0 0 0 0 0 0 0 0 0 0 0 0 0 0 0 0 0 0 0 0 0 0 0 0 0 0 0 0 0 0 0 0 0 0 0 0 0 0 0 0 0 0 0 0 0 0 0 0 0 0 0 0 0 0 0 0 0 0 0 0 0 0 0 0 0 0 0 0 0 0 0 0 0 0 0 0 0 0 0 0 0 0 0 0 0 0 0 0 0 0 0 0 0 0 0 0 0 0 0 0 0 0 0 0 0 0 0 0 0 0 0 0 0 0 0 0 0 0 0 0 0 0 0 0 0 0 0 0 0 0 0 0 0 0 0 0 0 0 0 0 0 0 0 0 0 0 0 0 0 0 0 0 0 0 0 0 0 0 0 0 0 0 0 0 0 0 0 0 0 0 0 0 0 0 0 0 0 0 0 0 0 0 0 0 0 0 0 0 0 0 0 0 0 0 0 0 0 0 0 0 0 0 0 0 0 0 0 0 0 0 0 0 0 0 0 0 0 0 0 0 0 0 0 0 0 0 0 0 0 0 0 0 0 0 0 0 0 0 0 0 0 0 0 0 0 0 0 0 0 0 0 0 0 0 0 0 0 0 0 0 0 0 0 0 0 0 0 0 0 0 0 0 0 0 0 0 0 0 0 0 0 0 0 0 0 0 0 0 0 0 0 0 0 0 0 0 0 0 0 0 0 0 0 0 0 0 0 0 0 0 0 0 0 0 0 0 0 0 0 0 0 0 0 0 0 0 0 0 0 0 0 0 0 SP414 Bacteria;Proteobacteria;Betaproteobacteria;Neisseriales;Neisseriaceae;Neisseria;sp. HMT499 0 0 0 0 0 0 0 0 0 0 0 271 5 0 2 0 0 0 0 0 0 0 0 0 0 0 0 0 0 0 0 0 0 0 0 0 0 0 0 0 0 0 0 0 0 0 0 0 0 0 4 1 0 0 0 0 0 0 0 9 0 0 0 0 0 0 0 0 21 0 7 0 2 0 20 0 0 0 0 0 1 0 0 0 0 0 0 0 0 0 0 0 0 0 0 0 0 0 6 0 0 3 0 0 0 0 0 0 0 0 1 0 0 26 2 0 0 0 4 0 0 0 0 1 0 0 2 0 0 0 0 0 0 0 1 0 0 0 0 0 2 0 0 12 2 0 0 0 0 0 0 0 0 0 0 0 0 0 1 0 0 0 0 0 0 0 1 0 9 0 0 0 0 0 0 0 0 0 0 0 0 0 0 0 1 0 0 0 0 0 0 0 4 0 0 0 0 0 0 0 0 0 0 0 0 0 0 0 0 0 0 67 0 0 0 0 1 0 0 5 0 0 0 0 0 0 0 1 0 0 0 1 0 0 0 0 0 0 0 0 0 0 0 0 0 0 0 1 0 1 0 0 0 0 0 0 0 0 0 0 5 0 0 0 3 0 0 0 0 0 1 0 0 0 0 0 0 0 0 0 47 18 0 0 0 0 0 0 0 0 0 0 0 0 0 0 0 0 0 0 0 0 0 0 0 0 9 0 0 1 0 0 0 0 0 0 0 0 3 0 0 0 0 0 0 0 0 0 0 0 0 0 0 0 0 0 0 0 0 0 0 0 0 0 0 1 0 955 1142 748 0 0 1 0 0 0 0 0 0 0 0 0 0 0 0 0 0 0 0 0 0 0 0 0 0 49 1796 0 0 0 0 0 0 0 0 0 0 0 0 0 0 0 0 1 0 0 0 0 0 2 0 0 0 0 0 0 0 93 0 0 0 0 0 0 0 0 1 0 0 0 0 0 215 0 0 120 0 0 0 0 0 0 0 0 0 0 0 0 0 0 0 0 0 0 0 0 0 0 0 0 0 36 3 9 0 0 0 0 0 0 0 0 0 0 0 0 0 0 0 0 0 0 0 0 0 72 0 0 0 0 0 0 41 22 0 0 45 24 109 0 0 0 0 0 0 0 0 0 0 0 0 0 0 0 0 0 0 0 0 0 0 0 0 0 0 0 0 0 0 0 0 0 0 7 0 0 10 0 0 0 0 0 0 0 0 0 0 0 0 0 0 0 0 0 0 0 0 0 0 0 0 0 0 0 0 0 0 0 1 0 0 0 0 0 0 0 0 0 0 0 0 0 0 0 0 0 0 0 0 0 0 0 0 0 652 0 33 0 0 0 0 0 0 0 0 0 0 73 0 0 0 0 0 0 0 0 0 0 0 0 0 0 0 0 0 0 0 0 0 0 1 0 0 1 0 0 0 28 0 0 0 0 0 57 0 0 0 0 0 0 131 0 0 0 0 0 0 0 0 0 1267 0 0 0 0 2 0 0 0 0 0 0 0 0 0 1260 182 0 0 0 0 0 0 0 0 0 0 0 0 0 0 0 0 0 0 0 0 0 0 0 0 0 0 0 0 0 1 0 0 0 0 0 3 6 0 0 0 0 0 0 0 0 0 1 0 0 0 0 0 0 0 1 0 0 0 0 0 1 40 3 0 0 0 0 0 0 0 0 52 1 0 0 0 0 0 0 0 0 0 0 0 0 0 0 0 0 0 0 0 0 0 0 0 16 0 0 0 0 0 0 0 0 5 0 0 0 0 0 0 0 0 0 0 0 70 68 0 0 0 0 0 0 0 0 0 1 0 0 0 0 0 0 0 0 0 0 0 0 0 0 0 0 0 0 0 0 0 0 0 0 0 908 0 410 0 0 0 174 10 0 0 0 0 0 0 0 0 0 0 0 0 0 0 0 66 2048 3 0 0 0 0 0 0 0 0 0 0 0 0 0 0 0 0 0 0 0 0 0 1 0 0 0 0 0 0 0 0 0 0 0 3 1020 916 0 0 0 0 0 0 0 0 0 0 0 0 0 0 0 214 0 0 0 0 0 0 0 0 0 0 0 0 0 0 0 0 0 0 0 0 0 0 0 0 0 0 0 0 0 0 0 0 0 0 61 0 0 0 0 1 0 0 0 0 0 0 0 0 0 0 0 0 0 0 0 0 0 0 0 0 0 0 0 0 0 1 0 0 0 0 0 0 0 0 0 1 0 0 0 0 0 0 0 0 0 0 0 0 0 0 0 0 0 1 0 0 0 0 0 0 0 0 0 0 0 0 10 0 0 0 0 0 0 0 0 0 0 0 1 201 0 0 0 0 0 0 0 0 1 0 0 0 0 0 1 0 0 0 0 1 0 0 0 0 0 0 0 0 0 0 0 0 0 0 3 0 0 0 0 0 0 0 0 0 0 0 0 0 0 0 0 0 0 0 0 0 0 0 0 0 0 0 0 0 0 0 0 0 0 0 0 0 0 0 0 0 0 0 0 0 0 0 0 0 0 0 0 0 0 0 0 0 0 0 0 0 0 0 0 0 0 0 0 0 0 0 0 0 0 0 0 0 0 0 0 0 0 0 0 0 1 0 0 0 0 0 0 0 0 0 0 0 0 0 0 0 0 0 0 0 0 0 0 0 0 0 0 0 0 0 0 0 0 0 0 0 0 0 0 0 0 0 0 0 0 0 0 0 0 0 0 0 0 0 0 0 0 0 0 0 1 2 0 0 0 0 0 0 0 0 0 0 0 0 0 0 0 0 0 0 0 0 0 0 0 0 0 0 0 0 0 0 3 3 0 0 0 0 0 0 0 0 0 0 0 0 0 0 0 0 0 0 0 0 0 3 0 0 0 0 0 0 0 0 0 0 0 0 0 0 0 0 0 0 0 0 0 0 0 0 0 0 0 0 0 0 0 0 0 0 0 0 1 0 0 0 0 0 0 0 0 0 0 0 0 0 0 0 0 0 0 0 0 0 0 0 2 0 0 0 0 0 0 0 0 0 0 0 0 0 0 0 0 0 0 0 0 0 0 0 0 0 0 0 0 0 0 0 0 0 0 0 0 0 0 12 0 0 0 0 1 0 0 0 0 0 0 0 0 0 0 0 0 0 1 0 0 0 0 0 1 0 0 0 0 0 0 0 0 0 0 0 14 4 4 0 0 0 0 0 0 0 0 0 0 0 0 0 0 0 0 0 0 0 0 0 0 0 0 0 0 0 91 0 0 0 0 0 0 0 0 0 0 0 1 0 0 0 0 0 0 0 0 0 0 0 0 0 0 0 0 33 14 0 10 0 0 0 0 0 0 0 0 0 0 0 0 0 0 1 2 0 0 0 0 0 0 0 0 0 0 0 0 0 0 0 0 0 0 0 0 0 0 0 0 0 0 0 0 0 0 0 0 0 0 0 0 0 0 0 0 0 0 0 0 0 0 0 0 0 0 0 0 0 0 0 0 0 0 0 0 0 0 0 1 0 0 0 0 0 0 0 0 0 0 0 0 0 0 0 0 0 0 0 0 0 0 0 0 0 0 0 0 0 0 0 0 0 0 0 0 0 0 0 0 0 0 0 0 1 0 0 0 0 0 0 0 1 0 0 0 1 0 0 0 0 0 0 0 0 0 0 0 0 0 0 0 0 0 0 0 0 0 0 0 0 0 0 0 0 0 0 0 0 0 0 0 0 0 0 0 0 0 0 0 0 0 0 0 0 0 0 0 0 0 0 0 0 0 0 0 0 0 0 0 0 1 0 0 0 0 0 0 0 0 0 0 0 0 0 0 0 1 0 0 0 0 0 0 0 0 0 0 0 0 0 0 0 0 0 0 0 0 0 0 0 0 0 0 0 0 0 0 0 0 0 0 0 0 0 0 0 0 0 0 0 0 0 0 0 0 0 0 0 0 0 0 0 0 0 0 0 0 0 0 0 0 0 0 0 1 0 0 0 0 0 0 0 0 0 0 0 0 0 0 0 0 1 0 0 0 0 0 0 0 0 0 0 0 0 0 0 0 0 0 0 0 0 0 0 0 0 0 0 0 0 0 0 0 0 0 0 0 0 0 0 0 0 0 0 0 0 0 0 0 0 0 0 0 0 0 0 0 0 0 0 0 0 0 0 0 0 0 0 0 SP415 Bacteria;Proteobacteria;Gammaproteobacteria;Pasteurellales;Pasteurellaceae;Aggregatibacter;sp. HMT513 1 0 2 0 0 16 0 0 0 6 0 54 214 7 9960 0 2 10 0 0 0 0 0 0 2 0 6 1 0 0 2 2 14 1 0 0 1 0 0 0 0 0 0 0 4 0 0 0 0 4 6 2 0 44 0 0 0 0 59 0 4 0 0 0 0 10 3 0 74 0 0 0 0 0 0 2 3 0 0 0 20 0 0 1 0 0 4 0 9 0 0 0 3 24 0 0 1 1 10 2 0 8 0 0 1 52 1 2 0 0 0 0 0 0 0 0 0 0 2 0 0 6 0 6 3 0 0 0 0 0 0 0 0 6 0 71 0 0 0 0 21 2 3 3 0 0 1 1 0 0 0 0 0 0 0 2 0 0 0 0 5 1 0 0 0 0 12 0 8 1 0 0 0 52 0 0 0 0 0 0 0 2 2 2 0 3 0 0 0 4 0 0 0 0 0 18 0 0 2 17 0 0 20 0 0 1 0 0 2 3 0 0 0 0 0 2 0 0 5 0 7 0 0 4 0 0 7 3 132 0 0 0 2 0 0 0 3 0 0 19 0 0 0 2 0 0 0 0 0 1 0 1 0 0 0 0 0 0 0 0 0 0 0 0 0 0 0 0 0 0 0 0 0 0 0 0 0 0 0 0 0 0 0 0 0 0 0 0 0 0 0 0 0 0 0 0 0 0 0 0 0 0 0 0 0 0 0 0 0 0 0 0 0 0 0 0 0 0 0 0 0 0 0 0 0 0 0 0 0 0 0 0 0 0 0 0 0 0 0 0 0 0 0 0 0 0 0 0 0 0 0 0 0 0 0 0 0 0 0 0 0 0 0 0 0 0 0 0 0 0 0 0 0 0 0 0 0 0 0 0 0 0 0 0 0 0 0 0 0 0 0 0 0 0 0 0 0 0 0 0 0 0 0 0 0 0 0 0 0 0 0 0 0 0 0 0 0 0 0 0 0 0 0 0 0 0 0 0 0 0 0 0 0 0 0 0 0 0 0 0 0 0 0 0 0 0 0 0 0 0 0 0 0 0 0 0 0 0 0 0 0 0 0 0 0 0 0 0 0 0 0 0 0 0 0 0 0 0 0 0 0 0 0 0 0 0 0 0 0 0 0 0 0 0 0 0 0 0 0 0 0 0 0 0 0 0 0 0 0 0 0 0 0 0 0 0 0 0 0 0 0 0 0 0 0 0 0 0 0 0 0 0 0 0 0 0 0 0 0 0 0 0 0 0 0 0 0 0 0 0 0 0 0 0 0 0 0 0 0 0 0 0 0 0 0 0 0 0 0 0 0 0 0 0 0 0 0 0 0 0 0 0 0 0 0 0 0 0 0 0 0 0 0 0 0 0 0 0 0 0 0 0 0 0 0 0 0 0 0 0 0 0 0 0 0 0 0 0 0 0 0 0 0 0 0 0 0 0 0 0 0 0 0 0 0 0 0 0 0 0 0 0 0 0 0 0 0 0 0 0 0 0 0 0 0 0 0 0 0 0 0 0 0 0 0 0 0 0 0 0 0 0 0 0 0 0 0 0 0 0 0 0 0 0 0 0 0 0 0 0 0 0 0 0 0 0 0 0 0 0 0 0 0 0 0 0 0 0 0 0 0 0 0 0 0 0 0 0 0 0 0 0 0 0 0 0 0 0 0 0 0 0 0 0 0 0 0 0 0 0 0 0 0 0 0 0 0 0 0 0 0 0 0 0 0 0 0 0 0 0 0 0 0 0 0 0 0 0 0 0 0 0 0 0 0 0 0 0 0 0 0 0 0 0 0 0 0 0 0 0 0 0 0 0 0 0 0 0 0 0 0 0 0 0 0 0 0 0 0 0 0 0 0 0 0 0 0 0 0 0 0 0 0 0 0 0 0 0 0 0 0 0 0 0 0 0 0 0 0 0 0 0 0 0 0 0 0 0 0 0 0 0 0 0 0 0 0 0 0 0 0 0 0 0 0 0 0 0 0 0 0 0 0 0 0 0 0 0 0 0 0 0 0 0 0 0 0 0 0 0 0 0 0 0 0 0 0 0 0 0 0 0 0 0 0 0 0 0 0 0 0 0 0 0 0 0 0 0 0 0 0 0 0 0 0 0 0 0 0 0 0 0 0 0 0 0 0 0 0 0 0 0 0 0 0 0 0 0 0 0 0 0 0 0 0 0 0 0 0 0 0 0 0 0 0 0 0 0 0 0 0 0 0 0 0 0 0 0 0 0 0 0 0 0 0 0 0 0 0 0 0 0 0 0 0 0 0 0 0 0 0 0 0 0 0 0 0 0 0 0 0 0 0 0 0 0 0 0 0 0 0 0 0 0 0 0 0 0 0 0 0 0 0 0 0 0 0 0 0 0 0 0 0 0 0 0 0 0 0 0 0 0 0 0 0 0 0 0 0 0 0 0 0 0 0 0 0 0 0 0 0 0 0 0 0 0 0 0 0 0 0 0 0 0 0 0 0 0 0 0 0 0 0 0 0 0 0 0 0 0 0 0 0 0 0 0 0 0 0 0 0 0 0 0 0 0 0 0 0 0 0 0 0 0 0 0 0 0 0 0 0 0 0 0 0 0 0 0 0 0 0 0 0 0 0 0 0 0 0 0 0 0 0 0 0 0 0 0 0 0 0 0 0 0 0 0 0 0 0 0 0 0 0 0 0 0 0 0 0 0 0 0 0 0 0 0 0 0 0 0 0 0 0 0 0 0 0 0 0 0 0 0 0 0 0 0 0 0 0 0 0 0 0 0 0 0 0 0 0 0 0 0 0 0 0 0 0 0 0 0 0 0 0 0 0 0 0 0 0 0 0 0 0 0 0 0 0 0 0 0 0 0 0 0 0 0 0 0 0 0 0 0 0 0 0 0 0 0 0 0 0 0 0 0 0 0 0 0 0 0 0 0 0 0 0 0 0 0 0 0 0 0 0 0 0 0 0 0 0 0 0 0 0 0 0 0 0 0 0 0 0 0 0 0 0 0 0 0 0 0 0 0 0 0 0 0 0 0 0 0 0 0 0 0 0 0 0 0 0 0 0 0 0 0 0 0 0 0 0 0 0 0 0 0 0 0 0 0 0 0 0 0 0 0 0 0 0 0 0 0 0 0 0 0 0 0 0 0 0 0 0 0 0 0 0 0 0 0 0 0 0 0 0 0 0 0 0 0 0 0 0 0 0 0 0 0 0 0 0 0 0 0 0 0 0 0 0 0 0 0 0 0 0 0 0 0 0 0 0 0 0 0 0 0 0 0 0 0 0 0 0 0 0 0 0 0 0 0 0 0 0 0 0 0 0 0 0 0 0 0 0 0 0 0 0 0 0 0 0 0 0 0 0 0 0 0 0 0 0 0 0 0 0 0 0 0 0 0 0 0 0 0 0 0 0 0 0 0 0 0 0 0 0 0 0 0 0 0 0 0 0 0 0 0 0 0 0 0 0 0 0 0 0 0 0 0 0 0 0 0 0 0 0 0 0 0 0 0 0 0 0 0 0 0 0 0 0 0 0 0 0 0 0 0 0 0 0 0 0 0 0 0 0 0 0 0 0 0 0 0 0 0 0 0 0 0 0 0 0 0 0 0 0 0 0 0 0 0 0 0 0 0 0 0 0 0 0 0 0 0 0 0 0 0 0 0 0 0 0 0 0 0 0 0 0 0 0 0 0 0 0 0 0 0 0 0 0 0 0 0 0 0 0 0 0 0 0 0 0 0 0 0 0 0 0 0 0 0 0 0 0 0 0 0 0 0 0 0 0 0 0 0 0 0 0 0 0 0 0 0 0 0 0 0 0 0 0 0 0 0 0 0 0 0 0 0 0 0 0 0 0 0 0 0 0 0 0 0 0 0 0 0 0 0 0 0 0 0 0 0 0 0 0 0 0 0 0 0 0 0 0 0 0 0 0 0 0 0 0 0 0 0 0 0 0 0 0 0 0 0 0 0 0 0 0 0 0 0 0 0 0 0 0 0 0 0 0 0 0 0 0 0 0 0 0 0 0 0 0 0 0 0 0 0 0 0 0 0 0 0 0 0 0 0 0 0 0 0 0 0 0 0 0 0 0 0 0 0 0 0 0 0 0 0 0 0 0 0 0 0 0 0 0 0 0 0 0 0 0 0 0 0 0 0 SP419 Bacteria;Saccharibacteria_(TM7);Saccharibacteria_(TM7)_[C-1];Saccharibacteria_(TM7)_[O-1];Saccharibacteria_(TM7)_[F-1];Saccharibacteria_(TM7)_[G-1];bacterium HMT952 0 0 0 0 0 0 0 0 0 0 0 0 0 0 0 0 0 0 0 0 0 0 0 0 0 0 0 0 0 0 0 0 0 0 0 0 0 0 0 0 0 0 0 0 0 0 0 0 0 0 0 0 0 0 0 0 0 0 0 0 0 0 0 0 0 0 0 0 0 0 0 0 0 0 0 0 0 0 0 0 0 0 0 0 0 0 0 0 0 0 0 0 0 0 0 0 0 0 0 0 0 0 0 0 0 0 0 0 0 0 0 0 0 0 0 0 0 0 0 0 0 0 0 0 0 0 0 0 0 0 0 0 0 0 0 0 0 0 0 0 0 0 0 0 0 0 0 0 0 0 0 0 0 0 0 0 0 0 0 0 0 0 0 0 0 0 0 0 0 0 0 0 0 0 0 0 0 0 0 0 0 0 0 0 0 0 0 0 0 0 0 0 0 0 0 0 0 0 0 0 0 0 0 0 0 0 0 0 0 0 0 0 0 0 0 0 0 0 0 0 0 0 0 0 0 0 0 0 0 0 0 0 0 0 0 0 0 0 0 0 0 0 0 0 0 0 0 0 0 0 0 0 0 0 0 0 0 0 0 0 0 0 0 0 0 0 0 0 0 0 2 0 1 0 0 0 2 0 3 0 0 0 0 0 2 0 0 0 0 3 40 0 2 0 0 2 0 14 0 1 1 34 70 2 0 0 6 0 0 0 0 0 0 0 0 0 0 2 0 0 0 0 76 0 0 0 0 0 0 0 0 0 0 0 0 0 0 0 0 0 22 0 0 0 0 0 0 0 0 0 0 0 0 0 0 0 0 0 0 0 0 0 0 0 0 0 0 0 7 0 0 0 6 9 1 0 0 0 0 0 0 0 0 0 0 0 0 0 0 0 0 0 0 2 1 0 0 0 2 9 0 0 0 0 0 0 0 0 0 0 0 189 0 0 0 0 17 0 23 0 4 0 2 4 0 31 7 0 0 0 0 51 0 0 0 0 67 0 0 0 0 0 0 0 9 0 0 0 12 14 48 0 0 0 0 0 0 0 0 9 0 0 0 12 12 0 0 3 0 0 0 0 1 6 0 0 0 0 1 4 1 0 0 0 5 89 4 0 0 5 1 0 0 5 1 0 1 1 0 17 16 0 0 0 15 0 0 0 0 0 0 5 0 0 0 0 0 0 0 0 0 0 0 0 0 0 0 5 0 1 0 0 11 0 16 0 0 3 0 0 0 1 24 101 5 0 1 21 0 0 42 0 0 0 0 0 0 0 0 16 0 3 0 16 0 64 0 0 0 0 0 0 0 0 0 0 0 0 0 0 0 0 2 0 1 1 0 0 28 0 0 0 0 0 0 0 0 0 0 0 0 316 0 20 0 0 0 0 6 25 1 0 1 0 0 0 8 0 0 0 0 0 0 0 12 4 5 0 0 0 0 0 3 14 0 0 0 0 18 0 0 169 4 71 66 0 0 3 0 0 0 0 0 2 28 0 0 0 0 0 0 0 62 1 2 0 0 0 25 6 0 0 0 0 0 2 89 0 3 0 0 0 5 0 0 15 20 0 0 8 0 0 0 0 0 0 0 0 0 0 0 0 0 0 4 0 0 0 0 0 3 0 3 2 0 0 3 0 0 0 0 0 0 0 0 0 2 2 9 0 0 0 0 0 0 0 0 1 117 0 0 13 4 0 6 0 0 0 35 1 39 0 2 0 0 0 1 0 0 20 8 3 0 0 0 0 16 8 0 2 0 0 5 5 0 0 0 0 2 0 2 3 0 0 0 0 0 0 0 0 0 0 2 4 0 13 21 0 0 0 5 0 0 0 0 0 1 0 17 22 188 0 0 0 0 0 0 0 0 9 2 0 0 0 0 0 0 0 14 0 0 0 0 0 0 1 0 0 0 24 18 0 0 0 0 0 0 0 0 1 0 0 0 1 1 0 0 0 0 0 0 0 13 0 0 0 0 3 0 43 2 8 1 0 0 2 1 0 2 0 2 0 0 0 0 0 37 0 6 89 0 0 0 0 0 0 0 0 7 0 0 0 1 0 0 0 0 2 5 3 0 10 0 2 0 0 0 11 22 0 0 0 0 9 0 0 0 111 1 0 1 0 0 2 0 0 2 15 0 0 0 0 0 0 0 0 2 0 0 0 0 0 2 6 0 1 0 0 0 0 0 0 0 0 0 0 0 0 0 0 0 0 0 17 0 0 0 0 31 0 0 14 0 0 0 0 0 6 950 3 4 0 0 0 0 135 93 1 0 0 8 0 39 753 0 27 0 0 0 0 0 23 0 1 0 0 0 0 0 0 0 0 0 2 0 0 16 2 8 0 0 0 0 1 2 0 0 0 1 0 0 0 0 8 0 0 0 0 0 0 0 1 0 0 0 0 1 4 0 0 0 0 0 0 0 5 0 0 0 0 0 0 0 0 0 0 1 0 0 0 0 11 0 0 2 47 0 0 0 0 0 0 0 0 0 0 1 1 0 0 0 0 1 0 0 0 0 0 0 0 0 0 0 0 0 0 0 0 0 5 0 0 0 0 13 0 1 0 0 0 3 0 2 1 0 0 0 0 0 1 0 0 0 0 6 0 0 0 0 0 1 0 0 0 2 0 0 1 0 0 0 0 0 0 0 0 0 0 0 6 0 9 4 0 0 0 0 0 1 0 0 12 0 0 2 2 0 0 0 0 0 0 0 0 0 0 0 1 0 16 1 0 0 0 0 0 0 0 0 0 0 0 0 0 0 2 0 0 0 0 0 0 0 0 0 0 0 0 0 0 0 0 0 0 0 2 0 0 0 0 0 3 22 0 0 0 0 0 2 0 0 0 0 1 0 0 4 0 0 0 0 0 0 0 1 0 1 4 0 0 7 0 0 0 4 0 0 0 0 0 0 0 3 0 0 0 0 0 0 0 0 5 0 0 0 0 0 0 0 1 0 0 0 14 0 0 5 0 0 5 1 0 0 0 0 0 0 0 1 0 0 0 0 0 0 0 0 1 0 2 0 0 0 0 12 2 0 0 0 2 0 0 7 0 1 8 0 0 0 0 0 0 0 0 2 0 1 1 0 0 0 1 0 0 0 0 0 0 1 0 3 2 0 0 0 0 0 0 50 0 0 0 0 0 0 0 0 0 3 0 0 0 0 0 0 0 0 0 0 0 1 0 0 2 0 0 0 0 0 0 0 0 0 0 0 24 0 0 0 0 0 0 0 0 0 0 0 3 16 0 2 14 0 0 0 0 0 0 5 0 0 0 0 0 0 0 0 1 1 0 0 0 0 0 1 0 0 0 0 0 0 0 0 0 0 1 7 1 2 0 0 0 0 0 0 0 0 0 0 0 0 0 0 0 0 0 3 0 0 0 0 0 0 0 0 0 0 0 0 0 0 0 53 1 0 0 0 0 1 0 0 0 0 0 0 0 0 0 1 0 0 0 0 0 0 0 1 0 0 1 1 0 0 0 0 2 3 0 0 0 7 14 60 0 1 0 0 0 0 0 0 0 3 3 0 6 14 0 0 0 0 0 0 0 2 1 0 0 1 0 2 2 0 0 0 0 0 1 0 0 0 1 0 0 8 0 0 0 1 0 0 0 0 0 1 0 0 0 0 0 0 0 0 0 0 0 0 5 0 0 0 0 0 3 0 2 0 0 0 0 1 0 0 0 0 0 0 0 0 0 0 0 0 0 3 0 0 1 6 0 0 0 0 0 2 0 0 1 0 0 1 1 0 0 0 0 0 0 0 0 0 1 0 0 0 0 0 0 0 0 0 2 0 1 0 0 0 0 2 0 0 0 0 0 0 0 0 0 0 2 0 0 0 0 1 0 0 1 0 0 0 0 0 0 0 0 2 0 0 0 0 0 0 0 0 0 0 0 0 0 3 0 0 0 0 0 0 3 0 1 0 1 1 125 0 33 0 0 2 0 0 0 0 0 0 0 0 0 0 0 0 0 0 0 2 0 0 5 0 0 0 0 0 0 1 5 0 0 0 0 0 0 0 0 11 3 1 0 0 0 2 0 0 0 0 0 0 3 0 0 1 0 1 0 2 1 0 3 0 0 0 0 0 1 0 0 1 0 0 0 0 0 0 0 1 0 0 0 0 0 0 1 0 0 SP42 Bacteria;Proteobacteria;Betaproteobacteria;Neisseriales;Neisseriaceae;Neisseria;mucosa 0 22 1 0 1 210 213 0 0 8 4 421 0 1 8 9 29 0 1 0 0 3 0 2 0 0 56 0 6 3 11 0 15 0 46 26 3 51 589 99 362 463 22823 0 2 38 5 0 1 3630 173 0 3 0 197 18 39 3 63 78 48 42 1 1 0 24 2 4 1 5 1241 3 115 25 27 0 0 0 2 4 0 22 1358 13 0 0 93 70 0 0 5 0 14418 492 0 1 18 168 0 0 1 5 0 164 0 2 2361 0 0 122 29 138 0 1 0 1 1 0 0 4 23 9 44 13 1 1 0 1 0 93 6 0 0 0 281 7 0 26 12 0 3 0 3 5 202 32 1 1 25 42 35 0 42 0 0 0 0 1 0 1 2275 17 0 0 0 105 2190 2354 0 21 3 8 0 0 8 0 8 3 26233 3478 3 0 9 0 3 39 2 2 31 0 0 1 2 44 18 0 9 17 7 1284 12937 594 3 0 4034 0 0 0 80 433 30 1186 6 0 0 13 101 0 0 113 318 23 42 9 216 10 0 7 3725 0 1 1 2 35793 0 2 2 0 0 5 1009 572 6 0 1 2 24 2 8 2 24 2 5 1 1 1 0 0 0 160 18 1 0 0 17 0 22 0 0 0 0 0 0 0 0 0 0 0 0 0 0 0 0 0 0 0 0 0 0 0 0 0 0 0 0 0 0 0 0 0 0 0 0 0 0 0 0 0 0 0 0 0 0 0 0 0 0 0 0 0 0 0 0 0 0 0 0 0 0 0 0 0 0 0 0 0 0 0 0 0 0 0 0 0 0 0 0 0 0 0 0 0 0 0 0 0 0 0 0 0 0 0 0 0 0 0 0 0 0 0 0 0 0 0 0 0 0 0 0 0 0 0 0 0 0 0 0 0 0 0 0 0 0 0 0 0 0 0 0 0 0 0 0 0 0 0 0 0 0 0 0 0 0 0 0 0 0 0 0 0 0 0 0 0 0 0 0 0 0 0 0 0 0 0 0 0 0 0 0 0 0 0 0 0 0 0 0 0 0 0 0 0 0 0 0 0 0 0 0 0 0 0 0 0 0 0 0 0 0 0 0 0 0 0 0 0 0 0 0 0 0 0 0 0 0 0 0 0 0 0 0 0 0 0 0 0 0 0 0 0 0 0 0 0 0 0 0 0 0 0 0 0 0 0 0 0 0 0 0 0 0 0 0 0 0 0 0 0 0 0 0 0 0 0 0 0 0 0 0 0 0 0 0 0 0 0 0 0 0 0 0 0 0 0 0 0 0 0 0 0 0 0 0 0 0 0 0 0 0 0 0 0 0 0 0 0 0 0 0 0 0 0 0 0 0 0 0 0 0 0 0 0 0 0 0 0 0 0 0 0 0 0 0 0 0 0 0 0 0 0 0 0 0 0 0 0 0 0 0 0 0 0 0 0 0 0 0 0 0 0 0 0 0 0 0 0 0 0 0 0 0 0 0 0 0 0 0 0 0 0 0 0 0 0 0 0 0 0 0 0 0 0 0 0 0 0 0 0 0 0 0 0 0 0 0 0 0 0 0 0 0 0 0 0 0 0 0 0 0 0 0 0 0 0 0 0 0 0 0 0 0 0 0 0 0 0 0 0 0 0 0 0 0 0 0 0 0 0 0 0 0 0 0 0 0 0 0 0 0 0 0 0 0 0 0 0 0 0 0 0 0 0 0 0 0 0 0 0 0 0 0 0 0 0 0 0 0 0 0 0 0 0 0 0 0 0 0 0 0 0 0 0 0 0 0 0 0 0 0 0 0 0 0 0 0 0 0 0 0 0 0 0 0 0 0 0 0 0 0 0 0 0 0 0 0 0 0 0 0 0 0 0 0 0 0 0 0 0 0 0 0 0 0 0 0 0 0 0 0 0 0 0 0 0 0 0 0 0 0 0 0 0 0 0 0 0 0 0 0 0 0 0 0 0 0 0 0 0 0 0 0 0 0 0 0 0 0 0 0 0 0 0 0 0 0 0 0 0 0 0 0 0 0 0 0 0 0 0 0 0 0 0 0 0 0 0 0 0 0 0 0 0 0 0 0 0 0 0 0 0 0 0 0 0 0 0 0 0 0 0 0 0 0 0 0 0 0 0 0 0 0 0 0 0 0 0 0 0 0 0 0 0 0 0 0 0 0 0 0 0 0 0 0 0 0 0 0 0 0 0 0 0 0 0 0 0 0 0 0 0 0 0 0 0 0 0 0 0 0 0 0 0 0 0 0 0 0 0 0 0 0 0 0 0 0 0 0 0 0 0 0 0 0 0 0 0 0 0 0 0 0 0 0 0 0 0 0 0 0 0 0 0 0 0 0 0 0 0 0 0 0 0 0 0 0 0 0 0 0 0 0 0 0 0 0 0 0 0 0 0 0 0 0 0 0 0 0 0 0 0 0 0 0 0 0 0 0 0 0 0 0 0 0 0 0 0 0 0 0 0 0 0 0 0 0 0 0 0 0 0 0 0 0 0 0 0 0 0 0 0 0 0 0 0 0 0 0 0 0 0 0 0 0 0 0 0 0 0 0 0 0 0 0 0 0 0 0 0 0 0 0 0 0 0 0 0 0 0 0 0 0 0 0 0 0 0 0 0 0 0 0 0 0 0 0 0 0 0 0 0 0 0 0 0 0 0 0 0 0 0 0 0 0 0 0 0 0 0 0 0 0 0 0 0 0 0 0 0 0 0 0 0 0 0 0 0 0 0 0 0 0 0 0 0 0 0 0 0 0 0 0 0 0 0 0 0 0 0 0 0 0 0 0 0 0 0 0 0 0 0 0 0 0 0 0 0 0 0 0 0 0 0 0 0 0 0 0 0 0 0 0 0 0 0 0 0 0 0 0 0 0 0 0 0 0 0 0 0 0 0 0 0 0 0 0 0 0 0 0 0 0 0 0 0 0 0 0 0 0 0 0 0 0 0 0 0 0 0 0 0 0 0 0 0 0 0 0 0 0 0 0 0 0 0 0 0 0 0 0 0 0 0 0 0 0 0 0 0 0 0 0 0 0 0 0 0 0 0 0 0 0 0 0 0 0 0 0 0 0 0 0 0 0 0 0 0 0 0 0 0 0 0 0 0 0 0 0 0 0 0 0 0 0 0 0 0 0 0 0 0 0 0 0 0 0 0 0 0 0 0 0 0 0 0 0 0 0 0 0 0 0 0 0 0 0 0 0 0 0 0 0 0 0 0 0 0 0 0 0 0 0 0 0 0 0 0 0 0 0 0 0 0 0 0 0 0 0 0 0 0 0 0 0 0 0 0 0 0 0 0 0 0 0 0 0 0 0 0 0 0 0 0 0 0 0 0 0 0 0 0 0 0 0 0 0 0 0 0 0 0 0 0 0 0 0 0 0 0 0 0 0 0 0 0 0 0 0 0 0 0 0 0 0 0 0 0 0 0 0 0 0 0 0 0 0 0 0 0 0 0 0 0 0 0 0 0 0 0 0 0 0 0 0 0 0 0 0 0 0 0 0 0 0 0 0 0 0 0 0 0 0 0 0 0 0 0 0 0 0 0 0 0 0 0 0 0 0 0 0 0 0 0 0 0 0 0 0 0 0 0 0 0 0 0 0 0 0 0 0 0 0 0 0 0 0 0 0 0 0 0 0 0 0 0 0 0 0 0 0 0 0 0 0 0 0 0 0 0 0 0 0 0 0 0 0 0 0 0 0 0 0 0 0 0 0 0 0 0 0 0 0 0 0 0 0 0 0 0 0 0 0 0 0 0 0 0 0 0 0 0 0 0 0 0 0 0 0 0 0 0 0 0 0 0 0 0 0 0 0 0 0 0 0 0 0 0 0 0 0 0 0 0 0 0 0 0 0 0 0 0 0 0 0 0 0 0 0 0 0 0 0 0 0 0 0 0 0 0 0 0 0 0 0 0 0 0 0 0 0 0 0 0 0 0 0 0 0 0 0 0 0 0 0 0 0 0 0 0 0 0 0 0 0 0 0 0 0 0 0 0 0 0 0 0 0 0 0 0 0 0 0 0 0 0 0 0 0 0 0 0 0 0 0 0 0 0 0 0 0 0 0 0 0 0 0 0 0 0 0 0 0 0 0 0 0 0 0 0 0 0 0 0 0 0 0 0 0 0 0 0 0 0 0 0 SP424 Bacteria;Proteobacteria;Betaproteobacteria;Neisseriales;Neisseriaceae;Neisseria;oralis 0 0 6 0 4 34 0 2 2 281 1 178 2 0 30 0 2 112 3 11 0 0 0 0 1 0 0 0 295 53 0 1 0 72 0 3 0 0 9 11 24 53 3 0 0 0 98 0 0 0 0 0 0 0 0 5 2 8 0 5 0 0 0 6 0 32 8 0 1 0 0 10 5 0 0 0 4 0 0 1 0 0 0 6 0 0 0 2 0 6 0 0 1 0 0 0 12 32 0 0 3 0 0 0 0 2 0 0 0 0 0 80 1 0 1 3 0 0 0 0 14 6 0 1 3 0 3 11 2 34 13 10 0 168 8 0 0 0 3 0 5 278 0 12 5 1 2 64 6 0 0 0 0 0 1 1 0 0 36 0 0 2 0 27 5 0 0 0 0 0 54 0 3 0 2 0 0 0 1 0 2 0 18 0 0 29 0 0 0 0 0 5 6 0 7 0 0 0 1 6 0 0 0 0 8 0 10 0 7 0 2 0 1 0 0 3 8 0 0 24 18 0 0 5 0 16 5 16 133 5 0 24 0 0 1 0 26 8 10 12 0 0 0 4 1 6 0 0 11 0 0 0 0 0 0 0 0 0 0 4 0 0 0 0 0 0 0 0 0 591 1135 1 1 0 0 0 254 201 0 0 314 69 0 0 31 19 2 0 2 14 185 0 1 0 373 1369 5 539 0 64 300 1 2 382 21 0 113 1 0 0 0 12 69 1 0 0 0 37 0 0 13 1 1 0 1 2 0 0 0 1 0 1 0 0 0 0 2 11 17 0 1 3777 1 117 202 319 4641 2 0 0 277 123 0 0 0 388 0 3 0 0 0 3 0 38 1037 39 1 162 728 0 0 0 1 0 0 0 1 0 29 5 0 1 0 30 0 147 23 25 16 324 0 0 2 46 2112 122 318 1 297 121 1 0 0 1 0 1 0 3 0 0 0 0 0 0 0 0 514 0 110 1 0 0 2 4 0 0 586 0 328 0 0 0 2 1 0 0 0 2 458 0 0 91 79 0 0 1 0 1 166 102 3 3 43 0 1 0 0 0 0 223 141 0 0 257 0 2 0 1 0 29 1 0 1 8 206 5 0 0 0 3 294 0 0 0 1 3 310 115 0 2 3 0 1 605 0 0 0 1 0 2 5 1 0 0 1 0 1 167 0 1 2 0 1 42 0 0 4 0 6651 0 0 0 1 23 0 1 0 0 0 22 0 2 14 0 52 0 1209 796 2 1981 2629 8 29 0 2607 2 2 0 1 109 5 39 0 1 1 0 376 1605 0 7 0 0 1 1 0 4 1 0 0 0 2 0 135 2 39 19 1 1 1 2 0 51 1895 0 0 0 245 4 0 1 0 140 0 0 0 0 1 171 0 0 0 0 0 4 0 0 0 13 6 10 93 1 3 0 1 0 1 0 0 1 1 4 31 0 1 4 452 0 75 0 0 123 3 653 741 1466 119 0 0 313 55 153 929 50 76 0 0 0 4 1946 1 224 2 1940 20 0 0 0 0 3 0 0 7 4 0 3 4 0 0 0 0 2 1 143 0 35 288 0 22 861 3075 12 7 0 1 34 0 1727 448 3 37 0 7 9 0 0 22 0 0 395 1 50 129 21 0 0 0 0 0 0 2292 10 188 0 0 1 72 1 38 2 0 65 0 5 0 0 263 71 1 0 0 0 2 167 13 32 27 50 28 28 1 237 508 1511 1 0 0 380 0 0 342 40 42 0 3208 1563 1339 415 0 271 1 1883 3 835 76 1 0 1 0 8 997 1 41 976 0 2 101 2 104 0 0 1 1 233 2 0 0 2 12 0 0 0 1 0 1 0 0 0 0 2 1 0 1 1 0 31 227 0 6 0 0 0 49 1 5 237 48 14 31 79 3 0 1 242 0 0 0 1 8 1 1 22 0 0 224 275 0 4 5 0 13 0 0 0 1 0 0 27 40 1 4 0 78 14 1 1 1882 0 34 0 3 0 1 0 9 5468 0 44 4 0 86 39 2256 0 0 0 1 3 0 0 0 0 0 0 2 0 0 1 82 50 0 0 2 0 46 0 223 0 17 1 0 0 0 0 2 0 0 0 0 28 44 175 0 0 954 377 0 0 0 0 10 0 0 1 0 0 0 5 0 0 0 0 1 3 1 1 162 146 1 56 540 0 15 6 45 0 0 77 240 0 724 1 0 0 3 0 0 3 492 0 0 0 0 5 0 18 0 0 0 0 1 234 1 0 0 0 1 0 0 1 0 0 4 27 0 0 0 0 0 5 55 0 0 34 4 68 0 14 0 2 1 238 5834 1 17 2 11 2 7 0 0 1 0 0 0 0 0 0 1 1 1 0 48 1 0 953 0 0 177 91 22 68 0 9 305 0 0 0 12 0 0 0 0 34 107 1 0 0 0 0 57 53 0 0 0 1 0 0 0 7 157 4 0 0 0 2 0 0 0 0 0 0 1 0 4 6 0 0 50 0 0 67 475 0 0 0 220 0 3 0 21 24 305 83 1 20 3842 0 0 98 2 0 44 221 0 13 90 0 0 25 58 0 0 0 0 0 4 0 70 2 240 0 0 1 5 0 0 0 1 171 144 0 1 0 337 0 4 176 0 1 163 0 1 18 0 0 0 17 197 0 2 25 0 0 0 0 24 0 2 1 0 5 34 1 18 7 0 90 12 0 0 0 0 0 28 0 0 0 0 0 0 2 0 0 1 0 0 40 0 0 0 0 140 44 22 0 122 24 1 0 0 0 0 0 22 5 0 131 28 0 14 17 0 2 21 0 0 35 515 1 0 1 0 0 1 141 0 1 0 0 0 142 30 0 0 16 0 21 38 0 0 1 41 0 0 0 0 61 1022 0 0 8 0 44 54 0 3 3 0 10 0 0 0 0 0 0 2 3 0 0 33 0 13 28 0 0 1428 683 0 215 173 0 21 192 0 0 40 0 0 60 261 80 0 20 0 0 36 867 0 2 73 0 0 0 0 0 5 20 1 137 172 7 0 0 16 0 56 513 18 0 0 0 8 20 0 403 1459 410 0 944 15 1 0 1 0 6 227 0 20 168 621 21 4 150 0 1709 104 1 7 6 0 0 0 40 0 0 9 20 2 46 357 0 0 0 0 0 0 168 713 0 2 156 1 0 45 0 0 15 264 172 5 435 0 1 39 662 4 0 12 0 1 23 1 4 0 94 5 104 0 0 0 17 0 0 3 7 3 56 0 0 0 18 83 0 1 50 0 0 32 0 0 0 1 0 323 0 0 4 1108 0 0 313 11 53 42 1 0 140 2 0 2 1 0 13 0 0 0 0 4 0 164 10 0 17 5 0 0 0 26 185 0 0 1 0 0 9 40 3 5 70 0 33 0 118 0 7 152 1 5 238 0 2 5 0 0 19 279 0 2 124 9 0 0 0 0 1 55 0 180 19 0 329 0 7 1405 0 1 3 15 47 211 1 0 18 0 18 25 1 1 35 31 0 0 0 0 11 131 0 0 97 0 0 31 55 0 0 0 0 16 0 19 0 24 0 169 12 58 0 329 90 0 15 0 59 0 7 4 6 416 13 0 0 0 0 155 348 7 0 0 0 390 0 0 412 0 1 15 0 15 0 0 0 0 38 56 0 20 55 0 0 2 19 1 3 0 0 29 388 0 0 0 0 0 0 84 1 0 0 0 0 17 41 0 4 0 209 0 0 27 0 3 0 0 0 51 0 0 0 0 0 3 68 0 0 166 210 0 0 0 0 0 9 77 0 1 0 0 46 22 0 0 5 0 0 517 171 1 0 0 0 413 14 74 0 156 317 26 208 36 2 0 5 3 0 8 0 0 0 56 0 55 1 0 0 0 0 25 0 11 13 17 34 199 0 0 0 1 34 193 0 180 8 5 0 0 0 36 113 0 0 0 0 0 2 1 0 64 1363 0 26 0 147 0 0 1 0 3 0 0 1 0 19 175 37 0 0 0 0 0 0 0 2 111 0 0 0 0 0 3 34 0 121 68 0 2 8 809 64 0 2338 0 0 0 0 0 0 0 0 0 4 6 0 0 0 0 0 2 2 0 3 5 0 19 0 2 0 0 0 0 17 0 0 0 84 227 0 264 22 5 0 989 66 0 0 0 0 0 1 0 0 7 0 0 74 0 0 146 27 0 67 341 0 0 10 SP430 Bacteria;Saccharibacteria_(TM7);Saccharibacteria_(TM7)_[C-1];Saccharibacteria_(TM7)_[O-1];Saccharibacteria_(TM7)_[F-1];Saccharibacteria_(TM7)_[G-1];bacterium HMT348 0 16 26 4 11 36 303 7 89 8 0 288 0 4 428 3 0 11 5 6 0 0 5 240 35 4 34 8 21 66 0 0 395 4 23 11 17 53 0 8 0 0 2 14 6 0 3 2 84 18 10 118 3 2 2 0 3 0 0 61 2 0 2 0 2 1 8 0 15 2 27 4 26 0 12 3 3 0 8 67 6 2 6 7 3 7 2 12 0 0 13 0 28 0 0 11 0 10 10 8 88 35 0 0 107 8 0 38 4 8 2 97 7 7 5 0 0 1 2 7 0 1 3 24 0 6 0 3 18 219 0 22 3 1 5 9 0 39 17 2 153 7 42 71 0 12 5 3 1 1 19 3 58 4 0 6 14 0 15 0 2 1 0 5 1 27 35 2 195 9 0 2 3 21 15 0 1 0 0 0 1 0 11 1 0 2 4 2 0 6 0 2 8 7 4 3 1 0 4 17 19 0 7 0 0 0 0 13 19 0 11 3 20 3 2 1 20 1 0 1 5 17 1 31 0 0 0 6 153 19 35 79 34 0 12 6 3 6 4 38 2 1 1 8 38 0 2 2 0 0 0 9 0 26 0 0 18 2 0 0 27 1 20 28 4 0 0 13 0 21 0 0 2 0 0 0 49 30 42 0 7 13 0 1 0 3 2 0 0 0 0 0 0 0 0 1 1 182 0 13 0 0 15 6 1 0 4 0 17 0 0 0 0 0 0 16 0 0 0 0 0 0 0 0 0 0 0 0 0 0 0 2 0 0 0 0 0 0 0 0 1 0 0 0 21 0 0 0 0 0 0 0 0 10 0 0 0 0 0 0 0 7 0 98 0 0 0 0 1 0 71 0 7 0 0 4 0 0 0 0 0 0 10 15 0 0 0 2 0 0 0 0 0 7 0 2 1 0 0 23 0 0 0 2 2 0 0 50 0 0 1 310 0 0 1 0 0 0 0 0 32 0 1 3 0 189 6 0 0 0 0 6 14 0 0 4 130 0 0 0 14 0 0 0 0 0 0 0 3 10 66 7 26 0 0 1 0 0 0 60 15 0 0 0 0 5 0 38 0 0 3 6 0 62 0 0 13 5 1 3 0 33 0 11 10 14 1 3 0 6 2 0 0 65 7 0 0 1 0 5 12 0 0 0 3 0 0 0 0 1 0 3 0 0 0 0 0 0 0 0 0 0 0 0 0 2 0 88 0 5 0 1 17 0 0 0 0 0 0 0 0 12 53 0 0 0 87 68 0 0 15 0 0 0 0 0 0 0 0 1 0 14 0 13 100 12 0 0 0 10 3 0 0 3 0 0 3 0 1 0 0 1 1 0 1 0 46 0 0 0 0 0 0 0 0 34 0 8 0 0 0 1 0 42 8 0 0 0 3 8 21 4 0 0 2 17 26 0 1 0 0 0 0 0 3 48 0 0 0 12 0 9 0 0 0 14 44 0 2 32 0 30 3 419 38 0 0 12 0 1 6 0 0 1 0 0 71 0 0 15 0 0 29 57 8 0 0 0 20 1 0 56 0 23 0 2 6 0 0 0 0 12 40 0 0 24 49 0 0 11 1 0 0 25 0 32 1 0 0 0 64 0 0 19 0 0 69 0 11 85 2 0 82 26 0 0 0 0 0 46 0 0 9 1 0 33 19 7 18 0 17 0 0 2 0 0 0 77 63 1 0 37 3 0 2 0 0 2 29 0 4 0 0 0 24 55 13 0 0 77 3 3 0 1 0 0 31 19 0 53 23 0 22 3 0 4 14 0 42 0 46 29 0 0 4 0 0 0 0 0 0 6 0 11 0 1 23 0 0 0 0 0 0 0 0 0 0 0 63 2 20 0 0 0 0 1 0 0 14 0 0 16 0 0 0 0 0 8 6 0 0 0 0 0 0 0 0 9 0 0 133 0 0 0 0 1 0 0 23 0 0 49 0 0 3 0 0 0 0 0 0 0 0 0 12 0 0 5 6 82 4 9 0 9 12 0 0 9 30 0 2 33 0 43 0 0 0 0 12 70 33 0 0 0 2 0 0 0 69 0 34 0 38 0 0 0 0 17 46 5 17 26 0 9 0 0 0 4 8 0 1 0 0 20 14 0 1 24 12 0 20 0 0 0 0 6 1 17 9 0 4 0 2 0 0 0 8 0 44 0 10 0 11 4 0 4 15 8 16 0 0 1 0 69 0 7 0 0 4 0 11 2 0 8 26 0 2 2 0 13 0 0 1 12 0 45 0 30 0 59 25 0 0 33 0 310 71 0 10 0 0 0 2 0 0 23 0 0 0 0 0 14 0 0 59 0 0 0 0 0 0 25 0 36 25 0 30 0 13 0 0 0 0 3 0 0 0 2 0 0 8 2 0 25 8 0 0 1 5 0 0 1 0 0 0 0 7 0 0 3 3 0 0 0 10 6 0 0 0 0 2 0 0 0 0 10 0 0 1 0 0 0 0 0 0 8 0 0 3 2 0 0 0 0 0 0 0 0 0 0 0 0 4 0 0 0 0 0 0 0 0 0 0 0 0 4 0 0 0 5 1 0 15 0 10 0 7 14 0 0 1 0 9 2 0 0 0 0 0 2 0 0 0 6 5 0 0 15 0 0 18 0 0 0 1 0 0 0 0 0 0 1 0 1 4 0 0 1 1 2 0 2 0 0 13 0 0 0 0 0 0 40 3 0 13 1 0 0 0 0 1 0 4 12 1 0 2 1 0 26 1 0 1 1 0 0 0 1 0 0 0 7 0 4 0 0 0 0 2 0 0 0 4 0 2 1 0 0 0 12 0 0 0 0 1 0 0 0 0 0 0 0 1 0 0 0 0 0 1 0 0 0 0 0 0 0 2 0 0 2 0 0 0 0 0 0 2 12 0 3 0 0 0 0 7 0 0 14 0 1 0 0 2 0 0 0 1 2 0 0 0 3 0 0 3 0 3 0 0 2 0 1 0 10 0 2 96 3 0 15 5 0 0 3 0 0 0 0 0 0 1 0 1 4 0 0 0 0 0 2 0 0 77 2 18 0 0 0 8 8 1 0 45 11 0 13 0 0 0 0 0 0 0 0 0 0 1 0 0 13 0 0 4 0 5 1 0 0 0 0 36 25 0 0 0 4 0 0 0 0 0 0 0 0 152 0 0 0 1 1 0 1 0 0 0 2 0 5 0 0 5 0 0 20 0 0 0 0 0 0 0 0 0 0 0 0 0 6 0 0 0 21 0 0 1 0 0 13 0 0 5 20 0 1 0 3 0 4 0 0 5 9 0 1 0 0 0 0 10 0 1 16 0 0 0 0 0 2 10 0 0 2 30 0 0 0 3 0 1 0 0 11 0 4 0 0 0 0 0 0 0 0 4 5 0 0 0 0 0 2 0 0 0 0 0 0 1 0 0 2 0 0 113 0 0 19 0 0 0 0 1 0 0 0 0 4 1 1 0 0 0 0 4 17 0 2 3 0 0 1 0 0 15 0 0 25 86 0 0 0 2 1 3 0 4 0 0 0 0 0 0 9 1 6 0 6 1 0 0 0 0 22 0 0 9 1 0 0 14 0 0 1 0 0 0 0 0 22 0 0 1 3 0 1 13 0 0 1 1 0 0 18 0 0 0 0 1 2 0 0 0 0 0 0 0 0 0 4 2 0 3 1 0 7 0 0 0 0 8 0 1 0 0 0 5 0 0 1 0 0 0 5 0 5 37 0 0 17 24 0 0 2 5 0 2 0 0 0 5 0 3 0 0 0 0 0 0 3 0 0 0 0 0 0 1 1 0 17 5 0 0 4 0 0 0 0 0 2 0 0 0 0 0 24 0 0 0 0 0 3 0 0 0 0 12 4 0 18 0 0 1 0 0 2 0 0 0 0 0 0 0 0 0 0 0 0 0 0 0 1 10 0 0 0 0 0 0 27 0 0 0 49 1 28 0 0 11 0 10 0 0 7 0 2 0 0 0 0 0 0 0 0 1 0 0 10 0 0 0 0 4 0 0 0 7 0 0 0 0 3 1 0 3 0 31 0 21 7 0 1 4 0 0 0 0 0 5 10 0 1 3 0 0 0 0 0 0 0 0 0 0 0 0 0 0 0 2 6 0 1 1 0 0 0 1 0 1 0 0 0 0 1 4 0 SP433 Bacteria;Bacteroidetes;Bacteroidia;Bacteroidales;Prevotellaceae;Prevotella;maculosa 0 0 1 0 0 14 0 0 0 0 0 2 0 0 0 0 2 1 0 0 0 0 0 11 0 0 0 0 4 4 0 0 0 8 9 0 0 0 0 0 0 0 0 0 0 0 0 0 20 0 0 0 0 2 1 0 0 0 0 0 0 0 0 6 0 0 2 0 20 0 12 7 0 0 0 0 0 0 0 0 0 0 0 0 0 0 0 0 4 16 1 0 12 15 0 1 0 10 0 0 0 1 0 0 0 0 0 3 1 0 0 1 0 0 0 0 0 1 1 0 0 1 0 0 0 2 0 0 0 6 0 6 1 0 0 0 0 0 1 1 2 0 36 9 0 0 2 6 1 0 6 0 9 0 0 0 0 0 0 0 0 0 0 2 0 0 9 1 0 0 0 0 0 2 1 1 0 0 0 0 0 0 2 1 0 0 0 1 7 2 0 0 3 0 0 0 0 0 0 0 4 0 0 0 0 0 0 2 1 0 0 0 2 0 4 0 0 0 0 3 2 5 0 2 0 0 0 0 0 4 0 0 5 0 0 0 0 1 0 2 0 0 7 0 2 6 0 0 5 0 2 0 0 2 0 0 0 0 0 0 0 5 1 1 0 1 2 0 0 0 0 0 0 1 0 0 9 0 48 0 6 26 11 41 0 2 13 0 0 1 28 0 0 0 46 0 3 44 0 8 0 0 38 17 2 0 2 0 4 0 0 1 0 0 0 0 0 2 2 0 0 2 0 0 0 0 0 0 0 0 0 0 0 0 0 0 0 0 0 0 0 78 0 8 0 3 0 0 0 0 0 0 0 5 0 0 0 0 0 0 1 0 0 0 0 0 0 0 0 0 1 0 0 2 0 0 0 0 0 4 0 0 4 0 0 1 0 20 0 0 0 0 0 0 0 1 1 0 0 3 0 0 0 8 1 0 0 0 0 0 0 47 0 0 0 0 0 0 31 0 0 1 14 27 0 12 1 0 0 0 0 0 11 0 0 0 10 0 0 0 12 0 0 0 0 0 0 0 7 3 33 0 0 0 0 10 0 1 0 45 20 0 0 0 0 0 0 20 0 0 0 2 0 0 0 0 1 0 0 3 0 0 0 0 7 1 0 0 0 5 12 0 0 33 9 0 0 0 0 2 4 0 0 0 0 0 0 0 0 0 4 1 0 0 0 0 0 0 0 0 0 0 0 0 0 0 0 0 0 0 0 2 3 0 0 0 0 4 0 0 0 0 100 5 0 0 17 87 0 0 7 0 0 0 0 0 0 0 0 17 0 18 0 73 60 27 0 0 0 1 0 0 0 0 3 0 0 0 0 0 0 0 0 0 0 2 6 0 0 0 26 0 0 0 0 10 0 4 0 0 0 107 0 13 0 0 0 0 0 0 0 1 0 0 0 0 24 0 0 0 0 1 0 0 2 1 0 0 0 0 0 0 0 0 15 3 65 0 2 0 1 0 9 6 0 0 0 1 48 0 0 0 0 0 0 28 60 0 0 3 10 0 28 70 5 1 6 0 0 0 0 1 0 3 0 1 4 0 0 0 0 2 0 0 0 0 0 0 0 8 0 0 0 0 0 0 0 0 0 0 60 0 1 1 0 0 0 0 0 15 0 0 9 7 0 0 0 0 0 5 0 0 1 0 0 32 4 15 4 0 29 6 0 1 0 0 1 1 45 1 0 64 17 0 0 0 0 1 4 0 21 0 0 0 0 1 1 0 0 4 0 7 0 0 0 0 6 0 0 45 1 0 35 8 0 0 3 0 8 55 0 0 0 0 0 0 10 0 0 0 0 0 0 0 0 0 1 0 0 0 0 0 0 0 0 0 0 0 0 0 0 0 0 0 0 1 0 0 0 0 1 10 0 0 0 0 0 0 1 0 0 0 0 0 0 0 0 0 0 0 0 0 0 0 0 0 0 0 5 0 0 9 0 0 11 0 0 0 0 0 0 0 0 0 0 0 0 0 0 0 0 5 0 4 76 0 19 0 13 0 1 30 0 2 0 0 0 0 0 1 2 0 0 0 1 0 1 0 12 0 4 0 1 0 0 0 0 0 0 0 0 0 0 0 1 0 0 65 0 0 0 0 0 0 0 0 0 6 2 0 0 0 3 33 0 7 0 23 0 30 18 0 0 1 0 0 8 0 0 0 1 0 58 20 0 4 3 0 0 0 0 3 0 25 0 0 0 0 3 0 0 5 0 59 21 0 43 18 0 0 3 0 19 3 0 1 0 28 0 17 15 0 5 11 0 0 1 0 10 0 0 0 0 0 0 4 0 0 0 0 0 0 0 0 28 0 0 0 0 0 0 0 0 0 0 0 5 0 23 0 1 5 0 10 0 0 4 1 0 0 8 0 0 7 0 0 1 0 3 0 2 1 0 1 0 0 4 1 0 0 0 0 0 0 4 35 0 0 0 0 6 0 0 0 0 2 0 0 8 0 0 31 0 0 1 2 0 0 9 0 0 13 0 0 0 0 0 0 0 0 0 0 13 0 0 1 0 0 0 0 0 0 0 0 0 2 0 0 0 6 0 2 278 0 0 2 0 0 0 7 0 0 4 3 0 0 2 3 0 3 0 0 0 0 0 0 0 23 0 0 8 0 0 0 0 0 11 0 0 0 0 0 0 0 0 0 0 0 1 0 0 18 1 0 0 0 0 0 0 0 0 104 0 0 7 1 0 2 0 2 3 0 4 19 3 0 1 20 0 4 0 0 4 2 0 1 0 7 0 0 18 0 0 3 0 0 0 2 4 0 0 7 0 0 22 0 0 0 0 43 0 13 5 1 42 14 0 0 39 0 0 0 12 0 0 0 0 24 2 0 0 0 0 2 0 0 2 0 0 13 2 0 0 0 7 0 1 7 0 1 0 0 0 1 2 0 3 0 0 1 0 0 2 0 3 0 21 3 0 0 1 4 0 43 0 0 1 0 0 1 1 0 0 0 0 0 1 0 0 0 0 0 0 0 4 0 0 0 4 0 4 0 6 2 0 21 0 0 0 0 0 0 115 6 0 6 0 0 0 1 0 0 9 4 0 5 0 0 0 0 0 0 0 0 2 0 0 0 0 11 0 0 15 0 0 0 0 0 0 0 0 0 0 0 61 2 0 11 7 0 0 0 0 2 78 0 0 0 12 4 0 0 0 0 0 0 0 0 0 0 9 0 0 31 1 0 0 0 0 0 0 0 8 0 34 1 0 0 0 0 29 0 0 11 5 0 0 3 0 0 42 9 0 0 1 0 0 1 0 0 34 4 0 5 4 0 0 1 41 0 9 66 0 0 0 0 0 0 104 0 0 2 0 5 0 13 2 0 1 0 0 41 0 0 0 0 0 0 0 0 0 2 4 0 0 0 0 0 0 73 0 0 0 0 0 0 0 0 0 0 0 9 0 5 4 89 3 0 2 1 1 0 0 0 0 9 5 0 0 14 0 0 14 2 0 74 6 0 0 7 1 0 9 0 0 4 3 0 0 0 5 0 14 0 0 0 0 0 0 0 0 28 1 2 0 0 0 0 3 0 0 0 0 0 14 0 0 0 37 0 0 1 0 0 0 0 0 31 6 0 2 2 0 5 11 0 15 19 0 0 0 5 0 3 25 0 3 0 0 0 11 1 0 1 0 0 0 0 0 0 7 1 0 4 2 1 0 0 17 0 14 0 0 2 6 0 0 0 0 0 0 0 0 100 9 0 0 0 0 0 0 0 49 0 0 0 0 0 0 0 1 0 0 0 0 0 0 0 0 0 1 0 0 0 3 8 0 11 1 0 2 0 0 7 0 0 0 6 0 0 0 0 0 0 0 0 10 0 1 0 0 0 6 0 9 2 0 5 0 0 3 0 0 0 0 0 0 0 0 0 0 3 0 1 0 0 0 0 0 1 12 0 0 0 0 0 7 1 3 0 0 13 1 2 0 0 34 0 15 2 0 3 0 1 0 0 0 0 0 2 0 15 0 0 68 48 0 17 0 8 7 0 0 50 23 0 0 2 0 11 13 0 9 0 82 0 15 4 0 8 5 0 3 0 0 0 0 0 0 7 5 0 0 0 0 0 2 2 0 0 0 0 0 0 0 0 2 2 0 0 1 0 0 0 2 0 2 0 0 0 0 0 0 0 SP444 Bacteria;Bacteroidetes;Bacteroidia;Bacteroidales;Prevotellaceae;Prevotella;sp. HMT306 51 0 0 0 0 11 0 0 0 4 413 0 19 1 0 1 720 7 159 473 0 0 59 0 164 0 0 0 0 1 23 4 0 0 1 0 18 4 8 0 0 0 0 0 0 0 4 0 2 0 2009 33 440 2 366 0 738 29 0 58 0 0 0 2 125 0 0 0 23 0 0 1 0 0 0 0 181 329 0 8 0 367 0 8 298 179 2 3 1 13906 1 657 3 1 0 0 0 6 0 530 0 272 0 0 20 27 1466 0 0 1 0 0 3275 46 713 0 0 229 1773 1 6 1 1242 116 79 213 166 609 0 0 0 0 6 0 57 0 86 0 42 0 1 0 1 0 1 2228 74 47 485 1 218 3 21 0 0 21 226 4 4 1 0 0 66 1 0 43 0 0 0 22 90 0 0 2 129 7 3 0 0 0 0 0 0 0 291 16 0 1 0 0 0 0 115 0 129 28 22 2 47 3 0 0 421 0 38 72 0 1 0 0 0 10 0 8 6 1 6 1721 0 0 16 57 29 27 317 0 22 0 0 1626 0 0 0 0 0 3 19 316 0 8 17 0 247 1 3 182 103 0 0 0 0 2 0 48 0 0 0 62 4 383 9 96 25 0 0 0 0 0 0 0 0 0 0 0 0 0 0 0 0 0 0 0 0 0 0 0 0 0 0 0 0 0 0 0 0 0 0 0 0 0 0 0 0 0 0 0 0 0 0 0 0 0 0 0 0 0 0 0 0 0 0 0 0 0 0 0 0 0 0 0 0 0 0 0 0 0 0 0 0 0 0 0 0 0 0 0 0 0 0 0 0 0 0 0 0 0 0 0 0 0 0 0 0 0 0 0 0 0 0 0 0 0 0 0 0 0 0 0 0 0 0 0 0 0 0 0 0 0 0 0 0 0 0 0 0 0 0 0 0 0 0 0 0 0 0 0 0 0 0 0 0 0 0 0 0 0 0 0 0 0 0 0 0 0 0 0 0 0 0 0 0 0 0 0 0 0 0 0 0 0 0 0 0 0 0 0 0 0 0 0 0 0 0 0 0 0 0 0 0 0 0 0 0 0 0 0 0 0 0 0 0 0 0 0 0 0 0 0 0 0 0 0 0 0 0 0 0 0 0 0 0 0 0 0 0 0 0 0 0 0 0 0 0 0 0 0 0 0 0 0 0 0 0 0 0 0 0 0 0 0 0 0 0 0 0 0 0 0 0 0 0 0 0 0 0 0 0 0 0 0 0 0 0 0 0 0 0 0 0 0 0 0 0 0 0 0 0 0 0 0 0 0 0 0 0 0 0 0 0 0 0 0 0 0 0 0 0 0 0 0 0 0 0 0 0 0 0 0 0 0 0 0 0 0 0 0 0 0 0 0 0 0 0 0 0 0 0 0 0 0 0 0 0 0 0 0 0 0 0 0 0 0 0 0 0 0 0 0 0 0 0 0 0 0 0 0 0 0 0 0 0 0 0 0 0 0 0 0 0 0 0 0 0 0 0 0 0 0 0 0 0 0 0 0 0 0 0 0 0 0 0 0 0 0 0 0 0 0 0 0 0 0 0 0 0 0 0 0 0 0 0 0 0 0 0 0 0 0 0 0 0 0 0 0 0 0 0 0 0 0 0 0 0 0 0 0 0 0 0 0 0 0 0 0 0 0 0 0 0 0 0 0 0 0 0 0 0 0 0 0 0 0 0 0 0 0 0 0 0 0 0 0 0 0 0 0 0 0 0 0 0 0 0 0 0 0 0 0 0 0 0 0 0 0 0 0 0 0 0 0 0 0 0 0 0 0 0 0 0 0 0 0 0 0 0 0 0 0 0 0 0 0 0 0 0 0 0 0 0 0 0 0 0 0 0 0 0 0 0 0 0 0 0 0 0 0 0 0 0 0 0 0 0 0 0 0 0 0 0 0 0 0 0 0 0 0 0 0 0 0 0 0 0 0 0 0 0 0 0 0 0 0 0 0 0 0 0 0 0 0 0 0 0 0 0 0 0 0 0 0 0 0 0 0 0 0 0 0 0 0 0 0 0 0 0 0 0 0 0 0 0 0 0 0 0 0 0 0 0 0 0 0 0 0 0 0 0 0 0 0 0 0 0 0 0 0 0 0 0 0 0 0 0 0 0 0 0 0 0 0 0 0 0 0 0 0 0 0 0 0 0 0 0 0 0 0 0 0 0 0 0 0 0 0 0 0 0 0 0 0 0 0 0 0 0 0 0 0 0 0 0 0 0 0 0 0 0 0 0 0 0 0 0 0 0 0 0 0 0 0 0 0 0 0 0 0 0 0 0 0 0 0 0 0 0 0 0 0 0 0 0 0 0 0 0 0 0 0 0 0 0 0 0 0 0 0 0 0 0 0 0 0 0 0 0 0 0 0 0 0 0 0 0 0 0 0 0 0 0 0 0 0 0 0 0 0 0 0 0 0 0 0 0 0 0 0 0 0 0 0 0 0 0 0 0 0 0 0 0 0 0 0 0 0 0 0 0 0 0 0 0 0 0 0 0 0 0 0 0 0 0 0 0 0 0 0 0 0 0 0 0 0 0 0 0 0 0 0 0 0 0 0 0 0 0 0 0 0 0 0 0 0 0 0 0 0 0 0 0 0 0 0 0 0 0 0 0 0 0 0 0 0 0 0 0 0 0 0 0 0 0 0 0 0 0 0 0 0 0 0 0 0 0 0 0 0 0 0 0 0 0 0 0 0 0 0 0 0 0 0 0 0 0 0 0 0 0 0 0 0 0 0 0 0 0 0 0 0 0 0 0 0 0 0 0 0 0 0 0 0 0 0 0 0 0 0 0 0 0 0 0 0 0 0 0 0 0 0 0 0 0 0 0 0 0 0 0 0 0 0 0 0 0 0 0 0 0 0 0 0 0 0 0 0 0 0 0 0 0 0 0 0 0 0 0 0 0 0 0 0 0 0 0 0 0 0 0 0 0 0 0 0 0 0 0 0 0 0 0 0 0 0 0 0 0 0 0 0 0 0 0 0 0 0 0 0 0 0 0 0 0 0 0 0 0 0 0 0 0 0 0 0 0 0 0 0 0 0 0 0 0 0 0 0 0 0 0 0 0 0 0 0 0 0 0 0 0 0 0 0 0 0 0 0 0 0 0 0 0 0 0 0 0 0 0 0 0 0 0 0 0 0 0 0 0 0 0 0 0 0 0 0 0 0 0 0 0 0 0 0 0 0 0 0 0 0 0 0 0 0 0 0 0 0 0 0 0 0 0 0 0 0 0 0 0 0 0 0 0 0 0 0 0 0 0 0 0 0 0 0 0 0 0 0 0 0 0 0 0 0 0 0 0 0 0 0 0 0 0 0 0 0 0 0 0 0 0 0 0 0 0 0 0 0 0 0 0 0 0 0 0 0 0 0 0 0 0 0 0 0 0 0 0 0 0 0 0 0 0 0 0 0 0 0 0 0 0 0 0 0 0 0 0 0 0 0 0 0 0 0 0 0 0 0 0 0 0 0 0 0 0 0 0 0 0 0 0 0 0 0 0 0 0 0 0 0 0 0 0 0 0 0 0 0 0 0 0 0 0 0 0 0 0 0 0 0 0 0 0 0 0 0 0 0 0 0 0 0 0 0 0 0 0 0 0 0 0 0 0 0 0 0 0 0 0 0 0 0 0 0 0 0 0 0 0 0 0 0 0 0 0 0 0 0 0 0 0 0 0 0 0 0 0 0 0 0 0 0 0 0 0 0 0 0 0 0 0 0 0 0 0 0 0 0 0 0 0 0 0 0 0 0 0 0 0 0 0 0 0 0 0 0 0 0 0 0 0 0 0 0 0 0 0 0 0 0 0 0 0 0 0 0 0 0 0 0 0 0 0 0 0 0 0 0 0 0 0 0 0 0 0 0 0 0 0 0 0 0 0 0 0 0 0 0 0 0 0 0 0 0 0 0 0 0 0 0 0 0 0 0 0 0 0 0 0 0 0 0 0 0 0 0 0 0 0 0 0 0 0 0 0 0 0 0 0 0 0 0 0 0 0 0 0 0 0 0 0 0 0 0 0 0 0 0 0 0 0 0 0 0 0 0 0 0 0 0 0 0 0 0 0 0 0 0 0 0 0 0 0 0 0 0 0 0 0 0 0 0 0 0 0 0 0 0 SP471 Bacteria;Firmicutes;Bacilli;Lactobacillales;Streptococcaceae;Streptococcus;sp. HMT064 1084 104 467 139 10 584 108 694 9346 3822 82 1940 150 2998 13 150 507 373 15 61 17 63 1283 170 307 685 280 161 1197 222 220 2172 983 136 60 222 45 815 27 159 149 124 4 768 3173 17 806 421 95 36 53 113 150 196 127 868 32 186 730 361 105 206 60 5 4671 55 311 50 1822 37 1185 283 2584 38 219 95 1093 248 206 247 1634 161 1308 287 542 272 134 104 11537 340 141 20 190 179 141 4967 134 514 1067 3817 4215 643 293 464 96 86 1026 93 461 558 1732 194 45 145 94 805 254 291 620 1746 312 33 909 501 361 1430 18 179 362 514 468 935 335 319 2606 1585 637 47 17687 1461 531 259 154 528 166 3645 495 117 63 1599 53 943 185 914 27 147 24 150 497 93 4060 834 2271 369 205 218 644 769 518 1482 4 50 378 888 53 190 2912 2719 22 98 253 4272 1156 4166 19 149 280 1610 1 298 4 1805 1103 275 156 4512 2 599 290 206 3254 321 652 13 6 21 2133 110 10905 54 20 806 249 74 712 2601 85 2533 159 997 84 27 82 281 70 285 1080 86 2799 44 168 598 1301 3 106 1963 377 131 493 1028 5806 67 154 920 3174 127 1908 367 26 764 2022 426 1863 421 282 842 1150 35 395 112 675 14 317 1046 437 189 22 35 0 0 0 0 0 0 0 0 0 0 0 0 0 0 0 0 0 0 0 0 0 0 0 0 0 0 0 0 0 0 0 0 0 0 0 0 0 0 0 0 0 0 0 0 0 0 0 0 0 0 0 0 0 0 0 0 0 0 0 0 0 0 0 0 0 0 0 0 0 0 0 0 0 0 0 0 0 0 0 0 0 0 0 0 0 0 0 0 0 0 0 0 0 0 0 0 0 0 0 0 0 0 0 0 0 0 0 0 0 0 0 0 0 0 0 0 0 0 0 0 0 0 0 0 0 0 0 0 0 0 0 0 0 0 0 0 0 0 0 0 0 0 0 0 0 0 0 0 0 0 0 0 0 0 0 0 0 0 0 0 0 0 0 0 0 0 0 0 0 0 0 0 0 0 0 0 0 0 0 0 0 0 0 0 0 0 0 0 0 0 0 0 0 0 0 0 0 0 0 0 0 0 0 0 0 0 0 0 0 0 0 0 0 0 0 0 0 0 0 0 0 0 0 0 0 0 0 0 0 0 0 0 0 0 0 0 0 0 0 0 0 0 0 0 0 0 0 0 0 0 0 0 0 0 0 0 0 0 0 0 0 0 0 0 0 0 0 0 0 0 0 0 0 0 0 0 0 0 0 0 0 0 0 0 0 0 0 0 0 0 0 0 0 0 0 0 0 0 0 0 0 0 0 0 0 0 0 0 0 0 0 0 0 0 0 0 0 0 0 0 0 0 0 0 0 0 0 0 0 0 0 0 0 0 0 0 0 0 0 0 0 0 0 0 0 0 0 0 0 0 0 0 0 0 0 0 0 0 0 0 0 0 0 0 0 0 0 0 0 0 0 0 0 0 0 0 0 0 0 0 0 0 0 0 0 0 0 0 0 0 0 0 0 0 0 0 0 0 0 0 0 0 0 0 0 0 0 0 0 0 0 0 0 0 0 0 0 0 0 0 0 0 0 0 0 0 0 0 0 0 0 0 0 0 0 0 0 0 0 0 0 0 0 0 0 0 0 0 0 0 0 0 0 0 0 0 0 0 0 0 0 0 0 0 0 0 0 0 0 0 0 0 0 0 0 0 0 0 0 0 0 0 0 0 0 0 0 0 0 0 0 0 0 0 0 0 0 0 0 0 0 0 0 0 0 0 0 0 0 0 0 0 0 0 0 0 0 0 0 0 0 0 0 0 0 0 0 0 0 0 0 0 0 0 0 0 0 0 0 0 0 0 0 0 0 0 0 0 0 0 0 0 0 0 0 0 0 0 0 0 0 0 0 0 0 0 0 0 0 0 0 0 0 0 0 0 0 0 0 0 0 0 0 0 0 0 0 0 0 0 0 0 0 0 0 0 0 0 0 0 0 0 0 0 0 0 0 0 0 0 0 0 0 0 0 0 0 0 0 0 0 0 0 0 0 0 0 0 0 0 0 0 0 0 0 0 0 0 0 0 0 0 0 0 0 0 0 0 0 0 0 0 0 0 0 0 0 0 0 0 0 0 0 0 0 0 0 0 0 0 0 0 0 0 0 0 0 0 0 0 0 0 0 0 0 0 0 0 0 0 0 0 0 0 0 0 0 0 0 0 0 0 0 0 0 0 0 0 0 0 0 0 0 0 0 0 0 0 0 0 0 0 0 0 0 0 0 0 0 0 0 0 0 0 0 0 0 0 0 0 0 0 0 0 0 0 0 0 0 0 0 0 0 0 0 0 0 0 0 0 0 0 0 0 0 0 0 0 0 0 0 0 0 0 0 0 0 0 0 0 0 0 0 0 0 0 0 0 0 0 0 0 0 0 0 0 0 0 0 0 0 0 0 0 0 0 0 0 0 0 0 0 0 0 0 0 0 0 0 0 0 0 0 0 0 0 0 0 0 0 0 0 0 0 0 0 0 0 0 0 0 0 0 0 0 0 0 0 0 0 0 0 0 0 0 0 0 0 0 0 0 0 0 0 0 0 0 0 0 0 0 0 0 0 0 0 0 0 0 0 0 0 0 0 0 0 0 0 0 0 0 0 0 0 0 0 0 0 0 0 0 0 0 0 0 0 0 0 0 0 0 0 0 0 0 0 0 0 0 0 0 0 0 0 0 0 0 0 0 0 0 0 0 0 0 0 0 0 0 0 0 0 0 0 0 0 0 0 0 0 0 0 0 0 0 0 0 0 0 0 0 0 0 0 0 0 0 0 0 0 0 0 0 0 0 0 0 0 0 0 0 0 0 0 0 0 0 0 0 0 0 0 0 0 0 0 0 0 0 0 0 0 0 0 0 0 0 0 0 0 0 0 0 0 0 0 0 0 0 0 0 0 0 0 0 0 0 0 0 0 0 0 0 0 0 0 0 0 0 0 0 0 0 0 0 0 0 0 0 0 0 0 0 0 0 0 0 0 0 0 0 0 0 0 0 0 0 0 0 0 0 0 0 0 0 0 0 0 0 0 0 0 0 0 0 0 0 0 0 0 0 0 0 0 0 0 0 0 0 0 0 0 0 0 0 0 0 0 0 0 0 0 0 0 0 0 0 0 0 0 0 0 0 0 0 0 0 0 0 0 0 0 0 0 0 0 0 0 0 0 0 0 0 0 0 0 0 0 0 0 0 0 0 0 0 0 0 0 0 0 0 0 0 0 0 0 0 0 0 0 0 0 0 0 0 0 0 0 0 0 0 0 0 0 0 0 0 0 0 0 0 0 0 0 0 0 0 0 0 0 0 0 0 0 0 0 0 0 0 0 0 0 0 0 0 0 0 0 0 0 0 0 0 0 0 0 0 0 0 0 0 0 0 0 0 0 0 0 0 0 0 0 0 0 0 0 0 0 0 0 0 0 0 0 0 0 0 0 0 0 0 0 0 0 0 0 0 0 0 0 0 0 0 0 0 0 0 0 0 0 0 0 0 0 0 0 0 0 0 0 0 0 0 0 0 0 0 0 0 0 0 0 0 0 0 0 0 0 0 0 0 0 0 0 0 0 0 0 0 0 0 0 0 0 0 0 0 0 0 0 0 0 0 0 0 0 0 0 0 0 0 0 0 0 0 0 0 0 0 0 0 0 0 0 0 0 0 0 0 0 0 0 0 0 0 0 0 0 0 0 0 0 0 0 0 0 0 0 0 0 0 0 0 0 0 0 0 0 0 0 0 0 0 0 0 0 0 0 0 0 0 0 0 0 0 0 0 0 0 0 0 0 0 0 0 0 0 0 0 0 0 0 0 0 0 0 0 0 0 0 0 0 0 0 0 0 0 0 0 0 0 0 0 0 0 0 0 0 0 0 0 0 0 0 0 0 0 0 0 0 0 0 0 0 0 0 0 0 0 0 0 0 0 0 0 0 0 0 0 0 0 0 0 0 0 0 0 0 0 0 0 0 0 0 0 0 0 0 0 0 0 0 0 0 0 0 0 0 0 0 0 0 0 0 0 0 0 0 0 0 0 0 0 0 0 0 0 0 0 0 0 0 0 0 0 0 0 0 0 0 0 0 0 0 0 0 0 0 0 0 0 0 0 0 0 0 SP472 Bacteria;Proteobacteria;Betaproteobacteria;Neisseriales;Neisseriaceae;Kingella;oralis 0 0 0 0 1 10 12 3 5 18 4 14 32 2 417 2 0 119 4 0 1 3 0 114 7 5 14 4 34 4 1 23 5 30 13 0 1 6 0 11 0 6 11 4 5 10 2 6 87 6 0 4 10 4 2 1 13 26 1 3 2 5 11 39 3 0 2 0 5 2 8 7 1 2 6 0 0 0 41 9 0 0 4 2 0 0 13 18 3 6 222 1 16 144 1 0 152 127 5 1 25 10 232 12 0 5 0 10 2 34 21 10 18 14 0 0 0 21 2 1 18 9 3 9 4 0 2 1 5 4 0 0 0 71 0 1 0 5 0 32 6 6 147 1 50 2 7 0 0 0 10 1 19 4 1 0 0 0 589 6 19 5 0 2 0 1 1 1 5 0 1 16 0 0 0 0 0 0 0 10 0 0 0 7 1 2 2 28 4 5 0 2 0 0 0 9 0 0 0 5 173 1 0 1 0 3 1 0 1 74 2 3 14 1 3 5 0 0 3 4 46 4 1 35 7 11 1 6 28 4 24 2 0 274 1 2 4 0 0 20 1284 12 5 1 5 8 0 32 4 2 0 0 0 0 0 0 0 0 2 5 4 3 0 1 9 1 0 21 239 3 1 0 11 151 88 1 64 508 224 1058 451 145 316 168 97 149 142 74 466 126 84 339 122 2 12 48 34 57 0 133 164 18 83 105 96 95 330 79 285 28 0 241 28 19 236 60 868 167 1247 391 0 0 2 0 67 2 2 0 43 0 66 247 0 18 1 0 1 1 58 0 7 227 0 5 771 39 0 76 61 22 336 13 0 501 529 232 0 1262 211 0 0 171 0 118 28 1 232 115 0 0 59 2 61 132 1 63 0 0 10 138 25 0 30 7 97 24 107 150 0 15 50 2 0 237 139 323 218 7 26 2 0 2 70 93 12 0 3 36 8 1 16 189 48 116 2196 21 235 0 1735 0 113 262 447 262 0 45 450 235 26 0 0 0 41 146 9 52 45 0 2210 17 165 36 86 220 307 1610 24 0 53 140 205 101 56 21 463 42 296 13 0 59 87 1 2 37 2064 108 17 430 0 11 645 276 3 97 3 131 122 152 20 194 93 169 221 425 250 36 1 3 0 185 203 19 1060 109 31 0 292 335 0 286 199 476 0 357 112 0 269 0 19 109 110 275 796 27 8 0 303 389 0 454 20 132 22 46 178 347 63 2 1 200 0 68 123 0 28 0 11 545 184 16 198 44 95 1052 93 0 74 296 30 2989 92 745 143 23 40 500 4 140 0 74 0 236 29 98 157 31 0 61 1918 365 93 0 0 5 21 0 11 1 1 0 17 3 12 1 18 331 44 2 0 4 382 207 382 145 0 141 1501 30 0 0 0 84 0 302 11 4 0 24 21 34 0 3 49 1 388 0 11 0 219 82 239 475 648 8 304 397 18 12 88 39 88 212 251 2 245 115 473 0 46 119 364 44 22 230 137 0 0 123 88 191 87 97 116 310 255 180 76 232 0 180 55 1 71 810 316 10 1230 0 12 3 0 57 0 66 240 29 10 0 321 1 0 73 94 0 0 17 139 0 47 137 0 1 52 322 1 252 8 59 1 65 47 180 108 462 35 74 157 561 508 102 14 0 124 234 0 20 0 56 129 71 1245 164 98 756 756 53 18 13 95 15 237 441 187 68 3 141 41 113 221 29 0 100 152 42 3 1 1 153 349 113 6 2 1 5 35 29 17 78 0 120 107 66 497 8 32 0 54 425 378 184 98 30 72 8 783 118 108 2 70 23 215 41 0 712 100 3 147 30 12 36 9 8 858 304 1 126 89 1 1653 21 4 0 28 722 0 0 1 0 660 4 41 2559 2 0 91 967 0 0 8 13 24 270 571 22 18 10 726 40 36 2 1 353 23 3 3 62 1313 289 29 69 160 129 99 12 697 255 157 36 255 0 15 335 131 0 106 327 90 259 326 0 455 0 70 563 45 4 138 6 3 97 27 76 0 64 54 194 41 56 166 1 84 52 203 168 590 0 1633 61 238 0 329 5 2 3915 100 967 1943 0 103 4 75 721 500 7722 153 84 437 276 86 311 192 104 0 338 149 0 0 133 656 270 82 0 0 71 55 4155 1 46 16 0 105 1 425 241 1724 424 58 74 1549 429 269 263 91 392 56 444 172 8 63 1815 172 0 445 317 2 244 144 42 215 0 316 902 0 29 101 5 9 224 195 57 279 55 457 257 320 32 236 97 239 301 298 106 67 677 8 144 0 279 209 184 8 103 414 33 0 23 2140 39 864 1272 3 339 24 162 221 636 1 1 0 1 1 188 0 6 36 17 397 0 165 2343 260 120 154 454 359 3 10 56 35 0 6 37 0 20 26 0 111 7 78 1 8 29 0 181 34 18 10 77 21 0 39 72 0 101 86 1 35 10 0 6 3 3 1 0 11 5 0 16 6 0 95 21 0 26 3 150 0 0 5 0 0 427 86 0 42 103 0 0 74 70 15 51 5 1 0 6 20 6 0 11 40 1 0 19 0 4 10 0 2 3 3 0 152 69 124 55 0 0 0 8 0 1 26 0 10 3 76 336 1 11 8 0 6 25 1 0 33 14 0 4 1 0 0 67 0 0 0 3 0 0 22 2 6 5 6 0 0 9 1 435 27 6 15 5 12 2 12 10 0 4 0 22 189 40 0 0 0 1 149 0 0 34 2 0 14 2 0 2 0 79 324 1 66 16 76 8 10 49 9 11 92 0 85 309 0 49 4 78 119 1 39 165 0 14 12 0 1 27 163 0 1 109 104 0 16 472 0 178 9 113 17 67 69 9 456 42 0 28 422 19 4 67 32 126 1 4 0 19 0 0 0 10 0 5 0 0 11 145 0 141 22 0 53 34 322 0 32 38 2 173 5 0 7 0 1 4 51 18 0 7 1 0 7 15 12 0 65 7 0 0 42 16 15 59 14 0 3 8 0 16 38 6 0 10 0 3 108 46 0 65 7 4 0 24 2 0 8 382 3 0 43 38 19 15 1 36 4 0 2 22 0 1 26 11 1 30 72 0 7 30 26 1 76 12 113 29 0 0 0 10 0 0 0 0 10 0 3 1 0 2 2 0 4 0 36 26 41 21 199 1 194 90 0 1 107 17 11 118 26 6 5 1 0 1 12 5 0 0 154 261 0 511 587 10 4 6 95 32 10 4 3 1 0 94 16 0 3 1 0 0 0 6 67 1 98 67 33 73 0 0 29 0 0 26 4 0 0 2 308 0 8 114 0 2 2 3 0 29 18 2 137 3 0 13 21 0 0 0 78 1 10 63 0 39 24 0 5 1 150 53 74 164 31 244 0 9 7 9 25 3 0 65 4 4 1 11 17 0 4 45 36 12 113 0 0 0 0 0 3 197 149 2 185 15 0 7 1 8 23 0 0 2 27 0 0 12 19 0 6 267 14 0 1 4 0 37 4 3 8 21 24 0 74 37 6 20 36 0 3 10 3 0 279 12 0 43 196 1339 54 0 3 1 4 0 47 3 0 37 0 0 0 21 3 30 0 11 23 0 21 156 105 55 0 0 81 20 352 15 49 0 152 10 0 51 34 0 46 23 241 250 15 14 0 6 34 0 253 57 25 10 36 437 3 88 159 0 43 44 0 0 222 27 21 2 2 3 0 59 61 9 42 1 0 26 164 3 1 16 45 0 4 2 0 11 39 0 0 26 78 0 23 2 0 154 19 2 0 99 41 0 3 43 50 0 132 15 7 28 30 1 74 5 38 0 0 0 0 11 0 60 2 8 27 1 208 124 0 48 35 0 7 46 0 72 62 5 0 35 5 0 29 5 0 36 17 0 99 23 1 12 0 1 7 0 156 0 1 78 13 1 46 2 5 56 9 126 1 7 0 0 25 7 0 16 32 2 73 187 466 105 47 4 0 155 19 2 366 218 27 0 0 82 5 0 1 31 9 0 21 0 0 25 264 1 71 0 0 0 17 17 66 413 12 0 1392 117 110 10 2 24 17 1 0 59 49 447 81 249 1 21 65 0 144 41 40 1 41 5 1 199 8 0 22 122 4 0 176 115 3 56 676 2 1 0 3 1 60 39 0 0 0 13 0 32 31 1 30 36 2 2 40 127 6 8 30 0 30 4 0 0 25 9 11 17 SP48 Bacteria;Firmicutes;Bacilli;Bacillales;Gemellaceae;Gemella;morbillorum 120 278 89 18 5 26 0 175 32 31 53 172 69 64 155 11 79 340 15 10 10 2 19 735 129 40 116 72 154 343 65 87 1351 27 230 26 50 318 3 150 29 29 57 1 6 47 29 4 340 0 21 30 3 49 19 0 24 16 83 589 70 78 6 2 15 202 57 28 376 173 140 387 54 8 21 39 39 23 79 89 58 0 40 146 19 21 19 27 167 38 260 11 237 145 0 321 134 77 283 76 481 103 14 0 508 321 26 157 172 79 1 91 38 236 51 21 5 26 38 60 12 14 1 235 13 11 8 3 110 264 61 87 36 119 40 136 39 59 29 30 176 338 127 474 225 306 36 84 37 82 35 23 99 101 75 28 9 0 38 15 199 376 4 12 84 36 505 106 1138 15 0 7 41 151 22 31 164 120 21 99 1 11 54 131 68 42 125 9 0 76 70 143 47 12 7 68 15 5 75 155 281 22 120 0 3 6 10 61 72 0 12 0 32 11 14 39 102 94 117 26 41 118 22 147 13 6 44 22 380 14 77 10 286 40 17 4 21 15 16 344 201 0 47 31 98 46 30 84 2 3 12 121 60 108 12 4 269 6 13 59 129 3 140 193 179 25 3 89 0 0 0 0 0 0 0 0 0 0 0 0 0 0 0 0 0 0 0 0 0 0 0 0 0 0 0 0 0 0 0 0 0 0 0 0 0 0 0 0 0 0 0 0 0 0 0 0 0 0 0 0 0 0 0 0 0 0 0 0 0 0 0 0 0 0 0 0 0 0 0 0 0 0 0 0 0 0 0 0 0 0 0 0 0 0 0 0 0 0 0 0 0 0 0 0 0 0 0 0 0 0 0 0 0 0 0 0 0 0 0 0 0 0 0 0 0 0 0 0 0 0 0 0 0 0 0 0 0 0 0 0 0 0 0 0 0 0 0 0 0 0 0 0 0 0 0 0 0 0 0 0 0 0 0 0 0 0 0 0 0 0 0 0 0 0 0 0 0 0 0 0 0 0 0 0 0 0 0 0 0 0 0 0 0 0 0 0 0 0 0 0 0 0 0 0 0 0 0 0 0 0 0 0 0 0 0 0 0 0 0 0 0 0 0 0 0 0 0 0 0 0 0 0 0 0 0 0 0 0 0 0 0 0 0 0 0 0 0 0 0 0 0 0 0 0 0 0 0 0 0 0 0 0 0 0 0 0 0 0 0 0 0 0 0 0 0 0 0 0 0 0 0 0 0 0 0 0 0 0 0 0 0 0 0 0 0 0 0 0 0 0 0 0 0 0 0 0 0 0 0 0 0 0 0 0 0 0 0 0 0 0 0 0 0 0 0 0 0 0 0 0 0 0 0 0 0 0 0 0 0 0 0 0 0 0 0 0 0 0 0 0 0 0 0 0 0 0 0 0 0 0 0 0 0 0 0 0 0 0 0 0 0 0 0 0 0 0 0 0 0 0 0 0 0 0 0 0 0 0 0 0 0 0 0 0 0 0 0 0 0 0 0 0 0 0 0 0 0 0 0 0 0 0 0 0 0 0 0 0 0 0 0 0 0 0 0 0 0 0 0 0 0 0 0 0 0 0 0 0 0 0 0 0 0 0 0 0 0 0 0 0 0 0 0 0 0 0 0 0 0 0 0 0 0 0 0 0 0 0 0 0 0 0 0 0 0 0 0 0 0 0 0 0 0 0 0 0 0 0 0 0 0 0 0 0 0 0 0 0 0 0 0 0 0 0 0 0 0 0 0 0 0 0 0 0 0 0 0 0 0 0 0 0 0 0 0 0 0 0 0 0 0 0 0 0 0 0 0 0 0 0 0 0 0 0 0 0 0 0 0 0 0 0 0 0 0 0 0 0 0 0 0 0 0 0 0 0 0 0 0 0 0 0 0 0 0 0 0 0 0 0 0 0 0 0 0 0 0 0 0 0 0 0 0 0 0 0 0 0 0 0 0 0 0 0 0 0 0 0 0 0 0 0 0 0 0 0 0 0 0 0 0 0 0 0 0 0 0 0 0 0 0 0 0 0 0 0 0 0 0 0 0 0 0 0 0 0 0 0 0 0 0 0 0 0 0 0 0 0 0 0 0 0 0 0 0 0 0 0 0 0 0 0 0 0 0 0 0 0 0 0 0 0 0 0 0 0 0 0 0 0 0 0 0 0 0 0 0 0 0 0 0 0 0 0 0 0 0 0 0 0 0 0 0 0 0 0 0 0 0 0 0 0 0 0 0 0 0 0 0 0 0 0 0 0 0 0 0 0 0 0 0 0 0 0 0 0 0 0 0 0 0 0 0 0 0 0 0 0 0 0 0 0 0 0 0 0 0 0 0 0 0 0 0 0 0 0 0 0 0 0 0 0 0 0 0 0 0 0 0 0 0 0 0 0 0 0 0 0 0 0 0 0 0 0 0 0 0 0 0 0 0 0 0 0 0 0 0 0 0 0 0 0 0 0 0 0 0 0 0 0 0 0 0 0 0 0 0 0 0 0 0 0 0 0 0 0 0 0 0 0 0 0 0 0 0 0 0 0 0 0 0 0 0 0 0 0 0 0 0 0 0 0 0 0 0 0 0 0 0 0 0 0 0 0 0 0 0 0 0 0 0 0 0 0 0 0 0 0 0 0 0 0 0 0 0 0 0 0 0 0 0 0 0 0 0 0 0 0 0 0 0 0 0 0 0 0 0 0 0 0 0 0 0 0 0 0 0 0 0 0 0 0 0 0 0 0 0 0 0 0 0 0 0 0 0 0 0 0 0 0 0 0 0 0 0 0 0 0 0 0 0 0 0 0 0 0 0 0 0 0 0 0 0 0 0 0 0 0 0 0 0 0 0 0 0 0 0 0 0 0 0 0 0 0 0 0 0 0 0 0 0 0 0 0 0 0 0 0 0 0 0 0 0 0 0 0 0 0 0 0 0 0 0 0 0 0 0 0 0 0 0 0 0 0 0 0 0 0 0 0 0 0 0 0 0 0 0 0 0 0 0 0 0 0 0 0 0 0 0 0 0 0 0 0 0 0 0 0 0 0 0 0 0 0 0 0 0 0 0 0 0 0 0 0 0 0 0 0 0 0 0 0 0 0 0 0 0 0 0 0 0 0 0 0 0 0 0 0 0 0 0 0 0 0 0 0 0 0 0 0 0 0 0 0 0 0 0 0 0 0 0 0 0 0 0 0 0 0 0 0 0 0 0 0 0 0 0 0 0 0 0 0 0 0 0 0 0 0 0 0 0 0 0 0 0 0 0 0 0 0 0 0 0 0 0 0 0 0 0 0 0 0 0 0 0 0 0 0 0 0 0 0 0 0 0 0 0 0 0 0 0 0 0 0 0 0 0 0 0 0 0 0 0 0 0 0 0 0 0 0 0 0 0 0 0 0 0 0 0 0 0 0 0 0 0 0 0 0 0 0 0 0 0 0 0 0 0 0 0 0 0 0 0 0 0 0 0 0 0 0 0 0 0 0 0 0 0 0 0 0 0 0 0 0 0 0 0 0 0 0 0 0 0 0 0 0 0 0 0 0 0 0 0 0 0 0 0 0 0 0 0 0 0 0 0 0 0 0 0 0 0 0 0 0 0 0 0 0 0 0 0 0 0 0 0 0 0 0 0 0 0 0 0 0 0 0 0 0 0 0 0 0 0 0 0 0 0 0 0 0 0 0 0 0 0 0 0 0 0 0 0 0 0 0 0 0 0 0 0 0 0 0 0 0 0 0 0 0 0 0 0 0 0 0 0 0 0 0 0 0 0 0 0 0 0 0 0 0 0 0 0 0 0 0 0 0 0 0 0 0 0 0 0 0 0 0 0 0 0 0 0 0 0 0 0 0 0 0 0 0 0 0 0 0 0 0 0 0 0 0 0 0 0 0 0 0 0 0 0 0 0 0 0 0 0 0 0 0 0 0 0 0 0 0 0 0 0 0 0 0 0 0 0 0 0 0 0 0 0 0 0 0 0 0 0 0 0 0 0 0 0 0 0 0 0 0 0 0 0 0 0 0 0 0 0 0 0 0 0 0 0 0 0 0 0 0 0 0 0 0 0 0 0 0 0 0 0 0 0 0 0 0 0 0 0 0 0 0 0 0 0 0 0 0 0 0 0 0 0 0 0 0 0 0 SP493 Bacteria;Actinobacteria;Coriobacteriia;Coriobacteriales;Atopobiaceae;Lancefieldella;parvula 1005 263 8 1308 43 508 33 1689 30 169 753 3 177 184 41 2780 139 17 1533 998 3254 157 421 131 403 1011 1 324 44 29 577 2114 9 1732 664 160 790 583 249 3 722 13 152 1008 217 331 83 597 211 43 1562 4298 3073 29 989 82 1584 589 14 756 135 5 123 19 592 11 4 1519 81 722 923 463 82 1496 722 215 2536 2233 46 874 1053 5448 48 137 1425 640 2633 1843 155 2500 54 3071 70 67 355 494 0 47 4 305 139 833 381 37 89 37 1009 13 1180 77 444 16 3818 852 2093 19 915 1454 2811 791 2460 1197 3329 431 1298 1902 2138 4284 2359 2 672 449 566 212 918 415 715 854 134 964 120 3 62 30 11 2324 1427 436 2597 2 6818 945 4042 241 529 889 1726 286 497 453 162 4 812 52 423 370 13 420 14 337 13 115 60 46 2894 1452 559 539 60 21 69 43 234 610 2853 116 355 895 1342 740 640 117 338 341 1177 101 1481 276 380 66 1 1422 3607 90 759 747 2 19 11 6 1346 448 454 322 410 910 72 3869 0 430 68 572 177 119 2878 658 792 16 161 1855 3479 4 404 32 2837 2418 1185 739 571 161 168 394 2226 5 29 582 1425 321 4272 743 1194 49 13 1651 195 146 3719 1830 697 921 679 1065 603 921 620 1813 2992 3357 0 0 0 0 0 0 0 0 0 0 0 0 0 0 0 0 0 0 0 0 0 0 0 0 0 0 0 0 0 0 0 0 0 0 0 0 0 0 0 0 0 0 0 0 0 0 0 0 0 0 0 0 0 0 0 0 0 0 0 0 0 0 0 0 0 0 0 0 0 0 0 0 0 0 0 0 0 0 0 0 0 0 0 0 0 0 0 0 0 0 0 0 0 0 0 0 0 0 0 0 0 0 0 0 0 0 0 0 0 0 0 0 0 0 0 0 0 0 0 0 0 0 0 0 0 0 0 0 0 0 0 0 0 0 0 0 0 0 0 0 0 0 0 0 0 0 0 0 0 0 0 0 0 0 0 0 0 0 0 0 0 0 0 0 0 0 0 0 0 0 0 0 0 0 0 0 0 0 0 0 0 0 0 0 0 0 0 0 0 0 0 0 0 0 0 0 0 0 0 0 0 0 0 0 0 0 0 0 0 0 0 0 0 0 0 0 0 0 0 0 0 0 0 0 0 0 0 0 0 0 0 0 0 0 0 0 0 0 0 0 0 0 0 0 0 0 0 0 0 0 0 0 0 0 0 0 0 0 0 0 0 0 0 0 0 0 0 0 0 0 0 0 0 0 0 0 0 0 0 0 0 0 0 0 0 0 0 0 0 0 0 0 0 0 0 0 0 0 0 0 0 0 0 0 0 0 0 0 0 0 0 0 0 0 0 0 0 0 0 0 0 0 0 0 0 0 0 0 0 0 0 0 0 0 0 0 0 0 0 0 0 0 0 0 0 0 0 0 0 0 0 0 0 0 0 0 0 0 0 0 0 0 0 0 0 0 0 0 0 0 0 0 0 0 0 0 0 0 0 0 0 0 0 0 0 0 0 0 0 0 0 0 0 0 0 0 0 0 0 0 0 0 0 0 0 0 0 0 0 0 0 0 0 0 0 0 0 0 0 0 0 0 0 0 0 0 0 0 0 0 0 0 0 0 0 0 0 0 0 0 0 0 0 0 0 0 0 0 0 0 0 0 0 0 0 0 0 0 0 0 0 0 0 0 0 0 0 0 0 0 0 0 0 0 0 0 0 0 0 0 0 0 0 0 0 0 0 0 0 0 0 0 0 0 0 0 0 0 0 0 0 0 0 0 0 0 0 0 0 0 0 0 0 0 0 0 0 0 0 0 0 0 0 0 0 0 0 0 0 0 0 0 0 0 0 0 0 0 0 0 0 0 0 0 0 0 0 0 0 0 0 0 0 0 0 0 0 0 0 0 0 0 0 0 0 0 0 0 0 0 0 0 0 0 0 0 0 0 0 0 0 0 0 0 0 0 0 0 0 0 0 0 0 0 0 0 0 0 0 0 0 0 0 0 0 0 0 0 0 0 0 0 0 0 0 0 0 0 0 0 0 0 0 0 0 0 0 0 0 0 0 0 0 0 0 0 0 0 0 0 0 0 0 0 0 0 0 0 0 0 0 0 0 0 0 0 0 0 0 0 0 0 0 0 0 0 0 0 0 0 0 0 0 0 0 0 0 0 0 0 0 0 0 0 0 0 0 0 0 0 0 0 0 0 0 0 0 0 0 0 0 0 0 0 0 0 0 0 0 0 0 0 0 0 0 0 0 0 0 0 0 0 0 0 0 0 0 0 0 0 0 0 0 0 0 0 0 0 0 0 0 0 0 0 0 0 0 0 0 0 0 0 0 0 0 0 0 0 0 0 0 0 0 0 0 0 0 0 0 0 0 0 0 0 0 0 0 0 0 0 0 0 0 0 0 0 0 0 0 0 0 0 0 0 0 0 0 0 0 0 0 0 0 0 0 0 0 0 0 0 0 0 0 0 0 0 0 0 0 0 0 0 0 0 0 0 0 0 0 0 0 0 0 0 0 0 0 0 0 0 0 0 0 0 0 0 0 0 0 0 0 0 0 0 0 0 0 0 0 0 0 0 0 0 0 0 0 0 0 0 0 0 0 0 0 0 0 0 0 0 0 0 0 0 0 0 0 0 0 0 0 0 0 0 0 0 0 0 0 0 0 0 0 0 0 0 0 0 0 0 0 0 0 0 0 0 0 0 0 0 0 0 0 0 0 0 0 0 0 0 0 0 0 0 0 0 0 0 0 0 0 0 0 0 0 0 0 0 0 0 0 0 0 0 0 0 0 0 0 0 0 0 0 0 0 0 0 0 0 0 0 0 0 0 0 0 0 0 0 0 0 0 0 0 0 0 0 0 0 0 0 0 0 0 0 0 0 0 0 0 0 0 0 0 0 0 0 0 0 0 0 0 0 0 0 0 0 0 0 0 0 0 0 0 0 0 0 0 0 0 0 0 0 0 0 0 0 0 0 0 0 0 0 0 0 0 0 0 0 0 0 0 0 0 0 0 0 0 0 0 0 0 0 0 0 0 0 0 0 0 0 0 0 0 0 0 0 0 0 0 0 0 0 0 0 0 0 0 0 0 0 0 0 0 0 0 0 0 0 0 0 0 0 0 0 0 0 0 0 0 0 0 0 0 0 0 0 0 0 0 0 0 0 0 0 0 0 0 0 0 0 0 0 0 0 0 0 0 0 0 0 0 0 0 0 0 0 0 0 0 0 0 0 0 0 0 0 0 0 0 0 0 0 0 0 0 0 0 0 0 0 0 0 0 0 0 0 0 0 0 0 0 0 0 0 0 0 0 0 0 0 0 0 0 0 0 0 0 0 0 0 0 0 0 0 0 0 0 0 0 0 0 0 0 0 0 0 0 0 0 0 0 0 0 0 0 0 0 0 0 0 0 0 0 0 0 0 0 0 0 0 0 0 0 0 0 0 0 0 0 0 0 0 0 0 0 0 0 0 0 0 0 0 0 0 0 0 0 0 0 0 0 0 0 0 0 0 0 0 0 0 0 0 0 0 0 0 0 0 0 0 0 0 0 0 0 0 0 0 0 0 0 0 0 0 0 0 0 0 0 0 0 0 0 0 0 0 0 0 0 0 0 0 0 0 0 0 0 0 0 0 0 0 0 0 0 0 0 0 0 0 0 0 0 0 0 0 0 0 0 0 0 0 0 0 0 0 0 0 0 0 0 0 0 0 0 0 0 0 0 0 0 0 0 0 0 0 0 0 0 0 0 0 0 0 0 0 0 0 0 0 0 0 0 0 0 0 0 0 0 0 0 0 0 0 0 0 0 0 0 0 0 0 0 0 0 0 0 0 0 0 0 0 0 0 0 0 0 0 0 0 0 0 0 0 0 0 0 0 0 0 0 0 0 0 0 0 0 0 0 0 0 0 0 0 0 0 0 0 0 0 0 0 0 0 0 0 0 0 0 0 0 0 0 0 0 0 0 0 0 0 0 0 0 0 0 0 0 0 0 0 0 0 0 0 0 0 0 0 0 0 0 0 0 0 0 0 0 0 0 0 0 0 0 0 0 0 0 0 0 0 0 0 0 0 0 0 0 0 0 0 0 0 0 0 0 0 0 0 0 0 0 0 0 0 0 0 0 0 0 0 0 0 0 0 0 SP5 Bacteria;Firmicutes;Clostridia;Negativicutes;Veillonellaceae;Veillonella;denticariosi 0 0 0 0 0 0 0 0 0 0 0 0 0 0 0 0 0 0 0 0 0 0 0 0 0 0 0 0 0 0 0 0 0 0 0 0 0 0 0 0 0 0 0 0 0 0 0 0 0 0 0 0 0 0 0 0 0 0 0 0 0 0 0 0 0 0 0 0 0 0 0 0 0 0 0 0 0 0 0 0 0 0 0 0 0 0 0 0 0 0 0 0 0 0 0 0 0 0 0 0 0 0 0 0 0 0 0 0 0 0 0 0 0 0 0 0 0 0 0 0 0 0 0 0 0 0 0 0 0 0 0 0 0 0 0 0 0 0 0 0 0 0 0 0 0 0 0 0 0 0 0 0 0 0 0 0 0 0 0 0 0 0 0 0 0 0 0 0 0 0 0 0 0 0 0 0 0 0 0 0 0 0 0 0 0 0 0 0 0 0 0 0 0 0 0 0 0 0 0 0 0 0 0 0 0 0 0 0 0 0 0 0 0 0 0 0 0 0 0 0 0 0 0 0 0 0 0 0 0 0 0 0 0 0 0 0 0 0 0 0 0 0 0 0 0 0 0 0 0 0 0 0 0 0 0 0 0 0 0 0 0 0 0 0 0 0 0 0 0 0 32 0 0 0 5 0 16 147 1 1 74 3 1731 22 345 0 1 0 0 6 5 0 0 0 1 4 83 258 0 6 26 32 0 1 0 4 173 3 0 3 0 31 304 1 2 27 0 14 116 5 0 0 0 0 0 0 0 0 8 0 7 117 0 0 0 0 0 0 0 0 6 0 0 142 0 418 1 64 38 0 0 0 0 0 0 0 0 3 2 0 0 1 0 53 62 34 0 29 2 0 0 0 225 0 2 1 0 0 0 7 0 0 0 0 0 34 66 0 0 0 0 1 0 0 0 171 21 0 0 0 0 1 1 153 33 5 0 14 1 20 77 25 88 4 1 89 69 0 149 0 5 109 6 1 0 3 0 0 0 0 0 0 5 7 1 0 30 0 300 33 2 0 0 115 30 18 0 0 78 67 133 25 2 0 180 266 12 80 3 0 0 1 0 0 0 1 28 41 0 1 25 0 0 0 36 83 13 7 0 7 15 65 107 5 0 1 1 8 0 10 78 39 426 0 0 0 0 1 0 111 202 0 0 0 0 0 415 0 14 194 671 372 806 1 0 0 15 138 0 0 0 54 5 6 4 12 0 0 0 0 0 0 0 0 47 0 20 1458 0 0 0 3 6 0 0 0 0 6 0 1922 0 1 0 0 8 0 4 0 0 0 0 89 110 77 122 7 0 366 0 0 33 0 1 57 0 4 29 0 0 0 0 1 0 0 0 0 1 0 19 0 152 0 0 0 0 18 0 4 0 0 0 10 0 0 14 10 0 0 0 0 0 0 0 0 2 0 0 0 380 56 348 36 31 0 0 0 187 2 0 0 1 5 29 1 0 0 39 0 22 129 2 114 102 5 29 0 0 165 999 0 157 297 38 28 32 154 41 144 0 70 77 0 21 184 131 0 27 3 0 0 2 0 0 0 0 0 101 0 0 0 0 0 7 0 1 75 14 0 33 3 6 0 372 86 41 18 0 198 0 28 8 0 11 45 0 2 113 0 149 19 0 0 19 32 0 9 1 225 0 1 0 0 0 6 0 1 0 1 10 3 141 1257 117 49 10 184 62 203 142 175 1 15 6 8 0 0 1 36 259 2 0 0 1 0 0 0 0 0 0 0 0 0 0 0 0 0 0 0 0 48 6 0 87 13 0 145 99 0 35 331 197 0 0 0 77 2 2 0 1 0 5 2 0 0 0 3 8 0 96 0 0 9 4 238 0 0 0 0 1 1 0 19 0 0 0 1 1 0 0 0 0 0 54 0 6 75 275 3 0 0 0 0 0 0 0 0 0 62 447 17 16 0 5 0 0 79 3 11 4 0 0 2 15 0 0 59 31 0 0 0 13 1 1 0 25 1 0 17 3 0 44 15 185 78 10 0 178 0 0 0 6 4 89 0 5 0 0 0 0 0 45 425 0 0 0 0 69 0 1 0 27 35 0 584 7 12 0 0 4 1 0 0 0 0 278 0 0 143 8 0 0 1 0 19 0 21 0 0 0 0 82 11 50 2 1048 453 292 175 0 460 9 29 5 9 0 6 1 0 30 0 0 0 40 5 0 66 211 31 39 0 0 427 0 89 0 6 0 0 0 0 21 7 0 288 32 1 148 1104 608 0 0 0 189 281 90 410 0 94 0 0 0 0 0 110 4 5 26 7 112 0 0 0 0 0 93 0 0 0 0 1 0 0 0 0 0 0 2 0 0 21 3 137 0 16 65 0 3 5 240 0 0 2 0 0 2 0 8 11 59 0 0 0 0 0 102 13 1 17 4 0 4 6 0 34 2 0 0 0 0 4 60 4 0 0 2 1 0 2 4 0 79 17 0 0 0 61 0 0 0 0 0 63 0 0 0 0 0 0 139 72 30 187 7 0 0 0 0 0 0 0 0 0 0 0 0 12 5 0 0 0 0 0 12 106 0 0 1 0 0 160 0 0 51 0 0 0 9 0 0 3 2 0 9 11 0 0 1 1 0 10 5 0 0 0 0 0 0 0 0 0 3 1 0 0 2 0 0 0 48 7 0 0 0 0 0 0 1 10 0 3 0 50 8 0 0 0 0 0 13 5 0 0 0 0 0 0 0 0 0 54 763 3 83 44 30 8 0 5 0 2 9 0 44 773 9 13 0 78 39 13 57 39 2 125 63 1 0 5 6 0 0 17 243 0 8 143 0 86 0 3 0 12 0 45 91 49 0 0 1 0 0 26 0 0 0 0 0 20 1 0 0 34 0 13 28 0 2 83 0 4 0 0 0 0 1 0 7 44 0 117 0 0 0 0 5 0 0 0 0 0 1 0 0 0 76 0 4 0 0 0 0 4 1 24 0 0 7 24 0 4 0 11 0 0 0 0 0 0 0 17 0 0 0 0 19 0 0 0 0 0 0 0 1 0 0 1 38 140 0 21 0 0 0 1 49 0 0 0 15 2 0 0 8 4 0 0 1 0 0 0 1 0 0 0 0 0 3 0 0 0 0 0 1 0 13 56 6 0 28 1 0 0 2 0 0 0 0 4 2 38 0 0 0 3 0 18 0 0 0 31 1 347 5 0 0 25 0 0 0 0 0 0 0 0 5 0 0 0 0 0 0 0 2 0 27 0 0 15 0 0 0 0 0 0 0 0 0 1 236 0 9 186 0 0 63 124 0 1 4 0 151 9 0 74 19 0 0 1 42 7 0 20 3 1 8 0 177 0 2 0 9 17 9 6 0 6 23 1 2 1 0 8 14 7 0 0 1 0 0 0 0 1 10 0 3 4 0 10 0 107 0 0 1 0 0 11 0 0 0 0 0 34 0 0 1 6 31 3 10 812 12 2 0 0 0 8 1 2 0 2 0 0 41 38 0 0 0 0 1 21 4 0 279 0 0 20 0 1613 0 0 0 3 7 0 0 0 0 0 0 1 0 0 0 1 0 18 171 0 38 1 0 5 0 0 1 12 27 22 0 0 80 1 0 14 52 8 15 0 3 13 8 211 0 32 121 0 192 1 0 2 2 70 0 3 1 0 14 0 0 0 46 2 0 0 0 0 0 0 0 0 5 0 0 28 4 5 0 13 56 0 7 67 0 3 127 0 0 0 0 0 2 0 0 78 0 0 0 8 0 0 0 0 0 2 1 24 0 0 0 0 7 0 284 0 0 1 0 35 0 7 2 30 0 0 46 126 0 0 7 0 0 0 0 7 447 5 0 9 0 1 0 0 0 76 24 1 0 0 0 0 0 0 0 1 5 0 0 8 100 0 0 0 0 29 1 0 3 0 0 0 0 1 0 0 8 0 0 0 0 5 10 23 0 2 0 0 0 16 12 3 0 57 1 0 1 0 0 0 31 0 0 0 0 8 940 0 0 0 0 0 0 20 19 0 40 88 1 9 15 4 3 0 0 31 928 40 0 0 0 62 28 1 278 16 48 0 0 0 0 4 28 0 0 48 0 18 5 14 0 8 95 0 0 0 0 0 2 0 0 0 0 0 0 0 0 0 0 0 0 3 6 0 0 0 12 0 0 0 0 0 0 2 1 0 SP50 Bacteria;Proteobacteria;Gammaproteobacteria;Pasteurellales;Pasteurellaceae;Haemophilus;parahaemolyticus 2 73 32 2 1 144 18 0 0 270 4 0 327 28 2 5 12 26 1 0 0 1 30 294 1 4 165 38 206 199 0 0 8 2 8 25 3 14 15 402 1 16 14 2 180 4 292 3 0 214 20 0 0 257 4 0 0 10 271 54 0 0 83 0 0 31 19 0 63 11 0 16 47 143 0 3 0 1 44 1 42 6 0 20 0 0 3 0 4 0 4 2 115 0 2 1 219 0 9 1 0 2 0 2 0 65 4 90 1 6 767 14 0 0 3 124 3 0 0 4 16 0 1 22 1 0 0 0 0 3 0 0 0 28 0 45 0 3 0 1 54 160 348 54 117 2 0 14 0 2 0 0 0 2 0 0 0 8 0 2 0 22 2 0 6 0 1 0 0 0 0 2 1 233 1 0 0 0 0 9 0 0 50 0 0 0 0 0 0 6 0 0 0 0 0 52 0 0 11 1 167 2 0 0 1 10 105 7 11 0 0 1 0 0 0 4 0 0 0 0 992 2 7 1 0 0 4 16 66 20 0 4 0 16 0 0 3 2 4 7 1 1 0 175 24 0 0 1 0 1 0 7 2 0 0 0 0 0 3 0 3 0 1 0 3 0 1 0 0 0 12 0 0 0 0 0 0 0 0 0 1 0 0 0 0 0 0 2 0 2 0 0 0 4 0 0 0 0 0 0 0 0 0 0 0 0 0 0 28 0 0 0 0 0 0 0 0 0 0 0 7 0 0 0 0 0 2 0 1 0 0 0 1 10 1 0 0 0 0 0 0 0 0 0 1 0 0 1 3 0 0 0 0 0 0 0 0 0 0 0 0 0 0 0 0 0 0 4 0 0 8 18 0 0 8 0 0 0 0 0 0 0 0 0 0 0 0 0 0 0 3 0 0 0 0 0 0 0 0 0 0 0 0 1 0 0 0 0 0 1 0 0 0 0 0 0 3 0 2 0 2 0 0 0 0 0 0 0 0 0 2 0 0 0 0 0 0 53 0 8 0 0 0 0 1 0 0 0 0 3 0 2 0 0 0 4 0 46 0 0 2 0 14 0 0 2 0 0 0 0 0 7 0 0 0 0 3 0 0 0 0 0 0 0 0 1 1 0 0 1 0 0 0 15 1 0 0 0 354 0 0 0 0 1 0 0 2 0 0 1 0 0 0 0 0 0 0 0 0 0 0 0 0 0 5 0 0 0 2 0 0 0 0 0 0 0 1 0 0 0 0 5 2 3 0 1 1 0 0 0 0 0 0 0 0 0 0 0 0 0 0 0 0 0 0 1 4 0 0 0 0 0 0 0 0 0 1 0 0 0 711 0 0 0 0 0 0 0 1 0 0 0 0 4 18 0 0 0 0 0 0 0 0 0 1 0 3 0 0 0 0 1 0 2 0 0 0 0 0 0 3 0 0 0 0 0 0 7 1 0 0 1 0 0 0 0 0 0 0 0 0 0 1 0 1 0 0 2 0 0 0 0 0 0 0 0 0 0 0 0 0 0 0 0 0 0 0 0 0 0 0 0 0 6 17 0 0 0 0 0 0 1 0 2 0 1 0 0 0 0 0 0 0 0 0 0 0 0 0 0 0 0 0 0 0 0 0 0 0 0 11 0 0 0 0 0 0 0 1 5 0 1 0 6 0 3 0 0 0 0 0 0 0 7 1 0 0 0 0 0 0 0 1 4 11 30 0 12 0 27 2 0 0 0 0 5 24 30 7 0 16 0 0 1 1 0 1 0 1 0 0 0 0 0 0 0 0 0 0 0 0 0 0 0 1 0 0 2 0 18 0 0 0 0 0 0 0 0 0 0 0 0 0 1 0 0 0 0 0 0 0 0 0 0 2 0 0 0 0 0 15 2 0 6 0 0 0 0 0 0 16 0 0 0 0 0 0 0 6 0 0 0 0 0 0 0 0 0 0 4 0 0 1 0 0 0 0 0 0 0 0 0 0 0 0 13 0 0 0 0 1 95 5 0 0 0 2 0 0 0 0 4 0 0 0 0 1 0 1 0 0 0 1211 183 0 0 0 0 2 0 0 0 0 0 1 0 0 0 0 0 1 0 0 0 0 0 0 0 0 0 0 0 0 0 0 0 30 0 0 0 14 0 0 0 0 0 3 0 0 0 0 0 0 0 0 0 0 0 0 0 0 0 0 1 56 0 0 29 1 0 9 0 0 0 0 0 0 12 8 0 1 3 0 0 0 0 1 0 0 0 0 0 0 0 0 0 0 0 0 0 0 0 0 0 0 0 1 0 0 0 0 0 0 0 0 0 0 0 0 0 0 0 0 0 7 12 0 0 1 0 0 2 4 0 0 0 7 2 0 1 0 0 0 3 0 1 0 0 0 1 4503 241 0 0 0 0 356 0 0 0 255 0 0 0 0 0 0 6 0 1 17 0 0 0 96 9 1 1437 69 521 0 0 430 210 7 0 5 1 0 0 0 0 0 0 35 0 0 0 371 5 40 2 0 0 0 22 0 0 2 0 156 0 228 1 0 0 0 1 0 406 23 0 744 0 0 1 0 0 0 8 0 6 32 0 0 0 4 4 0 357 11 4 395 0 0 1 0 127 0 0 0 0 0 1 0 0 0 6 38 0 21 0 0 4 38 67 30 62 997 1 0 8 6 0 0 2 0 15 0 0 0 47 0 54 0 0 0 12 0 879 0 8 0 0 5 0 0 0 3 0 0 3 6 41 0 0 0 0 0 13 4 0 0 0 5 508 4 7 0 0 0 0 0 15 0 9 78 0 4 479 7 4 0 0 3729 10 3 0 84 0 0 51 0 0 1 0 0 15 0 19 34 343 0 1 136 0 8 0 0 0 13 0 0 170 193 5 153 0 0 240 6 1 13 436 26 724 0 0 0 0 81 0 0 0 62 0 0 265 0 1769 1196 28 57 3 0 0 301 1 0 0 215 0 0 0 0 0 3 118 0 1391 0 0 0 35 290 3 40 0 0 0 0 0 5 1371 475 0 5 0 0 6 52 1 0 4 1 59 91 0 0 1320 138 10 2973 493 0 86 0 0 205 5 0 2 811 682 38 4 125 0 0 2 117 189 61 71 0 391 0 1 0 86 17 177 0 0 431 52 184 0 0 0 0 0 1 206 48 0 0 3920 211 0 32 2 0 265 39 1 1 0 278 0 0 1059 613 671 2 111 3 0 7 4 1 44 0 0 22 0 20 0 0 11 0 0 0 0 70 0 0 14 65 21 252 0 0 26 5 0 1 1 10 2 26 0 0 0 2 1 0 0 0 0 0 0 11 0 0 0 13 22 0 37 93 2 0 18 2 22 15 0 244 0 9 0 0 2 0 21 27 0 23 0 0 508 334 0 0 586 83 0 20 0 1 290 83 2 0 118 0 0 1 53 2 2 211 1964 150 5 0 1 0 0 0 23 399 2724 161 0 0 0 17 19 0 0 1 6 0 28 0 4 0 93 0 0 40 46 3 1 129 1 0 18 0 0 0 647 0 30 0 0 148 618 31 49 0 13 0 0 0 0 0 119 0 5 0 2 0 29 617 1 102 0 300 0 0 0 4 0 3 14 0 0 1068 219 1 804 1385 0 0 13 1 0 1 7 1 48 62 0 0 0 279 0 11 0 0 0 0 2 0 0 0 0 0 7 0 3 44 17 0 80 3 1 0 0 0 0 466 0 0 31 0 16 1 0 0 1 0 2 0 2867 821 0 137 863 0 1 127 75 190 0 4 1 0 566 0 0 1 0 0 0 131 0 14 135 0 0 6 2 0 7 1 0 344 1 0 2726 1 0 0 0 1 19 391 1664 148 0 0 1 0 14 2 0 121 0 0 0 0 181 50 0 0 0 0 146 6 134 0 0 9 0 5 30 894 0 2 0 0 0 0 1 0 0 0 0 1 1079 222 3 4 0 2 190 17 131 1 0 0 0 0 1 1 9 0 76 74 0 1 61 0 0 0 7 2 136 0 635 0 348 0 6 49 0 0 220 0 0 4 0 40 45 5 195 3 0 0 0 1 0 0 0 0 0 2 0 76 219 59 0 11 0 0 0 0 0 0 0 0 0 1072 3 0 0 0 0 0 7 1 0 0 0 1 0 0 1 0 54 0 0 47 7 1 804 0 6 5 671 132 0 60 0 0 65 0 0 1 0 SP51 Bacteria;Bacteroidetes;Bacteroidia;Bacteroidales;Prevotellaceae;Prevotella;sp. HMT305 3 0 0 19 0 2 0 0 0 2 368 0 19 0 0 14 0 0 6 13 32 0 14 0 6 1 0 0 0 0 0 1 0 40 0 2 1 2 2 0 0 0 0 62 0 0 0 3 0 0 97 25 151 0 170 0 113 9 0 46 0 0 0 1 0 0 0 381 2 0 6 1 0 0 1 0 4 2 0 3 0 0 0 0 580 8 0 7 0 2069 0 66 0 0 8 0 0 0 0 4 0 17 0 0 0 0 0 0 0 2 0 0 340 9 199 0 10 627 383 0 8 0 418 25 904 0 653 71 155 0 2 0 2 0 591 0 0 1 11 0 0 1 0 0 0 130 17 5 0 0 0 0 0 0 3 0 87 2 0 0 0 0 7 0 0 0 0 8 0 6 0 0 0 0 24 42 0 0 0 0 0 0 0 2 319 0 0 1 0 91 0 0 22 0 35 0 153 4 0 4 0 0 1003 0 0 363 0 0 0 0 0 1 1 10 0 1 0 38 0 0 2 0 4 0 913 0 1 0 0 80 5 0 0 0 0 0 12 27 4 1 0 0 0 0 0 0 1 0 1 0 337 0 0 23 0 0 0 3 0 355 7 482 0 0 62 2 0 49 0 0 0 0 0 0 0 0 0 0 0 0 0 0 8 0 0 0 0 0 0 0 0 0 0 0 0 0 0 5 0 0 0 0 0 0 0 0 0 0 0 0 0 0 0 0 0 0 0 0 0 0 0 0 2 0 0 0 0 0 0 0 0 0 0 0 0 0 0 0 0 0 0 0 0 0 0 0 0 0 0 0 0 0 0 0 0 0 0 0 0 0 0 0 0 0 0 0 0 0 0 0 0 0 0 0 0 0 0 0 0 0 0 0 0 0 0 0 0 0 0 0 0 0 0 0 0 0 0 0 0 0 0 0 0 0 0 0 0 0 0 0 0 0 0 0 0 0 0 0 0 0 0 0 0 0 0 0 0 0 0 0 0 0 0 0 0 0 0 0 0 0 0 0 0 0 0 0 0 0 0 0 0 0 0 0 0 0 0 0 0 0 0 0 0 0 0 0 2 0 0 0 0 0 0 0 0 0 0 0 0 0 0 0 2 0 0 1 0 0 0 0 0 0 0 0 0 0 0 0 0 0 0 0 0 0 0 0 0 0 0 0 0 0 0 0 0 0 0 0 0 0 0 0 0 0 0 0 0 0 0 0 0 0 0 0 0 0 0 0 0 0 0 0 0 0 0 0 0 0 0 0 0 0 0 0 0 0 0 0 0 1 0 0 0 0 0 0 0 0 0 0 0 0 0 0 0 0 0 0 0 0 0 0 0 0 0 0 0 0 0 0 0 0 0 0 0 0 0 0 0 0 0 0 0 0 0 0 0 0 0 0 0 0 0 0 0 0 0 0 0 0 0 0 0 0 0 0 0 0 0 0 0 0 0 0 0 0 0 0 0 0 0 0 0 0 0 0 0 0 0 0 0 0 0 0 0 0 0 0 0 0 0 0 0 0 0 0 0 0 0 0 0 0 0 0 0 0 0 0 0 0 0 0 0 0 0 0 0 0 0 0 0 0 0 0 0 0 0 0 0 0 0 0 0 0 0 0 0 0 0 0 0 0 0 0 0 0 0 0 0 0 0 0 0 0 0 0 0 0 0 0 0 0 0 0 0 0 0 0 0 0 0 0 0 0 0 0 0 0 0 0 0 0 0 0 0 0 0 0 0 0 0 0 0 0 0 0 0 0 0 0 0 0 0 0 0 0 0 0 0 0 0 0 0 0 0 0 0 0 0 0 0 0 0 0 0 0 0 0 0 0 0 0 0 0 0 0 0 0 0 0 0 0 0 0 0 0 0 0 0 0 0 0 0 0 0 0 0 1 0 0 0 0 0 0 0 0 0 0 0 0 0 0 0 0 0 0 0 0 0 1 0 1 0 0 0 0 0 0 0 0 0 0 0 0 0 0 0 0 0 0 0 0 0 0 0 0 0 0 0 0 0 0 0 0 0 0 0 0 0 0 0 0 0 0 0 0 0 0 0 0 0 0 0 0 0 0 0 0 0 0 0 0 0 0 0 0 0 0 0 0 0 0 0 0 0 0 0 0 0 0 0 0 0 0 0 0 0 0 0 0 0 0 0 0 0 0 0 0 0 0 0 0 0 0 0 0 0 0 0 0 0 0 1 0 0 0 0 0 0 0 0 0 0 0 0 0 0 0 0 0 0 0 0 0 0 0 0 0 0 0 0 0 0 0 0 0 0 0 0 0 0 0 0 2 0 0 0 0 0 0 0 0 0 0 0 0 0 0 0 0 0 0 0 0 0 0 0 0 12 0 0 1 0 0 2 0 0 0 0 0 0 0 0 0 0 0 0 0 0 0 0 0 2 9 0 4 0 0 0 0 0 0 1 0 0 2 0 0 0 0 0 0 0 0 0 0 0 0 0 0 0 0 0 0 0 0 0 0 0 0 0 0 0 0 0 0 0 0 0 0 0 0 0 0 0 0 0 0 0 0 0 0 0 0 0 0 0 0 0 0 0 0 0 0 0 0 0 0 0 0 1 0 0 0 0 0 7 1 0 0 14 0 0 0 0 0 0 0 0 0 0 0 0 0 76 0 0 0 0 0 0 0 0 0 0 0 0 0 0 0 0 0 0 0 0 0 0 0 0 0 0 0 0 0 1 0 0 0 1 0 0 0 2 0 0 1 0 0 0 0 0 0 0 0 0 0 1 1 0 0 0 0 0 1 0 0 0 2 0 0 0 1 0 1 2 0 3 0 0 0 0 0 0 0 1 4 0 1 0 0 0 0 0 0 0 0 0 0 0 4 0 0 0 1 0 0 0 0 0 0 0 0 0 0 0 0 0 0 0 0 0 1 0 0 0 0 0 0 0 0 0 0 0 0 0 0 0 0 0 0 0 0 1 0 0 0 0 0 0 0 0 1 1 0 0 0 0 0 0 0 0 0 0 0 5 7 0 0 0 0 0 0 0 0 0 0 0 0 0 8 0 0 0 0 0 0 0 0 0 0 0 0 0 1 0 0 0 0 0 0 0 0 0 0 0 0 0 0 0 0 0 0 0 0 0 0 4 0 0 0 0 0 0 0 0 0 0 0 0 1 0 0 0 0 0 0 0 0 0 1 0 0 1 0 0 0 0 0 0 0 1 2 0 0 0 0 0 0 0 0 1 0 0 0 1 0 0 0 0 0 0 0 0 0 0 0 2 3 0 0 0 0 0 72 0 0 0 0 0 0 1 0 0 0 0 0 0 6 6 0 0 0 0 0 0 0 0 0 0 0 0 0 0 0 0 0 0 0 0 3 0 0 0 0 0 0 0 0 0 0 0 0 0 0 0 0 0 0 0 0 0 0 0 0 0 0 0 0 0 0 0 0 0 0 0 0 0 0 0 0 1 0 0 0 1 0 0 0 0 0 0 0 0 0 0 1 0 0 0 0 0 0 0 0 0 0 0 0 0 1 0 0 0 0 2 1 5 0 0 0 0 0 0 0 0 0 0 0 0 0 0 0 0 0 0 0 0 0 0 0 0 0 0 0 0 0 1 0 1 0 0 0 0 0 0 0 1 0 0 0 0 0 0 0 0 0 0 0 0 20 2 0 0 0 0 0 0 0 0 0 0 0 0 16 0 6 2 0 1 0 0 0 2 6 0 0 0 0 0 0 0 1 0 0 0 0 0 0 0 0 1 0 0 0 0 0 0 0 0 0 0 0 0 0 0 0 0 0 0 0 0 0 0 0 1 0 0 0 0 0 0 0 4 0 0 2 0 2 0 0 0 0 0 0 0 0 3 0 0 0 0 0 0 0 0 0 3 0 0 0 0 0 0 0 0 0 0 0 0 0 0 0 1 1 0 0 0 1 0 0 0 0 0 0 0 0 1 0 1 3 0 0 0 0 38 0 0 0 0 0 0 0 0 0 0 0 0 0 0 1 0 0 0 0 0 0 0 0 0 0 0 0 0 0 0 2 0 0 0 0 0 0 0 0 1 0 0 0 0 2 0 0 0 0 0 0 0 0 0 0 0 1 21 0 0 0 0 0 0 0 0 0 0 1 4 0 0 0 5 0 0 0 0 0 0 0 0 0 0 0 0 0 0 0 SP523 Bacteria;Proteobacteria;Gammaproteobacteria;Enterobacterales;Enterobacteriaceae;Enterobacter;cloacae 0 0 1 0 0 0 0 0 0 0 0 0 0 0 11068 0 0 0 0 0 0 0 0 0 0 0 0 0 0 0 0 0 0 0 0 0 0 0 0 0 0 0 0 0 0 0 0 0 0 0 0 0 0 0 0 0 0 0 0 0 0 0 0 0 0 0 0 0 0 0 0 0 0 0 0 0 0 0 0 0 0 0 0 0 0 0 0 0 0 0 0 0 0 0 0 0 0 0 0 0 0 0 0 0 0 0 0 0 0 0 0 0 0 0 0 0 0 0 0 0 0 0 0 0 0 0 0 0 0 0 0 0 0 0 0 0 0 0 0 0 1 0 0 0 0 0 0 0 0 0 0 0 0 0 0 0 0 0 0 0 0 0 0 0 0 0 0 0 0 1 0 0 0 0 0 0 0 0 0 0 0 0 0 0 0 0 0 0 0 0 0 0 0 0 0 0 0 0 0 0 0 0 0 0 0 0 0 0 0 0 0 0 0 0 0 0 0 0 0 0 0 0 0 0 0 0 0 0 0 0 0 0 0 0 0 0 0 0 0 0 0 0 0 0 0 0 0 0 0 0 0 0 0 0 0 0 0 0 0 0 0 0 0 0 0 0 0 0 0 0 0 0 0 0 0 0 0 0 0 0 0 0 0 0 0 0 0 0 0 0 0 0 0 0 0 0 0 0 0 0 0 0 0 0 0 0 0 0 0 0 0 0 0 0 0 0 0 0 0 0 0 0 0 0 0 0 0 0 0 0 0 0 0 0 0 0 0 0 0 0 0 0 0 0 0 0 0 0 0 0 0 0 0 0 0 0 0 0 0 0 0 0 0 0 0 0 0 0 0 0 0 0 0 0 0 0 0 0 0 0 0 0 0 0 0 0 0 0 0 0 0 0 0 0 0 0 0 0 0 0 0 0 0 0 0 0 0 0 0 0 0 0 0 0 0 0 0 0 0 0 0 0 0 0 0 0 0 0 0 0 0 0 0 0 0 0 0 0 0 0 0 0 0 0 0 0 0 0 0 0 0 0 0 0 0 0 0 0 0 0 0 0 0 0 0 0 0 0 0 0 0 0 0 0 0 0 0 0 0 0 0 0 0 0 0 0 0 0 0 0 0 0 0 0 0 0 0 0 0 0 0 0 0 0 0 0 0 0 0 0 0 0 0 0 0 0 0 0 0 0 0 0 0 0 0 0 0 0 0 0 0 0 0 0 0 0 0 0 0 0 0 0 0 0 0 0 0 0 0 0 0 0 0 0 0 0 0 0 0 0 0 0 0 0 0 0 0 0 0 0 0 0 0 0 0 0 0 0 0 0 0 0 0 0 0 0 0 0 0 0 0 0 0 0 0 0 0 0 0 0 0 0 0 0 0 0 0 0 0 0 0 0 0 0 0 0 0 0 0 0 0 0 0 0 0 0 0 0 0 0 0 0 0 0 0 0 0 0 0 0 0 0 0 0 0 0 0 0 0 0 0 0 0 0 0 0 0 0 0 0 0 0 0 0 0 0 0 0 0 0 0 0 0 0 0 0 0 0 0 0 0 0 0 0 0 0 0 0 0 0 0 0 0 0 0 0 0 0 0 0 0 0 0 0 0 0 0 0 0 0 0 0 0 0 0 0 0 0 0 0 0 0 0 0 0 0 0 0 0 0 0 0 0 0 0 0 0 0 0 0 0 0 0 0 0 0 0 0 0 0 0 0 0 0 0 0 0 0 0 0 0 0 0 0 0 0 0 0 0 0 0 0 0 0 0 0 0 0 0 0 0 0 0 0 0 0 0 0 0 0 0 0 0 0 0 0 0 0 0 0 0 0 0 0 0 0 0 0 0 0 0 0 0 0 0 0 0 0 0 0 0 0 0 0 0 0 0 0 0 0 0 0 0 0 0 0 0 0 0 0 0 0 0 0 0 0 0 0 0 0 0 0 0 0 0 0 0 0 0 0 0 0 0 0 0 0 0 0 0 0 0 0 0 0 0 0 0 0 0 0 0 0 0 0 0 0 0 0 0 0 0 0 0 0 0 0 0 0 0 0 0 0 0 0 0 0 0 0 0 0 0 0 0 0 0 0 0 0 0 0 0 0 0 0 0 0 0 0 0 0 0 0 0 0 0 0 0 0 0 0 0 0 0 0 0 0 0 0 0 0 0 0 0 0 0 0 0 0 0 0 0 0 0 0 0 0 0 0 0 0 0 0 0 0 0 0 0 0 0 0 0 0 0 0 0 0 0 0 0 0 0 0 0 0 0 0 0 0 0 0 0 0 0 0 0 0 0 0 0 0 0 0 0 0 0 0 0 0 0 0 0 0 0 0 0 0 0 0 0 0 0 0 0 0 0 0 0 0 0 0 0 0 0 0 0 0 0 0 0 0 0 0 0 0 0 0 0 0 0 0 0 0 0 0 0 0 0 0 0 0 0 0 0 0 0 0 0 0 0 0 0 0 0 0 0 0 0 0 0 0 0 0 0 0 0 0 0 0 0 0 0 0 0 0 0 0 0 0 0 0 0 0 0 0 0 0 0 0 0 0 0 0 0 0 0 0 0 0 0 0 0 0 0 0 0 0 0 0 0 0 0 0 0 0 0 0 0 0 0 0 0 0 0 0 0 0 0 0 0 0 0 0 0 0 0 0 0 0 0 0 0 0 0 0 0 0 0 0 0 0 0 0 0 0 0 0 0 0 0 0 0 0 0 0 0 0 0 0 0 0 0 0 0 0 0 0 0 0 0 0 0 0 0 0 0 0 0 0 0 0 0 0 0 0 0 0 0 0 0 0 0 0 0 0 0 0 0 0 0 0 0 0 0 0 0 0 0 0 0 0 0 0 0 0 0 0 0 0 0 0 0 0 0 0 0 0 0 0 0 0 0 0 0 0 0 0 0 0 0 0 0 0 0 0 0 0 0 0 0 0 0 0 0 0 0 0 0 0 0 0 0 0 0 0 0 0 0 0 0 0 0 0 0 0 0 0 0 0 0 0 0 0 0 0 0 0 0 0 0 0 0 0 0 0 0 0 0 0 0 0 0 0 0 0 0 0 0 0 0 0 0 0 0 0 0 0 0 0 0 0 0 0 0 0 0 0 0 0 0 0 0 0 0 0 0 0 0 0 0 0 0 0 0 0 0 0 0 0 0 0 0 0 0 0 0 0 0 0 0 0 0 0 0 0 0 0 0 0 0 0 0 0 0 0 0 0 0 0 0 0 0 0 0 0 0 0 0 0 0 0 0 0 0 0 0 0 0 0 0 0 0 0 0 0 0 0 0 0 0 0 0 0 0 0 0 0 0 0 0 0 0 0 0 0 0 0 0 0 0 0 0 0 0 0 0 0 0 0 0 0 0 0 0 0 0 0 0 0 0 0 0 0 0 0 0 0 0 0 0 0 0 0 0 0 0 0 0 0 0 0 0 0 0 0 0 0 0 0 0 0 0 0 0 0 0 0 0 0 0 0 0 0 0 0 0 0 0 0 0 0 0 0 0 0 0 0 0 0 0 0 0 0 0 0 0 0 0 0 0 0 0 0 0 0 0 0 0 0 0 0 0 0 0 0 0 0 0 0 0 0 0 0 0 0 0 0 0 0 0 0 0 0 0 0 0 0 0 0 0 0 0 0 0 0 0 0 0 0 0 0 0 0 0 0 0 0 0 0 0 0 0 0 0 0 0 0 0 0 0 0 0 0 0 0 0 0 0 0 0 0 0 0 0 0 0 0 0 0 0 0 0 0 0 0 0 0 0 0 0 0 0 0 0 0 0 0 0 0 0 0 0 0 0 0 0 0 0 0 0 0 0 0 0 0 0 0 0 0 0 0 0 0 0 0 0 0 0 0 0 0 0 0 0 0 0 0 0 0 0 0 0 0 0 0 0 0 0 0 0 0 0 0 0 0 0 0 0 0 0 0 0 0 0 0 0 0 0 0 0 0 0 0 0 0 0 0 0 0 0 0 0 0 0 0 0 0 0 0 0 0 0 0 0 0 0 0 0 0 0 0 0 0 0 0 0 0 0 0 0 0 0 0 0 0 0 0 0 0 0 0 0 0 0 0 0 0 0 0 0 0 0 0 0 0 0 0 0 0 0 0 0 0 0 0 0 0 0 0 0 0 0 0 0 0 SP526 Bacteria;Bacteroidetes;Flavobacteriia;Flavobacteriales;Flavobacteriaceae;Bergeyella;sp. HMT907 0 0 0 0 0 0 0 0 0 0 0 0 0 0 0 0 0 0 0 0 0 0 0 0 0 0 0 0 0 0 0 0 0 0 0 0 0 0 0 0 0 0 0 0 0 0 0 0 0 0 0 0 0 0 0 0 0 0 0 0 0 0 0 0 0 0 0 0 0 0 0 0 0 0 0 0 0 0 0 0 0 0 0 0 0 0 0 0 0 0 0 0 0 0 0 0 0 0 0 0 0 0 0 0 0 0 0 0 0 0 0 0 0 0 0 0 0 0 0 0 0 0 0 0 0 0 0 0 0 0 0 0 0 0 0 0 0 0 0 0 0 0 0 0 0 0 0 0 0 0 0 0 0 0 0 0 0 0 0 0 0 0 0 0 0 0 0 0 0 0 0 0 0 0 0 0 0 0 0 0 0 0 0 0 0 0 0 0 0 0 0 0 0 0 0 0 0 0 0 0 0 0 0 0 0 0 0 0 0 0 0 0 0 0 0 0 0 0 0 0 0 0 0 0 0 0 0 0 0 0 0 0 0 0 0 0 0 0 0 0 0 0 0 0 0 0 0 0 0 0 0 0 0 0 0 0 0 0 0 0 0 0 0 0 0 0 0 0 0 8 0 0 3 0 0 0 8 11 6 13 29 8 0 2 10 36 0 0 0 1 4 0 0 0 49 6 0 0 0 11 13 439 7 4 0 0 0 0 14 0 43 0 1 0 1 0 0 4 2 0 0 1 0 0 0 0 0 0 0 0 0 0 0 0 1 0 0 0 0 0 0 0 0 0 4 0 0 0 1 0 0 0 0 12 0 0 0 0 0 0 0 3 0 0 0 4 0 0 0 0 14 0 0 40 0 0 0 0 0 8 0 0 4 0 0 0 8 0 0 0 0 2 0 12 5 0 0 0 3 35 10 0 0 0 12 0 0 9 0 0 0 84 0 36 9 1 1 0 6 0 3 0 3 2 0 7 0 0 0 0 0 2 3 26 0 13 15 0 0 0 0 0 0 0 0 0 0 0 49 24 17 1 2 0 0 0 0 0 0 18 5 0 0 5 0 8 0 14 0 0 0 17 0 0 0 0 5 4 0 14 3 1 0 1 39 41 26 91 66 25 25 0 0 48 50 33 0 0 0 0 9 51 0 0 0 0 0 0 0 0 1 0 0 0 0 0 2 3 0 0 0 1 0 0 79 9 0 6 0 0 0 0 0 7 64 0 16 5 0 0 0 1 2 0 10 25 0 26 0 0 19 0 0 2 7 0 0 1 0 13 9 21 0 2 12 5 0 0 0 15 1 0 0 0 7 0 0 0 0 0 0 0 4 0 0 61 30 0 0 0 0 0 12 0 0 7 0 1 0 0 0 53 0 4 0 0 5 0 3 20 37 7 0 0 0 0 13 0 1 2 2 0 1 4 0 0 4 0 0 2 0 0 0 0 24 2 0 0 0 0 0 1 7 57 44 0 0 2 1 0 0 1 7 1 0 3 45 0 2 0 27 0 6 17 43 0 0 0 1 0 0 6 0 4 10 0 1 0 0 0 0 0 3 0 0 2 0 65 1 29 0 0 0 22 0 0 0 0 0 0 0 22 0 3 0 0 0 12 0 31 0 0 11 42 0 0 0 0 1 2 0 0 3 5 0 6 47 5 3 2 34 9 0 0 0 1 0 7 25 13 0 0 15 0 1 0 0 0 13 0 1 0 13 0 0 83 1 0 0 44 2 7 0 0 0 0 30 3 0 22 2 0 13 11 0 3 14 0 40 9 7 4 0 1 0 0 0 0 0 0 0 9 1 22 0 2 20 0 0 0 0 0 0 0 0 0 7 12 82 0 0 0 0 0 0 6 0 0 3 27 0 3 0 0 0 0 9 1 2 0 0 0 0 0 0 0 0 0 0 1 1 0 36 0 0 0 52 1 8 0 0 0 2 0 0 0 0 4 2 0 0 1 0 0 0 0 0 0 8 3 0 1 6 11 24 0 0 0 0 0 0 0 30 5 0 0 0 0 0 41 4 0 0 0 0 0 0 0 42 0 1 0 0 0 9 0 0 0 0 111 0 1 0 69 10 16 0 12 62 11 1 0 5 46 0 0 0 11 8 0 0 0 3 11 0 0 0 18 9 7 1 0 2 2 0 9 23 5 2 0 5 0 33 105 0 4 0 0 4 0 0 23 0 118 0 9 1 0 0 0 13 15 0 0 2 0 8 8 0 28 2 0 28 21 0 0 0 23 3 25 32 0 5 21 0 0 4 0 0 0 0 61 0 0 0 17 0 0 0 0 0 4 0 0 0 0 0 0 0 2 0 4 0 31 14 0 5 3 0 0 0 10 5 4 0 0 6 10 1 0 10 1 0 2 8 0 3 6 3 0 25 2 0 0 2 0 13 3 0 0 13 0 0 0 3 0 0 0 0 0 2 1 0 0 14 9 31 0 0 0 0 0 0 0 11 4 0 0 1 0 0 0 1 0 0 0 0 6 0 0 0 0 10 0 0 2 0 0 0 0 3 0 2 0 0 28 0 0 11 0 6 0 34 1 42 0 51 18 0 14 0 0 2 8 0 0 5 2 0 2 0 0 0 21 1 0 0 21 3 1 16 1 0 0 1 0 1 0 3 0 0 0 0 3 0 0 9 5 3 9 0 8 84 11 38 0 0 0 0 0 0 17 5 0 3 10 0 5 0 4 2 0 20 33 0 0 10 17 0 13 1 0 1 1 0 1 0 24 1 0 4 6 0 6 1 0 0 8 2 0 0 6 0 0 0 3 0 1 0 8 7 12 2 0 5 8 0 3 0 0 0 0 2 14 0 0 0 8 15 0 0 0 1 3 24 1 15 15 0 1 6 2 0 0 0 0 11 6 0 6 0 0 0 18 0 0 0 56 0 15 0 0 0 0 0 0 44 0 0 0 102 6 0 11 0 0 8 4 0 15 0 2 0 5 0 0 0 0 0 81 7 0 0 2 7 0 0 0 0 0 0 0 0 9 0 1 0 6 0 0 0 0 26 8 15 2 1 0 57 12 5 0 62 77 0 92 5 0 0 0 0 1 0 0 1 0 17 1 0 17 2 0 5 0 59 12 0 0 4 0 3 0 0 0 40 0 0 0 0 0 1 0 0 0 2 0 0 0 7 3 0 8 4 0 6 5 9 3 12 0 10 0 0 5 0 0 0 0 0 0 0 0 4 0 40 2 0 0 0 0 0 0 0 12 0 0 0 2 9 0 2 0 1 0 3 3 0 2 0 0 9 3 0 8 2 0 0 2 31 1 2 6 0 0 0 0 9 0 55 1 0 5 2 0 0 12 12 4 1 0 0 0 0 0 0 3 0 0 0 3 0 2 6 1 0 6 0 0 0 0 0 0 21 0 0 5 11 0 0 6 0 16 37 0 46 147 4 0 2 2 8 0 0 1 0 5 0 0 1 21 0 0 9 0 0 7 0 0 0 11 1 0 6 6 0 24 9 0 1 1 10 10 15 1 1 0 0 0 0 0 0 2 3 1 0 8 5 0 0 2 0 0 0 0 35 17 0 0 29 0 0 13 0 0 0 0 1 39 1 0 0 0 0 0 10 0 30 11 3 2 2 23 0 11 15 0 0 2 0 0 13 19 0 0 0 0 0 17 5 0 0 0 0 9 4 3 0 1 9 0 11 0 0 7 20 0 0 4 0 0 2 9 0 0 74 1 0 5 10 0 0 0 6 0 2 0 0 0 0 0 6 18 0 0 3 2 0 26 0 0 10 0 1 0 7 26 8 116 6 0 2 1 0 0 0 2 0 24 0 0 0 0 0 19 0 0 4 2 2 16 1 0 0 0 0 0 0 7 1 0 3 2 0 26 2 0 1 0 0 1 0 0 0 3 0 0 18 0 0 17 10 0 0 0 0 0 9 29 3 0 0 78 0 3 0 14 2 0 2 1 0 7 1 1 0 0 0 0 0 0 0 1 1 0 9 20 12 15 3 2 0 0 0 35 18 0 3 1 0 20 1 0 18 7 41 0 17 19 0 7 18 2 4 3 0 0 16 0 0 5 11 0 0 0 3 0 0 1 0 0 0 0 0 0 0 0 0 2 0 1 0 0 0 0 2 0 9 0 0 7 3 0 0 0 SP529 Bacteria;Actinobacteria;Actinomycetia;Corynebacteriales;Corynebacteriaceae;Corynebacterium;argentoratense 0 0 46 0 1 342 0 0 0 0 0 0 369 0 0 0 0 0 0 0 0 88 0 0 0 788 0 44 10 9 0 9 205 344 992 0 0 0 546 1 0 0 0 0 0 0 2 0 0 0 0 0 0 0 0 0 0 0 0 584 0 0 0 9 0 0 69 0 6 0 4 0 0 414 0 0 117 0 1 0 0 0 13 0 3634 754 538 0 0 0 1 1 37 7 0 151 0 0 0 27 0 0 3 0 0 0 0 0 0 0 0 35 0 537 102 0 0 0 159 0 0 0 0 2054 131 0 186 818 0 134 498 0 0 6 0 0 0 0 84 26 0 0 0 99 1 0 0 1 0 1 464 2120 151 0 0 0 0 0 143 0 18 109 0 0 1 0 5 1 0 602 0 1665 0 0 1 0 0 0 0 238 0 932 0 0 0 0 0 607 0 0 5 3 0 0 0 0 0 0 0 0 0 381 0 0 0 72 15 0 0 0 0 19 0 81 363 357 67 498 8 2020 0 0 0 1 0 1554 0 0 0 0 0 0 0 0 160 222 0 0 0 247 0 0 109 0 54 0 0 0 824 0 270 12 135 0 0 327 0 0 0 0 2145 0 0 0 0 0 739 1404 0 2 0 1 3 9 3 0 11 1 3 0 2 3 0 2 3 1 2 0 0 0 5 0 3 0 3 4 0 0 0 6 4 2 0 6 0 4 4 0 2 0 7 0 0 0 4 3 0 4 6 3 0 0 3 0 0 0 0 0 7 0 0 9 0 4 0 2 0 4 0 0 0 0 0 3 5 0 0 10 0 0 0 3 0 1 1 0 0 1 3 0 0 5 0 9 0 0 0 4 5 0 1 0 0 2 0 6 2 0 0 3 0 0 5 0 0 0 1 0 0 0 0 0 0 4 0 3 3 0 0 1 0 0 0 14 1 2 0 7 0 0 6 5 0 7 3 0 0 0 8 0 28 4 15 1 0 12 2 0 0 0 0 11 0 4 0 2 13 0 0 0 12 0 0 0 0 2 2 0 1 3 0 11 1 0 0 4 0 1 0 0 3 0 0 6 0 4 0 12 5 0 3 0 0 10 1 2 0 1 12 3 0 6 3 2 3 0 2 3 0 5 3 0 6 0 0 0 5 4 0 3 0 0 0 0 1 0 1 0 0 0 1 2 0 0 1 1 0 5 0 0 0 1 0 1 6 10 0 2 0 2 0 8 5 0 5 0 0 0 1 0 0 2 1 0 3 0 9 2 0 0 9 12 0 1 0 0 0 1 0 4 0 2 0 0 6 4 0 0 0 3 3 0 3 9 0 0 3 0 0 0 0 3 0 0 23 1 3 0 0 0 0 0 5 0 0 8 0 0 0 0 0 4 0 8 0 0 0 0 0 5 1 0 3 0 2 5 16 0 0 0 0 1 3 1 0 1 2 0 3 10 7 11 1 0 4 5 5 0 6 0 3 2 3 14 12 0 0 0 0 0 33 1 0 0 0 7 3 1 4 26 6 0 24 16 12 12 2 0 0 0 0 21 0 7 0 1 2 0 4 0 0 8 1 0 0 3 4 0 2 1 0 0 0 1 0 13 0 0 0 0 2 1 13 10 0 1 19 0 2 13 1 0 4 3 0 3 1 0 5 2 0 1 3 4 0 5 1 6 0 1 2 0 0 0 0 0 0 0 8 2 0 7 4 0 1 0 0 1 2 0 1 1 4 0 2 1 3 0 0 3 0 0 0 2 1 0 3 5 0 5 2 0 3 2 0 1 7 0 3 0 3 12 0 5 38 3 9 0 1 0 0 0 3 4 0 0 21 0 0 0 0 0 0 0 0 0 1 0 6 4 2 0 0 0 0 0 0 0 3 11 5 15 1 2 0 0 0 4 0 0 0 5 0 0 0 0 0 4 0 0 10 7 2 0 0 0 5 2 7 0 1 2 0 0 6 0 0 17 3 0 0 0 0 0 5 1 0 1 8 6 7 0 0 1 0 4 0 0 8 21 4 16 0 8 0 0 0 0 2 3 8 0 0 0 0 0 10 0 6 1 15 0 48 0 4 0 6 6 2 0 7 2 0 0 6 1 0 1 3 0 4 0 0 1 1 1 0 3 9 0 4 0 0 10 0 0 2 1 24 6 9 0 3 0 0 0 5 0 11 6 5 0 6 9 0 0 1 7 3 0 1 2 0 0 0 2 0 0 7 0 8 4 0 2 6 0 0 0 8 1 7 0 1 1 0 6 0 3 0 2 8 0 0 1 0 47 7 3 30 0 0 2 5 0 0 1 0 1 2 0 0 4 0 0 22 3 0 0 0 0 6 0 1 3 10 0 2 4 0 0 3 14 0 0 0 1 0 0 0 0 0 0 0 1 0 0 0 0 0 0 0 0 0 0 0 0 0 0 0 0 1 0 0 0 0 0 0 0 0 0 0 3 0 0 0 8 3 1 1 0 0 0 7 0 1 6 0 0 0 0 0 0 2 0 0 0 0 0 0 0 0 0 0 0 0 0 0 0 0 0 0 0 0 0 0 0 7 9 0 0 0 0 0 0 2 0 1 0 0 0 0 0 0 0 0 0 0 1 0 0 33 0 0 1 2 0 0 6 0 0 0 0 0 0 0 0 0 0 0 0 0 0 1 0 3 0 0 0 0 0 0 0 0 0 0 0 0 0 0 1 0 0 1 0 0 0 0 0 0 0 0 0 0 1 0 0 0 0 0 2 1 0 0 0 0 0 0 0 0 0 0 3 0 0 0 0 0 0 1 0 0 0 0 0 0 1 0 0 2 0 0 0 1 0 0 0 0 0 0 2 0 0 2 0 0 0 0 0 0 0 0 0 1 0 0 0 0 0 0 0 0 0 0 0 1 0 0 0 0 0 2 0 0 0 0 0 0 0 0 0 0 0 0 0 0 0 2 1 3 0 3 1 0 0 0 2 0 0 0 0 1 0 0 3 0 0 0 0 0 0 1 0 0 0 0 0 0 0 0 0 1 41 0 2 0 2 0 0 0 1 0 0 5 0 2 3 0 0 0 0 0 0 1 0 0 0 0 0 0 0 0 0 0 0 0 0 2 0 0 0 0 0 4 0 2 0 0 0 0 0 2 6 0 0 7 0 2 3 1 0 0 1 0 1 8 0 0 0 0 4 0 4 0 2 0 0 0 0 0 0 0 0 0 0 0 0 0 0 0 0 0 0 0 0 0 0 0 0 0 0 0 0 7 0 0 0 0 0 0 0 0 0 0 0 4 0 0 0 0 0 2 6 0 0 0 0 0 0 0 0 1 1 0 0 0 0 0 1 0 0 0 0 1 0 0 1 0 0 7 97 0 4 1 0 0 0 1 0 0 2 0 0 2 19 0 0 3 0 11 0 0 0 2 0 0 0 0 0 0 0 0 100 0 3 0 1 0 0 0 2 0 0 0 1 0 0 1 0 1 1 0 0 0 5 0 0 1 0 0 0 0 0 0 0 0 0 2 0 0 0 0 0 2 0 0 1 0 0 0 0 0 0 1 0 0 0 0 0 1 0 0 1 0 0 0 0 1 1 1 0 0 1 0 1 0 0 0 6 0 0 0 0 0 0 2 0 0 0 0 0 0 0 0 0 1 0 1 1 0 0 0 0 0 0 0 0 0 0 1 4 0 0 0 0 1 0 0 1 5 0 0 0 0 0 0 0 0 1 0 0 0 0 0 0 1 0 0 6 3 0 0 0 0 0 1 0 1 0 0 0 0 3 0 0 5 0 0 0 0 0 0 4 0 0 1 0 0 2 0 0 0 0 0 0 0 0 0 2 0 1 2 0 0 0 0 0 1 0 0 0 0 0 1 0 0 1 0 2 0 0 1 1 9 1 1 0 1 0 0 0 0 0 1 0 0 0 0 0 0 0 0 0 0 0 0 0 0 0 0 0 3 2 0 1 0 2 1 8 0 10 0 0 0 1 0 0 0 0 0 0 0 0 0 0 0 3 1 0 0 0 0 0 0 0 0 0 0 0 0 1 1 0 0 1 0 0 2 0 0 0 0 0 0 0 0 0 0 0 0 18 3 0 0 0 4 0 0 0 4 0 10 0 0 0 5 0 1 2 0 0 0 0 0 1 0 0 0 0 0 0 0 0 0 0 SP53 Bacteria;Fusobacteria;Fusobacteriia;Fusobacteriales;Leptotrichiaceae;Leptotrichia;buccalis 0 2 93 0 0 1 0 19 0 0 0 209 0 2 1 2 3 39 6 5 0 0 6 22 27 0 18 5 5 3 0 0 8 1 23 5 6 0 0 1 1 1 0 0 3 7 0 0 17 0 14 4 2 5 0 0 2 2 1 5 0 0 0 0 0 8 1 0 25 2 5 6 11 0 0 0 0 0 0 0 0 0 2 4 0 0 0 11 0 1 13 0 23 29 0 1 1 4 0 4 0 0 1 0 0 2 0 30 4 0 0 0 14 37 2 2 0 2 8 0 0 6 0 0 0 1 0 0 0 203 0 1 0 0 5 0 8 0 0 0 3 1 0 10 0 0 23 2 0 8 1 0 2 0 0 0 1 0 0 0 0 0 0 0 6 0 2 0 0 0 0 0 0 0 0 0 0 0 0 0 1 0 0 1 4 1 0 0 0 0 1 0 1 0 0 0 0 1 0 3 12 0 2 0 0 0 1 0 2 0 1 0 1 2 0 0 6 2 0 0 0 1 2 9 3 0 0 0 0 14 0 2 3 0 0 1 3 0 0 27 0 0 4 1 0 0 1 2 0 2 0 0 0 4 0 0 0 0 0 2 0 0 0 3 0 1 0 0 0 493 0 0 19 2 3 0 47 29 101 0 206 39 6 224 35 520 2 0 0 165 74 0 19 0 2298 87 18 287 0 199 22 0 231 29 4 1 51 0 57 0 44 3 0 1 3 2 91 0 4 0 1 3 162 0 0 0 6 0 0 0 0 153 0 0 0 0 0 0 0 0 0 0 0 14 7 0 0 3 1 0 1 1 1 5 0 0 0 14 0 0 0 1 0 53 0 0 0 4 71 0 7 0 67 73 0 0 0 0 0 1 0 0 282 4 0 0 3 17 0 0 0 3 0 1 1 17 22 0 1 5 59 0 0 8 0 0 0 182 7 0 2 552 0 15 1 0 18 0 3 0 4 0 0 0 0 3 0 0 0 0 0 15 33 329 0 36 391 0 1 2 42 0 0 3 1 1 0 0 85 95 1 0 25 76 2 4 0 13 0 586 46 82 0 1 0 17 0 25 1 1 1 54 19 2 11 0 181 7 41 78 11 0 1 37 655 20 146 220 0 204 14 0 0 203 101 1 1 0 0 33 23 2 0 0 37 0 0 6 0 0 3 1 0 1 0 3 3 9 0 0 0 29 5 0 135 23 0 0 0 128 0 89 179 0 61 0 2 1 0 1 0 155 100 0 0 0 16 3 7 6 530 3 0 0 1 0 0 0 0 125 2 5 69 243 43 104 0 0 0 73 0 0 0 5 73 1 99 0 0 0 0 23 40 0 0 14 74 0 1 3 3 0 0 2 10 60 0 3 0 1 0 1 1 1199 15 1 0 0 6 113 47 10 32 0 1 0 256 0 11 7 0 2 3 0 1 41 58 0 1 162 74 2 0 22 37 93 176 0 2 0 1 81 51 193 85 0 0 9 1 7 0 6 0 21 0 22 195 0 0 31 0 0 449 7 0 1 17 0 8 1 2 1116 0 893 0 6 72 43 32 0 0 51 35 0 0 81 42 0 2 87 23 0 0 0 4 8 0 0 0 32 10 0 16 64 1 0 34 0 1 0 5 0 4 0 0 2 0 1 7 23 0 6 0 96 0 10 327 90 10 8 117 0 0 3 84 1 8 155 324 40 5 257 598 5 34 0 0 30 120 0 115 0 55 0 6 1393 12 34 0 145 59 88 60 3 115 0 113 6 0 25 206 0 353 10 1 4 22 0 361 16 1 18 0 3 5 0 0 0 2 0 0 5 0 73 0 1 20 0 0 1 8 0 0 0 0 1 0 37 66 0 10 1 2 0 0 52 1 0 0 231 2 2 1 0 0 0 0 8 20 0 0 40 0 0 4 0 0 64 1 2 0 1 5 0 1 1 0 0 1 0 0 4 0 0 271 2 33 447 0 2 0 0 30 0 3 1 0 790 8 47 115 10 2 115 65 0 2024 10 311 0 10 1 0 138 2 0 4 11 233 52 38 0 0 0 0 0 1 0 18 1 24 0 79 0 18 0 0 16 52 8 54 12 0 103 208 15 0 33 218 7 3 70 0 1356 0 0 0 54 13 1 64 0 35 299 0 12 8 141 2 0 6 0 43 7 0 62 396 17 182 0 31 4 191 148 0 8 1 0 667 0 0 3 0 141 2 7 0 4 5 0 0 1 0 21 112 0 154 13 0 0 13 0 65 51 0 62 0 161 19 178 7 0 15 139 3 37 2 4 1 0 0 0 3 0 0 0 0 0 1 0 0 4 0 0 347 1 0 0 1 1 0 6 0 25 0 0 221 10 252 0 47 58 0 80 8 0 6 46 72 0 134 2 0 11 22 0 51 4 0 0 27 5 0 0 2 0 106 9 0 0 32 5 6 0 33 99 0 0 0 0 48 31 0 9 40 535 274 0 30 0 0 186 0 0 2 31 0 0 24 0 2 26 9 0 0 0 0 3 0 0 0 0 4 0 0 16 1 0 0 0 0 0 0 0 0 60 1 1 9 78 143 4 598 0 211 0 46 5 0 2 0 0 18 13 2 0 0 19 0 3 1 0 0 286 1 0 0 682 12 0 94 8 0 18 14 0 22 5 93 0 1 0 7 0 2 0 9 23 1 128 0 23 268 6 123 30 0 0 2 1 0 219 6 1 184 1 2 55 0 36 0 0 46 10 15 0 117 292 1 249 6 1 43 0 1 1 0 47 21 0 43 46 0 21 4 0 0 70 63 0 0 6 1 0 4 160 0 3 0 55 0 28 32 1 154 35 0 5 6 6 0 1 63 0 1 0 0 278 100 0 0 8 0 80 30 0 34 7 0 25 39 0 0 99 2 0 35 55 0 32 22 0 0 25 23 2 7 720 0 26 8 1 12 1 0 1 65 1 0 0 65 88 0 256 49 0 124 12 0 33 176 15 0 231 0 3 819 10 0 9 50 0 0 41 13 0 0 0 0 0 12 5 0 12 0 4 0 0 0 65 2 0 899 39 232 11 5 0 107 68 104 1 632 173 0 134 1 1 0 1 0 0 3 0 2 0 127 0 0 174 1 0 74 0 38 26 0 0 20 0 54 135 0 1 238 21 33 0 211 9 1 2 0 0 12 0 0 0 43 15 0 9 1 0 1 0 0 8 11 0 4 0 0 35 14 0 1 0 0 0 0 0 0 0 0 32 0 58 0 0 93 0 0 28 5 0 0 14 75 0 295 115 0 0 4 1 1 15 0 1 38 12 0 28 0 0 0 2 97 0 26 30 0 0 26 0 1 18 94 0 0 21 1130 8 0 23 22 6 0 2 0 77 0 11 0 46 4 1 3 8 0 21 10 22 0 1 1 0 0 512 0 0 4 2 2 10 76 1 59 4 0 28 890 0 154 377 35 0 0 8 48 2 3 1 0 36 10 0 0 99 1 0 4 7 0 1 21 0 0 4 1 0 34 31 0 364 169 0 21 2 131 27 128 0 33 0 0 0 17 5 0 71 7 53 0 68 71 0 66 7 17 11 0 0 84 130 2 0 67 0 0 71 0 2 11 0 0 161 78 0 9 0 0 7 86 0 81 34 1 0 5 59 0 4 163 0 46 18 0 0 34 33 0 0 0 42 0 98 14 0 13 1 0 82 10 1 0 3 22 0 44 6 0 7 23 0 0 4 21 0 0 25 0 42 436 3 0 290 160 0 0 66 37 0 17 23 0 12 46 0 13 11 0 0 1 0 0 152 0 0 24 1 2 0 253 57 0 362 53 2 0 44 0 0 0 0 0 78 4 0 33 8 0 7 0 0 2 8 8 104 0 0 15 0 92 1 1 0 32 0 17 1 0 0 9 1 0 0 0 0 3 16 1 36 7 1 96 40 1 18 378 1 0 1 0 0 14 40 38 8 0 310 113 187 1 162 1567 0 86 3 0 18 6 14 0 0 9 0 0 0 0 0 3 1 17 1 11 94 36 36 26 0 0 75 39 0 0 1 0 130 18 0 180 22 232 0 36 13 0 25 178 0 4 45 0 0 43 19 0 0 65 0 0 3 13 0 21 35 0 0 0 8 0 2 3 1 49 53 1 16 40 3 0 0 8 0 159 0 0 7 15 1 0 0 SP534 Bacteria;Firmicutes;Clostridia;Clostridiales;Ruminococcaceae;Ruminococcaceae_[G-2];bacterium HMT085 309 0 2 16 2 112 15 3 13 14 18 10 0 85 1 68 108 2 24 60 0 11 5 51 27 226 0 7 0 14 37 62 6 8 36 9 1 75 27 0 351 46 18 4 3 215 8 0 6 1 206 50 216 0 62 41 195 27 2 23 0 0 1 0 157 4 3 251 50 17 4 23 1 3 0 0 53 79 26 41 0 88 7 16 47 62 17 27 27 1106 1 13 6 19 48 215 0 1 10 13 11 87 0 3 14 13 81 8 112 0 3 8 9 13 229 0 51 66 89 213 23 14 17 39 35 95 143 14 229 77 34 0 23 8 286 11 884 42 55 13 6 2 0 2 0 57 21 87 197 0 279 47 20 1 294 54 267 46 3 70 3 2 42 4 33 18 110 239 12 9 0 19 8 30 55 366 38 36 7 11 8 4 31 143 8 28 28 94 343 198 131 5 124 123 321 0 0 11 7 54 1 56 324 22 23 108 5 1 14 0 78 2 17 25 39 21 9 35 0 24 34 181 13 7 0 1 62 19 0 205 54 5 20 1 14 61 58 710 64 10 21 19 263 4 5 7 66 7 218 0 526 1 1 62 6 23 0 102 3 232 10 0 11 66 6 7 11 97 0 15 0 0 0 0 0 0 0 0 0 0 3 1 0 0 1 0 0 0 0 0 3 0 0 0 0 5 0 4 0 1 0 0 11 3 0 0 0 0 0 0 5 0 0 0 0 0 0 0 0 0 0 0 0 0 0 0 0 0 0 0 0 0 0 0 0 0 0 0 0 0 0 0 0 0 0 0 0 0 0 0 0 0 0 0 0 0 0 0 0 0 0 0 0 0 0 0 0 0 0 0 0 0 0 2 0 0 0 0 0 3 0 0 0 0 0 0 0 0 0 0 0 0 0 0 0 0 0 0 0 1 0 0 2 0 0 0 0 0 0 0 0 3 0 0 0 0 0 0 0 0 0 0 0 0 0 2 0 0 0 0 0 0 1 0 0 0 0 2 0 0 6 1 0 0 0 0 0 0 20 0 5 0 0 0 0 0 0 0 1 0 9 0 0 1 0 0 0 0 0 0 8 0 0 0 0 0 0 0 0 1 0 0 0 0 12 7 15 1 0 16 0 0 0 20 13 0 0 0 0 2 4 0 0 0 0 0 0 0 0 0 4 19 0 0 0 0 2 0 0 0 0 0 0 0 0 0 0 0 0 0 0 1 1 1 0 0 0 0 0 1 0 1 4 3 0 0 1 1 0 0 0 0 0 0 0 0 0 0 0 89 0 0 1 2 8 6 0 0 0 0 0 0 0 0 0 0 0 0 0 0 0 0 0 0 0 0 0 0 0 0 0 0 4 0 0 0 0 1 0 0 0 0 0 0 0 0 0 0 0 2 0 0 0 1 0 0 0 0 0 0 0 0 0 0 0 2 26 0 0 0 0 0 0 1 0 0 0 0 0 2 0 0 0 0 0 0 0 0 0 0 0 0 0 0 0 0 0 0 0 0 0 0 0 0 0 0 0 0 0 0 0 0 0 0 0 0 0 0 0 0 0 0 0 0 0 0 0 0 0 1 0 1 0 1 0 0 0 0 0 0 0 0 0 0 0 0 0 0 0 0 0 0 23 0 0 0 0 0 0 0 0 0 0 0 0 0 0 0 0 0 4 3 0 0 0 1 0 0 3 0 0 1 13 0 0 0 0 0 0 0 2 0 0 0 0 0 0 0 1 40 5 0 1 0 1 0 0 0 0 0 0 0 0 0 0 0 0 0 0 5 0 0 0 0 0 0 0 0 0 0 0 0 0 0 0 0 0 0 0 0 0 0 0 0 0 0 0 0 0 0 0 0 0 0 1 1 0 0 0 0 0 1 0 1 0 0 0 0 3 0 9 0 0 0 0 0 3 1 0 1 7 0 0 0 0 0 0 0 0 0 0 5 0 0 0 0 0 0 0 0 0 0 0 0 1 0 0 22 0 0 0 2 0 0 0 0 5 0 0 3 0 0 0 0 0 0 0 0 0 0 0 0 0 0 0 0 0 0 0 1 0 0 1 0 0 0 0 0 74 18 0 3 0 7 0 0 0 0 0 0 0 0 0 0 0 0 0 0 0 0 0 0 0 0 0 0 0 0 0 0 0 0 5 0 0 2 2 1 0 0 0 0 3 3 0 0 0 0 0 0 0 2 0 1 0 0 0 0 0 0 0 0 0 0 0 0 0 0 0 0 0 1 0 0 0 0 0 3 0 0 0 0 0 1 0 0 21 0 0 1 3 0 0 2 5 0 0 0 0 0 0 1 0 0 2 1 0 0 0 0 0 0 0 0 1 0 0 15 4 0 0 6 1 6 3 5 0 1 0 0 1 0 0 15 0 0 0 0 0 0 0 1 0 0 0 0 0 20 0 0 0 0 0 0 0 17 0 2 0 0 1 0 1 1 0 0 1 1 34 0 0 0 0 0 0 1 0 1 0 0 0 1 0 0 0 0 0 0 23 1 0 0 0 1 1 0 0 0 1 0 0 2 0 0 0 0 0 5 0 2 3 0 22 0 0 8 3 0 0 0 0 0 0 0 1 0 5 0 0 0 10 0 0 0 1 0 0 0 0 2 5 0 0 27 19 6 0 0 0 0 3 0 2 1 3 0 2 0 0 0 0 4 0 0 0 0 0 0 0 1 0 0 0 0 2 0 1 0 0 0 3 0 0 5 0 1 1 2 4 2 16 0 0 0 0 0 0 1 1 0 9 0 2 0 0 0 0 0 12 1 2 5 0 1 0 0 10 2 0 4 1 1 1 0 4 5 0 0 0 2 0 0 0 0 0 0 1 2 0 13 0 0 2 1 3 0 1 0 0 6 0 1 0 0 0 0 4 2 0 0 0 0 0 0 22 0 0 0 3 0 0 4 1 0 10 1 1 0 0 0 2 3 3 8 1 2 1 1 0 0 0 2 2 0 0 1 1 4 1 0 0 0 0 23 0 0 2 1 0 0 0 1 0 3 0 0 0 2 0 3 0 0 0 1 0 0 0 1 1 4 5 0 1 2 1 1 1 0 0 0 0 1 0 0 2 0 1 0 0 0 0 2 0 0 1 1 5 0 0 0 0 0 0 1 0 2 0 1 0 18 0 1 2 0 2 0 1 0 0 0 0 2 0 0 0 0 0 0 0 1 10 0 9 0 0 0 0 0 1 0 0 0 4 7 0 0 4 2 0 0 5 0 0 1 0 0 2 20 0 0 5 0 0 42 0 16 2 10 0 0 1 2 1 0 1 0 0 2 1 0 0 2 0 0 1 1 0 2 10 0 0 2 0 0 0 2 0 1 4 1 0 2 1 0 7 0 0 0 0 0 0 0 0 0 0 0 0 0 10 6 0 1 2 0 8 0 0 9 4 2 3 1 0 0 5 0 1 6 0 1 1 4 0 0 0 20 4 0 3 0 0 0 0 1 0 0 1 3 0 4 0 0 0 1 0 0 14 0 0 2 6 0 11 3 1 0 19 0 7 0 0 13 1 0 0 0 1 0 2 3 0 0 2 0 0 0 1 0 15 0 0 1 0 0 0 0 1 0 0 0 1 0 1 1 2 1 0 0 0 0 0 2 0 2 3 5 0 0 0 10 2 7 3 0 0 1 0 0 0 0 0 0 0 5 0 2 1 0 2 0 0 1 0 1 1 1 0 1 0 0 0 4 0 0 14 2 1 6 7 1 1 0 3 2 0 0 3 5 1 0 7 1 0 5 0 0 0 16 6 0 0 1 0 2 3 5 0 0 1 1 0 0 3 0 0 0 0 0 1 0 5 0 1 2 4 2 0 0 0 1 1 2 0 1 0 4 3 2 1 0 0 0 1 0 0 0 0 0 0 0 3 1 3 0 2 0 0 0 2 0 12 9 2 0 0 0 0 1 1 11 0 0 3 0 0 0 0 12 3 9 0 3 0 0 1 1 0 0 0 0 6 0 0 1 0 6 0 3 0 0 1 0 0 3 4 0 0 0 0 0 0 0 1 0 20 0 1 0 0 0 6 1 0 0 0 0 0 4 0 0 0 0 15 1 1 0 0 10 0 0 0 2 0 0 2 4 3 3 4 0 0 0 0 1 0 0 0 0 0 2 0 0 0 0 SP537 Bacteria;Actinobacteria;Actinomycetia;Actinomycetales;Actinomycetaceae;Actinomyces;gerencseriae 6 42 0 14 3 44 0 2 1008 55 0 0 222 14 25 5 0 0 0 0 6 13 0 48 6 64 98 0 144 27 2 11 0 0 0 12 0 44 0 0 0 0 0 6 2 0 0 29 0 0 2 1 44 27 6 0 9 4 0 0 0 136 0 45 3 2 0 6 30 1 5 11 0 0 7 8 0 3 0 86 8 0 5 0 0 0 0 36 0 8 8 3 0 0 3 3 0 7 22 2 2 8 171 366 7 27 0 3 0 0 24 24 7 7 3 0 0 0 0 0 0 16 3 9 1 4 3 0 2 0 0 0 4 44 5 1 0 5 12 0 0 0 43 14 23 0 14 2 0 18 0 0 0 6 8 9 0 15 13 3 16 5 1 40 5 0 8 5 0 1 0 10 5 42 11 12 0 0 17 0 0 0 62 11 0 7 1 6 0 0 0 2 0 7 2 0 1 0 0 0 21 2 0 3 0 0 0 6 7 9 8 0 3 7 27 2 4 9 0 4 1 15 19 151 0 0 0 2 16 19 4 0 27 23 1 0 8 5 1 101 0 0 0 0 3 0 4 0 0 0 0 17 4 1 8 0 41 88 0 0 46 2 42 7 0 11 0 26 0 0 0 0 0 31 11 0 2086 47 35 0 87 125 0 0 0 311 0 4 0 32 0 0 0 0 1 0 70 0 0 183 143 0 4 0 0 2 2 0 0 0 0 0 0 0 0 0 0 6 21 0 0 0 0 0 0 0 0 0 0 0 2 33 0 0 0 0 0 0 0 0 0 0 0 7 9 500 0 0 0 0 0 0 0 4 0 0 0 0 0 0 0 0 0 2 0 0 0 0 0 0 0 0 0 293 0 0 0 0 0 0 0 0 9 0 0 0 0 3 0 0 0 0 0 2 0 5 0 0 0 111 0 0 0 13 90 0 0 16 0 0 1 21 0 54 1 0 0 0 0 0 305 4 27 1420 0 11 2 0 0 0 0 0 185 6 0 2 8 0 0 0 0 0 1 0 0 120 124 0 0 110 1 7 0 0 0 1 0 157 0 1 0 0 0 0 0 11 0 206 0 0 1 0 0 0 0 0 20 40 0 57 16 9 102 6 1 0 17 63 0 1 0 0 5 0 0 0 32 0 0 2 3 0 0 0 0 0 1 0 40 0 91 0 0 2 0 0 0 22 0 0 0 1 0 0 0 52 0 0 0 0 1 0 0 0 69 0 0 0 0 326 0 6 0 0 0 0 1 2 0 0 0 0 1 0 29 0 0 0 0 79 0 141 0 58 80 0 0 0 0 0 0 0 0 0 0 0 352 0 2 0 0 1 0 0 0 0 0 1 0 2 1295 0 181 0 0 39 0 105 0 0 0 1 0 0 0 0 0 5 5 25 0 60 531 0 0 0 0 0 11 25 0 4 1 0 0 0 0 0 3 0 0 0 0 0 0 0 126 0 0 0 0 0 18 13 4 0 0 33 30 0 326 57 0 0 0 85 0 0 0 403 1 0 95 557 0 0 0 0 0 0 0 0 0 0 0 4 1 0 0 0 0 32 1224 0 0 0 0 0 0 1 0 0 7 62 0 19 0 11 0 0 0 0 3 22 0 0 0 0 96 21 552 0 28 0 0 0 0 0 7 0 0 0 1 1 0 0 0 0 63 34 37 92 0 17 0 258 20 45 20 0 0 0 0 0 0 0 0 0 1 0 0 0 3 0 0 0 1 0 0 3 0 344 0 0 0 0 0 2 0 471 1 0 34 3 0 55 2 0 6 7 1 0 0 0 0 0 0 0 0 0 0 0 0 0 0 0 0 0 0 2 0 0 0 794 0 0 0 0 57 0 0 0 0 0 0 0 0 2 707 3 558 97 0 0 0 3 0 1 0 0 0 0 0 0 0 0 0 1 1 1 0 104 52 0 6 131 0 10 0 0 0 13 0 0 41 125 0 193 45 0 0 0 0 0 0 0 0 3 7 0 1 46 0 0 94 0 0 0 0 0 0 0 0 1 0 0 0 1 7 0 18 1 0 0 0 0 105 0 45 0 0 0 0 0 0 0 0 0 0 0 0 0 0 0 2 0 0 0 0 0 31 10 0 0 7 0 0 0 0 0 0 0 202 98 0 0 30 2 18 9 4 0 0 0 0 453 2 0 0 11 0 0 0 0 0 5 0 0 0 0 12 2 0 207 0 18 0 0 0 0 19 4 0 2 8 0 5 6 0 40 32 0 1 0 0 0 0 0 0 1 0 0 30 17 0 0 0 151 0 0 0 0 0 0 4 25 0 0 0 0 0 0 0 0 0 0 0 0 0 0 9 63 0 0 1 0 2 6 1 0 0 0 0 0 0 0 4 0 0 0 0 0 0 0 0 0 0 0 3 0 2 0 0 3 6 0 0 0 0 0 0 0 0 0 7 0 0 0 0 0 4 18 0 0 0 5 0 0 0 0 0 0 0 0 0 2 0 0 0 0 0 10 0 0 0 0 0 0 0 0 0 0 0 0 0 0 0 0 0 0 3 0 0 0 0 0 0 0 0 0 0 0 1 1 0 0 14 0 0 0 0 0 16 0 0 0 0 3 0 3 0 0 0 0 0 0 0 0 0 0 2 0 0 1 0 0 5 0 1 0 0 0 0 0 0 0 0 0 0 0 0 0 0 0 0 0 0 0 0 0 0 0 0 0 0 0 0 14 0 13 15 0 1 45 5 0 0 0 0 0 1 0 16 11 0 0 0 0 5 0 2 2 0 2 0 0 0 0 0 0 0 0 0 0 0 0 0 0 4 1 0 2 4 0 0 1 0 0 0 2 0 6 0 0 0 0 0 0 0 0 0 1 0 3 14 0 1 0 0 0 0 0 0 0 0 0 1 0 0 0 0 0 1 0 1 0 0 0 0 2 0 0 0 0 3 0 241 15 0 0 0 2 0 9 0 0 0 0 0 6 0 4 0 0 0 0 0 0 0 0 0 0 0 0 0 0 0 0 0 0 0 0 0 0 0 2 0 0 0 0 0 0 0 0 0 81 0 0 16 0 2 0 7 0 0 0 0 0 0 2 0 0 9 0 0 0 0 0 0 0 0 0 0 0 1 7 0 4 0 0 0 0 0 0 13 0 0 0 0 0 0 0 0 0 8 1 0 0 0 0 0 0 0 0 0 3 0 43 0 0 0 0 0 30 1 0 1 0 0 0 0 0 0 0 4 0 0 0 0 0 0 0 0 5 0 0 0 0 0 0 3 0 0 0 2 0 0 0 0 0 2 0 0 8 0 0 0 0 8 0 1 0 0 6 0 0 1 0 0 0 0 4 6 16 0 6 4 0 0 0 0 9 7 0 0 0 0 0 1 0 0 3 17 0 0 0 0 0 1 19 0 0 39 0 0 0 1 0 1 0 0 0 1 0 0 0 0 0 0 4 8 0 0 0 0 1 0 0 0 1 1 0 1 0 0 27 2 0 0 13 0 0 3 0 0 0 0 0 0 0 2 0 3 0 0 0 0 0 0 0 0 24 0 8 0 0 0 0 0 0 6 0 0 0 8 1 0 0 0 0 0 0 0 0 0 0 11 23 10 0 0 0 0 3 0 0 19 0 8 0 1 0 0 9 14 0 0 0 0 0 0 0 0 0 0 0 0 0 0 0 6 0 0 0 21 0 0 0 1 0 0 0 0 5 5 0 0 0 0 0 0 0 0 12 0 0 0 0 0 0 0 0 0 0 0 0 0 0 0 0 0 0 1 0 0 0 0 0 0 0 0 0 0 0 38 0 0 1 6 0 0 15 0 0 3 0 0 6 0 0 0 0 0 0 0 0 1 0 0 0 0 1 6 0 0 0 0 0 0 0 0 0 0 35 1 0 0 0 0 0 10 2 0 0 0 0 0 0 0 0 34 0 0 26 32 0 70 0 0 0 0 2 0 0 0 0 0 0 0 0 0 0 0 0 3 0 0 0 0 0 0 2 0 0 0 0 0 1 0 0 0 0 0 2 0 0 4 4 0 0 0 0 0 11 0 0 0 0 0 1 0 0 0 0 0 0 0 0 0 3 2 0 0 0 0 0 0 0 0 0 0 0 0 0 0 0 0 0 0 0 1 0 0 0 0 0 0 0 0 0 0 0 0 0 SP539 Bacteria;Firmicutes;Bacilli;Lactobacillales;Streptococcaceae;Streptococcus;cristatus 2 9 7 0 0 0 0 0 3 1 9 142 0 0 0 12 1 0 1 0 0 0 3 5 6 0 12 0 0 0 17 28 219 1 2 0 1 5 0 1 0 1 109 0 0 0 0 0 71 35 13 0 2 4 6 0 5 0 413 17 0 13 0 0 2 0 0 1 6 1611 3 0 58 0 1 88 112 255 0 1 3 0 1 27 2 6 1 9 8 1 0 1 1 2 0 0 2 8 0 2 6 2 1 0 0 0 2 18 39 0 3 0 50 35 0 0 0 0 2 540 1 6 0 290 0 0 0 1 0 9 524 6 7 0 0 3 0 1 1 0 0 2 3360 9 712 233 0 0 0 0 0 0 7 4 1 4 0 120 1 0 11 11 8 8 23 0 8 205 16 4 1 1 9 26 4 5 30 19 0 3 2 0 32 0 2 3 19 0 23 0 8 11 124 12 1 2 0 7 1 3 2 0 16 0 2 0 0 0 10 0 1 3 0 32 1 0 0 16 0 143 10 6 0 0 0 0 0 0 10 0 2 7 15 57 1 1 0 3 0 1 0 242 0 1 0 0 28 233 7 0 0 1 0 12 1 0 6 88 1 0 12 0 1 133 2 1 0 1 0 0 0 0 0 0 0 0 0 0 0 0 0 0 0 0 0 0 0 0 0 0 0 0 0 0 0 0 0 0 0 0 0 0 0 0 0 0 0 0 0 0 0 0 0 0 0 0 0 0 0 0 0 0 0 0 0 0 0 0 0 0 0 0 0 0 0 0 0 0 0 0 0 0 0 0 0 0 0 0 0 0 0 0 0 0 0 0 0 0 0 0 0 0 0 0 0 0 0 0 0 0 0 0 0 0 0 0 0 0 0 0 0 0 0 0 0 0 0 0 0 0 0 0 0 0 0 0 0 0 0 0 0 0 0 0 0 0 0 0 0 0 0 0 0 0 0 0 0 0 0 0 0 0 0 0 0 0 0 0 0 0 0 0 0 0 0 0 0 0 0 0 0 0 0 0 0 0 0 0 0 0 0 0 0 0 0 0 0 0 0 0 0 0 0 0 0 0 0 0 0 0 0 0 0 0 0 0 0 0 0 0 0 0 0 0 0 0 0 0 0 0 0 0 0 0 0 0 0 0 0 0 0 0 0 0 0 0 0 0 0 0 0 0 0 0 0 0 0 0 0 0 0 0 0 0 0 0 0 0 0 0 0 0 0 0 0 0 0 0 0 0 0 0 0 0 0 0 0 0 0 0 0 0 0 0 0 0 0 0 0 0 0 0 0 0 0 0 0 0 0 0 0 0 0 0 0 0 0 0 0 0 0 0 0 0 0 0 0 0 0 0 0 0 0 0 0 0 0 0 0 0 0 0 0 0 0 0 0 0 0 0 0 0 0 0 0 0 0 0 0 0 0 0 0 0 0 0 0 0 0 0 0 0 0 0 0 0 0 0 0 0 0 0 0 0 0 0 0 0 0 0 0 0 0 0 0 0 0 0 0 0 0 0 0 0 0 0 0 0 0 0 0 0 0 0 0 0 0 0 0 0 0 0 0 0 0 0 0 0 0 0 0 0 0 0 0 0 0 0 0 0 0 0 0 0 0 0 0 0 0 0 0 0 0 0 0 0 0 0 0 0 0 0 0 0 0 0 0 0 0 0 0 0 0 0 0 0 0 0 0 0 0 0 0 0 0 0 0 0 0 0 0 0 0 0 0 0 0 0 0 0 0 0 0 0 0 0 0 0 0 0 0 0 0 0 0 0 0 0 0 0 0 0 0 0 0 0 0 0 0 0 0 0 0 0 0 0 0 0 0 0 0 0 0 0 0 0 0 0 0 0 0 0 0 0 0 0 0 0 0 0 0 0 0 0 0 0 0 0 0 0 0 0 0 0 0 0 0 0 0 0 0 0 0 0 0 0 0 0 0 0 0 0 0 0 0 0 0 0 0 0 0 0 0 0 0 0 0 0 0 0 0 0 0 0 0 0 0 0 0 0 0 0 0 0 0 0 0 0 0 0 0 0 0 0 0 0 0 0 0 0 0 0 0 0 0 0 0 0 0 0 0 0 0 0 0 0 0 0 0 0 0 0 0 0 0 0 0 0 0 0 0 0 0 0 0 0 0 0 0 0 0 0 0 0 0 0 0 0 0 0 0 0 0 0 0 0 0 0 0 0 0 0 0 0 0 0 0 0 0 0 0 0 0 0 0 0 0 0 0 0 0 0 0 0 0 0 0 0 0 0 0 0 0 0 0 0 0 0 0 0 0 0 0 0 0 0 0 0 0 0 0 0 0 0 0 0 0 0 0 0 0 0 0 0 0 0 0 0 0 0 0 0 0 0 0 0 0 0 0 0 0 0 0 0 0 0 0 0 0 0 0 0 0 0 0 0 0 0 0 0 0 0 0 0 0 0 0 0 0 0 0 0 0 0 0 0 0 0 0 0 0 0 0 0 0 0 0 0 0 0 0 0 0 0 0 0 0 0 0 0 0 0 0 0 0 0 0 0 0 0 0 0 0 0 0 0 0 0 0 0 0 0 0 0 0 0 0 0 0 0 0 0 0 0 0 0 0 0 0 0 0 0 0 0 0 0 0 0 0 0 0 0 0 0 0 0 0 0 0 0 0 0 0 0 0 0 0 0 0 0 0 0 0 0 0 0 0 0 0 0 0 0 0 0 0 0 0 0 0 0 0 0 0 0 0 0 0 0 0 0 0 0 0 0 0 0 0 0 0 0 0 0 0 0 0 0 0 0 0 0 0 0 0 0 0 0 0 0 0 0 0 0 0 0 0 0 0 0 0 0 0 0 0 0 0 0 0 0 0 0 0 0 0 0 0 0 0 0 0 0 0 0 0 0 0 0 0 0 0 0 0 0 0 0 0 0 0 0 0 0 0 0 0 0 0 0 0 0 0 0 0 0 0 0 0 0 0 0 0 0 0 0 0 0 0 0 0 0 0 0 0 0 0 0 0 0 0 0 0 0 0 0 0 0 0 0 0 0 0 0 0 0 0 0 0 0 0 0 0 0 0 0 0 0 0 0 0 0 0 0 0 0 0 0 0 0 0 0 0 0 0 0 0 0 0 0 0 0 0 0 0 0 0 0 0 0 0 0 0 0 0 0 0 0 0 0 0 0 0 0 0 0 0 0 0 0 0 0 0 0 0 0 0 0 0 0 0 0 0 0 0 0 0 0 0 0 0 0 0 0 0 0 0 0 0 0 0 0 0 0 0 0 0 0 0 0 0 0 0 0 0 0 0 0 0 0 0 0 0 0 0 0 0 0 0 0 0 0 0 0 0 0 0 0 0 0 0 0 0 0 0 0 0 0 0 0 0 0 0 0 0 0 0 0 0 0 0 0 0 0 0 0 0 0 0 0 0 0 0 0 0 0 0 0 0 0 0 0 0 0 0 0 0 0 0 0 0 0 0 0 0 0 0 0 0 0 0 0 0 0 0 0 0 0 0 0 0 0 0 0 0 0 0 0 0 0 0 0 0 0 0 0 0 0 0 0 0 0 0 0 0 0 0 0 0 0 0 0 0 0 0 0 0 0 0 0 0 0 0 0 0 0 0 0 0 0 0 0 0 0 0 0 0 0 0 0 0 0 0 0 0 0 0 0 0 0 0 0 0 0 0 0 0 0 0 0 0 0 0 0 0 0 0 0 0 0 0 0 0 0 0 0 0 0 0 0 0 0 0 0 0 0 0 0 0 0 0 0 0 0 0 0 0 0 0 0 0 0 0 0 0 0 0 0 0 0 0 0 0 0 0 0 0 0 0 0 0 0 0 0 0 0 0 0 0 0 0 0 0 0 0 0 0 0 0 0 0 0 0 0 0 0 0 0 0 0 0 0 0 0 0 0 0 0 0 0 0 0 0 0 0 0 0 0 0 0 0 0 0 0 0 0 0 0 0 0 0 0 0 0 0 0 0 0 0 0 0 0 0 0 0 0 0 0 0 0 0 0 0 0 0 0 0 0 0 0 0 0 0 0 0 0 0 0 0 0 0 0 0 0 0 0 0 0 0 0 0 0 0 0 0 0 0 0 0 0 0 0 0 0 0 0 0 0 0 0 0 0 0 0 0 0 0 0 0 0 0 0 0 0 0 0 0 0 SP54 Bacteria;Actinobacteria;Actinobacteria;Actinomycetales;Actinomycetaceae;Schaalia;odontolyticus 681 757 17 1627 193 1022 27 110 24 223 3954 102 3434 461 365 177 439 163 309 737 10863 1347 1138 1108 1581 1355 38 416 295 33 1583 2001 88 483 967 2403 720 279 474 154 2112 809 339 76 812 641 284 654 86 343 367 5040 3129 29 1431 1295 2753 303 36 701 1165 103 626 5 1281 260 219 456 1495 500 3662 2122 468 6600 431 1794 353 1381 596 792 586 1344 460 188 3352 4321 5212 1146 604 3252 74 328 66 76 1185 67 11 312 4 1935 150 2405 248 526 347 1221 443 45 1223 9 648 158 423 684 489 136 259 2787 605 172 1159 24 1218 356 836 6013 818 1938 617 273 2377 1336 375 883 1151 276 4059 476 259 303 248 17 48 117 91 3868 799 1227 1590 72 551 779 74 1109 5638 203 1498 340 515 1495 168 40 242 27 176 553 399 670 3 251 12 1700 3 370 1298 2874 1219 965 158 288 16 1176 595 1380 230 36 761 3424 838 2321 2530 1697 1588 1491 456 422 1549 1392 319 1531 127 2630 622 112 599 200 60 10 163 25 47 194 655 229 202 1315 91 846 39 910 8 753 391 316 621 1630 55 417 96 126 182 24 1190 486 22 886 813 980 399 185 177 1547 213 6 85 848 994 0 7 491 575 502 778 1775 647 290 3257 522 1459 773 2518 2598 1512 0 957 3468 1151 6301 0 0 0 0 0 0 0 0 0 0 0 0 0 0 0 0 0 0 0 0 0 0 0 0 0 0 0 0 0 0 0 0 0 0 0 0 0 0 0 0 0 0 0 0 0 0 0 0 0 0 0 0 0 0 0 0 0 0 0 0 0 0 0 0 0 0 0 0 0 0 0 0 0 0 0 0 0 0 0 0 0 0 0 0 0 0 0 0 0 0 0 0 0 0 0 0 0 0 0 0 0 0 0 0 0 0 0 0 0 0 0 0 0 0 0 0 0 0 0 0 0 0 0 0 0 0 0 0 0 0 0 0 0 0 0 0 0 0 0 0 0 0 0 0 0 0 0 0 0 0 0 0 0 0 0 0 0 0 0 0 0 0 0 0 0 0 0 0 0 0 0 0 0 0 0 0 0 0 0 0 0 0 0 0 0 0 0 0 0 0 0 0 0 0 0 0 0 0 0 0 0 0 0 0 0 0 0 0 0 0 0 0 0 0 0 0 0 0 0 0 0 0 0 0 0 0 0 0 0 0 0 0 0 0 0 0 0 0 0 0 0 0 0 0 0 0 0 0 0 0 0 0 0 0 0 0 0 0 0 0 0 0 0 0 0 0 0 0 0 0 0 0 0 0 0 0 0 0 0 0 0 0 0 0 0 0 0 0 0 0 0 0 0 0 0 0 0 0 0 0 0 0 0 0 0 0 0 0 0 0 0 0 0 0 0 0 0 0 0 0 0 0 0 0 0 0 0 0 0 0 0 0 0 0 0 0 0 0 0 0 0 0 0 0 0 0 0 0 0 0 0 0 0 0 0 0 0 0 0 0 0 0 0 0 0 0 0 0 0 0 0 0 0 0 0 0 0 0 0 0 0 0 0 0 0 0 0 0 0 0 0 0 0 0 0 0 0 0 0 0 0 0 0 0 0 0 0 0 0 0 0 0 0 0 0 0 0 0 0 0 0 0 0 0 0 0 0 0 0 0 0 0 0 0 0 0 0 0 0 0 0 0 0 0 0 0 0 0 0 0 0 0 0 0 0 0 0 0 0 0 0 0 0 0 0 0 0 0 0 0 0 0 0 0 0 0 0 0 0 0 0 0 0 0 0 0 0 0 0 0 0 0 0 0 0 0 0 0 0 0 0 0 0 0 0 0 0 0 0 0 0 0 0 0 0 0 0 0 0 0 0 0 0 0 0 0 0 0 0 0 0 0 0 0 0 0 0 0 0 0 0 0 0 0 0 0 0 0 0 0 0 0 0 0 0 0 0 0 0 0 0 0 0 0 0 0 0 0 0 0 0 0 0 0 0 0 0 0 0 0 0 0 0 0 0 0 0 0 0 0 0 0 0 0 0 0 0 0 0 0 0 0 0 0 0 0 0 0 0 0 0 0 0 0 0 0 0 0 0 0 0 0 0 0 0 0 0 0 0 0 0 0 0 0 0 0 0 0 0 0 0 0 0 0 0 0 0 0 0 0 0 0 0 0 0 0 0 0 0 0 0 0 0 0 0 0 0 0 0 0 0 0 0 0 0 0 0 0 0 0 0 0 0 0 0 0 0 0 0 0 0 0 0 0 0 0 0 0 0 0 0 0 0 0 0 0 0 0 0 0 0 0 0 0 0 0 0 0 0 0 0 0 0 0 0 0 0 0 0 0 0 0 0 0 0 0 0 0 0 0 0 0 0 0 0 0 0 0 0 0 0 0 0 0 0 0 0 0 0 0 0 0 0 0 0 0 0 0 0 0 0 0 0 0 0 0 0 0 0 0 0 0 0 0 0 0 0 0 0 0 0 0 0 0 0 0 0 0 0 0 0 0 0 0 0 0 0 0 0 0 0 0 0 0 0 0 0 0 0 0 0 0 0 0 0 0 0 0 0 0 0 0 0 0 0 0 0 0 0 0 0 0 0 0 0 0 0 0 0 0 0 0 0 0 0 0 0 0 0 0 0 0 0 0 0 0 0 0 0 0 0 0 0 0 0 0 0 0 0 0 0 0 0 0 0 0 0 0 0 0 0 0 0 0 0 0 0 0 0 0 0 0 0 0 0 0 0 0 0 0 0 0 0 0 0 0 0 0 0 0 0 0 0 0 0 0 0 0 0 0 0 0 0 0 0 0 0 0 0 0 0 0 0 0 0 0 0 0 0 0 0 0 0 0 0 0 0 0 0 0 0 0 0 0 0 0 0 0 0 0 0 0 0 0 0 0 0 0 0 0 0 0 0 0 0 0 0 0 0 0 0 0 0 0 0 0 0 0 0 0 0 0 0 0 0 0 0 0 0 0 0 0 0 0 0 0 0 0 0 0 0 0 0 0 0 0 0 0 0 0 0 0 0 0 0 0 0 0 0 0 0 0 0 0 0 0 0 0 0 0 0 0 0 0 0 0 0 0 0 0 0 0 0 0 0 0 0 0 0 0 0 0 0 0 0 0 0 0 0 0 0 0 0 0 0 0 0 0 0 0 0 0 0 0 0 0 0 0 0 0 0 0 0 0 0 0 0 0 0 0 0 0 0 0 0 0 0 0 0 0 0 0 0 0 0 0 0 0 0 0 0 0 0 0 0 0 0 0 0 0 0 0 0 0 0 0 0 0 0 0 0 0 0 0 0 0 0 0 0 0 0 0 0 0 0 0 0 0 0 0 0 0 0 0 0 0 0 0 0 0 0 0 0 0 0 0 0 0 0 0 0 0 0 0 0 0 0 0 0 0 0 0 0 0 0 0 0 0 0 0 0 0 0 0 0 0 0 0 0 0 0 0 0 0 0 0 0 0 0 0 0 0 0 0 0 0 0 0 0 0 0 0 0 0 0 0 0 0 0 0 0 0 0 0 0 0 0 0 0 0 0 0 0 0 0 0 0 0 0 0 0 0 0 0 0 0 0 0 0 0 0 0 0 0 0 0 0 0 0 0 0 0 0 0 0 0 0 0 0 0 0 0 0 0 0 0 0 0 0 0 0 0 0 0 0 0 0 0 0 0 0 0 0 0 0 0 0 0 0 0 0 0 0 0 0 0 0 0 0 0 0 0 0 0 0 0 0 0 0 0 0 0 0 0 0 0 0 0 0 0 0 0 0 0 0 0 0 0 0 0 0 0 0 0 0 0 0 0 0 0 0 0 0 0 0 0 0 0 0 0 0 0 0 0 0 0 0 0 0 0 0 0 0 0 0 0 0 0 0 0 0 0 0 0 0 0 0 0 0 0 0 0 0 0 0 0 0 0 0 0 0 0 0 0 0 0 0 0 0 0 0 0 0 0 0 0 0 0 0 0 0 0 0 0 0 0 0 0 0 0 0 0 0 0 0 0 0 0 0 0 0 0 0 0 0 0 0 0 0 0 0 0 0 0 0 0 0 0 0 0 0 0 0 0 0 0 0 0 0 0 0 0 0 0 0 0 0 0 0 0 0 0 0 0 0 0 0 0 0 0 0 0 0 0 0 0 0 0 0 0 0 0 0 0 0 0 0 0 0 0 0 0 0 0 0 0 0 0 0 0 0 0 0 0 0 0 SP543 Bacteria;Bacteroidetes;Bacteroidia;Bacteroidales;Prevotellaceae;Prevotella;sp. HMT942 0 1 0 0 0 0 0 0 0 0 0 0 0 0 0 0 1 0 0 0 0 0 0 0 0 0 0 0 0 0 4 0 4 0 2 0 0 0 0 0 0 0 0 0 0 0 0 0 0 0 0 0 0 0 0 0 0 3 0 0 0 0 0 0 0 0 0 1 0 0 12 1 2 0 0 2 5 0 0 0 0 0 0 4 0 1 0 1 0 0 0 0 0 0 0 0 0 0 0 0 0 0 2 0 0 0 0 0 1 0 0 0 0 0 5 12 0 0 0 0 0 0 0 0 0 0 0 1 0 0 0 0 0 0 1 0 0 0 0 0 19 0 0 0 0 0 0 0 0 0 0 0 0 0 0 0 0 0 0 0 0 2 0 0 0 0 0 0 0 0 0 0 1 0 0 0 0 0 1 0 0 0 0 1 1 0 0 0 0 0 0 0 21 0 0 0 0 0 0 0 0 0 0 0 0 0 1 0 0 0 0 0 0 0 0 0 0 0 0 0 0 0 1 0 0 0 0 0 0 0 0 0 0 0 0 0 0 0 0 0 0 0 0 0 0 0 0 0 0 0 0 0 0 0 0 0 0 0 0 0 0 0 0 0 0 0 0 0 0 0 7 0 5 0 0 14 6 10 0 0 0 0 0 3 10 1 4 0 0 0 2 0 0 0 0 0 0 3 0 0 1 13 6 13 4 0 0 0 0 0 0 0 0 0 2 0 1 1 0 0 0 0 0 0 1 0 0 0 1 0 0 0 19 0 2 1 0 3 1 0 2 12 0 0 0 31 10 0 0 1 0 1 1 0 0 4 22 6 0 0 0 0 0 0 0 13 1 0 1 0 0 0 8 4 39 20 3 62 0 90 0 0 0 0 0 0 9 13 0 0 0 1 0 0 4 0 2 0 0 0 0 0 0 0 0 0 0 0 9 0 0 2 0 0 0 0 0 0 6 0 0 9 5 1 0 11 0 0 6 0 23 1 14 1 0 0 0 7 3 0 0 0 0 0 3 0 0 0 0 35 1 0 15 27 0 0 0 0 3 0 0 0 8 7 1 0 0 1 4 0 0 0 1 0 0 1 0 0 1 0 0 0 0 0 162 0 0 1 0 0 0 0 0 2 0 15 0 0 2 0 0 1 0 0 1 16 0 1 0 0 2 0 0 1 133 3 0 1 0 0 97 3 2 2 0 0 0 0 6 0 0 1 2 0 0 0 7 0 0 15 3 0 0 14 0 3 5 2 0 8 5 0 4 0 13 0 20 7 1 1 0 0 6 0 0 6 0 0 0 0 0 0 0 1 0 0 0 0 2 0 14 0 0 3 1 0 0 9 0 0 0 6 0 0 0 1 50 5 0 0 0 0 6 0 3 3 0 0 0 2 1 0 0 4 0 0 0 0 0 4 0 0 11 0 0 13 0 1 0 0 0 0 6 7 2 3 0 0 0 0 1 6 5 0 0 2 0 0 3 4 0 11 5 11 5 4 26 8 2 0 0 0 0 0 24 1 0 0 0 4 0 0 0 2 5 0 5 3 0 0 16 46 32 1 4 0 0 14 0 7 0 3 19 14 15 0 0 0 0 0 50 0 0 7 4 0 0 0 0 0 16 1 1 0 0 0 1 1 0 0 0 0 0 0 1 8 0 8 3 0 0 0 0 0 4 5 15 0 0 1 0 1 13 0 0 0 0 1 1 0 5 0 0 0 0 0 2 8 5 0 22 21 4 0 1 0 0 0 3 0 3 2 0 1 0 0 0 0 0 0 0 1 0 0 0 0 3 0 0 10 0 11 0 2 3 0 2 0 0 0 0 0 1 0 0 0 0 7 0 0 10 0 15 12 0 10 0 0 0 3 0 1 0 0 0 0 15 0 0 0 0 9 2 0 0 0 3 0 0 0 1 0 5 4 0 0 22 0 7 3 1 0 0 0 8 8 0 3 1 0 0 0 0 0 0 0 0 12 21 2 1 0 12 0 15 0 0 0 0 0 0 9 9 0 0 0 30 1 7 1 1 0 0 0 1 15 0 25 0 2 1 1 0 0 0 0 7 0 1 7 1 2 0 0 0 2 0 0 0 6 0 0 21 11 0 0 2 0 0 0 1 0 0 0 0 6 23 10 0 0 0 0 0 0 1 0 0 23 0 0 0 0 2 8 1 0 0 0 0 0 0 0 0 0 0 0 1 0 0 0 0 0 0 0 9 0 0 11 0 0 0 3 0 0 10 0 0 0 10 0 0 0 0 0 0 0 5 1 0 0 0 0 13 14 0 0 0 0 2 0 0 5 0 0 9 180 0 0 1 0 0 0 0 0 0 0 5 18 12 21 0 1 14 1 237 112 0 0 0 0 0 1 1 1 0 4 0 0 2 65 0 1 0 0 2 0 92 4 0 2 0 1 0 0 0 0 0 8 5 0 0 0 183 185 0 0 14 196 2 0 2 12 13 0 66 43 43 226 0 0 0 207 0 7 0 2 0 0 0 0 0 0 0 5 3 0 23 1 0 1 0 0 0 0 0 1 0 3 0 2 0 1 0 0 2 0 0 0 1 0 5 7 42 9 2 0 5 49 0 5 0 119 0 1 24 2 5 0 1 0 11 2 4 19 32 187 0 12 0 1 14 0 10 28 3 26 42 53 30 15 5 0 0 0 0 0 26 0 0 1 0 0 0 0 0 0 1 0 0 0 0 2 1 0 6 0 0 22 0 13 23 0 0 0 566 0 0 0 13 0 0 3 12 0 31 1114 12 2 43 45 1 0 0 0 0 0 0 0 5 0 0 0 0 2 7 67 4 88 5 7 7 1 2 56 0 0 0 2 0 10 0 0 4 2 0 12 0 0 0 2 0 68 0 1 0 3 5 1 207 0 64 8 0 0 755 0 0 0 0 0 2 71 1 80 78 23 4 39 7 0 0 19 4 5 17 4 25 60 7 0 0 0 4 10 18 144 1 16 2 0 106 15 8 0 0 0 0 32 1 2 0 2 0 230 5 0 0 83 9 0 4 28 0 0 5 1 0 0 0 0 78 65 0 0 4 0 3 64 0 0 0 10 5 81 2 120 0 0 20 4 13 0 0 0 1 31 0 2 14 1 3 18 3 1 0 24 3 0 4 2 0 27 1 0 0 0 3 133 2 0 3 0 5 6 16 2 9 19 2 6 0 2 0 3 1 1 2 0 0 39 2 0 27 61 0 0 1 0 0 2 0 3 18 0 0 0 13 0 4 1 0 1 11 0 17 12 27 89 1 0 25 61 17 0 0 0 3 1 5 2 4 2 0 2 69 2 0 2 0 3 57 0 0 0 1 1 14 2 8 5 0 0 0 0 9 2 0 0 0 28 92 0 35 23 0 0 41 9 0 0 6 11 0 0 4 2 7 9 2 85 2 0 2 5 38 0 0 0 1 19 91 33 0 0 5 0 3 6 1 0 75 50 0 3 0 4 44 12 24 12 13 0 1 0 1 1 0 0 5 15 0 18 2 110 0 3 99 8 0 26 3 13 9 90 44 0 0 40 0 6 0 0 26 1 0 188 348 1 3 0 0 0 0 1 8 0 4 0 10 10 59 1 139 137 227 0 3 4 10 0 0 0 3 0 0 123 0 0 0 15 16 16 196 23 0 11 1 2 0 19 1 202 89 22 0 22 0 1 0 0 0 0 0 0 6 10 0 4 1 0 0 3 3 0 0 0 550 1 46 61 0 0 33 43 0 0 0 1 4 0 1 0 0 0 0 0 5 0 286 0 1 24 1 26 1 0 193 0 13 76 0 54 10 0 0 13 0 0 0 0 0 30 3 5 6 0 0 0 0 43 61 0 0 0 0 0 2 6 20 1 6 0 64 0 2 0 1 10 20 108 0 0 8 1 0 204 0 0 31 0 0 0 9 0 0 5 0 0 17 2 0 0 2 2 0 0 0 0 0 12 105 0 2 0 0 0 25 0 0 0 63 0 2 0 0 0 10 10 0 21 35 0 0 13 33 0 78 20 0 0 0 2 0 0 0 114 0 0 1 0 2 3 0 1 5 6 4 78 11 11 0 2 0 5 476 384 7 102 0 0 0 9 0 0 52 16 1 3 0 26 0 22 0 0 0 40 0 68 23 19 55 0 0 1 SP55 Bacteria;Proteobacteria;Gammaproteobacteria;Pasteurellales;Pasteurellaceae;Haemophilus;sp. HMT036 0 10 24 0 0 74 0 4 8 134 0 148 33 1 1 4 48 0 0 0 2 0 20 194 0 0 5 5 47 153 0 0 1 0 2 5 5 4 2 430 0 11 1 8 19 22 2171 0 289 52 10 0 0 3 4 0 1 30 52 0 3 50 0 0 0 742 60 0 124 6 0 1 0 7 2 0 2 1 32 0 8 2 5 7 0 4 0 6 3 0 0 0 80 1 0 0 641 0 8 0 0 3 0 8 9 22 0 65 0 10 173 1 0 1 8 88 1 0 0 0 0 1 0 10 0 1 0 0 0 0 5 0 0 107 5 127 0 3 0 0 37 0 2 19 21 0 3 3 1 0 0 0 0 1 0 0 0 3 0 0 0 148 0 58 0 0 0 0 4 0 0 0 8 8 0 0 0 0 0 29 16 4 1 0 1 0 0 0 2 17 2 0 2 1 0 22 2 2 11 4 4 7 0 0 0 0 21 0 2 0 0 0 0 4 2 0 215 1 24 0 25 4 3 0 1 0 0 2 3 0 0 0 1 14 0 0 0 7 2 0 1 0 0 41 0 0 0 0 0 0 0 0 0 0 0 0 0 0 0 0 19 0 0 0 3 0 0 0 0 0 0 0 0 0 0 0 0 0 0 0 0 0 0 0 0 0 0 0 0 0 0 0 0 0 0 0 0 0 0 0 0 0 0 0 0 0 0 0 0 0 0 0 0 0 0 0 0 0 0 0 0 0 0 0 0 0 0 0 0 0 0 0 0 0 0 0 0 0 0 0 0 0 0 0 0 0 0 0 0 0 0 0 0 0 0 0 0 0 0 0 0 0 0 0 0 0 0 0 0 0 0 0 0 0 0 0 0 0 0 0 0 0 0 0 0 0 0 0 0 0 0 0 0 0 0 0 0 0 0 0 0 0 0 0 0 0 0 0 0 0 0 0 0 0 0 0 0 0 0 0 0 0 0 0 0 0 0 0 0 0 0 0 0 0 0 0 0 0 0 0 0 0 0 0 0 0 0 0 0 0 0 0 0 0 0 0 0 0 0 0 0 0 0 0 0 0 0 0 0 0 0 0 0 0 0 0 0 0 0 0 0 0 0 0 0 0 0 0 0 0 0 0 0 0 0 0 0 0 0 0 0 0 0 0 0 0 0 0 0 0 0 0 0 0 0 0 0 0 0 0 0 0 0 0 0 0 0 0 0 0 0 0 0 0 0 0 0 0 0 0 0 0 0 0 0 0 0 0 0 0 0 0 0 0 0 0 0 0 0 0 0 0 0 0 0 0 0 0 0 0 0 0 0 0 0 0 0 0 0 0 0 0 0 0 0 0 0 0 0 0 0 0 0 0 0 0 0 0 0 0 0 0 0 0 0 0 0 0 0 0 0 0 0 0 0 0 0 0 0 0 0 0 0 0 0 0 0 0 0 0 0 0 0 0 0 0 0 0 0 0 0 0 0 0 0 0 0 0 0 0 0 0 0 0 0 0 0 0 0 0 0 0 0 0 0 0 0 0 0 0 0 0 0 0 0 0 0 0 0 0 0 0 0 0 0 0 0 0 0 0 0 0 0 0 0 0 0 0 0 0 0 0 0 0 0 0 0 0 0 0 0 0 0 0 0 0 0 0 0 0 0 0 0 0 0 0 0 0 0 0 0 0 0 0 0 0 0 0 0 0 0 0 0 0 0 0 0 0 0 0 0 0 0 0 0 0 0 0 0 0 0 0 0 0 0 0 0 0 0 0 0 0 0 0 0 0 0 0 0 0 0 0 0 0 0 0 0 0 0 0 0 0 0 0 0 0 0 0 0 0 0 0 0 0 0 0 0 0 0 0 0 0 0 0 0 0 0 0 0 0 0 0 0 0 0 0 0 0 0 0 0 0 0 0 0 0 0 0 0 0 0 0 0 0 0 0 0 0 0 0 0 0 0 0 0 0 0 0 0 0 0 0 0 0 0 0 0 0 0 0 0 0 0 0 0 0 0 0 0 0 0 0 0 0 0 0 0 0 0 0 0 0 0 0 0 0 0 0 0 0 0 0 0 0 0 0 0 0 0 0 0 0 0 0 0 0 0 0 0 0 0 0 0 0 0 0 0 0 0 0 0 0 0 0 0 0 0 0 0 0 0 0 0 0 0 0 0 0 0 0 0 0 0 0 0 0 0 0 0 0 0 0 0 0 0 0 0 0 0 0 0 0 0 0 0 0 0 0 0 0 0 0 0 0 0 0 0 0 0 0 0 0 0 0 0 0 0 0 0 0 0 0 0 0 0 0 0 0 0 0 0 0 0 0 0 0 0 0 0 0 0 0 0 0 0 0 0 0 0 0 0 0 0 0 0 0 0 0 0 0 0 0 0 0 0 0 0 0 0 0 0 0 0 0 0 0 0 0 0 0 0 0 0 0 0 0 0 0 0 0 0 0 0 0 0 0 0 0 0 0 0 0 0 0 0 0 0 0 0 0 0 0 0 0 0 0 0 0 0 0 0 0 0 0 0 0 0 0 0 0 0 0 0 0 0 0 0 0 0 0 0 0 0 0 0 0 0 0 0 0 0 0 0 0 0 0 0 0 0 0 0 0 0 0 0 0 0 0 0 0 0 0 0 0 0 0 0 0 0 0 0 0 0 0 0 0 0 0 0 0 0 0 0 0 0 0 0 0 0 0 0 0 0 0 0 0 0 0 0 0 0 0 0 0 0 0 0 0 0 0 0 0 0 0 0 0 0 0 0 0 0 0 0 0 0 0 0 0 0 0 0 0 0 0 0 0 0 0 0 0 0 0 0 0 0 0 0 0 0 0 0 0 0 0 0 0 0 0 0 0 0 0 0 0 0 0 0 0 0 0 0 0 0 0 0 0 0 0 0 0 0 0 0 0 0 0 0 0 0 0 0 0 0 0 0 0 0 0 0 0 0 0 0 0 0 0 0 0 0 0 0 0 0 0 0 0 0 0 0 0 0 0 0 0 0 0 0 0 0 0 0 0 0 0 0 0 0 0 0 0 0 0 0 0 0 0 0 0 0 0 0 0 0 0 0 0 0 0 0 0 0 0 0 0 0 0 0 0 0 0 0 0 0 0 0 0 0 0 0 0 0 0 0 0 0 0 0 0 0 0 0 0 0 0 0 0 0 0 0 0 0 0 0 0 0 0 0 0 0 0 0 0 0 0 0 0 0 0 0 0 0 0 0 0 0 0 0 0 0 0 0 0 0 0 0 0 0 0 0 0 0 0 0 0 0 0 0 0 0 0 0 0 0 0 0 0 0 0 0 0 0 0 0 0 0 0 0 0 0 0 0 0 0 0 0 0 0 0 0 0 0 0 0 0 0 0 0 0 0 0 0 0 0 0 0 0 0 0 0 0 0 0 0 0 0 0 0 0 0 0 0 0 0 0 0 0 0 0 0 0 0 0 0 0 0 0 0 0 0 0 0 0 0 0 0 0 0 0 0 0 0 0 0 0 0 0 0 0 0 0 0 0 0 0 0 0 0 0 0 0 0 0 0 0 0 0 0 0 0 0 0 0 0 0 0 0 0 0 0 0 0 0 0 0 0 0 0 0 0 0 0 0 0 0 0 0 0 0 0 0 0 0 0 0 0 0 0 0 0 0 0 0 0 0 0 0 0 0 0 0 0 0 0 0 0 0 0 0 0 0 0 0 0 0 0 0 0 0 0 0 0 0 0 0 0 0 0 0 0 0 0 0 0 0 0 0 0 0 0 0 0 0 0 0 0 0 0 0 0 0 0 0 0 0 0 0 0 0 0 0 0 0 0 0 0 0 0 0 0 0 0 0 0 0 0 0 0 0 0 0 0 0 0 0 0 0 0 0 0 0 0 0 0 0 0 0 0 0 0 0 0 0 0 0 0 0 0 0 0 0 0 0 0 0 0 0 0 0 0 0 0 0 0 0 0 0 0 0 0 0 0 0 0 0 0 0 0 0 0 0 0 0 0 0 0 0 0 0 0 0 0 0 0 0 0 0 0 0 0 0 0 0 0 0 0 0 0 0 0 0 0 0 0 0 0 0 0 0 0 0 0 0 0 0 0 0 0 0 0 0 0 0 0 0 0 0 0 0 0 0 0 0 0 0 0 0 0 0 0 0 0 0 0 0 SP56 Bacteria;Saccharibacteria_(TM7);Saccharibacteria_(TM7)_[C-1];Saccharibacteria_(TM7)_[O-1];Saccharibacteria_(TM7)_[F-1];Saccharibacteria_(TM7)_[G-1];bacterium HMT352 1587 0 21 470 41 529 0 0 7 57 956 125 30 103 8 183 335 16 278 88 1168 11 309 26 385 1031 4 334 10 4 205 484 25 147 57 163 1250 323 496 1 113 177 65 278 105 710 10 0 0 276 105 737 828 2 231 317 428 374 3 151 79 0 179 3 721 17 2 1357 230 724 0 378 151 1595 2 199 356 325 0 468 0 999 116 88 160 477 257 1692 79 1628 2 19 6 14 4 2637 0 12 1 1270 145 453 2 266 69 101 824 15 1343 33 3 118 78 36 691 140 220 266 819 260 89 121 87 326 216 145 550 228 0 2 378 399 124 44 938 642 3144 694 939 293 30 5 3 0 6 1478 210 252 635 12 843 156 112 543 3440 267 494 399 45 327 32 14 1122 5 71 815 43 607 136 149 0 1 1030 113 320 492 118 153 11 4 0 0 486 211 774 296 956 1037 161 459 344 439 403 700 913 93 0 280 123 15 0 100 1387 301 0 716 5 0 20 0 58 0 171 78 35 666 10 555 5 68 79 8 67 23 289 9 248 156 0 604 960 25 1142 2 72 578 62 188 129 79 25 331 269 0 17 74 1889 15 1034 0 169 21 172 1830 0 9 3069 773 33 717 318 8 595 59 6 248 451 403 0 0 0 0 0 0 0 0 0 0 2 0 0 0 0 0 0 0 0 0 0 0 10 0 0 0 0 0 0 0 0 0 0 1 1 0 0 0 0 0 0 0 0 0 0 0 0 0 0 0 0 0 0 0 0 0 0 0 0 0 0 0 0 0 0 0 0 0 0 1 0 0 0 0 0 0 0 0 0 0 0 0 0 0 0 0 0 0 0 0 0 0 0 0 0 0 0 0 0 1 0 0 0 0 0 0 0 0 0 0 0 0 0 0 0 0 0 0 0 0 0 0 0 0 0 0 0 0 0 0 0 0 0 0 0 0 0 0 0 0 0 0 0 4 1 0 0 0 0 0 0 2 0 0 0 0 0 0 0 0 0 0 0 1 0 0 0 0 0 5 0 0 0 0 0 0 2 0 0 0 0 0 0 0 1 0 0 0 0 0 0 0 0 0 0 5 0 0 0 0 0 0 0 1 1 0 0 0 0 0 0 0 0 0 0 0 0 3 0 0 0 0 0 0 0 0 0 0 0 0 0 0 8 0 0 0 0 0 0 0 0 0 0 44 0 0 0 0 0 0 0 0 0 0 0 0 0 0 0 0 0 1 0 0 0 0 0 0 0 0 0 0 0 0 0 1 0 0 0 0 0 0 1 0 0 0 0 0 0 1 0 5 0 0 1 0 0 0 0 1 0 0 0 0 0 1 0 0 0 0 0 0 0 0 0 0 0 0 0 0 0 0 0 0 0 0 0 0 0 0 0 0 0 0 0 0 0 0 0 0 0 0 0 1 0 1 0 0 0 0 0 0 0 0 0 0 0 0 0 0 0 0 0 0 0 0 0 2 69 0 0 0 0 4 0 7 1 0 0 1 0 0 0 0 0 0 0 0 2 0 0 0 0 0 0 0 0 0 0 0 0 0 0 0 1 1 0 0 4 0 0 3 0 0 0 3 0 0 0 0 0 0 0 2 0 0 0 0 0 0 0 0 0 0 0 0 0 0 2 0 0 0 1 0 2 0 0 0 0 0 0 0 0 0 0 0 0 0 0 2 0 0 0 0 0 0 0 0 0 0 0 0 0 0 2 0 0 0 0 1 2 0 5 0 1 0 0 1 1 0 0 3 0 0 0 0 0 0 0 0 0 1 0 0 0 1 0 0 0 0 0 0 0 0 0 0 0 0 0 0 0 0 2 0 0 1 0 0 9 0 1 0 0 0 1 0 1 0 0 0 0 0 0 0 0 1 0 0 0 0 0 0 0 0 0 0 0 0 0 0 0 0 4 0 0 0 0 0 0 0 0 0 4 0 0 0 0 0 0 0 0 1 0 1 0 0 0 0 0 0 0 0 0 0 0 13 1 3 0 0 1 0 0 0 0 0 0 0 0 2 14 1 0 2 1 0 0 0 0 0 0 0 0 0 0 0 0 0 0 0 0 0 0 0 4 0 0 0 0 0 0 0 0 0 0 0 0 0 0 0 0 0 0 0 0 14 0 0 0 2 0 0 0 0 0 2 0 1 0 1 0 0 0 0 0 0 0 0 1 0 0 0 0 0 10 4 0 0 0 0 0 0 0 0 0 0 0 0 0 0 0 1 0 0 0 0 0 0 0 0 0 0 0 0 0 0 0 1 0 0 0 0 0 0 0 0 0 5 0 0 0 0 0 0 0 0 0 0 0 0 0 0 0 0 0 0 20 0 0 0 0 1 0 0 0 1 0 0 3 2 0 0 4 0 3 0 0 4 0 0 1 0 2 0 6 2 0 0 3 3 6 0 1 1 0 0 0 4 4 2 0 1 0 0 0 0 0 2 1 0 0 0 2 0 0 0 0 0 0 1 7 0 0 0 7 0 0 1 1 0 0 0 0 2 0 0 0 0 0 0 114 0 2 0 0 0 0 0 0 0 0 0 2 4 1 9 0 0 3 0 0 0 0 0 2 0 0 68 0 1 0 0 0 12 1 0 0 2 4 0 0 0 0 0 1 0 2 4 0 0 0 9 1 0 0 15 35 17 0 0 0 0 12 4 4 0 0 0 0 44 3 5 2 0 0 4 0 0 5 2 0 0 14 3 3 3 1 0 2 3 1 0 0 0 4 0 1 0 0 2 3 2 3 0 0 0 0 1 0 6 1 0 1 2 0 0 0 0 3 0 0 0 9 0 0 12 11 0 25 0 0 1 2 0 0 0 1 3 0 0 0 1 0 0 6 0 0 0 1 0 1 33 0 2 0 0 1 1 6 0 2 0 0 4 0 0 1 1 5 1 0 3 5 6 0 0 1 0 0 0 0 2 0 3 0 0 6 2 2 3 9 1 0 0 0 1 1 12 0 0 0 2 0 8 10 2 1 1 1 0 0 0 1 0 0 0 0 0 9 0 0 26 0 0 0 1 0 0 0 0 2 41 12 1 0 6 1 0 0 0 0 0 7 0 1 0 0 1 1 1 0 0 1 0 2 1 2 5 1 0 2 0 0 5 0 0 1 0 28 0 0 0 0 1 5 2 0 0 0 0 0 10 0 6 0 0 2 0 0 0 0 0 0 1 0 0 0 0 0 1 0 0 0 0 2 0 0 0 1 0 0 0 0 0 0 0 0 0 1 0 0 0 2 0 0 1 0 0 19 84 1 0 0 1 0 146 4 1 1 0 0 20 1 15 1 0 0 0 6 3 1 0 1 0 0 0 0 15 1 3 0 0 1 0 0 3 25 1 0 9 15 1 0 1 0 0 24 0 0 7 0 1 0 0 0 1 0 1 0 1 2 0 0 8 1 0 0 0 1 0 4 0 2 2 1 1 0 0 0 21 0 0 2 0 0 0 2 0 0 0 5 2 0 0 0 0 0 0 25 0 0 2 0 0 0 0 0 9 16 0 6 25 3 2 3 2 0 3 13 0 4 0 0 0 4 1 6 5 1 3 0 1 0 0 0 1 0 1 2 0 11 11 1 2 1 3 3 1 1 1 0 0 1 2 5 20 0 4 0 0 0 0 0 0 0 0 0 8 0 0 0 69 0 0 0 1 0 0 0 0 0 0 2 0 0 18 0 1 0 1 0 0 2 6 8 0 0 0 0 0 0 5 0 3 0 1 1 1 1 2 2 2 9 0 3 0 3 3 3 0 6 0 3 1 2 3 0 0 0 0 2 1 0 18 0 0 1 2 0 7 4 0 0 0 2 0 0 0 0 0 0 0 5 1 1 0 0 0 2 0 1 0 0 3 0 3 2 0 13 1 0 0 0 0 1 1 1 0 0 0 0 2 0 0 2 0 0 0 0 0 0 0 1 1 1 0 0 0 4 0 1 22 0 1 1 2 68 1 29 2 13 66 11 0 0 0 0 0 5 10 3 0 0 0 0 44 0 0 0 1 0 1 0 0 0 0 1 1 0 0 0 0 1 0 1 0 0 3 0 1 0 1 0 0 0 0 0 0 1 0 0 0 0 0 68 1 0 0 0 2 0 0 0 1 0 1 1 3 0 0 8 0 3 0 19 0 0 1 0 0 10 0 1 0 0 0 SP567 Bacteria;Firmicutes;Bacilli;Lactobacillales;Streptococcaceae;Streptococcus;oralis_subsp._dentisani_clade_398 0 1 1 0 0 0 0 0 3 2 0 15 0 0 1 0 281 10 1 1 9 1 2 79 5 0 1 3 0 0 3 0 36 0 0 0 0 70 0 1 1 0 1 1 12 1 9 0 0 1 0 0 2 2 0 4 0 8 0 0 3 0 0 0 0 0 0 0 7 206 0 27 1 0 3 4 0 0 3 35 2 1 8 4 0 0 0 2 37 0 1 0 0 5 0 5 0 2 0 1 1 1 0 0 1 0 0 1 10 19 1 27 89 67 1 1 1 0 78 0 2 2 0 1 9 4 1 0 1074 4 0 0 0 7 4 0 0 1 1 3 7 0 0 34 1 3 0 0 7 3 1 0 0 1 3 1 0 0 0 0 0 31 0 0 1 2 5 0 5 2 0 0 44 2 0 0 2 2 0 0 0 1 4 2 0 4 3 3 0 0 0 923 4 86 0 5 0 0 1 0 24 0 0 0 0 6 0 10 7 0 0 13 0 79 49 5 3 33 0 0 0 2337 59 6 1 6 1 0 2 0 0 0 3 0 0 0 0 0 0 1 13 0 0 0 2 2 0 0 190 0 0 3 0 0 0 0 69 57 1 0 8 0 0 0 25 1 0 1 0 0 0 0 0 0 0 0 0 0 0 0 0 0 0 0 0 0 0 0 0 0 0 0 0 0 0 0 0 0 0 0 0 0 0 0 0 0 0 0 0 0 0 0 0 0 0 0 0 0 0 0 0 0 0 0 0 0 0 0 0 0 0 0 0 0 0 0 0 0 0 0 0 0 0 0 0 0 0 0 0 0 0 0 0 0 0 0 0 0 0 0 0 0 0 0 0 0 0 0 0 0 0 0 0 0 0 0 0 0 0 0 0 0 0 0 0 0 0 0 0 0 0 0 0 0 0 0 0 0 0 0 0 0 0 0 0 0 0 0 0 0 0 0 0 0 0 0 0 0 0 0 0 0 0 0 0 0 0 0 0 0 0 0 0 0 0 0 0 0 0 0 0 0 0 0 0 0 0 0 0 0 0 0 0 0 0 0 0 0 0 0 0 0 0 0 0 0 0 0 0 0 0 0 0 0 0 0 0 0 0 0 0 0 0 0 0 0 0 0 0 0 0 0 0 0 0 0 0 0 0 0 0 0 0 0 0 0 0 0 0 0 0 0 0 0 0 0 0 0 0 0 0 0 0 0 0 0 0 0 0 0 0 0 0 0 0 0 0 0 0 0 0 0 0 0 0 0 0 0 0 0 0 0 0 0 0 0 0 0 0 0 0 0 0 0 0 0 0 0 0 0 0 0 0 0 0 0 0 0 0 0 0 0 0 0 0 0 0 0 0 0 0 0 0 0 0 0 0 0 0 0 0 0 0 0 0 0 0 0 0 0 0 0 0 0 0 0 0 0 0 0 0 0 0 0 0 0 0 0 0 0 0 0 0 0 0 0 0 0 0 0 0 0 0 0 0 0 0 0 0 0 0 0 0 0 0 0 0 0 0 0 0 0 0 0 0 0 0 0 0 0 0 0 0 0 0 0 0 0 0 0 0 0 0 0 0 0 0 0 0 0 0 0 0 0 0 0 0 0 0 0 0 0 0 0 0 0 0 0 0 0 0 0 0 0 0 0 0 0 0 0 0 0 0 0 0 0 0 0 0 0 0 0 0 0 0 0 0 0 0 0 0 0 0 0 0 0 0 0 0 0 0 0 0 0 0 0 0 0 0 0 0 0 0 0 0 0 0 0 0 0 0 0 0 0 0 0 0 0 0 0 0 0 0 0 0 0 0 0 0 0 0 0 0 0 0 0 0 0 0 0 0 0 0 0 0 0 0 0 0 0 0 0 0 0 0 0 0 0 0 0 0 0 0 0 0 0 0 0 0 0 0 0 0 0 0 0 0 0 0 0 0 0 0 0 0 0 0 0 0 0 0 0 0 0 0 0 0 0 0 0 0 0 0 0 0 0 0 0 0 0 0 0 0 0 0 0 0 0 0 0 0 0 0 0 0 0 0 0 0 0 0 0 0 0 0 0 0 0 0 0 0 0 0 0 0 0 0 0 0 0 0 0 0 0 0 0 0 0 0 0 0 0 0 0 0 0 0 0 0 0 0 0 0 0 0 0 0 0 0 0 0 0 0 0 0 0 0 0 0 0 0 0 0 0 0 0 0 0 0 0 0 0 0 0 0 0 0 0 0 0 0 0 0 0 0 0 0 0 0 0 0 0 0 0 0 0 0 0 0 0 0 0 0 0 0 0 0 0 0 0 0 0 0 0 0 0 0 0 0 0 0 0 0 0 0 0 0 0 0 0 0 0 0 0 0 0 0 0 0 0 0 0 0 0 0 0 0 0 0 0 0 0 0 0 0 0 0 0 0 0 0 0 0 0 0 0 0 0 0 0 0 0 0 0 0 0 0 0 0 0 0 0 0 0 0 0 0 0 0 0 0 0 0 0 0 0 0 0 0 0 0 0 0 0 0 0 0 0 0 0 0 0 0 0 0 0 0 0 0 0 0 0 0 0 0 0 0 0 0 0 0 0 0 0 0 0 0 0 0 0 0 0 0 0 0 0 0 0 0 0 0 0 0 0 0 0 0 0 0 0 0 0 0 0 0 0 0 0 0 0 0 0 0 0 0 0 0 0 0 0 0 0 0 0 0 0 0 0 0 0 0 0 0 0 0 0 0 0 0 0 0 0 0 0 0 0 0 0 0 0 0 0 0 0 0 0 0 0 0 0 0 0 0 0 0 0 0 0 0 0 0 0 0 0 0 0 0 0 0 0 0 0 0 0 0 0 0 0 0 0 0 0 0 0 0 0 0 0 0 0 0 0 0 0 0 0 0 0 0 0 0 0 0 0 0 0 0 0 0 0 0 0 0 0 0 0 0 0 0 0 0 0 0 0 0 0 0 0 0 0 0 0 0 0 0 0 0 0 0 0 0 0 0 0 0 0 0 0 0 0 0 0 0 0 0 0 0 0 0 0 0 0 0 0 0 0 0 0 0 0 0 0 0 0 0 0 0 0 0 0 0 0 0 0 0 0 0 0 0 0 0 0 0 0 0 0 0 0 0 0 0 0 0 0 0 0 0 0 0 0 0 0 0 0 0 0 0 0 0 0 0 0 0 0 0 0 0 0 0 0 0 0 0 0 0 0 0 0 0 0 0 0 0 0 0 0 0 0 0 0 0 0 0 0 0 0 0 0 0 0 0 0 0 0 0 0 0 0 0 0 0 0 0 0 0 0 0 0 0 0 0 0 0 0 0 0 0 0 0 0 0 0 0 0 0 0 0 0 0 0 0 0 0 0 0 0 0 0 0 0 0 0 0 0 0 0 0 0 0 0 0 0 0 0 0 0 0 0 0 0 0 0 0 0 0 0 0 0 0 0 0 0 0 0 0 0 0 0 0 0 0 0 0 0 0 0 0 0 0 0 0 0 0 0 0 0 0 0 0 0 0 0 0 0 0 0 0 0 0 0 0 0 0 0 0 0 0 0 0 0 0 0 0 0 0 0 0 0 0 0 0 0 0 0 0 0 0 0 0 0 0 0 0 0 0 0 0 0 0 0 0 0 0 0 0 0 0 0 0 0 0 0 0 0 0 0 0 0 0 0 0 0 0 0 0 0 0 0 0 0 0 0 0 0 0 0 0 0 0 0 0 0 0 0 0 0 0 0 0 0 0 0 0 0 0 0 0 0 0 0 0 0 0 0 0 0 0 0 0 0 0 0 0 0 0 0 0 0 0 0 0 0 0 0 0 0 0 0 0 0 0 0 0 0 0 0 0 0 0 0 0 0 0 0 0 0 0 0 0 0 0 0 0 0 0 0 0 0 0 0 0 0 0 0 0 0 0 0 0 0 0 0 0 0 0 0 0 0 0 0 0 0 0 0 0 0 0 0 0 0 0 0 0 0 0 0 0 0 0 0 0 0 0 0 0 0 0 0 0 0 0 0 0 0 0 0 0 0 0 0 0 0 0 0 0 0 0 0 0 0 0 0 0 0 0 0 0 0 0 0 0 0 0 0 0 0 0 0 0 0 0 0 0 0 0 0 0 0 0 0 0 0 0 0 0 0 0 0 0 0 0 0 0 0 0 0 0 0 0 0 0 0 0 0 SP58 Bacteria;Actinobacteria;Actinomycetia;Micrococcales;Micrococcaceae;Rothia;dentocariosa 57 847 63 179 171 123 18 113 51 245 15 1405 242 62 18 58 64 72 25 28 32 472 263 639 161 128 3640 57 754 933 3 8 384 88 50 265 72 51 188 3 174 326 126 22 25 17 518 474 830 886 34 26 54 20 57 23 50 431 235 569 381 1420 147 6 22 134 70 47 126 27 871 190 523 262 1876 183 25 56 383 601 475 20 53 76 20 27 35 133 176 16 59 129 88 418 1045 87 177 79 48 74 138 15 136 80 31 22 194 125 20 205 433 231 350 413 74 251 8 136 216 32 262 507 31 356 144 60 23 21 30 158 143 12 225 26 32 180 0 157 383 124 878 53 43 923 145 83 8 48 29 25 8 24 44 96 227 46 20 784 243 217 381 308 14 22 30 38 301 89 550 352 3 282 34 86 168 311 44 46 261 170 26 753 30 9 74 41 18 267 1 17 92 329 37 44 41 86 3 70 82 227 269 58 17 10 13 15 27 183 284 1 45 954 67 208 296 80 105 12 147 84 64 34 103 135 22 31 2 467 772 8 322 61 75 71 51 2 89 99 17 512 227 36 35 852 317 134 25 152 2 89 11 0 19 15 17 290 36 9 451 19 526 25 258 103 238 120 57 454 61 14 0 0 61 1681 1141 0 496 70 576 222 174 143 24 262 118 1366 222 9556 366 59 197 0 151 8 277 53 120 15 1 155 426 34 6 158 419 1448 623 1680 4 1636 0 443 25 2475 93 55 0 236 711 1587 266 14 7 198 6 6 408 0 811 1 800 177 0 0 1067 2 17 2486 0 21 0 21 0 12 2645 2 0 2221 3761 2437 1 1 2 1047 0 218 0 2037 1367 8 4 475 0 113 155 1165 255 169 10 0 555 271 116 41 5 869 8167 218 434 79 320 0 890 95 38 301 59 9 7 121 1405 0 0 145 164 36 562 0 683 444 16 38 1 48 19 30 4 411 2142 0 47 0 3 113 2 0 73 1 621 973 923 1038 162 27 4076 187 352 578 2172 46 31 312 460 850 2 77 38 0 0 1243 213 589 5 7990 104 232 1134 1505 11 5 2 531 132 1 5847 98 44 36 4 66 1045 802 61 310 0 567 0 35 98 953 1027 17 27 197 0 1 464 372 2379 636 74 239 342 312 51 71 15 28 194 70 78 2 89 5 16 0 8 122 0 44 44 0 1 4 2244 0 1166 1038 4076 792 355 144 1 2227 5 3 5084 302 18 1877 924 31 66 3411 1039 372 0 443 1883 956 2 32 3 2 9 0 17 58 3964 1 1 32 36 137 1858 0 614 135 8 839 243 1580 0 1101 415 1022 545 1455 0 13 0 17 1 17 7 22 48 30 152 91 36 2 1137 1519 1614 90 204 71 8 0 0 74 142 724 1781 877 1404 47 0 497 22 222 68 0 0 323 46 80 0 0 0 71 0 360 2849 3484 149 6241 1268 750 2 116 7 0 18 1201 889 0 328 236 0 432 263 651 1648 1 0 2 877 190 3 10 86 163 105 230 198 9 527 1833 9 3 2 18 27 82 2 0 0 3874 1200 58 0 294 0 1590 516 1334 45 866 55 0 893 1066 73 832 810 0 10 10 0 22 1 12 0 46 54 1 145 537 1600 371 36 32 0 64 146 0 105 145 155 0 370 106 51 92 446 626 544 706 205 1 766 577 6 1212 697 1 448 284 1897 0 9 103 0 0 0 1 38 152 1125 283 314 4 0 39 116 83 2097 97 169 35 79 2127 4 126 1562 99 63 29 145 80 189 1 65 0 362 33 235 2215 11 169 235 0 362 4 59 0 0 144 764 6 0 465 66 1 24 68 669 114 760 699 18 53 1403 9 218 0 92 33 481 1397 0 897 738 75 74 196 66 98 0 0 2139 3806 1088 44 52 4 1932 1 132 0 1225 19 2343 134 1804 1196 304 1577 2534 331 22 10 386 962 3 393 837 447 1919 811 1646 0 3 89 1020 441 1530 0 44 2 3 8 90 52 5 31 4 5647 1 39 203 0 410 1695 615 599 29 76 7943 31 1938 2 309 15 1 1335 1075 0 9 114 0 9 248 412 2 3 145 38 62 0 443 71 5 803 340 493 185 290 853 422 423 347 241 0 249 244 409 448 990 77 0 3 14 119 1566 0 457 0 220 4 1420 412 573 0 113 213 17 0 139 14 0 1 201 109 0 311 86 2 918 1 128 7 119 4222 1 40 75 18 30 2 70 297 931 426 764 91 1992 215 223 480 247 640 5980 614 269 1498 424 5 15 419 65 112 0 810 98 609 952 308 2391 13 0 6 7162 9 443 132 1 0 623 554 2329 52 326 254 67 65 996 41 68 2342 144 63 827 134 0 66 2 29 218 21 14 4 22 211 3 1523 1228 2 579 991 11 2 1005 53 0 0 287 0 15 715 3 64 75 2052 115 2 1531 0 6058 1607 2799 603 125 665 432 68 119 0 22 168 2 23 210 6 246 32 220 104 2 2 0 224 1 0 83 140 33 388 304 24 0 156 505 1 83 70 0 0 4 7 1 0 63 156 0 100 3 0 171 51 0 0 160 396 2 6 258 0 0 0 15 0 68 88 39 0 194 1225 19 13 93 20 0 1 100 0 3 4 12 0 1 118 0 1 33 0 1 1 2 0 12 101 24 15 5 0 54 522 96 3 22 111 9 0 146 3 0 76 24 4 125 201 0 0 23 190 18 298 7 7 0 2 4 0 0 39 1 0 371 1 0 17 5 0 58 4 4 1 1 8 4 0 16 9 0 47 68 0 0 91 35 18 53 0 3 14 1757 6 0 42 3 1 1 0 0 106 0 458 179 5 387 1 396 0 193 71 1 557 36 1 410 189 0 3 3 384 464 0 106 388 0 22 16 0 0 168 196 0 0 263 136 0 175 773 5 8 95 550 4 113 213 6 339 119 0 97 504 31 20 71 152 0 28 33 0 97 37 3 0 94 0 6 12 1 15 101 0 62 11 1 21 53 108 0 39 33 0 648 19 0 23 21 16 0 219 5 0 44 0 1 132 7 52 0 83 12 0 1 65 136 48 335 15 0 20 27 0 30 77 181 1 4 1 0 12 6 0 98 51 0 0 29 27 5 0 19 0 0 37 0 14 97 2 89 54 14 0 117 18 0 270 284 35 198 4 1 4 12 6 0 32 380 9 39 0 0 2 10 54 1 19 6 19 0 96 6 2 21 1149 0 86 1 471 125 2 5 150 198 970 0 1 0 167 0 9 63 5 22 5 82 0 96 584 0 0 0 56 73 15 424 18 51 73 140 5 12 84 2 8 31 0 8 6 0 39 7 1 0 3 38 2 1 152 1 7 30 11 4 93 757 56 116 29 1 0 2 6 3 0 0 55 15 36 18 0 10 1 0 123 158 1 157 28 0 0 4 474 4 40 81 0 32 38 0 9 6 5 0 9 83 37 177 21 96 14 0 249 93 2 32 67 249 2 58 173 2 8 4 0 58 10 0 0 11 0 0 40 166 104 15 15 0 0 224 25 0 30 10 6 2 136 6 3 216 29 18 1 333 52 27 21 131 2 208 4 32 0 701 55 0 233 509 0 4 273 0 0 65 15 0 0 43 0 77 57 135 3 1 29 0 61 0 1 10 7 4 17 0 0 41 0 2 0 60 43 0 137 409 89 412 0 0 37 7 0 166 59 0 11 77 12 74 13 4 35 103 506 1 44 88 0 76 13 0 198 158 0 75 140 363 85 393 155 14 779 88 2 0 80 36 0 43 106 83 0 75 165 42 202 5 8 27 137 31 20 12 107 0 56 145 0 13 114 7 40 26 17 0 150 139 4 23 36 85 0 0 1 0 7 98 529 13 57 281 10 0 27 0 225 59 5 64 570 8 1 98 19 2 90 11 21 0 308 48 0 90 21 3 46 65 0 3 0 34 0 134 6 0 67 9 0 24 72 2 729 377 42 30 0 9 1 4 14 189 15 331 11 1 23 8 0 23 12 37 9 52 0 0 157 15 0 50 23 2 18 1 1 20 8 1 1 2 30 0 12 5 23 1 0 103 9 61 19 250 383 21 32 6 7 57 371 36 7 0 0 0 1 0 29 160 9 2 388 251 0 36 11 8 76 0 0 89 18 791 142 142 78 33 96 1 82 217 45 0 116 54 0 46 17 0 76 91 12 0 41 34 0 77 155 19 0 0 0 0 5 113 0 0 1 7 0 81 90 2 11 9 0 51 147 78 0 80 451 0 56 0 0 16 51 31 7 12 SP588 Bacteria;Fusobacteria;Fusobacteria;Fusobacteriales;Fusobacteriaceae;Fusobacterium;sp. HMT248 0 0 0 0 0 0 0 0 0 0 0 311 0 0 0 0 0 0 0 0 0 0 4 0 0 0 0 0 0 0 1 0 0 1 0 0 0 0 0 0 0 0 0 0 0 0 0 0 0 0 0 0 0 0 0 0 0 0 0 0 0 0 0 0 0 12 0 0 18 0 2 0 0 1 0 0 0 0 0 0 0 0 0 1 0 0 0 0 1 0 1 0 0 0 0 0 46 0 24 0 1 0 0 1 0 0 0 0 0 0 0 0 0 0 0 0 0 0 0 0 0 0 0 0 0 0 0 0 0 0 0 0 0 2 0 0 0 0 0 0 0 5 0 0 0 5 0 0 0 0 0 0 0 0 0 0 0 0 0 0 0 0 0 0 0 0 3 0 17 0 0 0 0 0 0 0 0 0 0 0 0 0 6 0 0 0 0 0 0 0 0 0 0 0 0 0 0 0 0 0 1 1 0 0 0 0 11 0 0 0 0 0 0 0 0 0 0 0 2 0 1 0 0 0 0 0 0 0 0 0 0 0 0 0 0 0 0 0 0 0 0 0 0 0 0 0 0 0 0 0 0 0 0 0 0 0 0 0 0 0 1 0 0 0 7 0 0 0 0 4 0 0 1 0 0 0 0 5 0 0 0 0 0 0 0 0 0 0 0 0 2 0 0 0 0 0 0 0 0 0 0 18 1 4 1 0 0 0 0 0 0 0 0 0 0 0 0 0 0 0 0 0 0 0 0 0 0 0 0 0 0 0 4 0 0 0 0 2 0 0 2 0 0 0 0 0 0 0 0 1 0 0 0 0 0 0 0 0 0 0 0 0 0 0 0 4 0 0 0 0 0 0 2 27 0 0 0 3 0 0 0 0 0 0 0 0 0 0 0 0 0 0 0 0 2 0 1 0 0 0 2 0 0 0 0 0 0 0 6 0 0 13 0 0 0 0 1 0 0 0 0 0 0 0 0 3 6 0 0 0 0 0 0 22 0 0 0 0 0 0 0 0 0 0 0 0 0 0 6 0 0 0 0 0 0 0 0 0 0 1 0 0 1 2 0 0 0 3 0 0 0 0 1 0 0 0 0 0 0 0 0 0 0 0 4 4 0 0 0 0 0 0 0 59 108 348 0 0 2 0 0 0 0 0 2 0 0 1 0 0 0 0 0 0 0 0 0 0 3 0 0 0 1 5 0 0 0 0 3 0 0 0 9 0 0 0 2 0 2 4 0 0 0 0 0 0 0 1 0 0 0 0 0 0 0 0 8 3 0 0 0 1 0 0 0 3 0 0 0 0 0 0 0 3 0 0 0 0 3 3 1 0 0 0 0 3 0 0 0 0 0 0 0 0 0 0 0 0 0 0 0 0 0 0 0 0 0 0 0 0 0 0 0 0 0 0 0 0 0 0 0 0 0 0 49 0 3 10 0 0 0 0 0 32 0 0 0 0 0 0 0 0 2 6 1 0 0 0 0 8 0 32 1 16 11 0 1 0 5 0 0 0 0 0 17 0 0 0 0 0 0 0 0 0 0 0 0 0 0 0 0 0 5 2 0 0 0 12 0 1 0 0 0 1 13 0 0 0 0 0 17 0 0 6 9 0 0 0 0 0 2 0 16 0 0 0 1 0 0 0 0 0 0 0 0 0 53 5 0 1 0 0 0 0 1 0 0 0 0 0 0 0 9 0 0 0 6 0 0 0 0 0 0 0 0 0 0 7 0 0 0 2 4 0 0 0 0 0 1 0 0 0 0 0 0 0 0 0 0 0 0 0 0 0 0 1 0 0 0 0 5 1 0 0 0 0 1 0 0 0 0 0 0 1 0 0 1 0 0 1 4 0 0 0 0 0 0 0 0 0 0 4 0 0 0 0 4 0 0 0 0 2 0 0 0 0 1 0 1 0 0 0 0 0 0 0 0 0 31 0 0 0 0 0 0 0 0 0 0 0 0 0 1 0 5 23 0 7 18 4 1 0 110 1 0 0 14 0 0 57 0 5 10 0 0 0 0 0 0 0 1 0 0 0 0 0 0 0 0 0 0 0 0 0 0 0 0 0 79 0 0 0 0 0 0 0 0 0 0 4 0 0 1 1 0 0 0 0 0 0 0 2 0 0 0 0 4 6 0 0 0 0 27 0 2 0 0 2 0 0 0 0 0 0 0 1 0 0 0 0 0 0 0 3 0 1 1 0 0 0 0 0 0 0 4 0 0 0 0 0 0 0 0 0 1 0 0 0 1 0 0 0 0 0 0 0 0 1 0 0 0 0 4 0 0 0 0 0 8 0 0 1 0 0 19 2 1 0 0 0 0 2 0 2 0 0 0 30 0 0 0 0 6 1 112 26 0 0 0 0 0 1 2 0 0 0 0 0 0 26 0 0 0 0 0 0 0 1 0 0 0 6 0 0 0 0 0 0 0 0 0 0 61 0 0 0 0 0 0 0 0 52 0 0 45 0 2 0 0 1 0 0 0 0 0 0 0 0 0 0 0 0 0 0 2 0 0 0 0 68 0 116 0 0 0 0 0 2 0 18 0 0 0 0 4 0 0 0 0 0 0 0 12 0 0 0 0 23 0 4 0 47 0 0 4 0 0 0 1 0 0 272 0 0 0 1 0 0 1 0 0 0 2 0 0 0 0 25 0 14 1 0 0 2 0 0 0 0 0 0 0 0 0 0 0 1 0 0 0 0 0 3 0 8 0 0 24 107 68 1 29 0 0 0 115 0 2 0 0 0 0 0 0 3 0 20 0 2 28 261 0 1 0 0 0 0 0 0 0 0 1 0 0 0 0 1 0 9 0 0 0 3 24 0 0 0 1 19 0 0 0 0 0 30 9 0 0 0 0 20 185 7 0 22 0 0 0 0 0 1 0 5 0 0 2 0 0 1 0 0 2 4 0 2 30 0 2 0 0 111 0 0 0 0 0 0 11 83 0 0 0 0 74 4 40 1 5 8 2 0 0 5 1 18 0 4 0 0 0 0 0 9 0 44 0 0 0 109 0 0 0 0 0 0 3 16 0 0 0 0 10 0 0 0 0 0 0 0 0 0 0 0 721 0 5 0 0 0 1 144 0 0 0 0 1 0 0 0 1 1 142 2 44 224 0 4 0 0 0 4 0 14 0 0 0 0 0 0 0 0 0 0 0 20 0 67 17 0 50 7 0 0 0 0 0 0 0 0 1 11 0 0 0 0 0 0 1 0 38 0 0 0 8 0 0 0 0 28 23 0 0 0 8 0 18 0 64 53 0 0 3 21 33 0 2 0 1 0 0 13 0 0 0 0 182 3 0 5 0 0 0 0 0 0 0 18 0 0 0 0 0 0 1 0 0 5 15 0 0 24 0 0 20 0 0 0 0 0 0 0 0 0 0 0 3 0 0 0 4 117 18 4 2 0 250 0 0 1 0 0 5 69 0 0 0 0 0 0 0 4 1631 6 0 0 0 0 6 0 0 148 2 0 0 0 0 0 0 0 0 0 0 4 0 0 0 0 0 2 15 2 1 1 10 101 0 0 0 13 0 3 0 0 0 0 0 362 0 0 0 0 0 1 134 0 0 13 4 0 0 0 0 2 84 35 137 0 0 0 27 0 32 0 0 0 0 4 0 0 0 0 0 0 2 5 0 0 0 0 1 35 0 0 0 0 0 0 0 1 0 0 0 0 0 13 2 0 1 0 0 0 0 0 0 0 0 0 0 1 1 0 5 0 1 0 0 1 0 2 0 0 0 0 5 0 0 4 0 25 13 0 0 3 1 0 2 0 0 0 0 5 0 198 3 0 0 5 0 0 0 0 0 78 0 0 0 0 0 20 0 5 1 1 0 0 0 0 2 8 0 0 0 0 0 0 0 0 4 23 0 0 0 1 0 0 0 113 0 0 9 0 0 0 1 0 0 0 0 0 5 15 0 0 0 0 0 0 0 152 0 3 173 0 0 0 0 0 0 0 0 0 1 0 0 0 0 0 0 0 0 1 18 0 0 0 3 0 0 0 0 0 0 0 0 0 0 89 1 0 0 0 4 4 0 0 0 0 0 29 5 0 0 0 0 1 92 10 146 44 0 0 0 7 0 0 12 49 48 0 9 0 2 0 0 0 1 20 1 0 0 0 2 499 0 0 SP59 Bacteria;Firmicutes;Bacilli;Lactobacillales;Streptococcaceae;Streptococcus;sp. HMT066 831 4851 363 573 1780 975 1639 1295 1639 2202 1780 981 3651 1537 82 3419 1686 718 1388 2664 1352 1947 3525 334 2018 3700 2433 1082 522 557 409 2467 517 1535 836 366 3079 516 2090 887 87 1159 190 835 999 358 2073 754 5 1801 2532 621 7695 1195 2117 2554 1631 1898 454 2851 1642 1063 1756 811 2994 1496 656 1823 2317 674 12 573 1180 4017 1509 3282 1801 3397 5 2675 1192 348 2982 884 1308 2657 1427 3949 3983 575 47 6459 206 486 1010 1839 73 1409 802 2178 8959 2453 390 3686 740 493 556 178 858 127 1 210 501 784 444 1404 364 205 456 711 1512 23 1318 496 404 519 673 926 2937 334 1045 532 251 1911 946 235 984 1373 641 2305 362 310 1681 1534 448 612 2597 240 2298 1220 386 2434 1918 9665 1742 3368 470 278 810 614 1383 893 218 535 2431 3284 1679 2041 209 561 1272 1334 2756 5846 3514 140 4115 3599 2391 1450 520 2755 1034 1580 758 1815 2317 1006 2870 1788 5403 3060 1809 2450 1171 3863 5073 267 1282 1906 137 499 1025 2966 3461 1688 152 4 1777 122 1259 3261 214 1387 2385 578 5 733 313 1464 498 349 840 1387 610 15 789 625 1152 730 3901 1398 4231 1111 518 1784 3417 1551 721 1588 958 702 385 2392 84 708 537 17 37 194 30 724 1061 2099 1911 1058 6089 3973 632 2511 448 1188 2061 2259 161 7338 1664 1144 0 0 0 0 0 0 0 0 0 0 0 0 0 0 0 0 0 0 0 0 0 0 0 0 0 0 0 0 0 0 0 0 0 0 0 0 0 0 0 0 0 0 0 0 0 0 0 0 0 0 0 0 0 0 0 0 0 0 0 0 0 0 0 0 0 0 0 0 0 0 0 0 0 0 0 0 0 0 0 0 0 0 0 0 0 0 0 0 0 0 0 0 0 0 0 0 0 0 0 0 0 0 0 0 0 0 0 0 0 0 0 0 0 0 0 0 0 0 0 0 0 0 0 0 0 0 0 0 0 0 0 0 0 0 0 0 0 0 0 0 0 0 0 0 0 0 0 0 0 0 0 0 0 0 0 0 0 0 0 0 0 0 0 0 0 0 0 0 0 0 0 0 0 0 0 0 0 0 0 0 0 0 0 0 0 0 0 0 0 0 0 0 0 0 0 0 0 0 0 0 0 0 0 0 0 0 0 0 0 0 0 0 0 0 0 0 0 0 0 0 0 0 0 0 0 0 0 0 0 0 0 0 0 0 0 0 0 0 0 0 0 0 0 0 0 0 0 0 0 0 0 0 0 0 0 0 0 0 0 0 0 0 0 0 0 0 0 0 0 0 0 0 0 0 0 0 0 0 0 0 0 0 0 0 0 0 0 0 0 0 0 0 0 0 0 0 0 0 0 0 0 0 0 0 0 0 0 0 0 0 0 0 0 0 0 0 0 0 0 0 0 0 0 0 0 0 0 0 0 0 0 0 0 0 0 0 0 0 0 0 0 0 0 0 0 0 0 0 0 0 0 0 0 0 0 0 0 0 0 0 0 0 0 0 0 0 0 0 0 0 0 0 0 0 0 0 0 0 0 0 0 0 0 0 0 0 0 0 0 0 0 0 0 0 0 0 0 0 0 0 0 0 0 0 0 0 0 0 0 0 0 0 0 0 0 0 0 0 0 0 0 0 0 0 0 0 0 0 0 0 0 0 0 0 0 0 0 0 0 0 0 0 0 0 0 0 0 0 0 0 0 0 0 0 0 0 0 0 0 0 0 0 0 0 0 0 0 0 0 0 0 0 0 0 0 0 0 0 0 0 0 0 0 0 0 0 0 0 0 0 0 0 0 0 0 0 0 0 0 0 0 0 0 0 0 0 0 0 0 0 0 0 0 0 0 0 0 0 0 0 0 0 0 0 0 0 0 0 0 0 0 0 0 0 0 0 0 0 0 0 0 0 0 0 0 0 0 0 0 0 0 0 0 0 0 0 0 0 0 0 0 0 0 0 0 0 0 0 0 0 0 0 0 0 0 0 0 0 0 0 0 0 0 0 0 0 0 0 0 0 0 0 0 0 0 0 0 0 0 0 0 0 0 0 0 0 0 0 0 0 0 0 0 0 0 0 0 0 0 0 0 0 0 0 0 0 0 0 0 0 0 0 0 0 0 0 0 0 0 0 0 0 0 0 0 0 0 0 0 0 0 0 0 0 0 0 0 0 0 0 0 0 0 0 0 0 0 0 0 0 0 0 0 0 0 0 0 0 0 0 0 0 0 0 0 0 0 0 0 0 0 0 0 0 0 0 0 0 0 0 0 0 0 0 0 0 0 0 0 0 0 0 0 0 0 0 0 0 0 0 0 0 0 0 0 0 0 0 0 0 0 0 0 0 0 0 0 0 0 0 0 0 0 0 0 0 0 0 0 0 0 0 0 0 0 0 0 0 0 0 0 0 0 0 0 0 0 0 0 0 0 0 0 0 0 0 0 0 0 0 0 0 0 0 0 0 0 0 0 0 0 0 0 0 0 0 0 0 0 0 0 0 0 0 0 0 0 0 0 0 0 0 0 0 0 0 0 0 0 0 0 0 0 0 0 0 0 0 0 0 0 0 0 0 0 0 0 0 0 0 0 0 0 0 0 0 0 0 0 0 0 0 0 0 0 0 0 0 0 0 0 0 0 0 0 0 0 0 0 0 0 0 0 0 0 0 0 0 0 0 0 0 0 0 0 0 0 0 0 0 0 0 0 0 0 0 0 0 0 0 0 0 0 0 0 0 0 0 0 0 0 0 0 0 0 0 0 0 0 0 0 0 0 0 0 0 0 0 0 0 0 0 0 0 0 0 0 0 0 0 0 0 0 0 0 0 0 0 0 0 0 0 0 0 0 0 0 0 0 0 0 0 0 0 0 0 0 0 0 0 0 0 0 0 0 0 0 0 0 0 0 0 0 0 0 0 0 0 0 0 0 0 0 0 0 0 0 0 0 0 0 0 0 0 0 0 0 0 0 0 0 0 0 0 0 0 0 0 0 0 0 0 0 0 0 0 0 0 0 0 0 0 0 0 0 0 0 0 0 0 0 0 0 0 0 0 0 0 0 0 0 0 0 0 0 0 0 0 0 0 0 0 0 0 0 0 0 0 0 0 0 0 0 0 0 0 0 0 0 0 0 0 0 0 0 0 0 0 0 0 0 0 0 0 0 0 0 0 0 0 0 0 0 0 0 0 0 0 0 0 0 0 0 0 0 0 0 0 0 0 0 0 0 0 0 0 0 0 0 0 0 0 0 0 0 0 0 0 0 0 0 0 0 0 0 0 0 0 0 0 0 0 0 0 0 0 0 0 0 0 0 0 0 0 0 0 0 0 0 0 0 0 0 0 0 0 0 0 0 0 0 0 0 0 0 0 0 0 0 0 0 0 0 0 0 0 0 0 0 0 0 0 0 0 0 0 0 0 0 0 0 0 0 0 0 0 0 0 0 0 0 0 0 0 0 0 0 0 0 0 0 0 0 0 0 0 0 0 0 0 0 0 0 0 0 0 0 0 0 0 0 0 0 0 0 0 0 0 0 0 0 0 0 0 0 0 0 0 0 0 0 0 0 0 0 0 0 0 0 0 0 0 0 0 0 0 0 0 0 0 0 0 0 0 0 0 0 0 0 0 0 0 0 0 0 0 0 0 0 0 0 0 0 0 0 0 0 0 0 0 0 0 0 0 0 0 0 0 0 0 0 0 0 0 0 0 0 0 0 0 0 0 0 0 0 0 0 0 0 0 0 0 0 0 0 0 0 0 0 0 0 0 0 0 0 0 0 0 0 0 0 0 0 0 0 0 0 0 0 0 0 0 0 0 0 0 0 0 0 0 0 0 0 0 0 0 0 0 0 0 0 0 0 0 0 0 0 0 0 0 0 0 0 0 0 0 0 0 0 0 0 0 0 0 0 0 0 0 0 0 0 0 0 0 0 0 0 0 0 0 0 0 0 0 0 0 0 0 0 0 0 0 0 0 0 0 0 0 0 0 0 0 0 0 0 0 0 0 0 0 0 0 0 0 0 0 0 0 0 0 0 0 0 0 0 0 0 0 0 0 0 0 0 0 0 0 0 0 0 0 0 0 0 0 0 0 0 0 0 0 0 0 0 0 0 0 0 0 0 0 0 0 0 0 0 0 0 0 0 0 0 0 0 0 0 0 0 0 0 0 0 0 0 0 0 0 0 0 0 0 0 0 0 0 0 0 SP599 Bacteria;Actinobacteria;Actinobacteria;Actinomycetales;Actinomycetaceae;Peptidiphaga;gingivicola 0 0 248 0 10 27 21 2 29 0 1 12 0 4 2 4 6 0 0 0 1 1 3 8 26 0 28 0 0 0 0 0 0 5 0 1 13 0 2 0 52 47 0 7 1 0 3 3 0 3 3 3 0 0 1 1 0 4 0 3 0 0 7 1 0 16 2 0 4 0 2 0 0 0 0 4 0 1 0 0 9 0 0 1 0 0 3 1 0 7 0 1 6 27 0 0 4 31 0 0 0 0 0 263 0 0 0 0 0 1 0 11 0 0 0 0 2 2 0 0 0 0 0 4 0 2 0 2 0 7 0 0 2 24 0 7 0 3 0 0 5 2 0 3 11 0 0 0 0 0 0 5 0 0 7 0 0 6 2 0 0 0 0 0 0 4 0 0 14 0 0 0 0 5 3 4 0 0 0 0 2 1 0 0 5 0 0 0 0 0 3 2 1 4 0 2 0 0 0 2 17 0 0 1 1 0 1 0 1 3 0 1 2 2 0 0 8 7 0 0 10 0 3 4 0 0 0 1 17 13 7 9 2 0 0 0 0 1 0 43 0 0 0 13 1 7 0 0 0 12 0 0 0 0 0 0 0 0 0 0 0 0 0 0 0 0 0 0 0 78 909 0 3 1 0 0 0 0 109 0 204 146 0 782 64 79 0 0 0 3 3 0 20 26 26 0 9 199 0 13 3 0 3 87 2 0 0 0 0 0 10 7 0 0 2 0 0 205 0 6 0 0 0 0 2 0 0 0 169 0 21 6 0 0 0 0 6 2 0 0 0 2 0 799 46 3733 0 1 74 0 101 84 0 65 0 0 0 6 11 0 0 8 0 0 0 0 0 23 19 0 0 7 0 8 40 0 3 0 0 1 0 0 0 30 0 49 164 156 1 0 0 0 0 12 554 20 0 0 55 130 0 0 0 160 34 0 0 0 0 0 0 176 0 0 0 0 55 0 48 0 0 5 1 42 0 39 437 0 0 10 1 0 9 7 0 0 2 0 0 0 0 1 21 0 0 0 0 0 18 1 0 29 529 0 0 0 0 0 0 87 23 0 2 13 0 357 0 4 10 198 0 410 0 418 15 0 0 0 0 1 0 0 89 62 47 29 29 120 0 0 0 0 3 17 2 0 0 2 0 7 15 0 0 0 0 0 0 4 0 0 1 4 0 0 16 0 1 0 0 0 2 0 0 4 1 38 0 0 8 0 0 0 1 0 175 0 14 39 0 2 0 0 22 0 0 0 1 41 0 92 69 4 0 0 0 0 22 0 0 6 0 0 0 1 43 751 0 0 0 5 3 0 12 0 142 0 0 0 0 0 0 1 219 0 0 0 2 0 0 0 0 0 1 47 0 0 0 348 0 0 0 0 0 12 2 1 0 7 27 5 0 0 0 0 0 0 0 0 30 3 0 0 0 0 9 2 440 0 51 58 0 8 3 0 0 0 17 0 4 70 0 7 44 0 1 0 0 0 0 0 0 0 0 0 0 0 19 0 0 15 2603 0 228 528 70 14 0 0 0 0 0 0 0 104 0 15 59 0 2 0 0 102 50 1 0 0 0 0 26 22 1 0 0 1 0 0 0 0 0 7 0 0 411 0 0 0 0 0 0 0 0 0 1 16 0 0 48 0 46 0 0 42 94 0 0 0 6 98 0 0 52 173 0 561 4 1652 173 342 44 22 0 860 391 0 25 0 0 60 0 0 0 0 0 0 0 0 269 0 0 3 7 74 239 0 0 0 3 63 0 5 88 0 0 20 0 0 0 0 145 0 0 0 0 195 52 0 158 0 1 59 2 0 0 0 0 0 2 0 0 0 0 0 0 0 0 143 177 0 2 0 8 0 22 0 2 215 1 33 87 0 12 0 3 0 0 0 0 0 5 0 0 5 0 0 15 167 0 6 8 0 1 0 1 0 0 0 0 366 19 0 4 0 42 0 12 0 18 1 56 0 6 0 0 0 8 135 0 51 0 0 130 1 0 0 3 0 0 0 1 0 284 5 0 3 0 0 19 0 0 0 11 0 0 0 11 0 28 0 55 1 0 0 0 0 0 0 0 38 1 0 7 18 0 0 105 1219 0 0 0 0 5 4 9 0 0 0 0 0 0 0 98 0 37 194 0 0 162 2 0 0 0 0 1 38 0 2 6 0 44 0 0 0 50 162 0 0 0 0 0 0 0 243 0 0 0 0 0 0 0 0 2 1 0 20 0 0 2 179 0 0 0 0 2 46 0 9 0 440 0 19 50 0 0 9 1 86 1 1 11 0 0 222 34 0 0 17 0 0 1 0 0 0 0 0 0 0 0 0 0 0 1 0 9 0 0 0 0 0 112 0 1 1 0 0 31 0 0 0 0 0 0 15 0 171 2 0 0 0 0 0 28 0 0 32 52 0 6 3 0 0 0 0 0 0 0 6 0 0 44 0 53 16 0 0 15 8 0 0 72 0 0 3 0 0 24 3 39 0 50 1 0 1 56 5 0 0 255 4 0 0 0 0 1 17 0 2 0 0 0 1 1 0 0 0 0 0 1 0 12 0 35 1 81 1 48 0 0 0 0 10 4 0 0 307 0 0 0 8 0 23 36 1 0 2 0 0 0 55 10 0 3 5 0 0 3 0 0 1 1 0 0 0 5 0 0 2 0 2 5 1 0 0 0 0 7 0 3 0 0 0 0 0 0 0 0 0 0 1 0 9 141 0 45 0 268 0 9 34 0 0 0 0 11 183 1 0 0 39 278 0 10 51 0 4 2 0 0 168 33 0 0 0 0 0 0 0 0 5 0 63 0 12 70 0 371 14 0 0 5 0 0 2 2 0 1 95 0 4 0 2 0 0 0 1 39 0 0 0 0 4 1 0 0 0 1 0 2 5 0 0 0 0 0 0 3 0 0 0 0 34 0 0 0 3 32 0 131 199 0 0 55 3 0 27 0 0 35 33 0 0 15 7 0 91 0 0 0 6 0 0 0 1 0 10 175 0 1 0 3 0 1 0 1 0 0 8 0 0 0 53 0 0 25 115 0 34 76 0 0 15 31 0 0 158 0 0 0 0 0 0 0 0 0 27 0 0 5 1 0 0 11 0 1 0 262 14 0 0 0 0 25 33 1 0 5 9 0 0 0 0 0 0 0 57 168 500 1 0 3 17 0 29 263 0 0 116 0 73 0 0 0 5 0 20 0 0 0 1 0 0 0 1 0 0 24 0 0 2 2 0 9 0 1 0 32 0 0 0 55 0 0 33 0 0 0 0 0 0 0 0 8 6 0 20 443 0 0 0 24 0 35 8 0 0 0 0 1 0 0 0 0 0 0 0 0 4 3 0 0 0 0 0 0 0 0 1 3 0 21 22 0 6 7 2 0 88 21 0 0 0 0 0 28 8 0 0 50 0 14 0 0 16 19 0 0 1 0 0 2 52 13 0 0 0 0 37 0 0 0 19 0 0 0 0 0 0 0 0 0 0 1 0 0 1 0 0 0 0 17 0 1 2 47 0 5 0 0 0 12 5 0 23 5 25 0 0 0 0 16 21 16 0 0 0 0 0 0 0 0 0 0 11 0 38 25 0 13 0 100 0 0 0 0 0 1 0 0 0 0 0 33 92 0 1 6 0 0 0 0 0 0 37 0 0 0 0 0 5 26 0 11 2 0 0 0 2 0 3 0 0 0 0 0 0 0 0 0 0 0 0 0 2 0 47 40 9 0 0 0 0 0 0 0 0 1 1 0 0 9 0 0 13 0 0 69 308 0 10 0 0 914 11 1 0 147 862 0 236 47 0 0 0 0 0 0 0 0 1 7 0 5 3 0 31 13 0 23 0 2 1 0 0 0 0 0 0 0 2 9 0 35 0 0 0 0 0 12 0 0 0 0 2 0 0 0 1 11 10 0 15 2 34 0 0 0 0 0 1 5 0 0 0 0 0 0 27 1 0 9 0 0 1 1 1 0 0 0 0 0 2 0 4 4 0 6 52 0 6 0 59 0 0 0 0 16 0 0 0 0 0 21 0 10 6 31 0 11 3 0 1 6 0 2 3 1 0 1 1 0 9 0 0 0 0 19 0 9 8 0 0 21 25 0 1 0 0 0 0 0 28 5 1 0 0 35 0 46 4 0 8 55 1 0 0 SP6 Bacteria;Firmicutes;Clostridia;Negativicutes;Veillonellaceae;Veillonella;parvula 21 220 1 267 12 55 145 148 6 262 1152 59 931 1 46 502 25 189 131 75 500 106 151 1119 349 339 26 31 181 338 25 978 82 250 65 82 1446 263 215 56 502 59 30 327 59 127 98 468 158 8 519 121 1211 57 270 7 482 118 10 159 60 77 38 1418 277 11 34 5 115 69 745 137 436 325 274 4 4 187 216 61 354 294 30 32 422 88 733 631 32 901 70 569 8 51 222 26 2 10 73 113 143 38 45 349 9 37 214 6 1 18 719 100 357 332 752 25 72 978 356 5 163 87 659 258 612 298 595 417 1901 2 759 331 46 140 395 135 36 526 125 2 272 0 571 24 3 156 506 29 362 11 1291 34 514 201 139 27 9 154 40 12 21 5 104 102 148 158 3 219 63 234 692 59 23 26 138 53 17 4 10 181 303 43 176 1830 776 32 183 19 100 122 1820 5 14 113 648 217 832 421 30 34 23 240 70 489 125 986 2 52 32 579 131 55 338 61 30 358 159 64 18 404 239 397 65 43 1026 472 30 12 153 3720 1468 2 97 37 110 53 66 172 252 140 66 34 1873 9 21 366 141 76 152 121 510 8 11 113 0 2 321 4 388 125 378 403 130 616 281 94 308 481 0 0 0 0 0 0 0 0 0 0 0 0 0 0 0 0 0 0 0 0 0 0 0 0 0 0 0 0 0 0 0 0 0 0 0 0 0 0 0 0 0 0 0 0 0 0 0 0 0 0 0 0 0 0 0 0 0 0 0 0 0 0 0 0 0 0 0 0 0 0 0 0 0 0 0 0 0 0 0 0 0 0 0 0 0 0 0 0 0 0 0 0 0 0 0 0 0 0 0 0 0 0 0 0 0 0 0 0 0 0 0 0 0 0 0 0 0 0 0 0 0 0 0 0 0 0 0 0 0 0 0 0 0 0 0 0 0 0 0 0 0 0 0 0 0 0 0 0 0 0 0 0 0 0 0 0 0 0 0 0 0 0 0 0 0 0 0 0 0 0 0 0 0 0 0 0 0 0 0 0 0 0 0 0 0 0 0 0 0 0 0 0 0 0 0 0 0 0 0 0 0 0 0 0 0 0 0 0 0 0 0 0 0 0 0 0 0 0 0 0 0 0 0 0 0 0 0 0 0 0 0 0 0 0 0 0 0 0 0 0 0 0 0 0 0 0 0 0 0 0 0 0 0 0 0 0 0 0 0 0 0 0 0 0 0 0 0 0 0 0 0 0 0 0 0 0 0 0 0 0 0 0 0 0 0 0 0 0 0 0 0 0 0 0 0 0 0 0 0 0 0 0 0 0 0 0 0 0 0 0 0 0 0 0 0 0 0 0 0 0 0 0 0 0 0 0 0 0 0 0 0 0 0 0 0 0 0 0 0 0 0 0 0 0 0 0 0 0 0 0 0 0 0 0 0 0 0 0 0 0 0 0 0 0 0 0 0 0 0 0 0 0 0 0 0 0 0 0 0 0 0 0 0 0 0 0 0 0 0 0 0 0 0 0 0 0 0 0 0 0 0 0 0 0 0 0 0 0 0 0 0 0 0 0 0 0 0 0 0 0 0 0 0 0 0 0 0 0 0 0 0 0 0 0 0 0 0 0 0 0 0 0 0 0 0 0 0 0 0 0 0 0 0 0 0 0 0 0 0 0 0 0 0 0 0 0 0 0 0 0 0 0 0 0 0 0 0 0 0 0 0 0 0 0 0 0 0 0 0 0 0 0 0 0 0 0 0 0 0 0 0 0 0 0 0 0 0 0 0 0 0 0 0 0 0 0 0 0 0 0 0 0 0 0 0 0 0 0 0 0 0 0 0 0 0 0 0 0 0 0 0 0 0 0 0 0 0 0 0 0 0 0 0 0 0 0 0 0 0 0 0 0 0 0 0 0 0 0 0 0 0 0 0 0 0 0 0 0 0 0 0 0 0 0 0 0 0 0 0 0 0 0 0 0 0 0 0 0 0 0 0 0 0 0 0 0 0 0 0 0 0 0 0 0 0 0 0 0 0 0 0 0 0 0 0 0 0 0 0 0 0 0 0 0 0 0 0 0 0 0 0 0 0 0 0 0 0 0 0 0 0 0 0 0 0 0 0 0 0 0 0 0 0 0 0 0 0 0 0 0 0 0 0 0 0 0 0 0 0 0 0 0 0 0 0 0 0 0 0 0 0 0 0 0 0 0 0 0 0 0 0 0 0 0 0 0 0 0 0 0 0 0 0 0 0 0 0 0 0 0 0 0 0 0 0 0 0 0 0 0 0 0 0 0 0 0 0 0 0 0 0 0 0 0 0 0 0 0 0 0 0 0 0 0 0 0 0 0 0 0 0 0 0 0 0 0 0 0 0 0 0 0 0 0 0 0 0 0 0 0 0 0 0 0 0 0 0 0 0 0 0 0 0 0 0 0 0 0 0 0 0 0 0 0 0 0 0 0 0 0 0 0 0 0 0 0 0 0 0 0 0 0 0 0 0 0 0 0 0 0 0 0 0 0 0 0 0 0 0 0 0 0 0 0 0 0 0 0 0 0 0 0 0 0 0 0 0 0 0 0 0 0 0 0 0 0 0 0 0 0 0 0 0 0 0 0 0 0 0 0 0 0 0 0 0 0 0 0 0 0 0 0 0 0 0 0 0 0 0 0 0 0 0 0 0 0 0 0 0 0 0 0 0 0 0 0 0 0 0 0 0 0 0 0 0 0 0 0 0 0 0 0 0 0 0 0 0 0 0 0 0 0 0 0 0 0 0 0 0 0 0 0 0 0 0 0 0 0 0 0 0 0 0 0 0 0 0 0 0 0 0 0 0 0 0 0 0 0 0 0 0 0 0 0 0 0 0 0 0 0 0 0 0 0 0 0 0 0 0 0 0 0 0 0 0 0 0 0 0 0 0 0 0 0 0 0 0 0 0 0 0 0 0 0 0 0 0 0 0 0 0 0 0 0 0 0 0 0 0 0 0 0 0 0 0 0 0 0 0 0 0 0 0 0 0 0 0 0 0 0 0 0 0 0 0 0 0 0 0 0 0 0 0 0 0 0 0 0 0 0 0 0 0 0 0 0 0 0 0 0 0 0 0 0 0 0 0 0 0 0 0 0 0 0 0 0 0 0 0 0 0 0 0 0 0 0 0 0 0 0 0 0 0 0 0 0 0 0 0 0 0 0 0 0 0 0 0 0 0 0 0 0 0 0 0 0 0 0 0 0 0 0 0 0 0 0 0 0 0 0 0 0 0 0 0 0 0 0 0 0 0 0 0 0 0 0 0 0 0 0 0 0 0 0 0 0 0 0 0 0 0 0 0 0 0 0 0 0 0 0 0 0 0 0 0 0 0 0 0 0 0 0 0 0 0 0 0 0 0 0 0 0 0 0 0 0 0 0 0 0 0 0 0 0 0 0 0 0 0 0 0 0 0 0 0 0 0 0 0 0 0 0 0 0 0 0 0 0 0 0 0 0 0 0 0 0 0 0 0 0 0 0 0 0 0 0 0 0 0 0 0 0 0 0 0 0 0 0 0 0 0 0 0 0 0 0 0 0 0 0 0 0 0 0 0 0 0 0 0 0 0 0 0 0 0 0 0 0 0 0 0 0 0 0 0 0 0 0 0 0 0 0 0 0 0 0 0 0 0 0 0 0 0 0 0 0 0 0 0 0 0 0 0 0 0 0 0 0 0 0 0 0 0 0 0 0 0 0 0 0 0 0 0 0 0 0 0 0 0 0 0 0 0 0 0 0 0 0 0 0 0 0 0 0 0 0 0 0 0 0 0 0 0 0 0 0 0 0 0 0 0 0 0 0 0 0 0 0 0 0 0 0 0 0 0 0 0 0 0 0 0 0 0 0 0 0 0 0 0 0 0 0 0 0 0 0 0 0 0 0 0 0 0 0 0 0 0 0 0 0 0 0 0 0 0 0 0 0 0 0 0 0 0 0 0 0 0 0 0 0 0 0 0 0 0 0 0 0 0 0 0 0 0 0 0 0 0 0 0 0 0 0 0 0 0 0 0 0 0 0 0 0 0 0 0 0 0 0 0 0 0 0 0 0 0 0 0 0 0 0 0 0 0 0 0 0 0 0 0 0 0 0 0 0 0 0 0 0 0 0 0 0 0 0 0 0 SP60 Bacteria;Firmicutes;Clostridia;Clostridiales;Lachnospiraceae_[XIV];Lachnoanaerobaculum;umeaense 0 9 9 0 2 189 12 24 2 4 6 78 183 13 38 13 6 6 0 1 3 5 1 88 32 4 0 1 101 54 1480 11 32 7 0 5 9 14 1 41 40 9 0 47 2 1996 2 1 8 1 8 3 2 20 1 0 17 8 0 54 1 1 0 5 2 26 7 6 72 4 66 5 3 13 6 122 1 3 9 6 3 0 8 10 2 7 5 9 0 64 3 1 40 21 0 11 88 23 31 5 4 11 0 134 11 3 35 16 1334 3 181 17 4 4 4 0 27 8 14 0 5 8 36 5 1 51 45 1 0 337 2 83 1 0 13 30 0 2 2 411 1 0 62 4 0 4 45 42 0 6 3 2 9 4 0 15 6 0 24 7 38 10 2 6 1 7 22 6 4 1 0 0 150 14 0 0 4 2 0 0 1 6 494 4 0 1 2 0 0 40 0 22 5 0 130 0 0 0 2 3 12 18 25 100 3 5 6 26 5 1 2 0 1 1 2 0 4 45 1 6 53 12 40 25 5 12 4 20 5 13 35 4 7 1 3 332 17 37 1 102 0 0 1 22 14 5 14 0 15 0 69 4 3 0 0 2 0 1 1 0 11 19 2 3 14 0 3 30 0 0 0 0 0 0 0 0 0 0 0 0 0 0 0 0 0 0 0 0 0 0 0 0 0 0 0 0 0 0 0 0 0 0 0 0 0 0 0 0 0 0 0 0 0 0 0 0 0 0 0 0 0 0 0 0 0 0 0 0 0 0 0 0 0 0 0 0 0 0 0 0 0 0 0 0 0 0 0 0 0 0 0 0 0 0 0 0 0 0 0 0 0 0 0 0 0 0 0 0 0 0 0 0 0 0 0 0 0 0 0 0 0 0 0 0 0 0 0 0 0 0 0 0 0 0 0 0 0 0 0 0 0 0 0 0 0 0 0 0 0 0 0 0 0 0 0 0 0 0 0 0 0 0 0 0 0 0 0 0 0 0 0 0 0 0 0 0 0 0 0 0 0 0 0 0 0 0 0 0 0 0 0 0 0 0 0 0 0 0 0 0 0 0 0 0 0 0 0 0 0 0 0 0 0 0 0 0 0 0 0 0 0 0 0 0 0 0 0 0 0 0 0 0 0 0 0 0 0 0 0 0 0 0 0 0 0 0 0 0 0 0 0 0 0 0 0 0 0 0 0 0 0 0 0 0 0 0 0 0 0 0 0 0 0 0 0 0 0 0 0 0 0 0 0 0 0 0 0 0 0 0 0 0 0 0 0 0 0 0 0 0 0 0 0 0 0 0 0 0 0 0 0 0 0 0 0 0 0 0 0 0 0 0 0 0 0 0 0 0 0 0 0 0 0 0 0 0 0 0 0 0 0 0 0 0 0 0 0 0 0 0 0 0 0 0 0 0 0 0 0 0 0 0 0 0 0 0 0 0 0 0 0 0 0 0 0 0 0 0 0 0 0 0 0 0 0 0 0 0 0 0 0 0 0 0 0 0 0 0 0 0 0 0 0 0 0 0 0 0 0 0 0 0 0 0 0 0 0 0 0 0 0 0 0 0 0 0 0 0 0 0 0 0 0 0 0 0 0 0 0 0 0 0 0 0 0 0 0 0 0 0 0 0 0 0 0 0 0 0 0 0 0 0 0 0 0 0 0 0 0 0 0 0 0 0 0 0 0 0 0 0 0 0 0 0 0 0 0 0 0 0 0 0 0 0 0 0 0 0 0 0 0 0 0 0 0 0 0 0 0 0 0 0 0 0 0 0 0 0 0 0 0 0 0 0 0 0 0 0 0 0 0 0 0 0 0 0 0 0 0 0 0 0 0 0 0 0 0 0 0 0 0 0 0 0 0 0 0 0 0 0 0 0 0 0 0 0 0 0 0 0 0 0 0 0 0 0 0 0 0 0 0 0 0 0 0 0 0 0 0 0 0 0 0 0 0 0 0 0 0 0 0 0 0 0 0 0 0 0 0 0 0 0 0 0 0 0 0 0 0 0 0 0 0 0 0 0 0 0 0 0 0 0 0 0 0 0 0 0 0 0 0 0 0 0 0 0 0 0 0 0 0 0 0 0 0 0 0 0 0 0 0 0 0 0 0 0 0 0 0 0 0 0 0 0 0 0 0 0 0 0 0 0 0 0 0 0 0 0 0 0 0 0 0 0 0 0 0 0 0 0 0 0 0 0 0 0 0 0 0 0 0 0 0 0 0 0 0 0 0 0 0 0 0 0 0 0 0 0 0 0 0 0 0 0 0 0 0 0 0 0 0 0 0 0 0 0 0 0 0 0 0 0 0 0 0 0 0 0 0 0 0 0 0 0 0 0 0 0 0 0 0 0 0 0 0 0 0 0 0 0 0 0 0 0 0 0 0 0 0 0 0 0 0 0 0 0 0 0 0 0 0 0 0 0 0 0 0 0 0 0 0 0 0 0 0 0 0 0 0 0 0 0 0 0 0 0 0 0 0 0 0 0 0 0 0 0 0 0 0 0 0 0 0 0 0 0 0 0 0 0 0 0 0 0 0 0 0 0 0 0 0 0 0 0 0 0 0 0 0 0 0 0 0 0 0 0 0 0 0 0 0 0 0 0 0 0 0 0 0 0 0 0 0 0 0 0 0 0 0 0 0 0 0 0 0 0 0 0 0 0 0 0 0 0 0 0 0 0 0 0 0 0 0 0 0 0 0 0 0 0 0 0 0 0 0 0 0 0 0 0 0 0 0 0 0 0 0 0 0 0 0 0 0 0 0 0 0 0 0 0 0 0 0 0 0 0 0 0 0 0 0 0 0 0 0 0 0 0 0 0 0 0 0 0 0 0 0 0 0 0 0 0 0 0 0 0 0 0 0 0 0 0 0 0 0 0 0 0 0 0 0 0 0 0 0 0 0 0 0 0 0 0 0 0 0 0 0 0 0 0 0 0 0 0 0 0 0 0 0 0 0 0 0 0 0 0 0 0 0 0 0 0 0 0 0 0 0 0 0 0 0 0 0 0 0 0 0 0 0 0 0 0 0 0 0 0 0 0 0 0 0 0 0 0 0 0 0 0 0 0 0 0 0 0 0 0 0 0 0 0 0 0 0 0 0 0 0 0 0 0 0 0 0 0 0 0 0 0 0 0 0 0 0 0 0 0 0 0 0 0 0 0 0 0 0 0 0 0 0 0 0 0 0 0 0 0 0 0 0 0 0 0 0 0 0 0 0 0 0 0 0 0 0 0 0 0 0 0 0 0 0 0 0 0 0 0 0 0 0 0 0 0 0 0 0 0 0 0 0 0 0 0 0 0 0 0 0 0 0 0 0 0 0 0 0 0 0 0 0 0 0 0 0 0 0 0 0 0 0 0 0 0 0 0 0 0 0 0 0 0 0 0 0 0 0 0 0 0 0 0 0 0 0 0 0 0 0 0 0 0 0 0 0 0 0 0 0 0 0 0 0 0 0 0 0 0 0 0 0 0 0 0 0 0 0 0 0 0 0 0 0 0 0 0 0 0 0 0 0 0 0 0 0 0 0 0 0 0 0 0 0 0 0 0 0 0 0 0 0 0 0 0 0 0 0 0 0 0 0 0 0 0 0 0 0 0 0 0 0 0 0 0 0 0 0 0 0 0 0 0 0 0 0 0 0 0 0 0 0 0 0 0 0 0 0 0 0 0 0 0 0 0 0 0 0 0 0 0 0 0 0 0 0 0 0 0 0 0 0 0 0 0 0 0 0 0 0 0 0 0 0 0 0 0 0 0 0 0 0 0 0 0 0 0 0 0 0 0 0 0 0 0 0 0 0 0 0 0 0 0 0 0 0 0 0 0 0 0 0 0 0 0 0 0 0 0 0 0 0 0 0 0 0 0 0 0 0 0 0 0 0 0 0 0 0 0 0 0 0 0 0 0 0 0 0 0 0 0 0 0 0 0 0 0 0 0 0 0 0 0 0 0 0 0 0 0 0 0 0 0 0 0 0 0 0 0 0 0 0 0 0 0 0 0 0 0 0 0 0 0 0 0 0 0 0 0 0 0 0 0 0 0 0 0 0 0 0 0 0 0 0 0 0 0 0 0 0 0 0 0 0 0 0 0 0 0 0 0 0 0 0 0 0 0 0 0 0 0 0 0 0 0 0 0 SP61 Bacteria;Firmicutes;Clostridia;Clostridiales;Lachnospiraceae_[XIV];Lachnoanaerobaculum;gingivalis 17 214 4 14 22 128 3 1077 4 29 173 39 363 24 14 61 6 15 452 1145 4 2 7 39 87 163 2 134 41 51 327 216 25 26 250 43 5 1 3 15 741 53 91 83 0 355 4 17 0 47 207 56 141 14 95 39 154 30 6 106 0 3 24 42 945 24 7 763 20 106 0 111 9 19 0 125 89 94 71 24 4668 141 31 156 682 227 205 22 118 251 0 0 26 23 23 272 18 61 34 91 62 35 6 375 5 31 76 24 447 3 0 38 2 83 91 13 168 267 363 75 1 100 95 120 143 109 69 111 248 5 322 523 7 18 180 168 1059 15 19 86 1 1 9 24 2 118 188 263 218 62 40 175 29 119 70 185 282 20 35 165 288 16 45 4 27 8 65 185 362 84 2 61 73 158 81 21 162 127 9 56 84 25 69 689 159 241 521 72 296 101 285 35 435 242 25 72 1846 244 176 131 14 441 67 561 239 27 21 1 13 9 107 109 130 38 53 179 6 177 6 128 84 563 31 25 162 165 537 84 12 386 209 13 76 5 90 274 160 103 477 119 15 305 543 116 9 44 135 129 1510 32 283 131 114 17 6 8 271 58 3 95 32 0 7 61 54 31 45 13 0 0 0 0 0 0 0 0 0 0 0 0 0 0 0 0 0 0 0 0 0 0 0 0 0 0 0 0 0 0 0 0 0 0 0 0 0 0 0 0 0 0 0 0 0 0 0 0 0 0 0 0 0 0 0 0 0 0 0 0 0 0 0 0 0 0 0 0 0 0 0 0 0 0 0 0 0 0 0 0 0 0 0 0 0 0 0 0 0 0 0 0 0 0 0 0 0 0 0 0 0 0 0 0 0 0 0 0 0 0 0 0 0 0 0 0 0 0 0 0 0 0 0 0 0 0 0 0 0 0 0 0 0 0 0 0 0 0 0 0 0 0 0 0 0 0 0 0 0 0 0 0 0 0 0 0 0 0 0 0 0 0 0 0 0 0 0 0 0 0 0 0 0 0 0 0 0 0 0 0 0 0 0 0 0 0 0 0 0 0 0 0 0 0 0 0 0 0 0 0 0 0 0 0 0 0 0 0 0 0 0 0 0 0 0 0 0 0 0 0 0 0 0 0 0 0 0 0 0 0 0 0 0 0 0 0 0 0 0 0 0 0 0 0 0 0 0 0 0 0 0 0 0 0 0 0 0 0 0 0 0 0 0 0 0 0 0 0 0 0 0 0 0 0 0 0 0 0 0 0 0 0 0 0 0 0 0 0 0 0 0 0 0 0 0 0 0 0 0 0 0 0 0 0 0 0 0 0 0 0 0 0 0 0 0 0 0 0 0 0 0 0 0 0 0 0 0 0 0 0 0 0 0 0 0 0 0 0 0 0 0 0 0 0 0 0 0 0 0 0 0 0 0 0 0 0 0 0 0 0 0 0 0 0 0 0 0 0 0 0 0 0 0 0 0 0 0 0 0 0 0 0 0 0 0 0 0 0 0 0 0 0 0 0 0 0 0 0 0 0 0 0 0 0 0 0 0 0 0 0 0 0 0 0 0 0 0 0 0 0 0 0 0 0 0 0 0 0 0 0 0 0 0 0 0 0 0 0 0 0 0 0 0 0 0 0 0 0 0 0 0 0 0 0 0 0 0 0 0 0 0 0 0 0 0 0 0 0 0 0 0 0 0 0 0 0 0 0 0 0 0 0 0 0 0 0 0 0 0 0 0 0 0 0 0 0 0 0 0 0 0 0 0 0 0 0 0 0 0 0 0 0 0 0 0 0 0 0 0 0 0 0 0 0 0 0 0 0 0 0 0 0 0 0 0 0 0 0 0 0 0 0 0 0 0 0 0 0 0 0 0 0 0 0 0 0 0 0 0 0 0 0 0 0 0 0 0 0 0 0 0 0 0 0 0 0 0 0 0 0 0 0 0 0 0 0 0 0 0 0 0 0 0 0 0 0 0 0 0 0 0 0 0 0 0 0 0 0 0 0 0 0 0 0 0 0 0 0 0 0 0 0 0 0 0 0 0 0 0 0 0 0 0 0 0 0 0 0 0 0 0 0 0 0 0 0 0 0 0 0 0 0 0 0 0 0 0 0 0 0 0 0 0 0 0 0 0 0 0 0 0 0 0 0 0 0 0 0 0 0 0 0 0 0 0 0 0 0 0 0 0 0 0 0 0 0 0 0 0 0 0 0 0 0 0 0 0 0 0 0 0 0 0 0 0 0 0 0 0 0 0 0 0 0 0 0 0 0 0 0 0 0 0 0 0 0 0 0 0 0 0 0 0 0 0 0 0 0 0 0 0 0 0 0 0 0 0 0 0 0 0 0 0 0 0 0 0 0 0 0 0 0 0 0 0 0 0 0 0 0 0 0 0 0 0 0 0 0 0 0 0 0 0 0 0 0 0 0 0 0 0 0 0 0 0 0 0 0 0 0 0 0 0 0 0 0 0 0 0 0 0 0 0 0 0 0 0 0 0 0 0 0 0 0 0 0 0 0 0 0 0 0 0 0 0 0 0 0 0 0 0 0 0 0 0 0 0 0 0 0 0 0 0 0 0 0 0 0 0 0 0 0 0 0 0 0 0 0 0 0 0 0 0 0 0 0 0 0 0 0 0 0 0 0 0 0 0 0 0 0 0 0 0 0 0 0 0 0 0 0 0 0 0 0 0 0 0 0 0 0 0 0 0 0 0 0 0 0 0 0 0 0 0 0 0 0 0 0 0 0 0 0 0 0 0 0 0 0 0 0 0 0 0 0 0 0 0 0 0 0 0 0 0 0 0 0 0 0 0 0 0 0 0 0 0 0 0 0 0 0 0 0 0 0 0 0 0 0 0 0 0 0 0 0 0 0 0 0 0 0 0 0 0 0 0 0 0 0 0 0 0 0 0 0 0 0 0 0 0 0 0 0 0 0 0 0 0 0 0 0 0 0 0 0 0 0 0 0 0 0 0 0 0 0 0 0 0 0 0 0 0 0 0 0 0 0 0 0 0 0 0 0 0 0 0 0 0 0 0 0 0 0 0 0 0 0 0 0 0 0 0 0 0 0 0 0 0 0 0 0 0 0 0 0 0 0 0 0 0 0 0 0 0 0 0 0 0 0 0 0 0 0 0 0 0 0 0 0 0 0 0 0 0 0 0 0 0 0 0 0 0 0 0 0 0 0 0 0 0 0 0 0 0 0 0 0 0 0 0 0 0 0 0 0 0 0 0 0 0 0 0 0 0 0 0 0 0 0 0 0 0 0 0 0 0 0 0 0 0 0 0 0 0 0 0 0 0 0 0 0 0 0 0 0 0 0 0 0 0 0 0 0 0 0 0 0 0 0 0 0 0 0 0 0 0 0 0 0 0 0 0 0 0 0 0 0 0 0 0 0 0 0 0 0 0 0 0 0 0 0 0 0 0 0 0 0 0 0 0 0 0 0 0 0 0 0 0 0 0 0 0 0 0 0 0 0 0 0 0 0 0 0 0 0 0 0 0 0 0 0 0 0 0 0 0 0 0 0 0 0 0 0 0 0 0 0 0 0 0 0 0 0 0 0 0 0 0 0 0 0 0 0 0 0 0 0 0 0 0 0 0 0 0 0 0 0 0 0 0 0 0 0 0 0 0 0 0 0 0 0 0 0 0 0 0 0 0 0 0 0 0 0 0 0 0 0 0 0 0 0 0 0 0 0 0 0 0 0 0 0 0 0 0 0 0 0 0 0 0 0 0 0 0 0 0 0 0 0 0 0 0 0 0 0 0 0 0 0 0 0 0 0 0 0 0 0 0 0 0 0 0 0 0 0 0 0 0 0 0 0 0 0 0 0 0 0 0 0 0 0 0 0 0 0 0 0 0 0 0 0 0 0 0 0 0 0 0 0 0 0 0 0 0 0 0 0 0 0 0 0 0 0 0 0 0 0 0 0 0 0 0 0 0 0 0 0 0 0 0 0 0 0 0 0 0 0 0 0 0 0 0 0 0 0 0 0 0 0 0 0 0 0 0 0 0 0 0 0 0 0 0 0 0 0 0 0 0 0 0 0 0 0 0 0 0 0 0 0 0 0 0 0 0 0 0 0 0 0 0 0 0 0 0 0 0 0 0 0 0 0 0 0 0 0 0 0 SP62 Bacteria;Fusobacteria;Fusobacteriia;Fusobacteriales;Leptotrichiaceae;Leptotrichia;trevisanii 0 12 0 0 0 1 5 6 0 0 0 3 59 0 0 0 22 16 0 0 0 0 2 5 1 0 21 0 0 0 0 2 0 7 0 0 1 0 0 0 0 0 0 0 0 0 0 0 0 0 2 0 0 7 0 0 15 13 3 0 2 1 0 0 0 0 0 1 6 0 8 1 0 0 0 0 0 0 0 0 0 0 0 1 0 0 0 0 0 0 0 0 0 1 0 0 0 15 7 0 0 1 0 0 0 4 0 0 0 2 0 3 0 1 0 0 0 0 0 0 0 0 0 0 3 0 0 0 0 25 0 0 0 0 2 1 0 0 0 0 0 0 13 0 0 0 2 19 0 0 0 0 5 0 0 0 0 0 0 0 2 0 0 2 0 0 0 0 0 0 0 0 0 8 0 0 0 0 0 0 0 0 7 0 1 0 0 0 0 0 0 0 0 0 1 0 0 0 0 4 6 0 0 0 0 0 0 3 0 0 0 0 0 0 0 0 0 1 0 0 0 0 0 0 8 0 0 0 0 0 0 0 0 0 0 1 0 1 0 5 0 0 0 0 0 0 0 0 0 0 1 0 1 1 0 0 0 0 0 0 0 0 0 0 0 0 0 0 0 8 4 0 0 31 0 0 0 0 15 7 65 16 0 1 2 1 1 0 0 5 5 1 0 0 29 6 0 0 0 9 2 0 6 1 0 0 1 0 3 0 14 36 0 0 0 0 0 25 1 0 0 0 3 0 0 0 0 0 1 0 0 0 0 0 1 0 1 2 0 0 0 0 0 21 0 0 0 5 3 0 0 0 0 0 1 0 0 3 2 0 0 1 0 0 0 0 0 0 0 0 0 0 0 6 0 0 0 0 0 1 0 0 0 1 0 1 1 14 0 0 0 2 0 25 0 4 0 0 1 33 0 0 0 2 36 0 0 0 0 0 0 12 0 0 0 0 31 0 43 0 0 0 1 2 0 0 4 0 1 0 0 0 8 50 0 3 0 0 0 0 0 0 0 0 0 0 0 0 18 19 0 0 2 0 0 1 0 24 0 54 5 0 0 1 0 8 0 7 0 0 1 14 0 9 7 0 0 0 5 32 133 0 0 2 31 6 3 91 1 14 8 1 0 66 171 0 0 1 0 5 3 1 0 0 2 0 0 3 0 0 2 0 0 0 0 0 3 4 0 0 0 1 0 0 8 4 0 0 0 29 0 0 0 4 1 0 1 2 0 0 2 8 1 0 5 0 3 1 0 0 42 1 0 0 1 25 0 2 0 9 2 0 0 4 0 2 0 0 0 0 3 0 1 0 0 1 9 0 1 0 0 2 0 0 1 0 0 0 0 0 0 0 0 0 0 2 0 0 0 1 0 0 0 4 1 0 0 0 1 26 6 29 1 0 0 0 0 0 2 3 0 2 0 3 0 0 1 0 0 8 0 0 0 0 15 18 0 0 28 0 1 3 0 1 0 0 0 4 3 0 0 0 26 3 2 67 5 0 0 1 44 0 67 17 1 15 8 0 0 0 0 0 0 2 0 0 0 0 0 0 0 30 16 0 0 8 0 0 1 2 0 0 0 0 0 1 0 0 0 0 0 2 1 3 0 0 1 0 0 2 4 0 3 1 0 0 0 0 5 0 1 2 14 2 0 0 2 5 9 2 254 0 0 13 1 26 2 0 29 21 0 399 27 0 2 0 1 15 134 0 5 1 65 0 0 7 0 0 0 26 4 30 0 0 1 0 1 0 0 15 7 2 36 28 0 0 0 0 1 3 0 0 0 9 0 1 6 0 0 0 0 0 0 0 0 1 25 0 0 0 0 0 0 0 0 0 3 0 2 0 1 0 0 0 3 17 0 2 4 1 0 0 0 0 0 0 0 0 0 0 1 1 0 0 7 0 0 33 2 2 0 0 9 0 0 0 0 0 2 0 0 5 1 4 3 0 0 0 2 0 0 0 0 0 0 0 1 20 0 0 11 93 1 0 0 0 0 0 0 0 0 1 0 0 1 0 0 0 3 0 13 0 0 0 10 0 0 0 1 1 0 0 1 0 4 0 12 6 92 80 1 0 0 3 58 5 0 0 2 28 1 5 2 0 1 0 0 0 0 0 33 11 5 54 0 0 1 3 0 1 4 0 4 0 0 15 5 2 1 0 3 0 45 23 0 5 11 1 0 0 0 1 0 17 0 3 0 4 12 0 22 6 0 0 0 0 15 2 0 30 1 0 0 2 0 3 0 8 0 2 33 0 5 10 0 0 0 8 0 0 0 17 0 0 1 1 0 0 1 0 0 0 0 0 1 0 0 0 0 0 0 0 0 1 5 0 18 5 4 0 7 14 0 18 0 0 0 3 2 0 45 3 0 2 3 0 0 0 0 1 65 18 0 0 0 0 87 10 0 0 0 0 1 0 3 2 0 0 3 0 19 0 0 0 7 52 12 0 1 0 0 14 0 0 4 4 8 0 2 0 1 12 1 5 0 1 1 6 0 0 0 0 1 0 0 6 0 0 0 8 8 0 0 0 0 1 0 0 2 1 1 0 4 19 6 0 3 3 0 87 0 0 0 1 1 0 0 4 0 0 0 0 0 0 0 0 0 17 0 0 7 6 0 2 3 0 0 0 3 0 0 3 0 2 4 0 1 8 0 0 0 0 18 2 10 1 0 0 0 0 0 0 0 0 0 0 0 4 0 18 0 0 22 3 13 0 0 11 0 31 8 0 16 1 0 0 0 20 15 0 1 7 0 8 2 0 0 259 18 1 0 2 6 0 3 0 0 0 6 18 0 39 31 0 2 1 0 0 0 0 0 6 1 0 0 0 0 52 6 0 0 0 0 5 41 0 1 44 0 30 105 0 0 8 2 0 16 15 0 2 0 0 0 11 2 0 0 6 0 0 0 0 3 0 0 0 15 0 0 0 6 27 0 28 6 0 4 0 0 2 21 3 0 5 1 0 0 0 0 2 1 8 0 2 5 0 0 0 0 0 0 0 0 0 0 13 0 0 0 1 0 0 6 1 1 121 2 0 333 1 4 0 142 10 0 2 23 0 0 0 1 0 1 2 9 0 59 0 0 31 0 0 3 0 13 25 0 2 20 2 0 0 0 0 7 1 1 27 347 2 0 4 0 1 0 0 0 0 3 6 0 24 14 0 0 0 0 17 0 0 1 0 0 0 0 0 0 0 0 0 0 0 18 0 0 21 0 2 0 0 1 1 0 0 0 0 0 0 0 0 28 87 0 0 0 4 0 5 0 0 17 7 1 9 121 0 0 2 11 0 74 96 0 1 0 0 1 10 2 1 0 3 8 7 0 22 3 0 1 0 0 4 7 0 0 43 3 0 0 1 0 10 14 0 0 14 1 0 0 11 0 0 2 0 0 3 0 0 7 1 0 112 1 6 1 22 6 0 0 42 38 0 0 0 0 0 0 0 0 68 1 0 23 0 0 9 23 0 0 1 0 0 11 0 0 2 27 0 1 0 4 0 4 0 1 0 0 0 3 0 0 12 0 15 0 30 59 0 4 2 12 1 0 0 2 0 0 1 5 0 0 8 0 0 2 1 5 0 97 0 0 0 0 9 0 0 33 17 0 0 9 15 0 12 7 0 0 4 0 0 42 8 0 0 0 0 0 19 0 0 73 0 0 5 2 1 0 2 9 0 2 0 0 13 20 0 0 17 2 0 0 9 0 1 21 0 0 0 1 0 0 0 0 0 8 5 0 0 0 0 0 0 1 0 16 4 0 0 0 0 21 0 9 0 265 146 0 171 35 0 1 8 0 0 0 0 0 0 0 0 17 0 0 1 1 0 1 1 10 49 0 2 1 0 0 0 0 1 3 0 100 1 0 5 3 1 0 0 0 0 3 1 0 8 0 0 203 17 0 30 74 2 0 0 84 0 0 0 6 1 0 9 6 2 0 3 5 0 2 0 0 26 3 15 0 0 0 0 1 36 0 93 0 0 754 2 2 28 0 0 0 0 0 46 3 0 1 12 0 0 2 0 3 0 15 0 19 20 0 1 3 0 24 8 0 0 18 3 0 35 22 0 0 0 0 0 23 2 0 0 0 6 0 0 0 0 1 0 0 2 1 0 0 1 0 0 3 1 0 0 0 0 0 0 SP63 Bacteria;Firmicutes;Bacilli;Lactobacillales;Streptococcaceae;Streptococcus;cristatus_clade_578 34 1331 179 249 257 5099 1133 151 8613 4843 146 2704 296 1152 628 419 779 2321 46 98 145 15 446 1842 974 427 10467 134 782 325 525 129 1687 381 661 368 260 1566 418 22278 1779 3875 1028 23 200 1 452 53 3169 2929 738 77 293 1186 1045 19 95 833 3064 197 11838 400 273 5 350 15333 19998 309 1052 32 921 1342 1009 773 3320 530 2098 443 196 380 835 1091 976 2307 403 298 1350 2646 9589 22 1529 212 6597 980 1913 245 400 688 2071 2317 1854 3723 940 0 9002 4406 20 157 195 502 408 1073 970 347 2196 3651 118 149 73 977 5 339 31 8 502 9830 249 1651 1377 562 122 747 41 435 1162 42 508 277 237 2034 2686 3014 5575 1042 17768 231 407 4363 1210 154 320 16 143 428 1101 67 340 636 902 38 2059 16 445 20 195 1844 753 650 1042 1825 3 3 1685 9356 26 77 266 213 224 3594 562 3013 1429 226 1447 71 149 81 3 114 291 98 3333 172 288 389 27 142 5222 364 2636 168 773 0 306 42 17409 440 301 0 313 283 423 70 140 2637 4041 99 3450 287 9013 1555 1186 705 472 336 534 7792 623 13 141 4856 636 6218 2 282 316 734 959 1604 1167 1233 76 1634 349 125 838 190 72 21 128 103 3 78 9 29 70 9 40 239 246 19 131 100 169 196 82 285 0 0 0 0 0 0 0 0 0 0 0 0 0 0 0 0 0 0 0 0 0 0 0 0 0 0 0 0 0 0 0 0 0 0 0 0 0 0 0 0 0 0 0 0 0 0 0 0 0 0 0 0 0 0 0 0 0 0 0 0 0 0 0 0 0 0 0 0 0 0 0 0 0 0 0 0 0 0 0 0 0 0 0 0 0 0 0 0 0 0 0 0 0 0 0 0 0 0 0 0 0 0 0 0 0 0 0 0 0 0 0 0 0 0 0 0 0 0 0 0 0 0 0 0 0 0 0 0 0 0 0 0 0 0 0 0 0 0 0 0 0 0 0 0 0 0 0 0 0 0 0 0 0 0 0 0 0 0 0 0 0 0 0 0 0 0 0 0 0 0 0 0 0 0 0 0 0 0 0 0 0 0 0 0 0 0 0 0 0 0 0 0 0 0 0 0 0 0 0 0 0 0 0 0 0 0 0 0 0 0 0 0 0 0 0 0 0 0 0 0 0 0 0 0 0 0 0 0 0 0 0 0 0 0 0 0 0 0 0 0 0 0 0 0 0 0 0 0 0 0 0 0 0 0 0 0 0 0 0 0 0 0 0 0 0 0 0 0 0 0 0 0 0 0 0 0 0 0 0 0 0 0 0 0 0 0 0 0 0 0 0 0 0 0 0 0 0 0 0 0 0 0 0 0 0 0 0 0 0 0 0 0 0 0 0 0 0 0 0 0 0 0 0 0 0 0 0 0 0 0 0 0 0 0 0 0 0 0 0 0 0 0 0 0 0 0 0 0 0 0 0 0 0 0 0 0 0 0 0 0 0 0 0 0 0 0 0 0 0 0 0 0 0 0 0 0 0 0 0 0 0 0 0 0 0 0 0 0 0 0 0 0 0 0 0 0 0 0 0 0 0 0 0 0 0 0 0 0 0 0 0 0 0 0 0 0 0 0 0 0 0 0 0 0 0 0 0 0 0 0 0 0 0 0 0 0 0 0 0 0 0 0 0 0 0 0 0 0 0 0 0 0 0 0 0 0 0 0 0 0 0 0 0 0 0 0 0 0 0 0 0 0 0 0 0 0 0 0 0 0 0 0 0 0 0 0 0 0 0 0 0 0 0 0 0 0 0 0 0 0 0 0 0 0 0 0 0 0 0 0 0 0 0 0 0 0 0 0 0 0 0 0 0 0 0 0 0 0 0 0 0 0 0 0 0 0 0 0 0 0 0 0 0 0 0 0 0 0 0 0 0 0 0 0 0 0 0 0 0 0 0 0 0 0 0 0 0 0 0 0 0 0 0 0 0 0 0 0 0 0 0 0 0 0 0 0 0 0 0 0 0 0 0 0 0 0 0 0 0 0 0 0 0 0 0 0 0 0 0 0 0 0 0 0 0 0 0 0 0 0 0 0 0 0 0 0 0 0 0 0 0 0 0 0 0 0 0 0 0 0 0 0 0 0 0 0 0 0 0 0 0 0 0 0 0 0 0 0 0 0 0 0 0 0 0 0 0 0 0 0 0 0 0 0 0 0 0 0 0 0 0 0 0 0 0 0 0 0 0 0 0 0 0 0 0 0 0 0 0 0 0 0 0 0 0 0 0 0 0 0 0 0 0 0 0 0 0 0 0 0 0 0 0 0 0 0 0 0 0 0 0 0 0 0 0 0 0 0 0 0 0 0 0 0 0 0 0 0 0 0 0 0 0 0 0 0 0 0 0 0 0 0 0 0 0 0 0 0 0 0 0 0 0 0 0 0 0 0 0 0 0 0 0 0 0 0 0 0 0 0 0 0 0 0 0 0 0 0 0 0 0 0 0 0 0 0 0 0 0 0 0 0 0 0 0 0 0 0 0 0 0 0 0 0 0 0 0 0 0 0 0 0 0 0 0 0 0 0 0 0 0 0 0 0 0 0 0 0 0 0 0 0 0 0 0 0 0 0 0 0 0 0 0 0 0 0 0 0 0 0 0 0 0 0 0 0 0 0 0 0 0 0 0 0 0 0 0 0 0 0 0 0 0 0 0 0 0 0 0 0 0 0 0 0 0 0 0 0 0 0 0 0 0 0 0 0 0 0 0 0 0 0 0 0 0 0 0 0 0 0 0 0 0 0 0 0 0 0 0 0 0 0 0 0 0 0 0 0 0 0 0 0 0 0 0 0 0 0 0 0 0 0 0 0 0 0 0 0 0 0 0 0 0 0 0 0 0 0 0 0 0 0 0 0 0 0 0 0 0 0 0 0 0 0 0 0 0 0 0 0 0 0 0 0 0 0 0 0 0 0 0 0 0 0 0 0 0 0 0 0 0 0 0 0 0 0 0 0 0 0 0 0 0 0 0 0 0 0 0 0 0 0 0 0 0 0 0 0 0 0 0 0 0 0 0 0 0 0 0 0 0 0 0 0 0 0 0 0 0 0 0 0 0 0 0 0 0 0 0 0 0 0 0 0 0 0 0 0 0 0 0 0 0 0 0 0 0 0 0 0 0 0 0 0 0 0 0 0 0 0 0 0 0 0 0 0 0 0 0 0 0 0 0 0 0 0 0 0 0 0 0 0 0 0 0 0 0 0 0 0 0 0 0 0 0 0 0 0 0 0 0 0 0 0 0 0 0 0 0 0 0 0 0 0 0 0 0 0 0 0 0 0 0 0 0 0 0 0 0 0 0 0 0 0 0 0 0 0 0 0 0 0 0 0 0 0 0 0 0 0 0 0 0 0 0 0 0 0 0 0 0 0 0 0 0 0 0 0 0 0 0 0 0 0 0 0 0 0 0 0 0 0 0 0 0 0 0 0 0 0 0 0 0 0 0 0 0 0 0 0 0 0 0 0 0 0 0 0 0 0 0 0 0 0 0 0 0 0 0 0 0 0 0 0 0 0 0 0 0 0 0 0 0 0 0 0 0 0 0 0 0 0 0 0 0 0 0 0 0 0 0 0 0 0 0 0 0 0 0 0 0 0 0 0 0 0 0 0 0 0 0 0 0 0 0 0 0 0 0 0 0 0 0 0 0 0 0 0 0 0 0 0 0 0 0 0 0 0 0 0 0 0 0 0 0 0 0 0 0 0 0 0 0 0 0 0 0 0 0 0 0 0 0 0 0 0 0 0 0 0 0 0 0 0 0 0 0 0 0 0 0 0 0 0 0 0 0 0 0 0 0 0 0 0 0 0 0 0 0 0 0 0 0 0 0 0 0 0 0 0 0 0 0 0 0 0 0 0 0 0 0 0 0 0 0 0 0 0 0 0 0 0 0 0 0 0 0 0 0 0 0 0 0 0 0 0 0 0 0 0 0 0 0 0 0 0 0 0 0 0 0 0 0 0 0 0 0 0 0 0 0 0 0 0 0 0 0 0 0 0 0 0 0 0 0 0 0 0 0 0 0 0 0 0 0 0 0 0 0 0 0 0 0 0 0 0 0 0 0 0 0 0 0 0 0 0 0 0 0 0 0 0 0 0 0 0 0 0 0 0 0 0 0 0 0 0 0 0 0 0 0 0 0 0 0 0 SP636 Bacteria;Firmicutes;Clostridia;Negativicutes;Veillonellaceae;Veillonella;tobetsuensis 0 2 0 0 0 52 0 1 0 0 0 0 375 16 0 1 22 8 597 846 0 0 1 0 0 0 0 0 0 0 95 0 3 0 0 0 0 0 0 0 0 0 17 0 0 356 0 0 0 118 0 0 0 0 0 0 0 0 0 0 0 0 0 0 0 0 0 0 50 111 0 0 0 0 1 65 0 0 0 0 0 0 0 6 0 0 0 0 0 0 0 2 0 0 0 0 0 0 11 0 0 0 0 0 0 15 0 0 135 0 0 0 0 0 0 0 252 0 0 93 0 0 0 0 2 0 1 0 0 0 0 132 0 0 0 17 753 0 1 23 0 2 0 0 0 0 0 0 0 0 0 0 0 0 0 108 824 0 0 0 0 0 32 0 0 0 0 0 17 0 0 0 0 2 0 0 58 57 0 0 0 0 309 0 1 261 145 0 8 0 0 11 0 0 0 0 0 0 1 11 0 148 0 0 0 0 4 0 0 0 0 0 0 1 0 28 0 0 0 0 0 0 0 0 0 0 544 0 0 6 0 1 109 0 1 1897 0 0 0 0 0 0 0 0 1 0 54 22 0 0 0 0 0 0 0 0 0 0 0 0 0 0 4 0 1 0 0 1 0 0 0 0 0 0 0 0 0 0 0 0 0 0 0 0 0 0 0 0 0 0 0 0 0 0 0 0 0 0 0 0 0 0 0 0 0 0 0 0 0 0 0 0 0 0 0 0 0 0 0 0 0 0 0 0 0 0 0 0 0 0 0 0 0 0 0 0 0 0 0 0 0 0 0 0 0 0 0 0 0 0 0 0 0 0 0 0 0 0 0 0 0 0 0 0 0 0 0 0 0 0 0 0 0 0 0 0 0 0 0 0 0 0 0 0 0 0 0 0 0 0 0 0 0 0 0 0 0 0 0 0 0 0 0 0 0 0 0 0 0 0 0 0 0 0 0 0 0 0 0 0 0 0 0 0 0 0 0 0 0 0 0 0 0 0 0 0 0 0 0 0 0 0 0 0 0 0 0 0 0 0 0 0 0 0 0 0 0 0 0 0 0 0 0 0 0 0 0 0 0 0 0 0 0 0 0 0 0 0 0 0 0 0 0 0 0 0 0 0 0 0 0 0 0 0 0 0 0 0 0 0 0 0 0 0 0 0 0 0 0 0 0 0 0 0 0 0 0 0 0 0 0 0 0 0 0 0 0 0 0 0 0 0 0 0 0 0 0 0 0 0 0 0 0 0 0 0 0 0 0 0 0 0 0 0 0 0 0 0 0 0 0 0 0 0 0 0 0 0 0 0 0 0 0 0 0 0 0 0 0 0 0 0 0 0 0 0 0 0 0 0 0 0 0 0 0 0 0 0 0 0 0 0 0 0 0 0 0 0 0 0 0 0 0 0 0 0 0 0 0 0 0 0 0 0 0 0 0 0 0 0 0 0 0 0 0 0 0 0 0 0 0 0 0 0 0 0 0 0 0 0 0 0 0 0 0 0 0 0 0 0 0 0 0 0 0 0 0 0 0 0 0 0 0 0 0 0 0 0 0 0 0 0 0 0 0 0 0 0 0 0 0 0 0 0 0 0 0 0 0 0 0 0 0 0 0 0 0 0 0 0 0 0 0 0 0 0 0 0 0 0 0 0 0 0 0 0 0 0 0 0 0 0 0 0 0 0 0 0 0 0 0 0 0 0 0 0 0 0 0 0 0 0 0 0 0 0 0 0 0 0 0 0 0 0 0 0 0 0 0 0 0 0 0 0 0 0 0 0 0 0 0 0 0 0 0 0 0 0 0 0 0 0 0 0 0 0 0 0 0 0 0 0 0 0 0 0 0 0 0 0 0 0 0 0 0 0 0 0 0 0 0 0 0 0 0 0 0 0 0 0 0 0 0 0 0 0 0 0 0 0 0 0 0 0 0 0 0 0 0 0 0 0 0 0 0 0 0 0 0 0 0 0 0 0 0 0 0 0 0 0 0 0 0 0 0 0 0 0 0 0 0 0 0 0 0 0 0 0 0 0 0 0 0 0 0 0 0 0 0 0 0 0 0 0 0 0 0 0 0 0 0 0 0 0 0 0 0 0 0 0 0 0 0 0 0 0 0 0 0 0 0 0 0 0 0 0 0 0 0 0 0 0 0 0 0 0 0 0 0 0 0 0 0 0 0 0 0 0 0 0 0 0 0 0 0 0 0 0 0 0 0 0 0 0 0 0 0 0 0 0 0 0 0 0 0 0 0 0 0 0 0 0 0 0 0 0 0 0 0 0 0 0 0 0 0 0 0 0 0 0 0 0 0 0 0 0 0 0 0 0 0 0 0 0 0 0 0 0 0 0 0 0 0 0 0 0 0 0 0 0 0 0 0 0 0 0 0 0 0 0 0 0 0 0 0 0 0 0 0 0 0 0 0 0 0 0 0 0 0 0 0 0 0 0 0 0 0 0 0 0 0 0 0 0 0 0 0 0 0 0 0 0 0 0 0 0 0 0 0 0 0 0 0 0 0 0 0 0 0 0 0 0 0 0 0 0 0 0 0 0 0 0 0 0 0 0 0 0 0 0 0 0 0 0 0 0 0 0 0 0 0 0 0 0 0 0 0 0 0 0 0 0 0 0 0 0 0 0 0 0 0 0 0 0 0 0 0 0 0 0 0 0 0 0 0 0 0 0 0 0 0 0 0 0 0 0 0 0 0 0 0 0 0 0 0 0 0 0 0 0 0 0 0 0 0 0 0 0 0 0 0 0 0 0 0 0 0 0 0 0 0 0 0 0 0 0 0 0 0 0 0 0 0 0 0 0 0 0 0 0 0 0 0 0 0 0 0 0 0 0 0 0 0 0 0 0 0 0 0 0 0 0 0 0 0 0 0 0 0 0 0 0 0 0 0 0 0 0 0 0 0 0 0 0 0 0 0 0 0 0 0 0 0 0 0 0 0 0 0 0 0 0 0 0 0 0 0 0 0 0 0 0 0 0 0 0 0 0 0 0 0 0 0 0 0 0 0 0 0 0 0 0 0 0 0 0 0 0 0 0 0 0 0 0 0 0 0 0 0 0 0 0 0 0 0 0 0 0 0 0 0 0 0 0 0 0 0 0 0 0 0 0 0 0 0 0 0 0 0 0 0 0 0 0 0 0 0 0 0 0 0 0 0 0 0 0 0 0 0 0 0 0 0 0 0 0 0 0 0 0 0 0 0 0 0 0 0 0 0 0 0 0 0 0 0 0 0 0 0 0 0 0 0 0 0 0 0 0 0 0 0 0 0 0 0 0 0 0 0 0 0 0 0 0 0 0 0 0 0 0 0 0 0 0 0 0 0 0 0 0 0 0 0 0 0 0 0 0 0 0 0 0 0 0 0 0 0 0 0 0 0 0 0 0 0 0 0 0 0 0 0 0 0 0 0 0 0 0 0 0 0 0 0 0 0 0 0 0 0 0 0 0 0 0 0 0 0 0 0 0 0 0 0 0 0 0 0 0 0 0 0 0 0 0 0 0 0 0 0 0 0 0 0 0 0 0 0 0 0 0 0 0 0 0 0 0 0 0 0 0 0 0 0 0 0 0 0 0 0 0 0 0 0 0 0 0 0 0 0 0 0 0 0 0 0 0 0 0 0 0 0 0 0 0 0 0 0 0 0 0 0 0 0 0 0 0 0 0 0 0 0 0 0 0 0 0 0 0 0 0 0 0 0 0 0 0 0 0 0 0 0 0 0 0 0 0 0 0 0 0 0 0 0 0 0 0 0 0 0 0 0 0 0 0 0 0 0 0 0 0 0 0 0 0 0 0 0 0 0 0 0 0 0 0 0 0 0 0 0 0 0 0 0 0 0 0 0 0 0 0 0 0 0 0 0 0 0 0 0 0 0 0 0 0 0 0 0 0 0 0 0 0 0 0 0 0 0 0 0 0 0 0 0 0 0 0 0 0 0 0 0 0 0 0 0 0 0 0 0 0 0 0 0 0 0 0 0 0 0 0 0 0 0 0 0 0 0 0 0 0 0 0 0 0 0 0 0 0 0 0 0 0 0 0 0 0 0 0 0 0 0 0 0 0 0 0 0 0 0 0 0 0 0 0 0 0 0 0 0 0 0 0 0 0 0 0 0 0 0 0 0 0 0 0 SP64 Bacteria;Bacteroidetes;Bacteroidia;Bacteroidales;Prevotellaceae;Prevotella;melaninogenica 159 2618 21 5408 11 1210 12 3024 9 227 1660 125 542 88 90 2572 2061 46 972 11972 1970 1 86 292 2104 959 4 68 15 18 1153 1931 331 5325 3845 6051 1795 71 146 23 4262 178 2495 4190 1544 3241 234 785 343 125 2583 114 7118 37 4614 54 1730 1924 5 4814 41 6 885 159 2116 15 23 5246 115 2487 1622 3649 178 70 1619 248 3375 4513 420 162 1363 6845 45 1532 1942 536 1698 6918 254 5190 5 17145 90 723 375 149 3 1009 2 2065 80 244 981 125 25 68 3575 41 5179 62 261 29 11635 11122 1898 136 8713 11814 15612 267 3671 9419 4319 1425 10154 807 11663 7042 8873 33 6288 896 11 563 5916 557 6512 1297 109 275 1263 10 324 552 11 6303 22263 6968 6430 17 10157 330 5315 260 104 129 4337 66 2384 233 35 0 273 22 451 102 22 594 10 202 153 51 5 46 1116 130 230 199 93 101 484 35 25 5614 15304 744 278 1107 132 4806 3965 214 2133 723 3532 1444 8705 10503 1323 52 2 259 3592 2744 122 2841 4 20 9 15 10875 750 4341 308 1135 4861 63 3728 1 1958 286 1879 152 220 1353 10354 1827 708 278 6566 4014 11 338 1480 188 3189 8651 1757 1870 279 90 647 18508 26 64 2719 3247 1536 13223 48 5623 20 60 1515 6 33 580 29 3036 5554 458 8035 80 9918 14051 150 7988 1711 0 53 1 66 2 0 1 2 1 0 4 18 18 13 89 5 12 1 79 122 1 17 3 2 1 30 0 5 2 21 0 3 5 4 81 149 26 2 20 1 1 1 0 0 10 0 31 2 1 2 0 1 0 2 61 0 97 0 1 1 2 0 9 24 5 6 1 0 0 14 0 1 0 1 0 2 0 2 157 0 2 0 4 0 2 1 26 3 44 2 6 192 0 1 0 2 1 0 0 1 3 0 2 1 0 1 6 0 17 21 2 3 2 0 1 1 27 6 0 2 0 20 11 4 0 0 13 2 8 3 2 3 7 0 5 1 0 0 0 0 8 2 3 3 4 0 1 10 0 0 9 4 1 3 12 3 82 1 47 5 1 0 1 5 3 1 4 3 2 64 1 5 29 5 16 15 1 31 0 162 0 0 4 2 11 3 1 7 1 3 130 1 0 5 12 1 0 1 57 2 0 0 8 1 6 2 4 5 0 134 1 0 1 1 312 3 2 37 4 1 0 8 0 0 68 22 32 3 3 1 81 5 9 1 0 11 6 2 0 1 16 65 1 0 0 4 4 1 7 0 0 1 1 4 2 0 2 4 1 0 0 1 0 6 2 2 0 0 2 1 1 6 3 4 10 56 1 0 0 10 0 2 14 1 1 0 0 0 5 3 3 5 0 5 28 19 55 16 2 5 0 2 17 0 1 42 0 1 0 0 0 0 0 2 1 0 2 10 0 0 1 4 133 0 2 5 4 3 80 2 0 0 0 0 12 0 0 4 0 11 28 0 0 0 0 0 0 3 1 5 2 1 9 0 0 0 1 9 6 3 3 2 2 0 2 0 2 3 167 11 0 7 2 1 3 3 0 0 0 0 1 1 2 7 1 1 0 24 1 15 2 32 12 2 16 10 0 1 19 0 2 11 0 6 4 3 1 3 0 3 2 5 55 5 0 31 17 4 1 3 0 0 0 290 22 0 5 2 0 31 263 11 7 1 3 3 1 0 3 40 10 0 38 0 5 0 5 4 0 0 3 9 2 0 5 1 5 13 0 1 0 4 71 47 16 12 1 8 24 0 2 12 0 7 37 0 7 1 2 5 4 5 2 1 10 0 7 5 1 1 4 1 8 1 0 0 1 0 1 5 20 8 8 0 1 3 15 1 9 0 14 45 15 0 0 18 0 25 3 0 1 1 29 2 0 14 1 0 4 0 112 3 2 0 7 0 49 1 0 0 12 0 3 0 2 0 6 0 0 0 1 8 15 49 2 29 0 4 5 14 1 98 55 3 2 2 9 1 6 9 4 2 0 4 1 0 2 1 0 0 9 5 1 12 10 10 3 18 119 3 11 2 12 2 0 5 23 1 5 0 0 0 0 0 0 0 1 0 1 28 0 557 0 20 1 1 1 24 2 0 2 0 8 34 328 1 0 12 0 12 1 10 8 8 1 28 0 0 3 0 0 24 2 8 0 121 16 0 0 1 1 4 1 10 2 1 1 0 19 0 2 1 9 0 1 4 1148 1 2 107 0 6 2 0 6 2 0 1 21 6 0 0 27 4 852 24 4 6 2 2 3 13 9 9 57 5 0 1 3 0 0 18 0 6 18 5 6 1 9 65 12 0 0 0 28 5 0 3 0 13 38 10 5 3 45 0 27 1 117 1 14 141 12 2 9 84 2 15 1 1 36 0 0 1 1 4 0 2 1 0 32 191 2 0 1 1 13 0 97 146 70 102 147 457 71 335 942 2010 29 18 34 24 36 15 586 55 172 123 115 1178 11 338 152 41 2366 281 17 1006 230 348 1 41 27 15 678 334 20 228 112 195 12 242 180 185 308 136 0 19 12 2 115 1 449 5 187 1 16 969 4 14 16 81 56 35 47 92 10 117 6 2 199 323 79 567 0 36 14 0 8 7 107 5 29 107 13 728 0 32 1855 769 54 149 2 4 113 4 11 2649 64 50 23 1 2407 3187 76 12 24 238 1230 11 4235 26 4310 122 4 26 62 921 64 3 4 286 82 1 40 3019 697 945 18 3 70 35 416 77 89 1123 221 24 107 1530 4 1 671 232 4 600 89 15 415 0 4 813 203 63 19 73 61 20 31 49 94 78 127 153 164 12 114 212 26 23 178 138 160 101 62 116 27 48 173 192 134 243 93 88 27 23 54 13 97 120 61 19 1762 37 54 948 215 18 1288 446 242 67 152 52 54 159 248 215 556 5 97 690 15 79 2 114 5 193 142 46 17 2827 4 161 422 94 23 20 195 7 100 88 58 724 321 9 37 83 31 237 297 150 29 433 31 13 47 21 13 9 613 69 4 235 6 40 28 373 247 96 790 32 154 88 210 124 29 457 243 6 108 291 12 608 546 4 24 28 25 106 2066 61 37 313 4 301 578 4531 275 41 0 182 213 6013 1 3 2 11 51 99 12 687 935 29 6 194 11 4 77 254 28 6 204 242 7 734 822 29 243 38 0 57 37 13 7 34 145 114 119 27 9 19 30 100 17 1494 177 41 1841 23 57 29 4 261 165 357 81 23 57 1 37 1786 13 2039 276 75 2 58 938 985 8 96 2557 172 37 64 15 16 45 14 17 183 464 188 357 4 48 30 346 327 682 38 463 48 6 853 20 3 664 22 2 61 144 36 190 12 22 569 2110 1397 41 79 10 43 131 1206 46 272 24 159 7 2180 268 505 34 1895 1524 2 65 2448 539 87 3 129 3 50 16 806 135 230 142 1 171 768 932 19 4333 11 1 1607 500 301 2 88 22 9 2565 34 10 140 9 34 106 1 39 13 291 64 6 74 1408 310 3 917 93 85 453 17 2 827 83 1 49 402 21 0 58 250 9 568 9 39 160 293 659 328 432 44 242 100 1258 327 4 307 992 42 231 631 185 594 82 169 26 30 92 110 38 171 4 214 275 347 14 5 70 69 42 81 2556 141 133 12 1651 252 9 8 511 319 18 237 61 189 47 3 55 3 36 3 304 64 235 229 6 289 61 105 607 47 90 1 65 2704 40 48 412 296 90 830 235 246 9 233 25 30 1 5 33 558 485 154 37 5352 592 82 132 5 17 11 90 33 50 107 149 48 114 770 4 67 289 37 47 1283 205 354 1233 613 20 145 110 18 16 278 2 92 58 18 46 200 239 89 9 54 244 46 448 448 35 702 1677 872 954 142 154 85 94 3073 4 9 7 76 179 24 35 2338 6 641 262 93 5 59 116 318 927 24 739 2 272 1110 364 454 49 872 169 39 149 2 27 0 1504 67 244 37 23 9 14 14 29 88 3022 250 23 186 7 2 100 40 28 14 270 197 0 10 253 165 336 89 338 138 7 43 158 7 52 693 5 4 8 36 42 137 365 1904 211 14 165 3 2147 194 16 4083 114 1012 53 77 21 89 76 732 2265 610 19 21 368 41 396 1896 19 170 59 39 908 31 0 76 170 42 246 129 23 3 7 13 45 27 143 16 181 161 85 5 18 343 17 142 75 404 260 61 63 27 207 102 0 190 3846 300 98 38 20 121 246 0 3 809 0 34 964 362 8 16 1272 95 2 107 1826 520 228 185 17 94 208 23 160 34 3 149 SP641 Bacteria;Bacteroidetes;Bacteroidia;Bacteroidales;Prevotellaceae;Prevotella;sp. HMT313 0 0 0 0 0 7 0 0 0 0 28 0 0 1 0 0 0 0 0 0 0 0 0 14 0 0 0 0 0 0 0 0 0 0 0 3 6 0 0 0 0 0 0 0 0 0 0 0 0 0 404 0 0 1 0 0 0 11 0 0 0 0 0 0 0 0 0 0 0 0 0 0 0 0 0 0 84 0 0 0 0 0 0 0 134 0 0 4 0 0 0 0 0 0 0 0 0 0 0 0 0 3 0 0 0 1 0 0 0 0 0 0 122 0 2 0 22 0 3 0 0 0 0 64 0 0 1 0 0 0 0 0 0 0 112 0 0 0 0 0 0 0 0 0 1 3 0 0 0 0 83 0 0 0 0 0 0 0 0 0 0 0 0 0 0 9 0 0 0 0 0 0 0 0 13 0 0 0 0 0 0 0 0 0 0 0 0 0 0 3 0 0 347 0 85 2 0 0 0 0 0 0 280 0 1 0 0 0 0 0 0 0 0 0 0 3 1 0 0 0 6 2 0 0 2 0 0 0 0 707 0 0 0 0 0 0 0 0 0 0 0 0 388 0 0 0 0 0 4 0 0 0 0 0 0 0 0 0 0 0 0 0 0 0 0 49 198 0 0 0 0 0 0 0 0 0 0 0 1 0 2 4 32 4 3 1 0 0 0 0 2 0 1 0 0 1 0 0 0 0 0 0 16 52 7 0 0 0 0 0 0 0 0 0 53 0 0 0 0 1 0 0 28 0 1 0 0 0 0 0 0 1 0 0 0 0 0 0 0 1 0 0 0 0 0 0 0 0 0 0 0 0 0 0 0 0 0 0 0 0 0 0 0 2 0 0 0 0 0 0 0 0 0 0 0 0 0 0 0 0 1 0 0 0 0 0 0 0 0 0 0 1 0 0 0 0 0 0 0 0 0 0 0 1 0 0 0 0 0 0 0 0 0 0 0 0 0 0 1 0 0 1 1 1 0 1 0 0 0 0 0 0 0 0 0 33 13 0 0 0 0 0 0 0 0 1 0 0 0 0 2 0 0 0 0 0 0 0 0 1 3 0 0 0 0 0 0 2 0 0 0 0 0 0 0 0 1 6 0 0 0 0 1 1 11 13 0 0 0 0 4 0 0 63 2 0 0 0 0 0 4 0 0 0 0 0 0 0 0 0 4 3 0 0 0 0 0 0 0 0 0 1 0 0 0 1 0 0 0 0 0 0 0 0 0 0 0 0 0 0 0 0 16 0 0 0 0 10 0 0 2 0 0 0 0 0 0 0 0 3 0 5 0 3 2 1 0 0 0 0 0 0 0 0 0 0 0 0 0 0 0 0 0 0 0 0 0 0 0 0 3 0 0 0 0 1 0 0 0 0 0 1 0 0 0 0 0 0 0 0 0 0 0 0 0 0 0 0 0 0 0 0 0 0 0 0 0 0 0 0 0 0 0 0 1 4 8 0 0 0 0 0 0 0 0 0 0 0 9 4 0 0 0 0 0 5 3 1 0 1 0 0 1 3 0 0 0 0 0 0 0 0 0 0 0 0 0 0 0 0 0 0 0 0 0 0 1 0 0 0 0 0 0 0 0 1 0 3 6 0 0 0 0 0 0 0 0 0 21 0 0 0 2 0 0 0 0 0 0 0 0 0 0 0 0 4 0 10 0 0 0 4 0 0 0 0 0 0 2 5 0 0 1 0 0 0 0 0 0 0 1 0 0 0 1 0 0 0 0 0 0 0 0 0 0 0 0 0 0 13 0 0 0 0 0 0 0 0 1 3 2 0 0 0 0 0 2 0 0 0 0 0 0 0 0 0 0 0 0 0 0 0 0 0 0 0 0 0 0 0 0 0 0 0 0 0 0 0 0 2 0 0 0 0 0 0 1 0 0 0 0 0 0 0 0 0 0 2 0 0 0 0 0 0 0 0 0 0 0 0 0 6 0 0 0 0 1 1 0 0 0 0 0 2 0 0 0 0 0 0 0 0 0 1 5 0 0 0 1 0 0 0 0 1 0 0 0 0 2 0 1 0 0 0 0 0 0 0 0 0 0 0 0 0 0 0 0 1 3 0 1 1 0 0 0 0 0 0 2 0 0 0 0 0 0 0 2 0 0 0 0 0 0 2 0 0 0 10 0 0 0 0 0 0 0 0 1 0 0 0 2 0 70 2 0 0 1 0 0 0 0 0 0 2 0 0 0 0 0 0 0 1 0 17 24 0 13 2 28 1 0 0 0 0 0 3 0 20 0 0 0 0 2 2 0 0 1 0 0 0 0 0 0 0 0 2 0 0 0 0 0 0 0 0 0 0 0 0 0 1 0 0 0 0 0 0 0 0 3 7 1 19 3 2 122 20 0 0 0 0 0 0 3 1 0 0 3 2 0 2 1 0 0 3 4 3 1 2 0 0 0 0 12 0 1 59 0 3 1 0 3 1 0 0 0 1 33 0 3 0 8 1 0 0 0 17 0 0 0 1 0 8 0 0 0 0 0 2 11 0 1 2 0 0 0 0 0 0 0 0 0 0 0 0 0 1 13 0 0 1 0 0 3 0 0 0 0 1 0 0 0 37 0 0 0 0 7 1 99 0 88 0 0 14 1 11 0 1 0 0 1 0 0 81 84 3 0 0 0 1 10 0 0 0 0 0 0 9 0 0 2 3 0 2 0 0 0 0 2 2 0 1 0 0 0 0 0 0 7 0 3 0 5 31 3 21 12 16 0 0 0 5 0 5 0 1 0 1 1 16 4 0 1 0 0 0 0 5 2 0 8 0 0 4 2 0 86 0 1 1 1 3 10 2 4 2 13 0 0 6 0 1 2 0 2 0 1 0 0 25 0 1 5 3 1 0 0 1 6 0 3 0 0 0 0 1 0 0 5 0 0 2 0 4 1 0 0 0 0 0 1 0 0 0 0 13 64 0 10 0 1 0 4 13 1 6 15 0 0 0 0 4 0 0 0 0 1 0 42 0 0 0 1 2 1 22 0 0 0 0 0 11 0 0 0 45 0 0 0 4 13 0 0 1 0 0 0 0 0 0 1 0 1 4 8 0 0 0 0 0 0 0 0 0 0 0 3 0 0 0 0 0 0 7 10 0 86 0 7 0 0 0 0 1 7 0 0 0 0 0 0 60 1 0 0 0 3 1 0 2 2 1 0 1 0 0 0 0 0 1 54 6 1 0 0 0 1 0 0 0 8 0 0 0 15 0 0 0 0 0 72 0 0 0 0 0 0 16 0 0 8 0 0 88 0 14 0 1 0 20 20 2 0 49 6 0 0 17 31 0 0 81 0 0 0 5 0 15 4 0 0 2 0 1 186 0 0 0 1 1 0 0 0 0 0 0 0 0 0 0 0 0 2 0 26 0 0 0 5 10 0 0 0 0 0 0 0 0 0 0 0 5 0 0 0 6 1 1 0 0 1 0 0 1 0 0 0 0 0 1 0 4 0 2 0 2 1 1 0 0 0 0 0 0 0 1 0 0 1 0 1 0 0 0 1 0 70 0 0 0 0 2 0 0 3 1 0 0 1 1 0 1 0 0 1 0 2 0 1 0 0 0 0 1 0 0 7 1 2 3 0 0 0 2 6 6 0 0 0 0 0 2 0 0 1 27 1 0 0 181 16 3 1 0 0 0 0 0 1 0 3 0 0 71 0 1 1 2 0 1 1 0 9 1 0 0 0 0 0 0 0 0 3 61 297 2 3 15 0 0 21 0 0 2 0 1 10 3 32 0 0 1 0 0 0 0 0 2 0 0 0 32 0 0 4 0 0 2 1 1 6 1 6 0 11 10 0 73 0 25 0 0 0 1 0 0 14 1 1 0 0 0 0 0 1 2 11 8 0 2 0 0 1 3 0 0 36 4 0 0 1 0 2 0 10 0 0 2 0 0 5 5 0 0 0 0 1 0 1 154 0 4 0 0 62 1 0 2 3 14 0 1 0 0 0 5 0 1 0 0 0 0 0 1 0 33 0 0 0 0 6 0 0 28 9 4 0 0 0 2 2 0 5 0 278 0 5 0 0 6 15 0 0 1 1 0 12 0 0 0 0 1 77 6 1 0 1 2 0 0 0 1 0 0 4 2 0 0 4 1 1 0 21 1 8 0 0 2 0 0 0 0 0 2 SP66 Bacteria;Bacteroidetes;Bacteroidia;Bacteroidales;Prevotellaceae;Prevotella;sp. HMT314 0 7 0 12 2 41 19 5 0 0 102 3 2 0 0 17 7 5 6 36 6 4 0 0 2 0 2 0 0 0 3 0 0 7 4 4 6 158 0 9 12 0 0 25 4 0 0 8 83 1 61 0 157 0 15 0 24 4 0 82 0 0 0 0 6 0 0 155 1 5 2 3 0 0 0 0 25 10 0 0 0 6 0 0 58 2 2 35 0 347 5 156 0 38 1 2 0 0 0 29 0 2 0 0 2 0 57 0 2 1 0 0 453 5 28 0 77 27 267 0 3 1 71 12 149 7 265 52 81 10 0 5 0 8 251 30 28 28 0 0 0 0 0 18 0 92 168 12 17 0 17 3 1 0 0 0 124 0 2 0 0 0 0 0 0 5 0 0 37 0 0 0 0 0 5 0 0 0 0 0 0 0 0 16 257 1 3 0 0 24 12 7 8 0 209 1 66 27 0 0 2 0 244 0 0 51 0 0 0 5 8 0 10 0 0 11 7 23 2 0 3 29 0 0 67 12 2 0 0 127 103 0 161 0 0 0 38 35 0 25 0 0 86 0 0 3 4 8 81 0 62 0 0 37 0 0 0 0 21 73 9 299 0 41 568 3 33 1 0 0 0 0 0 0 0 0 0 0 0 0 0 0 0 0 0 0 0 0 0 0 0 0 0 0 0 0 0 0 0 0 0 0 0 0 0 0 0 0 0 0 0 0 0 0 0 0 0 0 0 0 0 0 0 0 0 0 0 0 0 0 0 0 0 0 0 0 0 0 0 0 0 0 0 0 0 0 0 0 0 0 0 0 0 0 0 0 0 0 0 0 0 0 0 0 0 0 0 0 0 0 0 0 0 0 0 0 0 0 0 0 0 0 0 0 0 0 0 0 0 0 0 0 0 0 0 0 0 0 0 0 0 0 0 0 0 0 0 0 0 0 0 0 0 0 0 0 0 0 0 0 0 0 0 0 0 0 0 0 0 0 0 0 0 0 0 0 0 0 0 0 0 0 0 0 0 0 0 0 0 0 0 0 0 0 0 0 0 0 0 0 0 0 0 0 0 0 0 0 0 0 0 0 0 0 0 0 0 0 0 0 0 0 0 0 0 0 0 0 0 0 0 0 0 0 0 0 0 0 0 0 0 0 0 0 0 0 0 0 0 0 0 0 0 0 0 0 0 0 0 0 0 0 0 0 0 0 0 0 0 0 0 0 0 0 0 0 0 0 0 0 0 0 0 0 0 0 0 0 0 0 0 0 0 0 0 0 0 0 0 0 0 0 0 0 0 0 0 0 0 0 0 0 0 0 0 0 0 0 0 0 0 0 0 0 0 0 0 0 0 0 0 0 0 0 0 0 0 0 0 0 0 0 0 0 0 0 0 0 0 0 0 0 0 0 0 0 0 0 0 0 0 0 0 0 0 0 0 0 0 0 0 0 0 0 0 0 0 0 0 0 0 0 0 0 0 0 0 0 0 0 0 0 0 0 0 0 0 0 0 0 0 0 0 0 0 0 0 0 0 0 0 0 0 0 0 0 0 0 0 0 0 0 0 0 0 0 0 0 0 0 0 0 0 0 0 0 0 0 0 0 0 0 0 0 0 0 0 0 0 0 0 0 0 0 0 0 0 0 0 0 0 0 0 0 0 0 0 0 0 0 0 0 0 0 0 0 0 0 0 0 0 0 0 0 0 0 0 0 0 0 0 0 0 0 0 0 0 0 0 0 0 0 0 0 0 0 0 0 0 0 0 0 0 0 0 0 0 0 0 0 0 0 0 0 0 0 0 0 0 0 0 0 0 0 0 0 0 0 0 0 0 0 0 0 0 0 0 0 0 0 0 0 0 0 0 0 0 0 0 0 0 0 0 0 0 0 0 0 0 0 0 0 0 0 0 0 0 0 0 0 0 0 0 0 0 0 0 0 0 0 0 0 0 0 0 0 0 0 0 0 0 0 0 0 0 0 0 0 0 0 0 0 0 0 0 0 0 0 0 0 0 0 0 0 0 0 0 0 0 0 0 0 0 0 0 0 0 0 0 0 0 0 0 0 0 0 0 0 0 0 0 0 0 0 0 0 0 0 0 0 0 0 0 0 0 0 0 0 0 0 0 0 0 0 0 0 0 0 0 0 0 0 0 0 0 0 0 0 0 0 0 0 0 0 0 0 0 0 0 0 0 0 0 0 0 0 0 0 0 0 0 0 0 0 0 0 0 0 0 0 0 0 0 0 0 0 0 0 0 0 0 0 0 0 0 0 0 0 0 0 0 0 0 0 0 0 0 0 0 0 0 0 0 0 0 0 0 0 0 0 0 0 0 0 0 0 0 0 0 0 0 0 0 0 0 0 0 0 0 0 0 0 0 0 0 0 0 0 0 0 0 0 0 0 0 0 0 0 0 0 0 0 0 0 0 0 0 0 0 0 0 0 0 0 0 0 0 0 0 0 0 0 0 0 0 0 0 0 0 0 0 0 0 0 0 0 0 0 0 0 0 0 0 0 0 0 0 0 0 0 0 0 0 0 0 0 0 0 0 0 0 0 0 0 0 0 0 0 0 0 0 0 0 0 0 0 0 0 0 0 0 0 0 0 0 0 0 0 0 0 0 0 0 0 0 0 0 0 0 0 0 0 0 0 0 0 0 0 0 0 0 0 0 0 0 0 0 0 0 0 0 0 0 0 0 0 0 0 0 0 0 0 0 0 0 0 0 0 0 0 0 0 0 0 0 0 0 0 0 0 0 0 0 0 0 0 0 0 0 0 0 0 0 0 0 0 0 0 0 0 0 0 0 0 0 0 0 0 0 0 0 0 0 0 0 0 0 0 0 0 0 0 0 0 0 0 0 0 0 0 0 0 0 0 0 0 0 0 0 0 0 0 0 0 0 0 0 0 0 0 0 0 0 0 0 0 0 0 0 0 0 0 0 0 0 0 0 0 0 0 0 0 0 0 0 0 0 0 0 0 0 0 0 0 0 0 0 0 0 0 0 0 0 0 0 0 0 0 0 0 0 0 0 0 0 0 0 0 0 0 0 0 0 0 0 0 0 0 0 0 0 0 0 0 0 0 0 0 0 0 0 0 0 0 0 0 0 0 0 0 0 0 0 0 0 0 0 0 0 0 0 0 0 0 0 0 0 0 0 0 0 0 0 0 0 0 0 0 0 0 0 0 0 0 0 0 0 0 0 0 0 0 0 0 0 0 0 0 0 0 0 0 0 0 0 0 0 0 0 0 0 0 0 0 0 0 0 0 0 0 0 0 0 0 0 0 0 0 0 0 0 0 0 0 0 0 0 0 0 0 0 0 0 0 0 0 0 0 0 0 0 0 0 0 0 0 0 0 0 0 0 0 0 0 0 0 0 0 0 0 0 0 0 0 0 0 0 0 0 0 0 0 0 0 0 0 0 0 0 0 0 0 0 0 0 0 0 0 0 0 0 0 0 0 0 0 0 0 0 0 0 0 0 0 0 0 0 0 0 0 0 0 0 0 0 0 0 0 0 0 0 0 0 0 0 0 0 0 0 0 0 0 0 0 0 0 0 0 0 0 0 0 0 0 0 0 0 0 0 0 0 0 0 0 0 0 0 0 0 0 0 0 0 0 0 0 0 0 0 0 0 0 0 0 0 0 0 0 0 0 0 0 0 0 0 0 0 0 0 0 0 0 0 0 0 0 0 0 0 0 0 0 0 0 0 0 0 0 0 0 0 0 0 0 0 0 0 0 0 0 0 0 0 0 0 0 0 0 0 0 0 0 0 0 0 0 0 0 0 0 0 0 0 0 0 0 0 0 0 0 0 0 0 0 0 0 0 0 0 0 0 0 0 0 0 0 0 0 0 0 0 0 0 0 0 0 0 0 0 0 0 0 0 0 0 0 0 0 0 0 0 0 0 0 0 0 0 0 0 0 0 0 0 0 0 0 0 0 0 0 0 0 0 0 0 0 0 0 0 0 0 0 0 0 0 0 0 0 0 0 0 0 0 0 0 0 0 0 0 0 0 0 0 0 0 0 0 0 0 0 0 0 0 0 0 0 0 0 0 0 0 0 0 0 0 0 0 0 0 0 0 0 0 0 0 0 0 0 0 0 0 0 0 0 0 0 0 0 0 0 0 0 0 0 SP68 Bacteria;Actinobacteria;Actinomycetia;Corynebacteriales;Corynebacteriaceae;Corynebacterium;durum 33 108 792 36 54 37 0 54 173 81 8 639 341 87 46 26 12 19 10 13 20 7 36 71 84 25 213 32 42 48 2 20 87 10 4 66 13 43 18 13 11 69 7 24 42 2 15 62 83 105 9 12 14 19 7 14 27 279 20 183 21 110 59 7 10 5 6 6 40 16 81 206 122 12 96 49 2 13 87 335 132 8 41 48 10 5 42 3 72 0 10 17 17 54 29 193 112 12 20 28 40 41 22 81 21 16 19 178 8 126 36 20 67 54 83 18 1 32 43 27 46 36 0 85 52 61 5 2 7 168 18 5 7 78 52 19 0 43 1 19 206 159 206 118 198 78 15 22 32 6 6 17 40 28 281 24 5 265 22 40 56 97 0 16 37 12 90 39 223 751 1 10 1 48 21 23 10 3 36 136 15 73 19 8 2 19 14 32 0 23 64 23 1 25 0 33 2 2 131 16 19 39 18 4 3 10 22 23 26 2 12 430 16 54 36 67 53 21 37 28 44 15 15 7 12 48 9 245 529 9 29 46 14 9 1 4 43 27 56 125 10 1 4 51 54 106 1 29 5 22 1 4 16 33 1 21 105 2 35 20 185 11 78 9 8 9 15 58 0 163 1195 0 2365 976 315 0 1854 182 251 551 291 259 0 152 357 497 79 1212 3 119 263 8 384 17 509 356 21 24 1 382 558 261 10 121 472 634 155 974 234 107 663 97 5 830 224 424 0 307 760 645 686 2 159 143 42 10 443 1 6086 1921 509 464 123 1687 3364 0 1988 817 86 2 64 1806 0 732 1852 145 1 461 170 2618 770 1259 24 894 1 526 0 1138 1564 0 2 986 0 934 1929 1131 189 915 265 0 263 469 13 330 2305 942 291 0 197 129 214 0 1469 315 13 1299 340 650 6 11 15 0 0 1120 379 710 453 0 1029 401 24 0 1 995 489 1789 2 551 3075 1504 1171 272 0 326 293 0 105 1 315 0 1165 146 609 77 0 175 189 0 3611 3037 599 1528 199 261 0 282 478 0 0 266 201 1797 44 278 45 144 12 12 64 254 0 1018 54 15 133 499 1138 117 1 38 450 1534 48 784 1 282 0 185 108 770 2433 106 0 456 165 932 202 117 1338 202 170 531 367 83 358 150 155 304 1482 454 430 1111 211 10 10 50 562 625 0 166 64 1 2 125 1144 0 413 339 183 127 161 162 0 1773 1703 138 103 489 0 145 69 620 263 896 753 746 1 3487 3357 1126 0 971 154 920 231 0 541 59 993 236 22 367 66 95 2130 479 524 253 1592 96 465 2058 5 2688 2552 2729 884 1295 0 63 0 157 0 26 112 295 18 205 0 551 255 0 2075 1125 636 426 886 4 907 10 832 715 1120 13 998 200 1524 104 1094 1038 103 0 543 242 28 285 446 655 0 1 0 158 0 453 1857 1178 74 1435 869 1332 234 542 599 25 917 2520 2114 0 61 96 206 5 822 2020 2955 818 381 221 1378 1133 622 1726 470 1086 866 1393 468 1 1587 515 151 245 133 567 1175 0 0 3 0 1 492 262 1281 1067 2686 223 291 799 1397 1666 1331 0 1843 768 2496 972 505 1 80 44 0 671 0 284 0 934 228 0 765 3481 0 748 188 251 0 422 485 358 634 151 77 0 204 341 1400 786 465 328 0 1016 668 347 879 613 984 761 925 0 326 671 477 0 130 184 0 859 212 11 1523 78 157 269 183 1974 0 125 304 503 321 111 110 60 483 311 698 281 245 392 218 161 450 444 208 1215 310 0 1877 648 154 715 180 337 553 0 561 140 1575 634 0 351 3456 71 896 923 881 137 240 595 1091 121 571 1286 98 252 1 218 250 12 556 63 52 1238 0 518 664 948 396 6882 1319 206 2052 487 1807 3432 1079 148 464 0 0 17 33 0 439 3428 0 4435 3418 4 485 5784 2771 1 215 2115 302 2210 23 2370 4739 1765 455 252 1233 1664 1 85 1 1750 2187 3 688 2253 2 4 388 72 1 171 347 1203 541 3658 298 10 243 695 389 1226 704 228 3350 404 1287 1018 909 32 0 762 544 0 32 2910 4 0 1869 1532 0 713 852 1091 1319 188 138 65 2 8332 6 292 502 0 1910 426 972 247 9 14 362 560 534 242 827 52 1 6 16 0 1041 1 1798 664 380 1 1692 5 590 27 1357 697 232 0 1488 366 0 6 805 1391 0 70 248 1064 1869 409 0 229 1258 188 6 167 285 167 231 1283 35 467 0 98 576 361 1474 161 1025 0 191 504 1 99 179 627 715 300 163 659 204 254 0 417 84 269 134 0 3286 87 0 8 1110 64 1162 1258 194 1 616 439 36 131 514 219 14 90 459 160 764 1699 169 451 286 237 0 120 24 172 302 13 12 54 159 1302 561 2122 1724 1705 1768 579 2866 1 24 74 1 0 67 0 22 2287 0 881 2121 2290 0 1 26 0 1015 90 2295 672 1587 118 126 5 10 0 20 46 1 10 35 0 78 25 25 11 9 6 0 117 28 7 12 16 51 1033 62 19 1 50 133 0 159 54 0 2 4 0 51 0 17 9 0 7 13 2 16 28 1 3 32 468 11 0 19 0 0 6 34 0 21 180 16 0 32 6 4 3 31 5 0 0 608 0 0 0 0 0 5 8 0 1 4 0 0 1 3 0 5 72 0 43 16 0 39 35 16 0 28 289 95 0 63 390 0 11 3 0 93 287 3 0 5 191 0 22 13 0 0 98 107 0 0 111 6 0 75 1 0 2 11 0 5 3 5 0 28 9 32 0 49 7 0 17 168 1 0 11 36 15 10 3 0 13 63 7 0 13 32 6 7 14 3 24 0 19 12 3 22 15 215 0 5 83 0 134 12 0 9 15 17 1 3 15 270 0 14 148 0 17 18 6 0 109 75 0 0 46 57 0 10 21 0 9 7 41 26 15 45 0 14 49 0 11 54 53 0 2 22 0 5 12 0 24 88 0 0 2 0 21 42 5 53 94 5 13 6 0 88 20 32 0 8 5 0 114 9 0 8 16 22 0 129 61 0 132 46 0 36 2 0 0 45 64 0 1 109 8 0 19 12 1 2 5 0 16 97 32 0 99 2 0 39 61 0 9 59 2 0 0 0 13 88 6 1 0 111 1 1 191 0 42 34 105 0 85 3 0 189 78 429 38 195 0 6 35 6 0 15 64 2 18 1 0 19 17 11 0 6 13 6 0 51 4 0 17 1363 19 116 0 79 39 29 22 159 265 640 352 0 1 137 86 48 28 212 56 3 32 0 101 69 28 0 0 49 26 0 80 124 51 56 12 17 241 14 2 6 11 3 122 1 0 17 1 1 3 0 19 14 0 6 1 0 12 9 4 5 147 10 25 77 0 0 4 103 0 0 0 0 16 10 6 0 105 365 0 58 115 4 14 76 0 0 3 196 1 28 21 0 30 22 1 16 12 16 2 0 9 8 18 0 11 66 0 83 41 1 44 66 6 0 18 62 0 27 30 0 19 22 3 0 12 53 0 22 110 2 5 116 21 0 33 41 0 42 168 0 21 43 717 12 24 7 4 0 118 84 129 12 20 0 23 158 1 44 44 16 0 68 672 0 12 139 0 0 11 8 0 0 32 6 8 240 1 52 0 34 0 68 0 45 92 0 0 15 45 0 9 22 22 0 12 185 0 164 20 26 41 0 0 10 30 0 16 166 0 181 144 35 226 12 48 5 18 160 0 6 5 0 19 48 0 25 70 11 0 31 94 0 12 32 2 162 79 6 0 45 35 6 24 47 18 0 29 167 29 57 2 0 8 28 61 0 19 55 1 6 3 0 1 45 1 10 135 88 0 29 83 1 13 83 56 0 107 36 0 0 5 104 7 34 22 0 0 37 0 63 11 364 0 138 79 0 27 3 0 33 17 1 0 31 77 0 62 29 3 0 18 0 0 0 0 0 28 16 0 125 24 0 20 293 0 72 5 21 36 1 36 51 0 39 166 10 319 3 9 127 21 2 126 207 270 14 16 0 0 6 3 0 2 5 6 62 0 0 1 10 3 0 13 2 0 13 5 10 0 0 139 26 18 2 85 22 0 23 2 3 16 10 24 1 0 0 0 0 0 0 9 20 0 160 18 5 46 4 19 27 0 0 2 22 85 30 37 6 54 17 0 48 33 31 0 48 43 0 4 5 15 6 26 3 0 63 27 0 38 103 5 0 3 59 0 1 46 0 0 0 23 0 9 5 4 81 97 0 5 6 42 0 6 39 0 73 0 6 19 59 35 17 0 SP681 Bacteria;Firmicutes;Clostridia;Clostridiales;Peptostreptococcaceae_[XI];Mogibacterium;diversum 548 4 4 196 34 487 14 769 3 53 302 2 213 16 3 216 170 6 727 647 362 57 91 41 84 1583 8 291 0 2 102 759 0 34 351 26 709 122 103 5 1024 4 39 285 15 61 4 76 2 122 206 687 1243 1 254 9 493 54 5 225 3 2 25 19 205 2 1 909 105 3 40 72 53 15 59 13 111 328 86 65 400 109 17 31 376 157 282 401 34 459 0 170 5 1 265 46 1 7 1 386 161 244 101 5 11 13 88 5 270 12 26 10 156 386 380 2 161 309 496 354 81 203 66 896 91 360 234 242 771 0 230 464 271 12 196 11 835 1034 51 101 93 4 3 34 4 297 164 371 550 1 453 62 56 138 174 365 851 56 74 64 9 0 11 26 110 33 15 43 15 47 0 57 28 28 174 1124 127 97 14 14 21 18 128 717 392 104 79 113 16 399 121 119 121 609 645 66 322 333 55 26 1 362 83 22 10 825 0 3 12 7 95 24 116 142 121 237 14 1292 0 84 56 188 37 27 300 86 87 0 2 1203 135 0 212 3 16 602 57 56 51 46 57 14 89 0 9 467 231 26 369 87 207 0 0 511 8 73 2280 647 29 240 315 261 434 337 186 356 957 757 0 0 0 0 0 0 0 0 0 0 0 0 0 0 0 0 0 0 0 0 0 0 0 0 0 0 0 0 0 0 0 0 0 0 0 0 0 0 0 0 0 0 0 0 0 0 0 0 0 0 0 0 0 0 0 0 0 0 0 0 0 0 0 0 0 0 0 0 0 0 0 0 0 0 0 0 0 0 0 0 0 0 0 0 0 0 0 0 0 0 0 0 0 0 0 0 0 0 0 0 0 0 0 0 0 0 0 0 0 0 0 0 0 0 0 0 0 0 0 0 0 0 0 0 0 0 0 0 0 0 0 0 0 0 0 0 0 0 0 0 0 0 0 0 0 0 0 0 0 0 0 0 0 0 0 0 0 0 0 0 0 0 0 0 0 0 0 0 0 0 0 0 0 0 0 0 0 0 0 0 0 0 0 0 0 0 0 0 0 0 0 0 0 0 0 0 0 0 0 0 0 0 0 0 0 0 0 0 0 0 0 0 0 0 0 0 0 0 0 0 0 0 0 0 0 0 0 0 0 0 0 0 0 0 0 0 0 0 0 0 0 0 0 0 0 0 0 0 0 0 0 0 0 0 0 0 0 0 0 0 0 0 0 0 0 0 0 0 0 0 0 0 0 0 0 0 0 0 0 0 0 0 0 0 0 0 0 0 0 0 0 0 0 0 0 0 0 0 0 0 0 0 0 0 0 0 0 0 0 0 0 0 0 0 0 0 0 0 0 0 0 0 0 0 0 0 0 0 0 0 0 0 0 0 0 0 0 0 0 0 0 0 0 0 0 0 0 0 0 0 0 0 0 0 0 0 0 0 0 0 0 0 0 0 0 0 0 0 0 0 0 0 0 0 0 0 0 0 0 0 0 0 0 0 0 0 0 0 0 0 0 0 0 0 0 0 0 0 0 0 0 0 0 0 0 0 0 0 0 0 0 0 0 0 0 0 0 0 0 0 0 0 0 0 0 0 0 0 0 0 0 0 0 0 0 0 0 0 0 0 0 0 0 0 0 0 0 0 0 0 0 0 0 0 0 0 0 0 0 0 0 0 0 0 0 0 0 0 0 0 0 0 0 0 0 0 0 0 0 0 0 0 0 0 0 0 0 0 0 0 0 0 0 0 0 0 0 0 0 0 0 0 0 0 0 0 0 0 0 0 0 0 0 0 0 0 0 0 0 0 0 0 0 0 0 0 0 0 0 0 0 0 0 0 0 0 0 0 0 0 0 0 0 0 0 0 0 0 0 0 0 0 0 0 0 0 0 0 0 0 0 0 0 0 0 0 0 0 0 0 0 0 0 0 0 0 0 0 0 0 0 0 0 0 0 0 0 0 0 0 0 0 0 0 0 0 0 0 0 0 0 0 0 0 0 0 0 0 0 0 0 0 0 0 0 0 0 0 0 0 0 0 0 0 0 0 0 0 0 0 0 0 0 0 0 0 0 0 0 0 0 0 0 0 0 0 0 0 0 0 0 0 0 0 0 0 0 0 0 0 0 0 0 0 0 0 0 0 0 0 0 0 0 0 0 0 0 0 0 0 0 0 0 0 0 0 0 0 0 0 0 0 0 0 0 0 0 0 0 0 0 0 0 0 0 0 0 0 0 0 0 0 0 0 0 0 0 0 0 0 0 0 0 0 0 0 0 0 0 0 0 0 0 0 0 0 0 0 0 0 0 0 0 0 0 0 0 0 0 0 0 0 0 0 0 0 0 0 0 0 0 0 0 0 0 0 0 0 0 0 0 0 0 0 0 0 0 0 0 0 0 0 0 0 0 0 0 0 0 0 0 0 0 0 0 0 0 0 0 0 0 0 0 0 0 0 0 0 0 0 0 0 0 0 0 0 0 0 0 0 0 0 0 0 0 0 0 0 0 0 0 0 0 0 0 0 0 0 0 0 0 0 0 0 0 0 0 0 0 0 0 0 0 0 0 0 0 0 0 0 0 0 0 0 0 0 0 0 0 0 0 0 0 0 0 0 0 0 0 0 0 0 0 0 0 0 0 0 0 0 0 0 0 0 0 0 0 0 0 0 0 0 0 0 0 0 0 0 0 0 0 0 0 0 0 0 0 0 0 0 0 0 0 0 0 0 0 0 0 0 0 0 0 0 0 0 0 0 0 0 0 0 0 0 0 0 0 0 0 0 0 0 0 0 0 0 0 0 0 0 0 0 0 0 0 0 0 0 0 0 0 0 0 0 0 0 0 0 0 0 0 0 0 0 0 0 0 0 0 0 0 0 0 0 0 0 0 0 0 0 0 0 0 0 0 0 0 0 0 0 0 0 0 0 0 0 0 0 0 0 0 0 0 0 0 0 0 0 0 0 0 0 0 0 0 0 0 0 0 0 0 0 0 0 0 0 0 0 0 0 0 0 0 0 0 0 0 0 0 0 0 0 0 0 0 0 0 0 0 0 0 0 0 0 0 0 0 0 0 0 0 0 0 0 0 0 0 0 0 0 0 0 0 0 0 0 0 0 0 0 0 0 0 0 0 0 0 0 0 0 0 0 0 0 0 0 0 0 0 0 0 0 0 0 0 0 0 0 0 0 0 0 0 0 0 0 0 0 0 0 0 0 0 0 0 0 0 0 0 0 0 0 0 0 0 0 0 0 0 0 0 0 0 0 0 0 0 0 0 0 0 0 0 0 0 0 0 0 0 0 0 0 0 0 0 0 0 0 0 0 0 0 0 0 0 0 0 0 0 0 0 0 0 0 0 0 0 0 0 0 0 0 0 0 0 0 0 0 0 0 0 0 0 0 0 0 0 0 0 0 0 0 0 0 0 0 0 0 0 0 0 0 0 0 0 0 0 0 0 0 0 0 0 0 0 0 0 0 0 0 0 0 0 0 0 0 0 0 0 0 0 0 0 0 0 0 0 0 0 0 0 0 0 0 0 0 0 0 0 0 0 0 0 0 0 0 0 0 0 0 0 0 0 0 0 0 0 0 0 0 0 0 0 0 0 0 0 0 0 0 0 0 0 0 0 0 0 0 0 0 0 0 0 0 0 0 0 0 0 0 0 0 0 0 0 0 0 0 0 0 0 0 0 0 0 0 0 0 0 0 0 0 0 0 0 0 0 0 0 0 0 0 0 0 0 0 0 0 0 0 0 0 0 0 0 0 0 0 0 0 0 0 0 0 0 0 0 0 0 0 0 0 0 0 0 0 0 0 0 0 0 0 0 0 0 0 0 0 0 0 0 0 0 0 0 0 0 0 0 0 0 0 0 0 0 0 0 0 0 0 0 0 0 0 0 0 0 0 0 0 0 0 0 0 0 0 0 0 0 0 0 0 0 0 0 0 0 0 0 0 0 0 0 0 0 0 0 0 0 0 0 0 0 0 0 0 0 0 0 0 0 0 0 0 0 0 0 0 0 0 0 0 0 0 0 0 0 0 0 0 0 0 0 0 0 0 0 0 0 0 0 0 0 0 0 0 0 0 0 0 0 0 0 0 0 0 0 0 0 0 0 0 0 0 0 0 0 0 0 0 0 0 0 0 0 0 SP693 Bacteria;Fusobacteria;Fusobacteriia;Fusobacteriales;Leptotrichiaceae;Leptotrichia;sp. HMT217 0 0 0 0 0 0 0 0 0 0 0 0 0 0 0 0 0 0 0 0 0 0 0 0 0 0 0 0 0 0 0 0 0 0 0 0 0 0 0 0 0 0 0 0 0 0 0 0 0 0 0 0 0 0 0 0 0 0 0 0 0 0 0 0 0 0 0 0 0 0 0 0 0 0 0 0 0 0 0 0 0 0 0 0 0 0 0 0 0 0 0 0 0 0 0 0 0 0 0 0 0 0 0 0 0 0 0 0 0 0 0 0 0 0 0 0 0 0 0 0 0 0 0 0 0 0 0 0 0 0 0 0 0 0 0 0 0 0 0 0 0 0 0 0 0 0 0 0 0 0 0 0 0 0 0 0 0 0 0 0 0 0 0 0 0 0 0 0 0 0 0 0 0 0 0 0 0 0 0 0 0 0 0 0 0 0 0 0 0 0 0 0 0 0 0 0 0 0 0 0 0 0 0 0 0 0 0 0 0 0 0 0 0 0 0 0 0 0 0 0 0 0 0 0 0 0 0 0 0 0 0 0 0 0 0 0 0 0 0 0 0 0 0 0 0 0 0 0 0 0 0 0 0 0 0 0 0 0 0 0 0 0 0 0 0 0 0 0 0 2 27 0 0 0 0 0 152 125 0 0 153 15 1 0 146 0 0 0 0 1 80 1 1 0 3 0 4 0 0 0 0 0 11 41 13 0 0 0 1218 0 0 0 0 0 7 0 0 0 0 0 0 0 0 0 0 0 0 0 0 0 0 0 0 0 0 0 0 0 0 0 0 2 0 0 0 3 1 0 0 0 0 0 4 0 0 0 0 921 0 0 0 10 0 0 0 0 0 0 0 0 3 0 0 7 0 0 2 0 0 1 0 0 1 0 0 66 150 0 0 0 0 0 0 630 1 1 1 0 0 9 1 0 4 6 0 0 0 2 0 0 43 402 0 1 0 0 4 0 0 0 0 0 1 0 0 100 0 0 0 0 0 4 4 0 0 0 0 0 0 0 0 101 181 0 52 3 0 0 0 15 0 0 501 0 0 0 0 0 0 0 0 0 0 0 0 0 0 0 0 0 0 261 0 0 4 0 58 3 0 7 2 0 0 0 0 0 24 14 0 1 0 0 0 4 736 0 0 1 0 2 1 2 0 0 0 0 2 0 0 0 1 15 194 0 108 0 0 0 0 0 0 0 0 0 0 0 0 0 0 0 0 187 6 10 0 0 0 0 0 0 0 96 82 0 0 0 1 1 0 0 0 0 0 2 4 0 15 140 0 0 0 0 98 2 0 0 3 54 0 0 0 0 0 1 0 0 0 0 0 0 0 37 0 0 0 0 2 4 10 0 5 0 9 0 0 0 0 0 0 4 0 0 0 0 1 0 2 0 0 0 1 1 0 984 0 0 2 0 0 0 0 0 0 0 1 0 3 0 0 0 0 95 32 0 20 0 0 202 0 0 0 914 2 27 1 10 0 0 1 0 0 0 0 5 0 0 0 0 0 0 0 0 0 0 0 0 0 0 1 0 4 0 8 1 0 0 1 2 0 0 0 0 0 0 0 0 0 47 1 0 5 0 0 0 1 0 1 3 0 1 0 1 0 0 2 0 0 0 0 0 0 0 1 0 0 0 0 0 0 0 0 0 0 199 0 4 3 0 0 3 2 1 0 0 562 0 1 0 1 2 0 0 3 0 0 144 0 0 1 0 0 1 0 0 1 2 37 1597 1 478 1 1868 738 112 1690 0 0 0 8 3 66 1 1 0 0 0 0 0 0 33 0 0 0 0 0 0 5 0 0 0 0 0 0 0 0 25 783 0 0 0 1 1 2 0 0 0 0 0 0 0 0 0 0 4 0 1 4 0 0 0 0 0 0 0 0 0 0 0 0 0 1 787 0 0 0 0 0 1 0 1 0 0 0 0 0 0 0 0 0 0 0 756 48 0 10 1 5 0 0 1 0 0 0 0 1 0 0 5 0 0 0 1 1 4 0 0 0 0 3 0 0 0 0 1 0 108 0 1 0 1 8 0 0 0 1 0 0 0 0 0 0 0 0 0 0 0 5 3 1 8 0 1 1 34 2 0 0 0 0 0 0 0 0 0 1 0 0 0 0 0 0 0 40 0 0 0 0 5 0 0 3 0 1454 42 0 0 3 0 0 0 0 0 1 2 0 0 0 0 0 0 0 2 1 0 0 0 0 0 1 0 0 0 0 2 0 0 1 0 0 0 0 0 2 0 0 0 0 0 1 72 0 0 12 36 1 0 6 0 0 0 0 0 0 0 0 1 0 0 0 0 0 1 0 3 0 0 0 0 0 0 0 0 0 2 0 0 0 6 1 0 0 0 0 5 46 0 0 1 0 0 95 55 0 0 3 0 132 2 0 1 6 1 0 0 0 0 4 1 0 0 0 2 10 0 0 0 0 0 0 0 0 1 1 0 0 0 1 0 1 0 0 0 9 0 0 1 0 0 28 0 0 0 57 25 0 0 0 0 0 0 1 0 71 0 0 0 0 0 4 0 3 0 84 266 0 0 0 0 0 2 0 0 40 0 665 0 1 0 0 3 5 0 0 86 0 0 0 0 0 22 0 7 0 0 9 21 1 2 0 0 4 0 0 0 0 0 0 0 6 2 2 0 2 0 0 0 0 19 1 0 0 0 0 0 0 1 0 0 0 0 36 3 0 40 3 3 110 3 0 0 1 0 0 0 0 0 0 1 0 0 10 0 0 1 11 0 0 0 1 0 0 1 0 13 0 0 0 1 3 0 0 0 0 0 2 1 0 8 0 0 0 45 70 0 1 44 0 0 0 0 0 1 15 0 1 0 0 1 0 0 1 0 0 6 2 0 0 0 0 49 677 0 2 2 18 0 3 0 19 1 4 0 0 0 3 0 0 1 0 34 310 0 34 250 27 0 0 54 0 2 1 2 0 0 0 0 15 1 0 13 168 0 0 4 1 0 182 24 0 0 4 7 1 0 0 1 0 0 0 73 3 4 0 17 0 0 0 2 0 2 0 0 13 5 1 4 1 0 2 5 1 0 242 141 1 5 7 0 0 0 0 0 0 2 0 0 110 0 1 70 47 0 0 0 0 1 1 1 0 0 0 1 0 0 3 1 0 1 71 12 0 1 0 0 0 1 1 0 125 1 0 0 0 0 0 0 0 0 7 0 29 6 0 1 0 0 0 0 0 0 0 0 0 0 0 0 0 0 0 0 0 0 20 0 1 0 0 1 40 2 0 9 0 0 0 0 1 22 0 0 0 0 0 0 0 0 0 0 0 0 0 0 0 0 1 0 105 1 220 349 94 3 0 164 0 0 4 95 2 128 0 1 0 0 1 2 0 0 0 1 0 0 0 0 0 2 0 0 0 129 0 0 68 0 11 0 0 0 81 0 0 3 2 0 13 3 113 0 0 0 0 1 0 1 0 0 4 0 5 1 0 0 1 0 0 0 1 0 0 0 0 0 7 0 0 0 1 0 0 0 10 2 1 0 0 0 0 0 9 1 0 0 0 2 0 3 8 686 0 0 0 0 0 1 374 616 0 1 0 0 2 2 0 1 1 0 79 0 0 0 0 1 0 0 3 0 2 1 0 0 389 22 0 0 0 1 0 0 0 1 9 3 56 0 29 616 0 1 0 62 3 14 0 2 0 0 0 0 0 0 0 22 0 0 0 0 0 0 0 0 0 0 0 2 57 1 0 1 0 6 0 0 0 0 40 60 0 12 10 1 6 2 3 2 1 0 0 2 1 0 2 0 0 3 1 0 0 2 0 0 0 2 1 0 0 0 0 5 1 0 17 203 0 2 0 0 3 4 0 1 0 0 2 9 0 8 0 0 0 1 0 0 0 6 15 0 56 31 0 0 5 0 80 1 0 0 14 1 1 1 2 2 0 0 0 0 0 0 1 2 1 1 2 3 0 4 26 1 5 2 0 0 0 3 0 0 0 1 0 1 0 0 2 0 0 2 0 485 0 14 0 0 0 0 2 0 0 0 0 0 0 0 1 0 0 0 23 0 0 25 27 0 0 2 0 0 57 1 0 1 0 0 0 7 0 0 4 5 0 0 0 0 0 2 6 1 6 1 1 0 0 0 0 1 0 0 0 3 118 2 5 0 0 0 SP7 Bacteria;Firmicutes;Clostridia;Negativicutes;Veillonellaceae;Veillonella;dispar 6 390 3 355 28 341 26 565 12 499 704 17 80 37 26 567 0 19 129 281 554 133 415 153 590 377 29 119 9 37 36 369 0 71 941 294 309 49 26 21 150 26 33 1293 241 48 400 36 62 0 1172 275 1091 330 157 122 532 89 6 206 26 42 131 47 704 3 34 323 1 1 758 30 8 370 1295 3 136 540 216 114 170 363 125 18 844 54 584 533 188 283 14 656 12 93 137 19 0 0 0 208 550 558 40 19 7 52 259 5 27 47 621 71 493 179 198 13 152 1440 943 1 260 304 467 284 1044 116 380 171 2319 14 122 104 14 112 1030 33 488 554 99 457 66 3 292 56 0 356 248 184 832 71 630 38 372 265 166 36 14 25 19 120 14 2 10 20 15 48 8 275 56 11 824 12 0 90 272 4 14 19 19 208 600 113 46 674 2439 11 6 100 2 424 924 310 230 167 659 650 2208 468 62 9 6 3 984 2 18 1293 0 2 36 751 223 51 269 117 194 605 50 148 3 41 757 483 164 30 534 417 325 129 62 661 1373 3 30 127 198 1552 128 245 104 77 111 168 872 59 27 97 46 1 319 89 526 26 26 197 2 73 222 14 329 384 97 218 35 257 164 141 19 415 0 27 41 0 16 585 1194 0 69 545 415 7 1025 1408 286 217 148 696 2756 463 1112 1899 417 1956 67 22 8 57 633 495 0 391 1074 468 2224 436 26 95 3006 587 1809 14 114 717 712 20 963 438 1197 143 1960 940 0 1 389 0 1961 0 16 1 11 0 22 430 6 46 0 0 4 10 779 102 12 1443 0 78 556 2 9 114 40 0 399 69 0 226 1497 284 284 94 3 1 1518 109 0 1107 33 158 7 48 6 0 169 9 115 515 9 271 11 1 287 925 764 1 93 12 1 66 126 320 0 29 366 1073 0 127 20 819 125 0 36 227 0 2 1946 765 37 118 0 178 2 94 43 178 53 1285 1458 43 57 1 784 2 155 1251 916 2472 1 129 1177 1 56 8 0 7 121 68 370 84 88 0 848 90 262 34 1 1171 77 2067 14 319 273 245 563 518 718 0 1120 511 88 634 15 39 0 4 0 1 280 28 947 566 7 6 1732 2318 13 15 159 87 220 389 16 539 246 478 878 522 419 521 26 12 1 1079 528 147 1495 519 749 1 572 358 0 1207 1179 277 5 306 14 0 193 211 18 476 1045 1621 384 190 36 1 269 611 0 3 144 1021 7 31 35 215 1 7 5 155 0 71 63 96 422 0 59 1407 86 27 2014 530 313 1789 0 1 5 205 45 1735 348 508 729 83 117 0 19 203 4 495 1 944 1170 1173 206 168 7 1116 1 210 204 0 8 27 8 32 119 1 0 0 1 61 70 0 43 68 40 4 72 1 686 0 1129 460 2 845 1134 1946 0 2 1 559 0 32 30 13 0 116 100 16 0 88 1121 13 60 0 73 21 1336 235 1119 2062 209 0 29 87 9 45 76 109 199 64 1273 10 114 24 502 1 558 143 221 410 123 30 97 70 1 3575 1236 221 292 809 89 252 132 512 42 880 1 353 266 4 96 765 522 12 1231 1404 2837 139 12 202 0 23 0 59 631 1 360 6 2234 53 761 2 0 76 670 104 90 27 46 0 792 907 54 242 6 505 8 319 58 1251 484 1018 60 41 474 446 2723 486 33 3 1743 786 78 86 1 785 78 499 30 135 287 12 782 491 116 64 348 312 622 3911 438 275 33 416 161 300 149 639 1 84 66 21 5 0 4 116 89 423 347 62 45 875 508 143 21 298 1 150 26 1486 2396 34 110 0 44 185 173 1075 23 1 521 35 269 626 636 68 94 1324 1218 221 0 482 214 67 841 31 236 0 12 75 1378 148 0 548 292 2 4436 0 56 131 44 310 0 3 1 0 849 1 2 72 500 6 28 340 4 0 67 34 437 401 1241 126 17 134 693 70 11 2 74 292 53 1 11 297 286 279 349 263 978 461 727 1374 850 236 674 10 504 0 659 538 20 4 80 2516 110 593 1619 0 638 2 617 2319 103 11 462 83 40 0 134 1806 609 342 225 17 189 151 681 104 99 166 30 1954 168 0 5708 214 381 400 245 4897 0 1056 4825 1526 347 0 19 71 644 174 1449 1073 52 638 439 141 193 400 28 713 0 493 1007 1 0 341 261 0 225 44 78 120 145 4961 21 497 40 0 174 21 675 359 1764 466 750 1087 332 2380 473 0 506 770 46 393 1193 7 354 1295 2571 37 1510 261 2 1822 1315 97 223 2 227 2298 2 568 4 45 1 246 145 800 203 15 162 3213 209 521 1929 1265 733 223 1821 87 724 661 247 332 0 172 1674 699 223 102 2758 542 460 366 1494 55 883 94 121 441 3 1643 3281 1719 2 0 10 1 5 45 0 0 98 18 181 0 2310 1126 183 568 21 1363 470 5 75 465 458 1 26 208 29 363 236 2 196 40 1096 44 179 129 3 42 376 24 24 326 38 14 81 110 3 902 234 3 43 265 0 42 113 16 16 0 36 129 1 31 3 0 53 58 7 47 3 273 1 0 39 1 1 137 320 2 76 48 0 2 139 107 105 252 27 2 2 23 2 27 0 20 139 0 11 160 0 88 73 0 17 0 16 0 304 318 1 43 12 2 4 87 26 0 129 5 7 0 193 134 1 1 7 0 216 19 3 0 394 165 3 161 41 0 0 55 27 4 0 106 0 0 75 5 82 29 17 0 7 70 77 227 58 4 50 16 18 5 21 29 0 22 0 77 260 2 32 64 7 5 409 5 0 411 3 0 164 86 0 10 8 189 2495 4 322 83 77 197 20 67 0 76 518 7 167 2557 22 391 4 367 105 222 142 73 3 130 149 0 2 80 112 0 1 165 1002 3 51 611 0 532 38 124 0 206 750 6 843 27 1 122 2387 135 13 293 331 178 9 114 1 63 9 1 5 188 0 102 62 0 152 477 1 370 1286 1 23 7 202 0 76 218 3 20 143 1 10 13 537 27 220 52 0 51 3 0 18 71 318 2 825 83 4 0 13 42 3 509 27 2 319 54 4 78 54 59 1 74 168 1 41 9 13 124 142 6 0 167 226 9 6 345 33 0 40 140 1103 19 8 725 51 397 0 49 2 1 11 8 45 225 8 1 110 3 66 26 59 57 407 10 0 0 2 27 1 3 0 3 64 0 78 4 0 158 6 1 49 10 51 169 32 321 219 1 339 48 1 2 170 96 28 712 189 107 12 9 1 18 18 2 0 2 2 119 6 659 11 0 114 91 538 322 9 6 21 8 2 46 1216 3 8 5 2 0 0 112 355 4 248 203 33 82 0 1 441 14 1 27 97 2 3 13 767 8 635 501 5 18 153 597 1 43 57 4 177 16 2 375 101 8 2 10 129 23 113 908 32 124 99 0 69 80 281 1 43 1053 179 238 0 15 59 21 12 249 0 907 93 120 8 11 1 0 0 2 7 8 176 0 82 4 1 14 10 260 1 24 616 2 0 64 88 12 3 2 0 47 27 21 7 19 72 6 99 950 71 3 6 28 0 149 20 23 104 462 23 2 1138 305 1 108 77 3 2 699 10 526 1065 33 0 64 473 935 4 0 46 58 37 0 42 6 16 3 10 0 0 365 4 157 0 23 316 0 117 8 596 878 0 0 2 27 63 38 87 1 244 7 0 33 142 15 104 34 177 109 18 368 1 51 642 1 932 40 429 1 266 1696 1 223 674 1 311 598 1 2 1211 23 61 2 0 21 0 11 31 14 92 1 0 171 98 21 2 56 491 1 3 230 1 131 610 33 0 19 22 1 37 4 0 522 31 1 0 105 123 2 20 886 565 1 470 372 45 1 28 3 112 12 309 2 4 1 0 51 1 37 65 5 108 4 579 558 23 9 172 2 51 397 9 7 618 3 2 249 23 1 622 70 3 190 97 1 460 830 1 3 0 77 169 1 79 1 2 128 117 5 26 1 27 212 40 1 22 31 1 4 143 19 3 22 17 2 3 16 50 107 319 2 2 870 187 17 402 32 54 3 0 434 36 2658 10 94 323 10 547 15 1 342 156 51 5049 2 1 2 7 2360 160 167 79 2 3696 147 18 53 52 3 15 5 1 245 848 312 249 507 2 281 64 5 229 60 48 48 88 79 0 2105 224 0 90 2215 101 31 403 347 4 66 1009 4 2 94 17 1 129 33 0 0 50 31 0 56 105 2 129 20 10 6 294 4 8 30 30 0 128 67 0 11 176 18 46 10 SP70 Bacteria;Bacteroidetes;Bacteroidia;Bacteroidales;Prevotellaceae;Prevotella;oris 0 6 13 1 0 29 105 1 5 12 0 6 53 1 0 2 21 0 4 5 2 3 0 31 8 4 0 4 34 19 8 1 14 427 12 4 0 232 0 2 0 0 2 2 0 38 8 0 38 1 4 5 15 49 5 0 10 4 3 0 3 0 0 241 1 0 11 0 54 7 1 0 0 3 6 0 0 2 1 1 6 0 2 5 0 0 0 4 6 30 4 1 15 19 2 0 1 2 1 16 2 22 0 3 1 14 0 36 1 2 296 29 3 26 18 3 0 7 11 0 3 84 0 4 1 0 13 0 19 11 0 1 0 1 2 0 74 10 4 1 12 0 1 33 27 1 26 64 0 0 12 0 31 6 17 2 0 0 5 3 0 5 4 44 2 0 16 4 0 1 28 6 0 22 2 0 0 0 0 6 0 0 2 50 0 0 0 1 0 2 0 4 0 2 3 8 0 2 1 0 14 0 11 1 0 39 2 4 7 14 20 1 2 0 5 0 57 0 0 1 8 12 1 3 4 0 19 0 10 39 9 0 10 7 24 1 19 4 0 13 0 0 66 1 9 54 1 0 16 0 6 0 0 0 0 0 0 0 4 9 20 1 1 3 2 1 4 2 0 0 10 0 0 3 120 0 9 0 54 0 43 25 0 187 0 1 5 0 0 3 25 0 9 0 278 41 11 0 0 187 49 0 375 25 2 1 325 0 7 0 0 9 0 0 44 4 0 10 29 58 0 0 0 0 9 0 0 0 0 0 0 9 0 0 0 0 0 0 0 0 0 1 0 0 0 0 0 1 0 0 0 0 0 0 0 0 0 8 0 0 0 0 0 0 0 0 0 0 0 0 0 0 22 17 0 0 0 0 0 226 0 0 13 0 0 0 0 183 1 0 0 0 0 0 0 0 0 0 0 32 0 0 0 6 37 0 0 7 1 0 0 163 0 0 0 0 20 0 9 0 0 0 19 196 0 67 0 0 0 0 0 0 309 2 0 1 12 0 0 1 1 0 0 0 0 2 0 0 12 79 0 4 0 0 0 57 0 1 0 25 1 0 0 0 0 0 0 16 0 0 9 0 0 0 0 0 53 25 0 40 4 0 18 0 0 0 1 17 0 10 8 0 25 5 0 0 0 0 0 7 25 0 0 0 0 0 0 0 2 0 46 0 0 0 0 0 3 8 0 0 0 4 0 0 0 12 0 0 1 16 0 0 0 0 3 0 143 0 1 1361 0 0 0 0 2 0 3 113 0 13 6 19 0 0 2 0 0 0 0 49 0 36 0 15 27 0 0 0 0 2 7 0 0 3 0 4 0 0 0 0 0 0 1 0 3 23 9 0 0 1 0 0 0 1 0 8 0 3 0 0 0 0 0 12 0 0 0 0 1 21 0 0 0 0 1 0 0 0 68 27 0 0 0 0 0 11 0 0 5 0 0 0 63 24 0 1 5 0 7 0 0 43 15 0 4 0 0 61 1 0 21 0 0 12 0 187 45 0 1 0 0 0 72 181 0 2 9 0 0 1 0 0 0 1 0 13 13 0 0 0 0 3 1 0 0 4 11 0 0 0 3 0 12 1 0 92 0 23 0 25 18 0 155 181 0 8 64 0 11 10 18 0 24 1 0 1 0 0 4 8 0 0 1 0 0 65 5 8 1 0 143 42 0 1 0 71 0 8 86 8 0 85 8 1 0 0 0 0 94 0 34 0 10 0 93 0 11 0 0 0 0 32 0 0 0 0 0 59 0 85 4 0 28 4 0 3 4 0 84 708 2 0 0 35 0 0 0 0 0 0 0 0 9 0 0 2 7 0 0 0 0 0 1 0 0 0 0 0 15 0 0 0 0 0 1 14 0 0 0 0 0 4 0 0 0 0 0 1 24 0 0 0 0 0 0 0 0 0 0 0 0 155 59 0 10 215 5 0 8 0 0 0 0 0 0 0 0 108 4 0 0 0 17 0 0 1 1 0 0 0 2 0 0 0 121 0 3 0 6 0 2 19 0 0 28 0 0 0 7 0 10 2 0 5 0 0 16 0 2 0 15 0 0 0 0 0 0 0 0 0 2 16 0 0 0 0 0 16 413 0 4 15 0 0 0 0 0 0 1 0 0 0 26 91 0 0 2 0 0 229 5 0 2 6 0 11 25 0 0 0 28 0 43 67 0 40 9 0 0 0 0 5 0 101 0 1 0 1 6 0 57 0 0 62 29 0 25 75 0 4 0 0 34 39 0 131 0 78 5 18 8 0 29 32 0 11 0 0 197 0 0 0 0 0 1 21 0 0 0 0 0 11 0 0 0 0 0 0 0 0 4 40 0 53 23 0 1 2 3 0 7 87 0 16 2 0 14 0 150 0 1 0 0 39 0 0 28 21 4 0 27 2 1 44 13 0 0 0 0 3 1 0 0 0 64 92 0 0 0 0 174 10 0 0 0 6 0 0 2 0 0 6 1 0 0 0 0 0 5 9 0 39 0 0 0 0 0 0 0 0 0 0 22 0 0 0 0 0 0 5 3 0 0 0 0 0 0 0 0 6 0 0 0 0 1 0 10 0 0 8 1 0 0 0 0 0 7 37 0 7 13 0 0 0 0 0 0 169 1 0 35 0 0 10 0 0 61 3 5 3 0 3 0 0 38 1 0 2 0 0 0 96 68 0 5 0 0 0 1 0 0 66 0 0 0 49 0 0 0 131 57 0 7 0 11 0 2 0 0 1 0 0 130 55 0 1 0 6 14 0 9 2 0 8 1 0 0 70 28 0 0 16 13 0 1 3 1 1 0 20 0 17 4 0 11 20 0 3 3 0 0 4 14 0 2 0 0 531 30 0 0 0 0 0 25 0 31 1 0 1 0 0 0 36 0 2 1 9 0 2 0 0 0 1 12 0 47 1 0 7 0 0 3 0 1 0 124 12 0 0 3 3 0 43 0 0 64 0 0 26 1 10 0 0 2 0 0 0 0 0 0 1 0 5 0 0 0 0 0 0 0 0 0 0 0 0 0 0 0 0 0 0 0 0 4 86 0 0 114 0 4 0 15 0 0 3 0 0 0 0 0 0 0 0 9 0 1 0 0 53 7 0 9 0 323 144 1 0 0 0 1 16 0 0 1222 22 0 0 22 0 0 0 0 0 0 0 0 0 0 350 0 0 0 0 0 610 1 0 0 0 0 1 0 0 0 0 1 0 0 0 0 0 52 0 149 39 0 0 0 0 0 0 0 2 0 0 0 0 0 0 214 0 0 3 0 3 0 11 0 0 39 31 0 2 3 0 0 0 83 0 0 71 0 29 23 0 8 0 0 0 0 0 1 0 0 37 16 0 2 0 0 13 1 0 0 0 0 0 0 0 0 0 5 0 0 7 0 0 8 0 0 0 32 0 0 0 0 0 0 1 0 4 18 0 0 27 0 0 0 183 5 0 0 0 0 87 38 0 0 92 8 0 23 81 0 8 16 7 0 38 5 0 2 0 0 39 0 0 0 0 42 0 7 0 0 1 0 0 1 0 0 121 0 0 0 32 19 0 2 1 8 27 0 0 63 3 0 0 1 0 0 0 0 1 0 0 12 0 21 1 1 1 0 7 0 0 48 3 0 0 17 40 0 2 39 0 4 7 0 0 18 4 0 0 0 0 0 0 3 0 2 1 0 7 10 5 0 0 15 0 8 2 0 10 60 0 0 7 0 0 3 0 0 155 0 0 0 106 0 0 0 0 0 0 5 4 0 1 9 0 1 0 0 0 0 0 0 14 1 0 1 0 0 0 43 2 0 3 0 0 3 3 0 192 1 0 0 46 7 0 2 1 0 0 0 0 0 128 0 15 0 1 0 0 84 0 2 23 0 0 8 1 1 23 2 0 15 0 0 0 11 1 0 2 3 0 0 0 0 0 300 0 0 29 31 0 71 2 29 0 0 113 0 0 0 0 0 0 64 4 0 79 11 73 25 0 0 0 0 0 0 105 4 0 12 5 0 270 0 2 47 0 0 2 32 0 3 0 0 17 55 0 18 0 270 1 0 2 0 23 19 0 2 9 1 0 98 1 0 7 63 0 1 0 0 0 85 5 0 0 0 0 0 3 2 0 0 0 0 0 10 1 0 1 20 0 11 0 0 1 3 0 6 0 SP721 Bacteria;Proteobacteria;Betaproteobacteria;Burkholderiales;Comamonadaceae;Ottowia;sp. HMT894 0 0 0 6 0 0 0 0 6 0 0 11 0 0 0 0 0 5 0 1 0 0 0 0 0 0 2 0 0 0 0 0 0 0 0 0 0 0 2 0 2 1 0 0 9 0 0 0 0 0 1 0 0 0 0 0 0 13 0 1 0 0 0 0 2 2 0 0 2 0 0 0 0 0 0 3 0 0 0 0 0 0 1 0 0 1 2 0 0 2 0 0 0 0 4 0 0 13 0 0 0 0 0 0 0 0 0 0 0 0 0 3 0 0 0 0 0 0 0 0 0 0 0 0 0 0 0 0 1 0 0 0 0 0 0 0 0 0 0 0 0 3 0 12 0 0 6 0 0 4 0 0 0 0 0 0 11 0 0 0 0 0 3 0 0 0 0 0 0 0 0 0 0 0 25 0 0 0 0 7 0 0 1 0 0 12 8 0 0 8 0 4 0 1 0 0 0 1 0 25 0 0 0 0 7 0 0 8 2 0 0 0 0 0 0 0 2 0 0 0 0 0 0 0 0 0 0 0 0 2 0 0 0 2 0 0 54 2 0 0 0 0 0 2 0 0 3 0 0 0 0 2 0 1 0 0 0 0 0 0 0 0 3 1 0 0 0 0 0 5 0 0 0 0 1 0 0 0 0 359 0 0 0 1 0 0 0 0 0 0 2 0 0 0 0 0 0 0 0 0 1 0 1 0 598 0 0 0 0 0 68 0 0 0 0 0 0 0 0 0 0 2 32 0 1 0 0 0 0 2 0 3 0 0 0 0 0 0 0 0 0 0 0 0 0 0 0 0 0 0 0 0 0 0 0 0 0 0 0 0 0 0 0 0 0 1609 0 0 0 0 0 0 0 0 0 0 0 0 0 0 0 0 3 0 0 0 0 0 0 10 0 0 0 6 0 0 0 0 19 17 0 0 0 0 0 0 0 0 13 10 0 0 0 0 0 0 0 0 8 753 0 2 0 1 0 1 0 0 3 0 0 238 0 0 0 0 0 0 0 0 0 0 0 0 0 0 0 0 0 0 0 0 0 0 0 0 0 0 0 3 0 0 1 0 0 0 0 3 26 45 21 0 0 397 31 0 0 0 0 9 15 0 0 0 0 0 0 130 144 0 0 0 0 59 46 0 0 0 0 0 6 157 0 0 1 0 0 3 0 0 0 0 0 0 0 0 0 0 4 4 0 0 0 0 0 0 0 0 0 0 0 0 0 0 0 0 0 1 0 0 0 0 0 0 0 2 18 0 0 2 0 0 170 0 0 0 0 0 0 20 2123 0 0 0 0 0 0 0 0 0 0 0 0 2 15 1 0 0 1 0 12 0 8 0 0 0 0 1 0 0 0 0 0 0 0 0 0 0 0 0 0 0 0 0 0 0 0 0 0 7 3 0 0 0 0 108 0 91 0 1 0 0 0 0 0 1 21 0 0 0 0 0 0 7 0 0 1 0 0 0 8 0 1 32 0 0 0 1 0 0 0 0 0 0 0 0 0 0 9 0 0 0 0 0 0 0 0 0 0 0 0 0 0 0 0 1 3 0 0 0 0 0 0 0 0 1 0 0 0 0 3 0 0 0 0 0 0 0 0 0 0 0 0 0 0 0 0 0 0 1 0 0 0 0 0 0 1 0 0 0 0 0 8 0 0 0 110 129 0 0 0 0 178 2 0 0 0 0 0 0 3158 0 0 0 29 0 0 0 0 0 0 0 112 0 0 0 2 0 0 5 60 89 0 5 0 0 0 11 43 1 7 1003 1 55 0 0 0 134 0 0 0 3 0 0 0 5 0 4 0 0 0 0 0 2 0 0 0 0 0 0 0 0 0 0 0 31 38 0 0 1 2 734 0 0 0 6 0 0 0 9 0 0 0 0 0 0 0 0 0 0 0 0 8 0 0 4 0 0 0 2 0 0 0 0 0 0 34 0 0 0 1 0 0 7 0 0 0 0 0 0 0 44 0 0 0 0 0 1 1 0 0 1 4 0 0 0 996 0 0 0 2 1 24 0 0 0 0 1 0 15 0 0 0 0 0 0 0 0 0 131 0 0 0 0 0 0 0 1 0 0 0 0 0 0 0 2 0 0 0 88 0 0 0 3 0 0 0 0 0 0 1 0 0 0 0 1 0 0 0 0 0 0 0 0 0 0 0 0 0 0 0 0 0 0 0 0 0 0 0 0 0 2 0 0 0 0 0 0 12 22 0 0 0 0 0 0 1 0 0 0 0 0 0 0 0 0 0 0 0 1 0 0 0 3 0 0 2 0 0 0 0 0 0 0 0 0 0 0 0 0 0 0 0 0 0 0 0 0 1 0 0 0 0 0 0 0 17 0 0 0 0 0 0 1 0 0 0 23 0 0 0 0 0 156 2 0 0 0 0 0 2 0 0 0 0 0 0 0 0 0 131 0 69 0 9 0 1 0 0 1 1 4 0 61 38 0 167 0 0 0 0 0 6 0 0 14 3 0 0 0 0 1 11 1 0 0 0 0 0 5 0 0 0 0 0 0 0 0 0 0 29 0 0 0 0 0 0 0 2 0 20 0 0 0 25 0 0 0 0 5 1 7 3 145 5 0 0 1 0 1 13 0 0 0 51 0 0 0 0 0 0 0 0 0 0 0 0 0 31 0 0 0 0 0 0 0 0 0 16 2 0 5 1 26 2 0 0 0 0 0 0 0 1 0 0 0 0 0 0 0 0 2 8 53 1 0 22 60 0 23 1 0 0 0 0 0 3 6 1 0 0 0 0 0 0 5 0 0 0 0 0 0 0 0 0 0 0 0 0 0 50 0 0 0 12 5 0 0 0 0 0 0 0 0 0 0 0 0 0 0 0 0 0 0 7 65 0 0 0 4 1 0 0 0 0 0 0 0 1 0 0 0 0 26 0 0 0 0 0 0 0 0 0 8 0 0 0 1 0 0 9 71 0 1 0 0 5 0 0 0 0 0 0 0 0 1 10 43 0 1 84 1 0 0 0 0 0 0 0 0 1 0 0 0 0 0 0 120 0 0 0 0 0 0 0 0 2 0 0 6 0 0 0 0 0 0 2 0 0 0 0 0 0 1 7 0 0 0 0 12 1 0 0 3 1 48 0 0 0 0 0 1 0 0 0 0 0 0 0 0 0 0 0 0 0 0 0 0 0 1 0 0 0 0 9 0 0 11 0 0 0 0 0 0 0 0 0 0 0 1 0 0 0 1 0 0 0 0 0 0 0 0 0 0 0 0 0 2 5 0 0 0 0 0 0 2 0 0 0 0 0 3 0 0 0 0 0 1 0 0 0 0 0 1 1 0 0 2 0 0 0 0 8 0 0 0 3 0 0 0 0 0 0 0 0 1 0 0 0 0 0 4 4 3 0 5 0 0 0 0 0 0 0 0 0 3 0 0 0 0 0 0 240 0 124 0 0 0 0 0 2 1 0 0 0 0 0 0 0 0 0 0 0 2 0 2 0 0 0 0 0 0 0 0 6 0 0 0 0 0 8 2 7 0 0 1 0 0 1 0 0 0 0 0 0 0 0 0 0 0 0 1 0 0 1 1 0 0 0 0 0 64 0 0 0 0 0 0 0 0 0 0 0 0 0 0 0 0 0 0 0 2 0 0 1 0 0 0 0 0 0 0 0 4 1 0 0 11 9 4 0 0 0 8 0 24 0 0 0 2 0 0 0 0 0 0 0 0 0 0 0 0 0 0 7 0 0 0 29 0 0 0 0 0 0 0 0 0 0 0 0 11 0 0 7 3 0 0 1 3 28 0 1 1 1 3 19 0 1 1 0 0 0 0 0 0 0 0 0 0 0 0 1 0 0 0 0 0 15 5 0 0 0 2 0 42 0 2 21 0 1 3 2 0 12 0 2 0 0 0 4 0 0 0 0 0 0 100 1 0 0 0 0 0 0 0 0 0 0 3 0 0 39 10 0 16 0 0 2 1 4 0 0 0 0 0 0 0 0 0 0 0 1 0 0 0 189 0 0 120 0 0 0 0 0 0 0 0 0 0 6 0 0 1 0 0 3 1 0 0 11 1 0 0 0 0 0 0 0 0 0 0 0 0 2 0 0 1 0 0 0 0 0 0 0 3 0 0 0 144 6 1 0 0 0 0 0 1 0 0 2 0 0 0 SP729 Bacteria;Absconditabacteria_(SR1);Absconditabacteria_(SR1)_[C-1];Absconditabacteria_(SR1)_[O-1];Absconditabacteria_(SR1)_[F-1];Absconditabacteria_(SR1)_[G-1];bacterium HMT874 1 2 3 0 0 16 0 14 5 2 7 72 10 5 3 0 8 12 33 6 0 0 3 5 16 0 2 0 0 27 10 3 75 0 3 0 6 0 3 7 1 4 8 1 0 0 1 0 0 0 8 0 0 3 0 21 0 14 8 34 0 5 0 0 199 18 4 0 8 171 35 27 108 0 0 37 1 0 0 2 0 0 2 13 0 2 0 1 0 2 0 0 6 26 0 16 0 6 8 0 8 13 0 0 15 16 0 3 34 2 0 5 3 0 3 5 0 0 11 0 1 0 0 25 1 2 0 1 2 89 45 0 0 0 3 4 0 1 22 4 0 7 0 12 0 7 19 29 2 5 0 0 0 2 0 3 3 0 0 0 14 8 1 0 6 5 14 2 11 0 0 0 13 11 7 0 7 1 9 21 0 0 38 3 1 11 12 1 3 9 0 11 3 0 1 0 0 0 6 10 10 0 0 0 4 0 0 11 0 0 3 0 4 0 0 9 0 2 3 10 42 3 0 16 1 0 10 5 0 1 0 5 3 0 0 68 9 4 0 64 0 0 0 6 0 2 2 1 1 0 0 10 6 4 0 0 0 1 2 0 4 4 5 10 2 0 0 12 0 42 4 7 6 0 0 0 0 2 4 0 11 6 0 0 7 0 0 0 0 4 4 0 8 0 18 44 3 0 0 0 1 1 2 7 25 0 0 0 1 0 0 0 0 0 0 0 0 24 0 0 1 40 1 0 0 0 0 0 0 0 0 0 1 0 0 1 0 8 0 0 0 0 0 1 0 0 7 0 0 0 0 0 9 0 0 3 0 0 6 0 0 2 0 0 0 2 0 1 11 0 1 0 0 22 2 0 0 0 0 0 0 0 10 4 1 0 20 10 0 0 0 11 0 9 9 0 1 5 3 19 0 0 0 3 76 0 0 6 2 1 0 7 0 8 0 4 0 0 4 0 0 0 0 0 0 0 0 0 5 1 1 17 6 4 0 4 2 0 0 0 1 0 0 0 0 0 0 25 25 19 0 0 3 22 0 0 0 0 0 3 6 61 0 8 5 5 0 3 1 0 0 0 2 42 4 0 0 0 0 4 88 0 0 0 43 2 22 21 55 14 0 1 0 45 110 0 0 1 0 2 4 2 0 0 2 9 1 40 0 0 4 1 0 0 3 0 1 0 10 0 0 1 0 0 1 0 0 8 1 4 1 18 9 13 19 0 5 2 1 3 0 0 0 3 2 4 50 1 0 0 2 0 14 2 23 4 0 5 0 5 1 3 74 1 0 0 0 0 0 0 0 0 0 3 15 2 0 4 2 0 5 0 1 1 0 58 20 5 15 0 0 0 0 0 7 0 1 0 0 0 0 0 18 2 28 0 71 0 2 16 35 2 5 3 0 0 2 0 0 18 1 0 0 8 0 24 80 0 0 32 2 0 0 16 2 7 1 0 0 0 0 4 12 71 57 0 0 0 0 2 0 0 52 0 9 0 4 0 62 0 0 0 1 0 6 0 0 0 1 2 0 0 108 10 63 3 6 96 0 3 0 3 21 1 0 5 0 38 0 1 28 0 0 3 3 2 0 0 0 0 0 43 0 0 2 0 0 0 0 0 2 1 2 14 0 0 0 0 1 0 0 0 2 8 0 0 20 53 1 0 2 0 8 3 67 0 1 0 6 1 6 2 0 0 3 2 2 0 11 2 1 1 32 0 1 0 3 10 8 40 8 17 1 0 2 0 37 18 0 5 6 40 7 23 0 2 1 0 19 17 0 6 0 2 0 10 7 0 0 1 5 15 0 1 0 3 15 0 0 3 0 1 0 0 0 0 3 9 0 0 19 0 7 4 0 90 1 0 0 35 0 0 0 0 0 0 0 3 5 0 0 3 0 1 0 0 4 6 1 2 9 0 5 0 0 0 2 3 8 0 0 16 0 0 11 0 19 4 0 45 0 2 4 0 0 2 28 12 24 16 3 0 25 24 4 0 1 0 1 0 1 0 8 0 1 0 0 0 0 0 0 0 0 0 0 0 0 0 1 0 0 0 0 0 2 0 3 0 26 15 1 9 0 7 1 39 0 1 4 74 0 0 0 64 0 0 0 15 14 3 4 19 0 4 0 2 1 9 0 0 19 0 5 4 0 0 2 3 17 0 5 1 6 35 0 8 2 0 0 4 0 0 0 59 0 0 269 0 1 8 0 4 0 1 18 0 90 0 0 30 0 0 1 2 0 0 0 11 0 3 10 0 0 6 9 5 2 0 0 0 0 10 3 0 0 2 0 0 4 0 0 20 0 2 8 0 0 0 0 0 0 0 1 2 0 0 2 1 1 4 5 84 7 7 8 6 0 9 1 0 4 1 1 57 1 0 1 0 0 0 1 28 0 0 0 0 36 28 0 2 59 9 2 0 5 4 0 0 4 1 0 0 70 0 6 4 1 4 16 0 0 0 2 0 3 1 2 96 0 0 2 0 0 1 0 2 0 13 2 0 0 0 0 6 10 3 0 1 0 0 2 0 0 0 0 1 2 0 1 6 4 0 5 0 53 0 0 0 0 0 7 29 0 3 21 0 1 6 0 0 0 19 0 2 112 0 39 1 1 1 10 0 0 2 4 0 1 1 2 0 3 4 46 3 0 2 3 18 2 13 0 5 6 9 7 0 0 2 0 4 1 1 2 3 2 23 24 26 0 0 1 13 4 5 1 0 38 69 11 4 3 0 0 0 10 0 18 4 0 0 0 1 0 4 0 16 0 12 2 6 0 9 3 0 1 0 0 0 228 11 0 12 3 2 4 11 0 42 3 0 1 0 0 0 3 1 21 16 13 0 16 3 2 42 7 12 1 0 0 7 15 0 1 3 2 0 7 0 1 10 8 0 0 13 44 0 6 0 0 2 3 3 49 34 0 0 1 0 3 1 38 11 0 8 0 0 14 3 0 25 2 0 0 14 102 5 50 1 19 7 47 0 42 37 1 0 0 0 0 17 4 0 2 11 0 0 0 21 0 2 4 242 6 0 0 0 4 1 2 140 1 0 6 0 2 5 7 2 0 0 0 2 52 68 6 91 4 0 40 53 5 0 3 0 5 23 2 0 0 1 0 42 1 0 2 19 0 0 0 5 23 5 0 1 1 1 11 0 1 15 0 10 3 11 0 1 0 3 9 0 0 7 1 1 0 1 0 0 2 6 0 0 2 0 0 6 0 0 0 0 1 0 1 3 2 2 1 7 16 0 0 0 3 0 0 40 91 0 19 0 0 3 84 0 1 0 0 1 0 0 1 0 0 4 54 21 3 1 40 0 0 0 0 5 14 14 36 0 3 4 2 0 2 3 0 16 2 1 1 9 2 9 3 0 0 4 0 0 0 0 0 4 0 5 12 2 9 4 2 20 1 1 27 0 4 4 2 2 9 2 18 0 0 0 0 1 1 0 4 1 4 1 0 1 1 1 4 0 1 7 2 0 0 8 0 0 12 0 10 8 15 26 17 3 2 21 14 0 4 41 8 9 4 42 0 3 3 3 2 1 0 32 1 0 0 10 1 0 39 0 0 17 18 3 7 3 0 16 20 0 1 0 93 1 25 0 6 29 0 1 2 21 0 1 2 7 4 1 0 0 3 7 1 22 0 3 0 25 10 0 3 3 0 8 0 3 0 0 0 0 3 5 0 22 9 0 5 0 0 1 0 2 0 0 8 0 123 78 53 19 1 0 2 0 3 6 0 0 5 10 1 0 0 0 4 3 1 4 23 0 13 21 3 18 7 3 14 28 0 4 0 1 1 0 0 0 0 1 5 0 29 23 3 14 15 0 0 5 2 70 69 0 53 14 2 4 1 8 0 30 2 0 7 0 9 0 1 7 0 5 0 0 5 0 0 1 2 2 3 3 10 1 0 2 7 0 0 2 6 1 0 13 1 0 0 5 3 4 9 1 1 19 2 1 0 0 0 0 2 0 0 0 1 0 9 1 26 13 4 7 1 0 0 52 12 25 16 1 0 3 3 0 0 0 1 1 1 27 0 0 28 1 0 0 0 0 1 20 0 19 0 0 0 0 9 0 0 7 0 0 0 8 0 3 2 8 20 8 0 2 1 0 0 0 1 0 32 0 1 59 28 2 0 0 SP73 Bacteria;Bacteroidetes;Bacteroidia;Bacteroidales;Prevotellaceae;Prevotella;sp. HMT472 0 0 3 0 0 1 7 0 0 0 0 2 0 0 7 0 4 0 2 1 0 0 1 2 15 0 0 2 16 138 1 0 215 55 27 0 0 0 0 0 0 0 0 6 1 10 1 1 6 0 0 2 0 1 0 0 5 0 0 69 0 5 0 0 0 1 0 1 49 0 25 9 0 0 0 0 0 0 0 2 1 0 0 2 0 0 0 0 10 4 12 3 8 219 0 0 2 93 2 0 1 4 0 0 0 9 0 4 0 6 0 2 0 7 0 0 0 0 10 0 0 9 0 8 0 3 2 0 1 32 9 49 0 0 5 9 5 24 0 0 0 1 7 3 0 1 5 16 1 144 0 0 0 0 0 0 1 0 0 0 1 7 0 6 0 0 0 0 1 0 0 1 0 2 0 0 0 0 0 59 0 4 1 2 1 0 0 1 0 4 0 0 0 0 0 2 0 0 0 6 4 0 1 0 0 3 1 4 3 0 0 0 0 0 0 3 0 0 0 0 2 2 0 0 7 0 6 5 2 0 59 1 16 2 1 1 0 0 5 0 0 0 0 1 0 0 4 0 6 0 0 29 0 5 0 0 2 0 0 0 6 0 0 0 27 8 0 1 0 0 22 0 0 0 54 0 0 0 0 0 0 47 0 3 0 3 0 13 0 0 0 0 42 0 0 0 5 12 0 0 0 0 85 1 0 0 10 0 36 0 0 0 5 0 0 0 0 216 16 0 0 0 0 0 0 0 0 0 0 0 0 0 0 0 0 0 0 0 0 0 0 0 0 2 0 29 0 0 0 0 0 0 0 0 1 0 0 51 2 0 0 1 0 3 3 0 0 1 0 0 0 0 0 11 0 0 0 0 0 0 0 0 0 1 0 0 0 46 0 0 17 1 0 0 0 0 0 0 3 2 0 0 0 0 0 0 0 0 0 0 18 9 0 0 0 0 0 0 295 0 0 0 0 0 0 0 0 0 0 0 0 0 0 1 0 0 0 0 1 0 2 0 0 0 0 23 0 0 30 0 0 0 0 0 0 42 0 3 0 1 0 0 0 0 0 0 0 0 0 0 29 0 0 14 43 5 0 0 0 0 0 0 0 0 6 0 61 12 0 65 0 137 0 0 1 0 0 0 0 11 0 0 0 0 33 0 0 37 0 0 7 0 0 0 0 0 4 9 0 0 0 2 0 0 2 8 0 0 0 1 0 0 0 0 46 0 31 4 0 1 0 18 9 0 6 0 1 1 0 0 0 5 0 0 0 0 0 14 0 20 0 0 0 0 8 20 0 0 0 0 53 0 0 18 0 15 0 0 3 0 0 0 0 0 0 37 0 0 0 0 0 0 0 0 0 0 0 2 0 0 0 0 0 7 0 0 0 0 30 0 0 0 0 0 0 2 21 0 9 33 62 0 0 0 39 102 89 0 0 2 0 0 96 0 0 0 12 0 0 0 0 0 0 0 0 0 0 74 941 0 17 1 0 0 0 0 0 0 0 0 0 0 1 8 0 0 0 0 0 0 0 125 0 0 0 24 110 0 0 1 0 0 0 0 0 36 27 0 0 0 0 0 0 0 0 0 0 0 0 0 0 0 0 1 0 0 0 0 0 0 0 0 17 3 0 0 0 0 0 0 0 0 0 1 0 0 0 0 131 0 22 15 0 1 4 0 0 3 20 1 0 1 15 0 3 0 0 10 0 0 0 9 23 0 83 39 0 0 0 0 0 0 0 3 6 0 0 0 0 0 0 0 129 0 0 0 0 189 81 0 8 0 0 39 0 0 55 4 0 0 0 31 7 0 0 1 0 0 3 0 4 0 2 0 0 0 5 0 0 0 0 0 0 0 0 123 0 0 0 3 10 0 0 0 0 0 0 0 0 0 0 38 0 0 0 0 0 108 66 0 0 0 46 5 0 0 0 0 2 0 0 5 0 0 0 0 0 0 5 0 3 0 121 0 0 0 0 0 0 0 17 90 0 68 0 1 0 0 32 0 18 0 0 0 11 0 0 0 0 0 0 0 0 53 356 0 2 0 0 0 12 0 0 0 1 0 0 0 0 0 0 0 0 0 0 0 0 0 0 0 0 0 0 0 0 0 0 0 0 0 9 0 1 52 0 169 9 38 0 1 16 4 144 1 0 0 0 0 0 0 0 0 6 0 0 0 0 0 0 0 0 0 0 1 0 0 0 0 0 0 0 0 0 0 0 0 1 14 0 11 7 2 88 0 0 0 0 53 0 0 0 0 1 3 7 21 0 0 0 0 5 0 0 0 2 0 0 0 0 0 0 46 0 0 0 0 0 0 0 0 0 0 0 0 0 0 62 39 20 0 0 7 0 22 0 0 0 0 2 0 5 0 0 29 117 0 0 0 0 0 0 0 0 0 0 0 0 0 0 0 1 0 0 0 0 2 0 1 0 0 0 0 0 0 2 0 54 0 0 0 0 0 0 0 5 12 1 0 0 0 2 17 0 0 0 0 0 0 0 0 12 0 0 0 0 0 0 0 0 2 5 0 0 0 0 0 0 0 0 32 0 0 0 0 29 0 0 0 0 0 1 0 0 0 0 0 0 0 0 0 0 0 0 0 0 0 0 26 0 1 0 0 0 0 0 0 9 9 42 0 0 0 0 0 0 0 0 0 0 0 0 0 0 0 0 0 0 0 0 0 0 0 0 0 0 0 0 40 1 3 3 0 0 54 0 3 0 0 0 70 42 0 4 3 1 8 0 0 0 4 0 0 0 0 0 0 0 0 42 0 0 0 0 0 0 1 0 0 0 0 0 0 7 0 14 0 0 0 0 5 0 0 0 0 9 2 0 0 0 0 0 0 0 9 14 0 16 0 0 0 0 0 0 0 0 0 4 0 0 0 0 0 6 3 0 0 5 11 0 0 0 0 0 0 0 0 0 5 0 0 60 0 0 1 0 0 8 1 0 0 2 0 0 0 0 0 0 0 0 7 3 1 0 8 1 0 0 0 0 0 0 0 1 15 0 138 68 0 0 27 0 0 0 4 0 0 3 0 55 5 0 0 92 2 0 6 8 0 0 0 0 0 8 7 0 0 0 0 0 0 0 0 2 0 1 21 5 0 0 0 144 98 1 0 0 3 0 0 169 0 0 0 0 1 0 4 0 0 0 0 0 1 0 0 0 0 1 1 0 0 0 0 0 0 0 0 0 0 0 0 0 0 0 0 57 78 0 0 0 0 84 0 0 0 4 0 0 0 0 0 161 312 0 1 53 0 0 0 0 0 0 0 0 0 5 0 0 0 5 0 0 0 0 0 0 0 4 31 0 0 0 3 28 0 0 0 0 0 1 0 0 0 3 0 0 0 2 0 0 0 0 0 0 0 0 2 8 0 1 0 0 0 0 0 0 0 0 1 0 0 0 28 49 6 0 14 0 0 0 0 0 0 0 0 0 0 0 0 0 23 0 0 3 0 0 0 16 0 0 9 0 2 0 0 0 17 0 0 0 0 22 32 40 0 12 0 0 0 0 0 0 0 1 0 0 7 25 0 0 0 0 24 0 0 0 0 0 0 10 0 0 2 0 0 4 0 0 0 37 0 10 0 0 4 1 0 9 10 0 0 6 5 0 0 0 0 0 0 0 0 3 0 0 0 0 2 0 0 0 0 0 0 0 15 0 0 0 0 0 1 4 0 0 8 0 0 0 0 0 0 0 0 0 0 21 0 0 2 62 0 0 13 0 0 28 6 0 0 0 0 6 0 0 0 0 0 0 0 0 0 7 1 0 0 0 0 0 0 0 0 2 0 0 3 0 0 0 0 0 0 0 11 0 0 0 0 5 14 7 0 0 0 0 0 22 1 0 1 0 0 0 6 0 0 0 0 2 1 0 0 2 0 0 0 1 0 4 0 0 51 0 8 0 0 1 0 0 0 0 0 0 0 0 0 1 6 60 0 81 0 0 0 0 0 0 0 0 0 0 33 0 5 0 0 0 0 0 0 0 0 0 0 0 0 24 0 0 0 0 30 0 0 0 1 67 0 0 0 0 0 1 0 0 0 0 0 0 0 0 99 28 0 0 1 0 0 3 71 0 0 0 0 0 7 0 0 0 0 0 0 0 2 0 0 0 0 0 0 0 1 50 0 0 0 SP74 Bacteria;Bacteroidetes;Bacteroidia;Bacteroidales;Prevotellaceae;Prevotella;histicola 28 139 2 1814 4 57 2 750 1 154 3748 6 244 1 2 600 39 2 105 0 583 48 25 206 229 116 1 311 1 0 0 521 0 768 493 6 917 15 27 2 2 7 0 1249 742 183 86 307 227 0 3314 1266 2214 2 838 0 4797 212 7 0 1 0 10 28 26 1 0 1980 7 13 359 117 0 436 0 0 1758 152 3 4 26 206 3 49 5140 75 282 1013 0 3469 0 5387 4 9 35 0 0 2 0 1765 10 595 267 0 14 1 23 0 25 16 17 0 4325 81 673 3 467 90 512 0 138 14 724 156 1885 196 4111 226 1396 1 0 23 8 45 2501 4 2673 853 0 0 102 4 9 5 1 2220 1243 477 683 0 36 0 0 10 185 0 0 132 494 32 4 0 57 5 0 82 1 194 0 25 175 1 1 0 1856 80 19 14 3 18 34 0 2 2594 10075 0 0 55 0 171 925 4 387 64 1088 35 4230 634 59 25 0 0 1674 0 10 4415 1 1 4 0 0 15 64 6 19 377 14 100 2 0 54 233 16 12 20418 365 109 24 64 917 2333 0 118 9 0 0 1245 817 189 14 7 1 265 4 5 501 85 0 8616 30 1092 1 0 416 0 0 52 0 6649 1948 242 6528 0 1878 2388 508 986 3368 0 0 0 0 0 0 1 0 0 0 6 0 2 8 146 7 2 0 160 2 0 7 5 0 0 0 0 1 0 2 0 10 3 20 27 24 0 0 16 0 1 0 0 0 0 0 11 3 0 0 0 2 0 0 9 0 22 0 0 0 0 2 0 1 0 0 0 0 0 6 0 0 1 1 0 0 0 0 0 1 1 0 1 0 0 1 0 0 0 0 3 0 0 0 0 1 0 0 0 2 0 0 4 0 1 1 0 0 1 5 0 0 0 0 0 0 1 0 0 6 0 0 0 0 0 0 0 0 0 0 0 0 2 0 0 0 0 0 0 0 0 1 1 1 1 2 0 0 1 0 2 0 0 6 173 19 3 1 0 0 0 0 0 1 0 0 1 2 1 0 0 1 4 3 4 2 0 0 0 0 0 0 0 7 3 0 0 0 0 1 3 4 2 0 0 0 0 0 87 1 0 0 10 1 1 0 0 0 3 28 0 2 1 5 75 14 6 6 4 1 0 1 1 0 3 5 2 1 0 0 0 2 18 0 0 0 0 0 2 0 2 0 1 3 0 1 1 0 7 0 0 0 0 0 1 0 1 0 0 0 0 0 0 3 0 0 0 0 2 1 0 2 0 0 3 1 0 0 1 8 0 0 2 0 0 0 0 0 0 2 0 0 0 5 0 5 21 7 0 0 0 1 0 0 0 1 0 0 0 0 0 0 0 0 0 0 0 9 0 0 1 0 199 0 0 0 0 0 15 0 0 0 0 8 1 0 0 0 0 2 0 0 0 0 0 0 0 0 0 0 1 0 0 0 0 0 0 2 0 1 2 0 0 0 0 0 0 5 19 0 0 0 0 0 0 9 0 0 0 2 3 0 0 0 0 1 1 9 3 1 0 16 1 0 2 18 1 0 20 0 2 0 1 0 0 0 0 0 0 0 2 6 24 0 3 0 0 0 0 0 0 0 0 0 6 0 0 3 0 0 143 0 0 0 1 1 0 0 3 0 0 1 5 0 3 0 0 1 0 0 0 1 3 0 5 0 0 7 0 0 0 0 2 11 9 7 0 4 17 0 0 1 0 1 3 0 1 0 0 1 0 0 3 1 1 0 1 1 0 1 0 0 0 6 0 0 0 0 0 2 2 21 1 0 0 0 3 4 1 0 3 11 0 0 0 10 1 3 3 0 0 0 17 0 1 0 0 0 0 0 3 0 0 1 3 0 0 0 0 0 1 0 0 0 0 0 0 0 0 0 0 0 9 37 2 6 0 0 6 4 2 0 0 0 0 0 1 0 0 0 0 0 0 0 2 0 4 1 8 0 0 0 1 1 2 0 0 0 34 3 0 0 0 0 0 1 0 0 0 0 0 0 0 0 0 0 3 0 0 2 0 0 2 20 0 1 0 0 1 0 0 1 0 0 25 0 0 0 0 0 1 1 0 2 0 0 0 0 0 0 0 3 0 0 0 0 0 0 0 2 2 0 0 1 1 0 0 1 0 0 1 0 1 0 0 7 12 1 0 21 2 2 2 0 0 0 1 0 4 1 1 0 3 0 9 2 0 1 3 2 2 1 1 1 3 5 0 1 1 1 0 5 6 2 1 26 4 0 5 0 1 3 1 0 0 3 0 5 0 10 17 7 4 0 2 0 0 0 0 2 2 0 12 0 1 1 0 7 0 0 7 0 0 0 0 0 1 0 0 0 0 18 1 4 0 0 0 0 0 3 5 9 89 93 17 24 55 19 6 0 29 3 39 11 47 4 1 0 29 150 9 111 496 10 196 219 809 182 15 40 1 0 0 0 2 0 6 276 67 16 3 17 82 16 18 0 1 8 0 0 70 0 1 2 0 0 1 80 0 0 10 19 17 14 25 0 0 9 1 0 2 0 1 2 0 0 0 0 0 0 0 1 0 19 4 192 0 4 71 1 16 5 1 1 11 2 0 21 5 16 0 0 42 4 26 0 0 0 239 5 96 0 304 1 0 1 1 3 7 2 1 0 7 0 0 805 932 4 2 0 4 0 2 3 2 1 13 1 0 146 0 0 5 967 9 39 6 1 57 2 22 9 0 18 2 1 8 0 0 25 68 9 30 55 124 3 57 98 1 4 0 0 2 61 4 30 1 13 62 130 51 91 92 11 10 28 6 2 1 45 3 0 103 18 92 1 157 35 49 13 27 42 4 5 13 15 22 103 76 6 13 13 0 57 9 2 3 0 1 22 3 181 0 11 12 19 12 3 11 0 3 2 1 2 10 2 0 0 0 3 3 6 1 0 1 1 8 0 0 1 0 16 0 0 0 9 8 2 21 20 5 0 50 13 45 61 15 60 8 6 94 61 0 301 47 0 0 0 32 1 31 3 0 0 19 159 457 327 45 11 0 0 38 67 0 0 22 1 10 5 0 274 99 0 1 3 0 0 0 3 14 1 97 1 3 20 0 0 0 0 0 0 0 0 0 0 17 0 3 2 17 2 0 1 6 38 74 105 178 0 8 2 0 2 0 2 30 4 1 10 17 0 0 253 0 30 2 0 9 42 0 36 2 34 5 1 21 7 10 2 0 17 32 89 113 2 19 87 6 2 0 0 61 4 0 1 10 0 10 2 0 0 2 0 11 0 0 4 642 116 2 2 52 1 1 1016 0 128 1 22 7 2 50 101 1 951 57 0 0 842 312 2 0 95 0 0 3 9 2 8 26 5 13 52 5 17 19 0 0 4 275 31 1 28 7 44 100 6 7 0 1 1 0 1 1 0 17 1 0 0 234 88 60 16 7 0 0 2 0 0 0 0 0 105 4 7 0 47 3 47 4 38 9 1 309 136 72 2 9 0 26 14 3 57 50 51 0 71 50 1031 21 88 11 0 26 5 0 0 0 2 48 1 1 0 0 0 21 56 1229 7 0 0 4 6 0 0 5 11 0 7 4 17 6 7 0 0 0 1 1 11 30 0 1 0 0 2 2 1 35 4 27 294 59 34 2 25 27 132 50 71 4 146 4 34 143 0 3 156 182 10 8 10 110 3 5 0 0 0 0 2 5 43 38 4 2 196 1 86 67 40 35 0 17 92 27 80 5 15 59 1 0 17 9 25 2 89 0 1 6 34 1 1 49 12 13 1 3 81 437 2 62 5 16 7 18 2 0 0 0 22 1 1 0 135 10 3 189 18 0 1 5 0 192 17 416 0 3 26 95 115 10 3 1 0 1 0 0 0 181 8 22 15 0 0 1 0 17 24 190 34 14 2 1 0 6 2 0 4 5 13 0 0 16 21 7 27 275 18 0 0 1 1 17 196 0 0 10 2 73 198 87 55 8 8 1 0 1528 30 10 23 54 1979 20 14 8 3 0 32 1 0 7 2 1 53 119 9 9 62 4 0 28 0 2 195 0 8 20 20 4 0 0 1 19 1 13 5 54 2 36 1 6 111 6 16 12 28 13 0 49 8 8 7 0 166 389 260 16 3 0 5 0 0 0 130 0 10 37 1 15 4 9 20 0 5 578 110 161 0 2 18 0 5 9 17 1 29 SP75 Bacteria;Proteobacteria;Betaproteobacteria;Neisseriales;Neisseriaceae;Neisseria;sicca 0 2 0 0 0 0 0 5 0 1 0 2 0 0 2 0 0 0 0 0 0 18 20 114 19 0 0 0 2478 358 0 1 0 154 1 0 0 284 26 0 0 1 0 0 0 0 1884 0 34 0 0 0 0 29 3 0 14 30 0 1214 3 0 0 9 0 0 40 0 0 0 0 0 4656 31 166 0 2 0 1062 0 88 0 12 0 0 2 1477 9 0 0 24 0 5121 25 0 0 11 0 0 0 0 756 0 0 0 0 645 14 7 0 3848 1 1 3 0 0 0 2 23 1 32 0 0 46 80 0 51 3 9 33 150 0 0 1 0 5126 0 0 0 0 23 0 0 826 0 25 0 19 0 0 546 108 13514 0 2 0 0 0 77 0 0 0 0 2 24 0 18241 10 6105 0 1811 179 0 13 0 0 0 0 0 0 2 4 0 0 0 0 0 0 0 0 28 15 2 0 1 0 0 0 0 28 50 0 123 0 49 0 0 23 22 2 0 12449 77 0 0 678 275 0 6 893 568 35 0 7 434 2531 1 2 463 17 0 604 0 12 0 0 0 0 0 385 0 0 90 43 9 12 1 224 25 139 1 2 0 0 0 4 0 0 0 0 135 0 8 75 178 1 0 15 0 0 0 0 0 0 0 0 0 0 0 0 0 0 0 0 0 0 0 0 0 0 0 0 0 0 0 0 0 0 0 0 0 0 0 0 0 0 0 0 0 0 0 0 0 0 0 0 0 0 0 0 0 0 0 0 0 0 0 0 0 0 0 0 0 0 0 0 0 0 0 0 0 0 0 0 0 0 0 0 0 0 0 0 0 0 0 0 0 0 0 0 0 0 0 0 0 0 0 0 0 0 0 0 0 0 0 0 0 0 0 0 0 0 0 0 0 0 0 0 0 0 0 0 0 0 0 0 0 0 0 0 0 0 0 0 0 0 0 0 0 0 0 0 0 0 0 0 0 0 0 0 0 0 0 0 0 0 0 0 0 0 0 0 0 0 0 0 0 0 0 0 0 0 0 0 0 0 0 0 0 0 0 0 0 0 0 0 0 0 0 0 0 0 0 0 0 0 0 0 0 0 0 0 0 0 0 0 0 0 0 0 0 0 0 0 0 0 0 0 0 0 0 0 0 0 0 0 0 0 0 0 0 0 0 0 0 0 0 0 0 0 0 0 0 0 0 0 0 0 0 0 0 0 0 0 0 0 0 0 0 0 0 0 0 0 0 0 0 0 0 0 0 0 0 0 0 0 0 0 0 0 0 0 0 0 0 0 0 0 0 0 0 0 0 0 0 0 0 0 0 0 0 0 0 0 0 0 0 0 0 0 0 0 0 0 0 0 0 0 0 0 0 0 0 0 0 0 0 0 0 0 0 0 0 0 0 0 0 0 0 0 0 0 0 0 0 0 0 0 0 0 0 0 0 0 0 0 0 0 0 0 0 0 0 0 0 0 0 0 0 0 0 0 0 0 0 0 0 0 0 0 0 0 0 0 0 0 0 0 0 0 0 0 0 0 0 0 0 0 0 0 0 0 0 0 0 0 0 0 0 0 0 0 0 0 0 0 0 0 0 0 0 0 0 0 0 0 0 0 0 0 0 0 0 0 0 0 0 0 0 0 0 0 0 0 0 0 0 0 0 0 0 0 0 0 0 0 0 0 0 0 0 0 0 0 0 0 0 0 0 0 0 0 0 0 0 0 0 0 0 0 0 0 0 0 0 0 0 0 0 0 0 0 0 0 0 0 0 0 0 0 0 0 0 0 0 0 0 0 0 0 0 0 0 0 0 0 0 0 0 0 0 0 0 0 0 0 0 0 0 0 0 0 0 0 0 0 0 0 0 0 0 0 0 0 0 0 0 0 0 0 0 0 0 0 0 0 0 0 0 0 0 0 0 0 0 0 0 0 0 0 0 0 0 0 0 0 0 0 0 0 0 0 0 0 0 0 0 0 0 0 0 0 0 0 0 0 0 0 0 0 0 0 0 0 0 0 0 0 0 0 0 0 0 0 0 0 0 0 0 0 0 0 0 0 0 0 0 0 0 0 0 0 0 0 0 0 0 0 0 0 0 0 0 0 0 0 0 0 0 0 0 0 0 0 0 0 0 0 0 0 0 0 0 0 0 0 0 0 0 0 0 0 0 0 0 0 0 0 0 0 0 0 0 0 0 0 0 0 0 0 0 0 0 0 0 0 0 0 0 0 0 0 0 0 0 0 0 0 0 0 0 0 0 0 0 0 0 0 0 0 0 0 0 0 0 0 0 0 0 0 0 0 0 0 0 0 0 0 0 0 0 0 0 0 0 0 0 0 0 0 0 0 0 0 0 0 0 0 0 0 0 0 0 0 0 0 0 0 0 0 0 0 0 0 0 0 0 0 0 0 0 0 0 0 0 0 0 0 0 0 0 0 0 0 0 0 0 0 0 0 0 0 0 0 0 0 0 0 0 0 0 0 0 0 0 0 0 0 0 0 0 0 0 0 0 0 0 0 0 0 0 0 0 0 0 0 0 0 0 0 0 0 0 0 0 0 0 0 0 0 0 0 0 0 0 0 0 0 0 0 0 0 0 0 0 0 0 0 0 0 0 0 0 0 0 0 0 0 0 0 0 0 0 0 0 0 0 0 0 0 0 0 0 0 0 0 0 0 0 0 0 0 0 0 0 0 0 0 0 0 0 0 0 0 0 0 0 0 0 0 0 0 0 0 0 0 0 0 0 0 0 0 0 0 0 0 0 0 0 0 0 0 0 0 0 0 0 0 0 0 0 0 0 0 0 0 0 0 0 0 0 0 0 0 0 0 0 0 0 0 0 0 0 0 0 0 0 0 0 0 0 0 0 0 0 0 0 0 0 0 0 0 0 0 0 0 0 0 0 0 0 0 0 0 0 0 0 0 0 0 0 0 0 0 0 0 0 0 0 0 0 0 0 0 0 0 0 0 0 0 0 0 0 0 0 0 0 0 0 0 0 0 0 0 0 0 0 0 0 0 0 0 0 0 0 0 0 0 0 0 0 0 0 0 0 0 0 0 0 0 0 0 0 0 0 0 0 0 0 0 0 0 0 0 0 0 0 0 0 0 0 0 0 0 0 0 0 0 0 0 0 0 0 0 0 0 0 0 0 0 0 0 0 0 0 0 0 0 0 0 0 0 0 0 0 0 0 0 0 0 0 0 0 0 0 0 0 0 0 0 0 0 0 0 0 0 0 0 0 0 0 0 0 0 0 0 0 0 0 0 0 0 0 0 0 0 0 0 0 0 0 0 0 0 0 0 0 0 0 0 0 0 0 0 0 0 0 0 0 0 0 0 0 0 0 0 0 0 0 0 0 0 0 0 0 0 0 0 0 0 0 0 0 0 0 0 0 0 0 0 0 0 0 0 0 0 0 0 0 0 0 0 0 0 0 0 0 0 0 0 0 0 0 0 0 0 0 0 0 0 0 0 0 0 0 0 0 0 0 0 0 0 0 0 0 0 0 0 0 0 0 0 0 0 0 0 0 0 0 0 0 0 0 0 0 0 0 0 0 0 0 0 0 0 0 0 0 0 0 0 0 0 0 0 0 0 0 0 0 0 0 0 0 0 0 0 0 0 0 0 0 0 0 0 0 0 0 0 0 0 0 0 0 0 0 0 0 0 0 0 0 0 0 0 0 0 0 0 0 0 0 0 0 0 0 0 0 0 0 0 0 0 0 0 0 0 0 0 0 0 0 0 0 0 0 0 0 0 0 0 0 0 0 0 0 0 0 0 0 0 0 0 0 0 0 0 0 0 0 0 0 0 0 0 0 0 0 0 0 0 0 0 0 0 0 0 0 0 0 0 0 0 0 0 0 0 0 0 0 0 0 0 0 0 0 0 0 0 0 0 0 0 0 0 0 0 0 0 0 0 0 0 0 0 0 0 0 0 0 0 0 0 0 0 0 0 0 0 0 0 0 0 0 0 0 0 0 0 0 0 0 0 0 0 0 0 0 0 0 0 0 0 0 0 0 0 0 0 0 0 0 0 0 0 0 0 0 0 0 0 0 0 0 0 0 0 0 0 0 0 0 0 0 0 0 0 0 0 0 0 0 0 0 0 0 0 0 0 0 0 0 0 0 0 0 0 0 0 0 0 0 0 0 0 SP753 Bacteria;Actinobacteria;Actinobacteria;Actinomycetales;Actinomycetaceae;Peptidiphaga;sp. HMT183 12 4 0 0 0 0 0 15 0 0 0 0 4 51 0 25 0 607 1 8 6 0 0 0 0 159 139 6 0 0 0 0 130 57 33 0 0 0 8 0 10 37 0 6 1 0 0 35 484 0 2 25 12 35 0 0 14 9 0 0 0 0 0 0 0 0 0 0 125 0 0 36 0 0 0 0 0 1 145 0 1 1 0 3 8 0 45 2 90 22 95 9 0 0 0 24 101 0 0 0 0 13 0 0 0 18 3 0 0 108 0 0 2 0 0 6 1 4 3 0 64 17 0 16 2 1 0 0 0 0 4 0 29 10 5 0 0 172 0 0 0 0 0 0 0 0 3 0 0 0 0 0 0 50 6 36 16 1 30 9 8 50 0 0 0 0 7 2 0 0 0 0 10 13 2 12 0 0 0 0 0 0 36 7 4 50 0 5 0 0 0 19 1 0 6 61 0 2 1 0 81 0 1 0 0 0 3 0 0 0 1 0 0 5 0 2 0 42 0 85 2 5 127 33 0 0 0 0 0 181 124 0 0 3 6 0 24 6 17 0 0 0 0 0 0 0 0 0 1 0 0 0 0 0 0 0 0 6 3 0 2 0 0 0 46 0 0 213 0 0 0 0 0 306 0 1 3 0 0 0 101 0 0 29 0 0 0 0 0 185 0 0 0 0 0 0 111 0 0 0 0 0 0 0 0 32 0 0 0 0 0 60 0 0 551 1079 0 1 0 0 0 0 0 0 0 0 0 0 0 0 0 0 0 0 0 0 0 0 0 0 1 0 0 386 0 3 0 0 0 0 0 0 0 0 0 0 0 0 0 0 0 8 0 37 4 0 0 0 0 0 1 4 0 0 0 0 0 0 1 0 0 0 1 0 0 0 0 0 0 0 1 0 0 0 0 2 0 0 0 0 0 0 0 0 0 0 0 0 0 0 2 7 0 0 0 0 1 0 12 0 0 0 0 0 0 0 0 0 0 0 0 0 44 0 0 0 0 0 0 0 0 0 0 0 0 4 1117 0 0 0 0 0 0 0 0 0 0 0 0 0 0 0 0 0 0 0 0 0 0 0 0 0 0 0 0 0 68 0 0 0 0 0 7 3 156 0 0 0 0 0 0 0 0 0 0 0 192 2 0 0 0 0 0 0 0 1 1 0 4 0 0 0 0 0 0 0 1 0 0 0 1 0 0 1 1109 1371 0 1 0 0 0 0 0 0 6 0 0 113 0 0 0 0 0 0 0 0 0 0 0 0 4 0 0 0 0 0 0 0 0 73 0 0 0 14 18 0 0 0 0 0 0 0 0 0 0 0 0 0 0 0 0 0 0 0 0 0 0 0 0 1 319 0 2 0 0 0 0 0 0 0 0 0 0 0 0 0 0 1 0 0 0 45 3 0 0 0 5 1 0 0 0 4 28 0 0 0 0 0 0 0 0 120 27 0 0 0 2 0 2311 0 0 0 0 0 0 0 0 0 0 0 0 0 0 0 0 31 0 0 0 356 0 0 394 478 0 39 0 0 0 0 0 0 0 0 0 0 0 0 0 0 0 0 0 0 0 52 157 0 0 0 0 0 62 0 0 0 0 0 0 0 1 0 0 0 0 0 0 0 0 0 0 0 45 0 0 0 0 0 321 16 0 0 0 0 0 0 7 0 0 0 4 0 0 3 0 1 15 0 27 0 0 0 0 0 0 0 0 15 0 0 0 0 0 0 7 15 0 0 0 0 0 0 0 5 17 0 0 0 0 0 0 0 0 0 0 93 3 0 0 0 0 0 0 12 434 0 0 0 0 1 0 0 0 0 0 0 0 0 0 0 0 0 2 0 0 0 0 0 0 0 0 0 0 0 0 0 0 0 0 0 16 0 0 0 0 0 0 0 0 0 0 9 0 0 159 0 0 118 229 0 0 0 2 0 0 0 0 0 0 0 0 9 0 0 1 8 0 0 0 0 0 0 0 0 0 0 0 0 0 0 456 0 0 0 0 0 0 0 0 0 22 1 0 0 0 0 0 0 60 0 0 0 0 0 0 0 988 0 0 0 0 0 0 0 0 0 0 9 0 0 0 0 0 0 0 0 0 0 0 0 0 0 0 0 0 0 0 0 0 0 0 0 0 0 0 11 18 41 1 70 171 0 35 8 0 47 41 0 0 0 0 0 43 29 0 527 1 0 0 0 5 0 0 0 0 0 0 0 0 0 0 0 0 66 1 0 185 32 0 0 0 0 11 1 0 17 0 187 0 0 0 0 422 9 0 0 0 218 305 0 0 1 0 0 0 0 0 0 0 0 0 0 0 0 0 0 0 0 0 0 0 0 0 7 0 0 0 0 0 0 0 0 0 0 0 0 4 0 0 0 0 0 0 0 0 0 1 0 4 0 0 0 0 7 0 0 11 0 0 0 0 0 0 0 0 0 0 0 0 0 0 0 0 0 1 0 0 0 0 0 0 13 0 0 0 0 0 0 32 0 0 0 0 0 0 0 0 0 0 1 0 0 0 0 0 4 0 0 0 0 0 0 0 0 0 0 0 0 0 0 0 0 0 0 0 0 0 0 0 0 0 0 0 0 0 0 0 0 0 0 0 0 0 0 0 0 0 0 0 0 0 0 0 0 0 0 0 0 0 0 0 1 0 0 0 0 0 0 0 0 0 0 0 0 0 0 0 0 0 0 0 0 0 0 0 0 0 0 0 2 0 0 0 0 0 0 0 0 0 1 0 0 0 0 0 0 0 0 0 0 0 0 0 20 0 0 0 0 0 0 0 4 0 0 0 0 0 0 10 0 0 6 1 0 10 0 0 0 0 0 0 24 0 0 0 0 0 0 0 0 0 1 0 0 0 0 0 0 0 0 0 0 1 0 1 0 0 0 0 0 0 0 0 0 0 0 0 4 0 0 0 0 0 0 0 0 0 0 0 0 32 0 0 90 0 0 0 0 0 36 0 3 0 0 0 0 0 0 0 0 0 0 0 0 0 0 0 0 0 0 0 0 5 0 0 32 7 0 0 0 0 0 23 38 0 0 0 0 0 2 0 0 0 0 0 0 0 0 0 1 0 0 0 0 0 0 0 0 0 0 0 0 0 0 0 0 0 0 70 0 0 0 0 0 0 0 0 143 13 0 0 0 0 9 0 0 0 0 0 0 0 0 0 0 0 0 0 0 0 0 0 0 0 20 0 0 0 0 0 0 0 0 0 0 0 0 0 0 0 0 0 0 0 13 0 0 0 0 0 0 0 0 1 0 0 0 0 0 0 0 2 1 0 43 1 0 0 0 11 0 23 0 0 12 0 0 0 44 0 0 0 6 0 4 0 0 0 0 0 0 0 59 0 0 0 0 0 0 0 0 0 0 0 0 0 0 0 0 0 0 2 0 35 0 0 0 0 0 0 0 0 0 0 0 0 0 0 0 0 152 0 0 0 0 0 0 0 0 0 0 0 0 0 0 0 7 0 0 0 177 0 0 0 0 0 0 0 0 0 0 0 0 0 0 0 0 0 0 0 0 0 13 0 0 0 78 2 0 0 0 175 0 0 0 0 0 0 0 0 0 0 0 0 3 0 0 0 0 0 0 0 0 0 21 0 0 4 4 0 0 20 5 0 3 4 0 0 0 0 0 1 1 0 0 1 0 0 0 0 0 0 0 0 0 0 0 0 14 1 0 0 0 0 0 0 0 0 0 0 0 0 0 0 37 0 0 0 0 0 0 0 0 0 0 0 0 0 0 0 0 2 0 0 0 0 0 0 0 0 0 0 0 0 0 201 8 0 0 0 0 0 0 0 0 0 0 0 0 0 0 0 0 0 0 0 0 15 0 0 0 0 0 1 0 0 0 0 0 0 0 4 0 0 0 0 0 0 0 0 0 7 0 0 1 0 0 2 0 0 47 0 7 0 0 0 0 80 0 0 0 0 2 1 0 0 0 0 0 1 0 0 2 0 0 0 0 0 0 0 0 0 685 0 0 2116 0 0 0 2 0 0 0 0 11 0 0 0 0 0 0 8 0 3 0 16 0 0 0 0 50 0 0 0 0 0 0 141 132 0 2 0 0 0 0 0 0 0 0 0 0 0 1 0 0 0 0 0 0 0 0 14 0 0 0 0 0 4 0 0 0 0 0 0 0 SP76 Bacteria;Proteobacteria;Betaproteobacteria;Neisseriales;Neisseriaceae;Neisseria;flava 0 154 137 554 10 6 0 31 662 1020 0 712 706 46 949 9 2 54 96 9 107 7 0 165 0 10 397 26 506 446 103 5 248 0 123 0 83 1 0 0 1 1 10 19 1159 0 6 34 0 0 0 1 7 703 2 63 9 394 4 5 1 49 78 870 18 378 2 0 436 60 0 437 17 0 0 106 28 0 0 37 62 0 10 27 4 2 0 0 2 487 1929 2 20 11 9 147 2684 1 69 36 14 192 798 0 8 2325 951 32 50 0 9 0 34 54 22 340 292 7 43 594 3375 1 98 0 243 48 79 0 1 170 163 40 0 8463 6262 6 47 2 0 1 352 159 789 936 222 0 102 244 0 136 0 535 7 6 13 2 16 131 2 59 588 1189 14 1 5 0 34437 0 4 7 5 33 12 317 0 16 0 0 1328 1314 0 584 631 190 339 1610 31 910 1 238 33 2 125 0 1 33 0 79 52 9 19 1634 1436 52 17 0 249 18 10801 148 0 23 6293 2 126 3047 299 1 1 20 88 1 0 1425 2 2277 92 1033 7 4 2196 32 39 137 2 3 2470 40 8 12496 12 19 0 8 2 0 23 0 1 0 0 6304 350 1 0 2 4 1 0 0 3 65 1 6 0 0 1 38 0 0 0 0 0 0 0 0 0 0 0 0 0 0 0 0 0 0 0 0 0 0 0 0 0 0 0 0 0 0 0 0 0 0 0 0 0 0 0 0 0 0 0 0 0 0 0 0 0 0 0 0 0 0 0 0 0 0 0 0 0 0 0 0 0 0 0 0 0 0 0 0 0 0 0 0 0 0 0 0 0 0 0 0 0 0 0 0 0 0 0 0 0 0 0 0 0 0 0 0 0 0 0 0 0 0 0 0 0 0 0 0 0 0 0 0 0 0 0 0 0 0 0 0 0 0 0 0 0 0 0 0 0 0 0 0 0 0 0 0 0 0 0 0 0 0 0 0 0 0 0 0 0 0 0 0 0 0 0 0 0 0 0 0 0 0 0 0 0 0 0 0 0 0 0 0 0 0 0 0 0 0 0 0 0 0 0 0 0 0 0 0 0 0 0 0 0 0 0 0 0 0 0 0 0 0 0 0 0 0 0 0 0 0 0 0 0 0 0 0 0 0 0 0 0 0 0 0 0 0 0 0 0 0 0 0 0 0 0 0 0 0 0 0 0 0 0 0 0 0 0 0 0 0 0 0 0 0 0 0 0 0 0 0 0 0 0 0 0 0 0 0 0 0 0 0 0 0 0 0 0 0 0 0 0 0 0 0 0 0 0 0 0 0 0 0 0 0 0 0 0 0 0 0 0 0 0 0 0 0 0 0 0 0 0 0 0 0 0 0 0 0 0 0 0 0 0 0 0 0 0 0 0 0 0 0 0 0 0 0 0 0 0 0 0 0 0 0 0 0 0 0 0 0 0 0 0 0 0 0 0 0 0 0 0 0 0 0 0 0 0 0 0 0 0 0 0 0 0 0 0 0 0 0 0 0 0 0 0 0 0 0 0 0 0 0 0 0 0 0 0 0 0 0 0 0 0 0 0 0 0 0 0 0 0 0 0 0 0 0 0 0 0 0 0 0 0 0 0 0 0 0 0 0 0 0 0 0 0 0 0 0 0 0 0 0 0 0 0 0 0 0 0 0 0 0 0 0 0 0 0 0 0 0 0 0 0 0 0 0 0 0 0 0 0 0 0 0 0 0 0 0 0 0 0 0 0 0 0 0 0 0 0 0 0 0 0 0 0 0 0 0 0 0 0 0 0 0 0 0 0 0 0 0 0 0 0 0 0 0 0 0 0 0 0 0 0 0 0 0 0 0 0 0 0 0 0 0 0 0 0 0 0 0 0 0 0 0 0 0 0 0 0 0 0 0 0 0 0 0 0 0 0 0 0 0 0 0 0 0 0 0 0 0 0 0 0 0 0 0 0 0 0 0 0 0 0 0 0 0 0 0 0 0 0 0 0 0 0 0 0 0 0 0 0 0 0 0 0 0 0 0 0 0 0 0 0 0 0 0 0 0 0 0 0 0 0 0 0 0 0 0 0 0 0 0 0 0 0 0 0 0 0 0 0 0 0 0 0 0 0 0 0 0 0 0 0 0 0 0 0 0 0 0 0 0 0 0 0 0 0 0 0 0 0 0 0 0 0 0 0 0 0 0 0 0 0 0 0 0 0 0 0 0 0 0 0 0 0 0 0 0 0 0 0 0 0 0 0 0 0 0 0 0 0 0 0 0 0 0 0 0 0 0 0 0 0 0 0 0 0 0 0 0 0 0 0 0 0 0 0 0 0 0 0 0 0 0 0 0 0 0 0 0 0 0 0 0 0 0 0 0 0 0 0 0 0 0 0 0 0 0 0 0 0 0 0 0 0 0 0 0 0 0 0 0 0 0 0 0 0 0 0 0 0 0 0 0 0 0 0 0 0 0 0 0 0 0 0 0 0 0 0 0 0 0 0 0 0 0 0 0 0 0 0 0 0 0 0 0 0 0 0 0 0 0 0 0 0 0 0 0 0 0 0 0 0 0 0 0 0 0 0 0 0 0 0 0 0 0 0 0 0 0 0 0 0 0 0 0 0 0 0 0 0 0 0 0 0 0 0 0 0 0 0 0 0 0 0 0 0 0 0 0 0 0 0 0 0 0 0 0 0 0 0 0 0 0 0 0 0 0 0 0 0 0 0 0 0 0 0 0 0 0 0 0 0 0 0 0 0 0 0 0 0 0 0 0 0 0 0 0 0 0 0 0 0 0 0 0 0 0 0 0 0 0 0 0 0 0 0 0 0 0 0 0 0 0 0 0 0 0 0 0 0 0 0 0 0 0 0 0 0 0 0 0 0 0 0 0 0 0 0 0 0 0 0 0 0 0 0 0 0 0 0 0 0 0 0 0 0 0 0 0 0 0 0 0 0 0 0 0 0 0 0 0 0 0 0 0 0 0 0 0 0 0 0 0 0 0 0 0 0 0 0 0 0 0 0 0 0 0 0 0 0 0 0 0 0 0 0 0 0 0 0 0 0 0 0 0 0 0 0 0 0 0 0 0 0 0 0 0 0 0 0 0 0 0 0 0 0 0 0 0 0 0 0 0 0 0 0 0 0 0 0 0 0 0 0 0 0 0 0 0 0 0 0 0 0 0 0 0 0 0 0 0 0 0 0 0 0 0 0 0 0 0 0 0 0 0 0 0 0 0 0 0 0 0 0 0 0 0 0 0 0 0 0 0 0 0 0 0 0 0 0 0 0 0 0 0 0 0 0 0 0 0 0 0 0 0 0 0 0 0 0 0 0 0 0 0 0 0 0 0 0 0 0 0 0 0 0 0 0 0 0 0 0 0 0 0 0 0 0 0 0 0 0 0 0 0 0 0 0 0 0 0 0 0 0 0 0 0 0 0 0 0 0 0 0 0 0 0 0 0 0 0 0 0 0 0 0 0 0 0 0 0 0 0 0 0 0 0 0 0 0 0 0 0 0 0 0 0 0 0 0 0 0 0 0 0 0 0 0 0 0 0 0 0 0 0 0 0 0 0 0 0 0 0 0 0 0 0 0 0 0 0 0 0 0 0 0 0 0 0 0 0 0 0 0 0 0 0 0 0 0 0 0 0 0 0 0 0 0 0 0 0 0 0 0 0 0 0 0 0 0 0 0 0 0 0 0 0 0 0 0 0 0 0 0 0 0 0 0 0 0 0 0 0 0 0 0 0 0 0 0 0 0 0 0 0 0 0 0 0 0 0 0 0 0 0 0 0 0 0 0 0 0 0 0 0 0 0 0 0 0 0 0 0 0 0 0 0 0 0 0 0 0 0 0 0 0 0 0 0 0 0 0 0 0 0 0 0 0 0 0 0 0 0 0 0 0 0 0 0 0 0 0 0 0 0 0 0 0 0 0 0 0 0 0 0 0 0 0 0 0 0 0 0 0 0 0 0 0 0 0 0 0 0 0 0 0 0 0 0 0 0 0 0 0 0 0 0 0 0 0 0 0 0 0 0 0 0 0 0 0 0 0 0 0 0 0 0 0 0 0 0 0 0 0 0 0 0 0 0 0 0 0 0 0 0 0 0 0 0 0 0 0 0 0 0 0 0 0 0 0 0 0 0 0 0 0 0 0 0 0 0 SP79 Bacteria;Firmicutes;Negativicutes;Veillonellales;Veillonellaceae;Megasphaera;micronuciformis 9 3 0 57 0 14 0 0 0 44 367 1 17 1 0 153 0 0 145 116 199 13 25 62 21 38 0 9 4 2 0 129 0 38 12 10 209 0 58 0 71 0 6 431 13 122 9 15 13 11 520 721 717 1 241 0 277 8 3 79 0 1 1 1 305 0 0 1136 16 6 58 10 0 158 8 0 14 16 16 7 5 80 3 0 1238 20 3 171 0 2535 1 859 1 0 19 0 0 1 0 88 8 91 3 0 0 1 97 0 2 1 2 0 522 30 1018 0 41 332 236 8 106 0 73 33 432 9 456 66 290 0 17 1 3 28 355 1 270 192 0 0 4 2 0 1 0 152 29 3 100 0 1397 0 18 4 11 38 577 2 23 2 0 0 14 13 3 9 0 24 0 15 3 0 0 3 14 2 1 6 0 7 13 0 5 121 1365 0 0 3 0 43 69 0 18 11 168 9 59 7 1 2 0 12 464 0 10 296 0 0 0 0 43 0 27 8 8 21 28 4 0 0 149 327 21 2 528 15 133 0 0 841 352 0 3 6 6 1 3 5 42 14 11 3 1592 1 4 41 55 0 581 5 402 0 0 24 0 0 10 0 24 3 44 147 3 695 80 20 198 250 0 0 0 0 0 0 0 0 0 0 1 0 0 1 10 0 1 0 0 0 0 0 1 0 0 0 0 0 0 0 0 0 0 0 3 0 1 0 0 0 0 0 0 0 0 0 0 0 0 1 0 0 1 0 7 0 0 0 0 0 0 0 1 0 0 0 0 0 0 0 0 0 0 0 0 0 0 0 2 0 0 0 0 0 0 0 0 0 0 0 0 0 0 0 0 1 0 0 0 2 0 0 0 0 0 0 0 0 0 3 0 0 0 0 0 0 0 1 0 0 0 0 0 0 0 0 0 0 0 0 0 0 0 0 0 0 0 0 0 0 0 0 0 0 0 0 0 0 0 0 0 0 0 0 3 0 0 0 0 0 0 0 0 0 0 0 0 0 0 0 0 0 0 0 0 0 0 0 0 1 0 0 9 0 2 0 0 0 0 0 2 0 0 0 0 0 0 0 0 0 0 0 0 0 0 0 0 0 0 1 0 0 0 0 11 0 0 1 0 0 0 0 0 0 0 0 0 0 0 0 0 0 0 0 0 0 0 0 0 0 2 0 0 1 1 1 0 0 1 0 0 0 0 0 0 0 0 0 0 0 0 0 0 0 0 0 0 0 0 0 0 0 0 0 0 0 0 0 0 0 0 0 0 1 0 0 0 0 0 0 0 0 0 0 0 1 27 0 0 0 0 0 0 0 0 0 0 0 0 0 0 0 0 0 0 0 0 0 0 0 0 1 12 0 0 0 0 0 0 0 0 0 0 1 0 0 0 0 0 0 0 0 0 0 0 0 0 0 0 0 1 0 0 0 0 0 0 0 1 0 0 0 0 0 0 0 0 0 8 0 0 0 0 0 0 0 0 0 0 0 0 0 0 0 0 0 0 2 0 0 0 1 0 0 1 2 0 0 1 0 0 0 0 0 0 0 0 0 0 0 0 0 3 0 0 0 0 0 0 0 0 0 0 0 0 0 0 0 0 0 0 0 0 0 0 0 0 0 0 0 0 0 0 0 0 0 0 0 0 0 0 0 0 0 0 0 0 1 0 0 0 0 0 0 1 0 0 0 0 0 0 0 0 0 1 0 0 0 0 0 0 0 0 0 0 0 0 0 0 0 0 0 0 1 0 0 0 0 0 0 0 0 0 0 0 0 0 0 1 0 0 0 0 0 0 2 0 0 0 0 0 0 2 0 0 0 0 0 0 0 1 0 0 0 0 0 2 0 0 0 0 0 0 0 0 0 0 0 0 0 0 0 1 0 0 1 0 0 1 0 0 0 0 0 0 0 0 1 0 0 0 0 0 0 0 0 0 0 0 0 0 0 0 0 0 0 0 0 0 1 0 0 0 0 0 26 0 0 0 0 0 0 0 0 0 0 0 0 0 0 0 0 0 0 0 0 0 0 0 0 0 0 0 0 0 0 0 0 0 0 0 0 0 0 0 0 0 0 0 0 0 0 0 0 0 0 0 0 0 1 0 0 0 0 0 0 0 0 0 0 0 0 0 0 0 0 0 1 0 16 0 0 0 0 0 0 0 0 0 0 0 0 0 0 0 0 0 0 0 0 0 1 0 0 0 0 0 0 0 0 0 2 0 1 0 0 0 0 0 0 0 0 0 1 0 0 0 0 0 0 198 0 0 0 1 1 0 0 0 0 0 0 0 1 0 1 0 0 0 0 1 0 0 0 0 0 0 0 0 0 0 1 0 0 0 0 0 0 1 0 0 0 0 4 0 0 0 16 0 0 0 0 0 0 2 0 0 0 0 2 1 1 11 0 38 19 44 63 0 3 0 0 0 0 5 12 0 1 5 0 0 1 6 1 1 0 0 0 0 0 2 0 0 0 0 0 1 2 0 0 0 3 0 1 1 0 0 0 0 0 10 0 0 5 0 0 0 0 0 0 0 0 0 0 0 0 0 0 3 0 2 0 0 0 0 0 0 9 0 0 0 0 2 0 0 0 0 0 13 1 18 0 7 0 0 0 0 4 0 0 0 4 4 0 0 209 11 10 0 0 0 0 0 0 0 0 0 0 0 0 0 0 0 19 0 1 0 0 0 0 0 0 0 0 0 0 0 0 0 1 24 0 0 7 2 0 3 8 0 0 1 0 0 11 0 0 0 0 7 1 1 13 1 3 0 0 0 0 0 0 1 0 4 4 3 3 13 2 48 2 0 7 1 1 2 2 6 2 4 0 0 0 0 0 4 0 0 0 1 0 0 56 0 0 6 1 0 0 1 0 0 0 0 3 0 0 0 0 0 0 3 0 0 11 0 0 0 0 0 0 0 0 0 0 0 0 8 9 0 4 4 0 6 0 3 0 0 6 0 0 1 6 0 6 3 0 0 0 0 0 1 0 0 1 0 5 5 36 10 0 0 0 0 31 0 0 0 0 1 0 0 20 2 0 0 0 0 0 0 0 0 0 9 0 0 1 0 0 0 0 0 0 0 0 0 0 1 0 0 0 1 0 0 0 0 2 6 2 4 0 0 0 0 0 0 0 0 0 0 0 0 13 0 26 0 2 0 0 5 0 0 1 0 0 0 0 0 0 2 0 0 1 1 3 4 0 5 4 0 0 0 0 4 0 0 14 29 0 1 0 0 0 5 0 0 0 0 0 3 7 1 0 0 0 0 328 0 10 0 0 0 18 9 2 0 36 0 0 0 58 3 0 0 0 0 0 0 0 0 0 6 0 1 4 0 1 1 0 0 11 8 4 0 1 0 0 15 0 0 0 0 0 3 0 0 0 0 0 0 0 18 3 3 2 0 0 0 0 0 0 0 0 0 3 0 0 0 0 0 7 0 0 0 2 0 1 0 0 0 1 1 0 1 1 1 0 0 0 0 0 0 11 0 0 0 1 0 0 0 1 4 0 0 0 0 0 2 3 237 1 1 0 1 0 0 0 0 0 0 0 0 0 0 0 0 0 0 1 1 0 0 1 0 0 0 0 0 0 2 0 7 41 2 1 0 5 1 3 0 1 0 2 0 0 0 0 0 3 1 1 0 67 1 0 0 0 0 0 0 0 0 0 0 0 0 25 0 6 5 0 2 0 1 3 9 4 0 0 0 0 0 1 0 0 1 0 0 0 0 0 0 0 0 0 1 2 0 0 65 0 1 1 1 1 0 24 0 0 0 0 0 0 0 5 2 0 6 0 0 0 0 0 1 1 26 0 0 7 2 4 0 0 0 0 0 0 0 0 2 0 0 0 0 0 0 0 0 0 6 4 2 2 0 0 0 0 0 0 0 0 0 0 1 1 1 2 3 0 0 1 1 0 0 6 0 0 1 0 4 2 1 36 2 0 0 0 122 0 1 8 0 37 0 0 2 0 0 1 1 2 0 0 0 1 2 3 0 0 0 0 0 0 1 17 2 0 0 0 0 0 0 0 1 0 0 0 2 6 0 0 0 2 0 0 0 1 1 0 0 0 1 2 0 1 275 6 0 0 0 2 0 0 0 8 0 2 4 0 0 0 0 0 0 0 91 1 1 0 0 0 0 0 0 0 0 1 SP8 Bacteria;Bacteroidetes;Bacteroidia;Bacteroidales;Porphyromonadaceae;Porphyromonas;catoniae 0 45 28 4 0 5 29 15 1 3 1 327 1 6 1037 2 28 72 22 4 0 0 7 38 43 0 9 0 94 250 26 24 955 17 65 14 13 1 17 23 45 109 10 6 25 1 2 1 87 4 18 0 0 10 5 19 5 32 12 160 5 19 5 0 13 10 0 17 981 116 17 525 8 2 3 31 12 0 37 41 22 0 12 12 16 4 0 111 27 95 886 0 522 784 0 276 48 2292 154 18 3 29 48 103 88 79 17 21 23 32 2 14 12 32 15 23 16 93 29 1 30 19 4 19 82 32 3 5 27 2233 67 129 1 48 180 273 41 35 66 2 116 354 503 336 101 21 65 81 31 5 24 8 429 11 1 0 49 12 118 0 47 96 4 2 25 2 8 3 46 3 2 104 10 32 13 12 15 11 13 64 3 6 1863 14 70 9 10 8 3 51 40 34 9 0 17 63 1 5 4 289 401 1 559 17 10 2 4 1 0 0 32 2 21 0 0 77 6 0 4 40 33 60 2 175 12 42 46 1168 397 19 24 18 33 16 0 3 60 3 70 1509 178 0 6 9 26 14 7 8 25 1 6 6 84 21 0 2 22 1 0 1 5 0 12 27 595 2 1 54 0 0 0 0 0 0 0 0 0 0 0 0 0 0 0 0 0 0 0 0 0 0 0 0 0 0 0 0 0 0 0 0 0 0 0 0 0 0 0 0 0 0 0 0 0 0 0 0 0 0 0 0 0 0 0 0 0 0 0 0 0 0 0 0 0 0 0 0 0 0 0 0 0 0 0 0 0 0 0 0 0 0 0 0 0 0 0 0 0 0 0 0 0 0 0 0 0 0 0 0 0 0 0 0 0 0 0 0 0 0 0 0 0 0 0 0 0 0 0 0 0 0 0 0 0 0 0 0 0 0 0 0 0 0 0 0 0 0 0 0 0 0 0 0 0 0 0 0 0 0 0 0 0 0 0 0 0 0 0 0 0 0 0 0 0 0 0 0 0 0 0 0 0 0 0 0 0 0 0 0 0 0 0 0 0 0 0 0 0 0 0 0 0 0 0 0 0 0 0 0 0 0 0 0 0 0 0 0 0 0 0 0 0 0 0 0 0 0 0 0 0 0 0 0 0 0 0 0 0 0 0 0 0 0 0 0 0 0 0 0 0 0 0 0 0 0 0 0 0 0 0 0 0 0 0 0 0 0 0 0 0 0 0 0 0 0 0 0 0 0 0 0 0 0 0 0 0 0 0 0 0 0 0 0 0 0 0 0 0 0 0 0 0 0 0 0 0 0 0 0 0 0 0 0 0 0 0 0 0 0 0 0 0 0 0 0 0 0 0 0 0 0 0 0 0 0 0 0 0 0 0 0 0 0 0 0 0 0 0 0 0 0 0 0 0 0 0 0 0 0 0 0 0 0 0 0 0 0 0 0 0 0 0 0 0 0 0 0 0 0 0 0 0 0 0 0 0 0 0 0 0 0 0 0 0 0 0 0 0 0 0 0 0 0 0 0 0 0 0 0 0 0 0 0 0 0 0 0 0 0 0 0 0 0 0 0 0 0 0 0 0 0 0 0 0 0 0 0 0 0 0 0 0 0 0 0 0 0 0 0 0 0 0 0 0 0 0 0 0 0 0 0 0 0 0 0 0 0 0 0 0 0 0 0 0 0 0 0 0 0 0 0 0 0 0 0 0 0 0 0 0 0 0 0 0 0 0 0 0 0 0 0 0 0 0 0 0 0 0 0 0 0 0 0 0 0 0 0 0 0 0 0 0 0 0 0 0 0 0 0 0 0 0 0 0 0 0 0 0 0 0 0 0 0 0 0 0 0 0 0 0 0 0 0 0 0 0 0 0 0 0 0 0 0 0 0 0 0 0 0 0 0 0 0 0 0 0 0 0 0 0 0 0 0 0 0 0 0 0 0 0 0 0 0 0 0 0 0 0 0 0 0 0 0 0 0 0 0 0 0 0 0 0 0 0 0 0 0 0 0 0 0 0 0 0 0 0 0 0 0 0 0 0 0 0 0 0 0 0 0 0 0 0 0 0 0 0 0 0 0 0 0 0 0 0 0 0 0 0 0 0 0 0 0 0 0 0 0 0 0 0 0 0 0 0 0 0 0 0 0 0 0 0 0 0 0 0 0 0 0 0 0 0 0 0 0 0 0 0 0 0 0 0 0 0 0 0 0 0 0 0 0 0 0 0 0 0 0 0 0 0 0 0 0 0 0 0 0 0 0 0 0 0 0 0 0 0 0 0 0 0 0 0 0 0 0 0 0 0 0 0 0 0 0 0 0 0 0 0 0 0 0 0 0 0 0 0 0 0 0 0 0 0 0 0 0 0 0 0 0 0 0 0 0 0 0 0 0 0 0 0 0 0 0 0 0 0 0 0 0 0 0 0 0 0 0 0 0 0 0 0 0 0 0 0 0 0 0 0 0 0 0 0 0 0 0 0 0 0 0 0 0 0 0 0 0 0 0 0 0 0 0 0 0 0 0 0 0 0 0 0 0 0 0 0 0 0 0 0 0 0 0 0 0 0 0 0 0 0 0 0 0 0 0 0 0 0 0 0 0 0 0 0 0 0 0 0 0 0 0 0 0 0 0 0 0 0 0 0 0 0 0 0 0 0 0 0 0 0 0 0 0 0 0 0 0 0 0 0 0 0 0 0 0 0 0 0 0 0 0 0 0 0 0 0 0 0 0 0 0 0 0 0 0 0 0 0 0 0 0 0 0 0 0 0 0 0 0 0 0 0 0 0 0 0 0 0 0 0 0 0 0 0 0 0 0 0 0 0 0 0 0 0 0 0 0 0 0 0 0 0 0 0 0 0 0 0 0 0 0 0 0 0 0 0 0 0 0 0 0 0 0 0 0 0 0 0 0 0 0 0 0 0 0 0 0 0 0 0 0 0 0 0 0 0 0 0 0 0 0 0 0 0 0 0 0 0 0 0 0 0 0 0 0 0 0 0 0 0 0 0 0 0 0 0 0 0 0 0 0 0 0 0 0 0 0 0 0 0 0 0 0 0 0 0 0 0 0 0 0 0 0 0 0 0 0 0 0 0 0 0 0 0 0 0 0 0 0 0 0 0 0 0 0 0 0 0 0 0 0 0 0 0 0 0 0 0 0 0 0 0 0 0 0 0 0 0 0 0 0 0 0 0 0 0 0 0 0 0 0 0 0 0 0 0 0 0 0 0 0 0 0 0 0 0 0 0 0 0 0 0 0 0 0 0 0 0 0 0 0 0 0 0 0 0 0 0 0 0 0 0 0 0 0 0 0 0 0 0 0 0 0 0 0 0 0 0 0 0 0 0 0 0 0 0 0 0 0 0 0 0 0 0 0 0 0 0 0 0 0 0 0 0 0 0 0 0 0 0 0 0 0 0 0 0 0 0 0 0 0 0 0 0 0 0 0 0 0 0 0 0 0 0 0 0 0 0 0 0 0 0 0 0 0 0 0 0 0 0 0 0 0 0 0 0 0 0 0 0 0 0 0 0 0 0 0 0 0 0 0 0 0 0 0 0 0 0 0 0 0 0 0 0 0 0 0 0 0 0 0 0 0 0 0 0 0 0 0 0 0 0 0 0 0 0 0 0 0 0 0 0 0 0 0 0 0 0 0 0 0 0 0 0 0 0 0 0 0 0 0 0 0 0 0 0 0 0 0 0 0 0 0 0 0 0 0 0 0 0 0 0 0 0 0 0 0 0 0 0 0 0 0 0 0 0 0 0 0 0 0 0 0 0 0 0 0 0 0 0 0 0 0 0 0 0 0 0 0 0 0 0 0 0 0 0 0 0 0 0 0 0 0 0 0 0 0 0 0 0 0 0 0 0 0 0 0 0 0 0 0 0 0 0 0 0 0 0 0 0 0 0 0 0 0 0 0 0 0 0 0 0 0 0 0 0 0 0 0 0 0 0 0 0 0 0 0 0 0 0 0 0 0 0 0 0 0 0 0 0 0 0 0 0 0 0 0 0 0 0 0 0 0 0 0 0 0 0 0 0 0 0 0 0 0 0 0 0 0 0 0 0 0 0 0 0 0 0 0 0 0 0 0 0 0 0 0 0 0 0 0 0 0 0 0 0 0 0 0 0 0 0 0 0 0 0 0 SP83 Bacteria;Bacteroidetes;Bacteroidia;Bacteroidales;Prevotellaceae;Alloprevotella;sp. HMT473 0 24 0 0 3 3 17 2 3 60 1 1641 119 12 5 0 85 0 222 36 1 0 0 0 3 0 0 0 0 11 20 0 9 0 21 1 71 0 0 89 0 53 17 42 0 106 24 0 954 2 4 0 0 1 4 10 1 24 4 4 0 1 2 209 16 17 561 25 111 586 164 0 16 0 0 23 13 0 38 0 0 21 0 211 0 2 0 7 1 2 24 1 604 6 0 0 89 0 1 57 1 3 0 4 0 3 13 0 26 1 1 0 1 36 185 117 22 2 280 3 2 2 0 93 0 0 17 0 0 0 2 8 1 3 92 2 139 3 0 1 10 55 0 70 3 4 44 231 0 13 0 0 1 0 0 0 2 0 0 0 0 21 4 29 0 0 2 2 3 0 0 0 0 5 0 0 1 1 0 29 0 0 1 139 9 8 12 0 7 1 1 2 55 4 6 9 1 8 8 0 4 16 0 0 1 40 18 0 2 48 0 0 0 0 0 2 375 1 0 0 3 15 2 3 10 1 129 41 0 1 0 0 0 0 0 12 1 4 0 5 0 3 2 5 11 0 0 0 4 0 0 2 7 0 0 0 2 0 1 0 1 0 0 1 1349 0 4 2 3 41 38 8 159 0 5 47 117 40 2 13 6 0 16 40 25 7 23 41 10 152 93 1 40 0 25 9 1 13 0 55 31 73 272 333 377 0 3 13 3 4 0 5 2 4 43 4 0 16 5 3 8 8 58 0 12 0 0 0 53 0 4 13 173 66 11 33 7 0 5 11 24 159 0 7 0 125 83 0 6 5 11 16 16 26 19 59 30 15 18 3 0 6 7 18 10 6 9 4 14 0 72 11 92 440 341 77 50 311 105 301 2 0 0 6 32 1 180 7 1 77 47 15 0 0 255 7 11 2 7 69 0 0 18 49 0 0 1 14 85 1 137 207 30 6 85 647 34 0 39 12 31 21 45 8 0 44 127 42 13 1 838 19 34 150 3 6 6 707 33 7 0 1 4 1 74 97 0 2 4 561 2 0 457 250 0 109 0 206 10 12 11 42 168 31 26 14 0 29 37 2 2 1 35 3 0 19 743 57 26 0 10 5 30 24 142 143 48 6 49 23 0 130 12 571 656 1422 0 0 166 15 34 69 46 8 5 68 0 67 0 0 3 11 11 3 275 3 0 11 8 22 256 20 43 21 15 5 8 7 4 5 14 29 51 4 0 0 551 11 10 84 138 7 40 79 4 16 202 109 3 38 4 7 48 8 36 18 114 131 0 19 9 4 1 1 0 32 0 66 8 0 7 1 9 30 6 0 6 90 86 12 66 0 9 244 36 31 2 681 12 0 0 64 0 464 3 23 1553 29 0 0 0 9 124 0 60 77 1 64 158 40 9 33 15 2 42 8 3 0 2 27 1 0 152 0 11 65 5 40 2 9 1 3 277 262 14 19 40 0 0 54 53 244 127 14 61 8 0 4 374 122 31 1191 27 100 385 26 41 241 18 0 1 0 45 6 1153 2 32 0 5 18 0 0 8 11 14 0 75 12 0 8 145 360 146 35 12 7 61 4 27 53 7 18 60 14 362 0 58 20 47 25 437 20 3 178 114 1 0 49 6 0 25 2 98 10 5 0 17 0 0 0 0 0 2 12 0 244 398 107 0 13 0 1 17 0 6 48 112 3 59 11 17 1 119 1 0 38 16 5 7 0 413 0 20 1 29 17 29 76 235 10 59 41 310 0 33 5 39 8 50 12 15 24 4 37 591 0 164 1 82 265 9 6 5 6 0 18 5 0 6 25 87 17 23 25 35 0 24 6 4 32 3 6 37 0 98 134 101 48 18 91 86 7 27 9 32 79 3 9 8 49 11 44 11 21 0 0 162 7 16 0 70 113 29 0 1 0 9 8 31 12 46 2 161 17 0 1 57 17 309 17 0 107 34 0 59 3 15 44 21 8 7 11 5 6 88 150 18 111 172 723 17 188 767 22 210 15 79 0 48 525 5 71 100 0 0 5 22 7 19 40 21 0 1107 0 49 105 0 62 30 26 15 156 23 36 5 1 174 7 254 69 49 6 0 48 5 12 0 10 29 113 4 1 67 87 51 0 16 3 55 3 5 6 0 6 28 7 439 139 30 1 63 3 108 0 89 4 6 24 1 79 9 31 41 315 40 51 5 1 16 132 1 0 1 170 1 15 3 2 3 1013 0 0 5 12 82 11 24 194 1 8 2 0 2 0 2 3 0 11 129 4 147 25 3 1 80 3 77 163 4 26 13 1 15 234 4 1 0 0 48 0 3 9 6 18 323 1138 1 0 5 2 2 98 8 10 0 8 28 1065 396 990 3621 558 1301 1754 4028 2270 3 24 200 5725 0 70 1309 151 7 1347 95 228 10 30 4 239 3169 52 1365 3219 404 2294 1620 3112 1903 58 2188 7424 16 1 2645 1443 1915 2063 243 45 1534 3925 2 0 751 3648 0 0 598 35 1392 5277 367 230 202 202 3 0 538 753 2 85 26 716 8 222 187 4 74 0 34 280 538 2647 860 589 313 662 39 0 0 9 408 2 11 395 7 253 19 0 17 3 108 1273 12 134 3077 1 205 1288 204 193 30 518 94 581 11 1581 0 3299 1 50 1022 63 2611 0 12 17 152 1384 75 254 357 7373 2013 496 12 9 456 290 2045 693 286 110 4222 225 248 900 943 302 188 29 29 23 68 835 0 112 282 12 16 70 9 116 375 361 361 0 56 5867 1 164 425 491 2178 622 39 17 1339 392 1 57 1060 0 7443 2 449 546 1073 297 1250 124 263 3475 2236 174 386 545 2294 738 145 2920 0 24 1631 1 22 94 1479 488 4 5430 117 1012 443 173 15 350 1797 218 84 62 816 6 4631 123 148 1320 1423 7 39 204 72 576 22 8 4528 104 2256 768 2 258 12 1408 12 97 3350 10 792 4812 0 530 1261 10 39 52 1 19 52 2282 136 55 1447 3591 162 3613 1865 164 2104 275 3707 19 146 7893 172 461 1635 3263 85 6152 11482 22 1493 5289 1040 286 143 23 478 160 2803 1167 232 1061 14 570 57 71 85 187 0 5520 496 3 1790 164 4972 3 70 4027 13 12 7433 91 3 1164 1200 949 1490 5990 3 76 675 174 16 1060 5 1 2 85 5751 412 595 496 272 2494 2019 306 355 32 2 1 20 303 43 1 114 48 23 121 1226 112 9 2492 5 19 9 58 9 821 1830 509 0 3695 3849 2486 1934 144 16 1 130 488 136 111 126 21 98 83 570 1233 15 17 2 24 8 23 1954 2436 258 246 785 1314 2 24 32 6 356 126 18 11 1473 422 122 1454 442 68 224 9 1 21 981 22 832 332 1232 426 1354 174 479 184 596 0 45 0 1719 19 523 2893 17 599 11 47 1093 1290 105 1244 620 99 1699 475 0 0 38 169 1797 374 96 1785 19 0 117 1 370 1717 960 2044 33 375 919 67 1321 528 5 15 209 20 2 18 358 1085 1 49 412 50 149 684 28 3760 7971 72 35 103 1222 6 53 183 9616 50 2021 638 6 274 5224 11 46 124 194 6 3499 2808 343 1 6199 1 140 408 1013 534 5772 227 0 259 3191 23 139 9 474 459 0 58 40 754 0 10 79 1583 201 575 16 920 468 2162 48 9 7 14 453 141 1 66 1117 606 67 2456 4352 49 23 611 1 74 621 31 79 504 503 1093 119 4240 49 118 2922 687 1838 6178 22 99 563 3676 122 10 3383 0 135 808 0 993 1434 250 363 1220 2730 974 1 766 74 128 112 1388 33 819 2443 364 12 2343 10023 16 197 124 60 1050 4 516 77 292 641 32 27 6415 0 4 504 14 11 49 298 288 633 614 88 31 384 3569 19 2320 552 47 175 1455 50 2 0 2561 32 23 2421 1152 504 3043 16 1074 1481 1352 21 19 1551 87 250 656 1373 1085 1699 0 0 2205 18 190 151 33 35 1414 748 110 260 617 6 115 1784 1440 126 14 7 30 25 32 122 122 514 3277 2512 472 480 2101 31 4359 1235 5524 10 9 8 12 37 3 0 39 26 0 95 38 74 193 3087 0 166 238 0 0 201 523 154 2 6 1 1 1501 11 346 1 124 4078 2302 1 11 1 1692 178 1 1 15 2283 0 2075 1 5 10 845 2153 1 760 239 2037 3137 303 1451 75 692 274 15 6 0 107 1 330 34 2560 1 1350 1805 6 173 68 47 1225 24 6 172 131 28 280 2 393 1412 185 563 4897 274 838 2 2699 1 197 24 6912 337 1575 762 90 23 94 10 31 263 135 253 9347 185 220 751 888 629 2576 2 1211 SP87 Bacteria;Actinobacteria;Actinobacteria;Actinomycetales;Actinomycetaceae;Schaalia;sp. HMT180 911 0 15 633 3 229 63 379 10 315 6 49 136 26 18 27 4 27 610 469 3543 3 236 110 1 14 2 3771 0 57 566 16 1 3 11 157 1336 379 0 1 872 44 36 145 24 1678 11 54 98 237 110 16 22 60 796 71 1506 338 14 391 168 15 431 20 838 92 0 85 74 712 1230 41 161 28 44 118 18 78 94 370 0 445 6 195 421 1275 529 3 14 8 0 1 6 97 3833 18 3 0 3 1 155 41 4 697 1 2 293 11 459 4 475 8 28 294 34 0 96 198 915 185 16 100 1 1127 154 19 10 1129 5057 2 22 1078 121 137 60 2 3726 29 4 574 34 1 154 14 4 223 270 118 1578 16 3007 3360 45 96 1183 138 546 9 3 476 23 13 1 426 863 823 0 68 0 11 0 2 6158 294 191 17 175 135 23 691 621 1 417 3442 1263 289 809 143 2257 7 349 769 42 4275 1 11 0 968 96 40 2 219 600 498 1 1620 22 0 2 0 0 205 10 2 38 354 11 16 0 1 88 7 15 23 4 110 236 18 4 100 32 0 73 17 11 583 71 25 131 34 62 29 1035 0 8 26 0 3 2011 74 80 81 38 242 3 29 5429 407 59 132 142 3 1270 0 14 94 1300 11 0 0 0 0 0 0 0 0 0 0 0 0 0 0 0 0 0 0 0 0 0 0 0 0 0 0 0 0 0 0 0 0 0 0 0 0 0 0 0 0 0 0 0 0 0 0 0 0 0 0 0 0 0 0 0 0 0 0 0 0 0 0 0 0 0 0 0 0 0 0 0 0 0 0 0 0 0 0 0 0 0 0 0 0 0 0 0 0 0 0 0 0 0 0 0 0 0 0 0 0 0 0 0 0 0 0 0 0 0 0 0 0 0 0 0 0 0 0 0 0 0 0 0 0 0 0 0 0 0 0 0 0 0 0 0 0 0 0 0 0 0 0 0 0 0 0 0 0 0 0 0 0 0 0 0 0 0 0 0 0 0 0 0 0 0 0 0 0 0 0 0 0 0 0 0 0 0 0 0 0 0 0 0 0 0 0 0 0 0 0 0 0 0 0 0 0 0 0 0 0 0 0 0 0 0 0 0 0 0 0 0 0 0 0 0 0 0 0 0 0 0 0 0 0 0 0 0 0 0 0 0 0 0 0 0 0 0 0 0 0 0 0 0 0 0 0 0 0 0 0 0 0 0 0 0 0 0 0 0 0 0 0 0 0 0 0 0 0 0 0 0 0 0 0 0 0 0 0 0 0 0 0 0 0 0 0 0 0 0 0 0 0 0 0 0 0 0 0 0 0 0 0 0 0 0 0 0 0 0 0 0 0 0 0 0 0 0 0 0 0 0 0 0 0 0 0 0 0 0 0 0 0 0 0 0 0 0 0 0 0 0 0 0 0 0 0 0 0 0 0 0 0 0 0 0 0 0 0 0 0 0 0 0 0 0 0 0 0 0 0 0 0 0 0 0 0 0 0 0 0 0 0 0 0 0 0 0 0 0 0 0 0 0 0 0 0 0 0 0 0 0 0 0 0 0 0 0 0 0 0 0 0 0 0 0 0 0 0 0 0 0 0 0 0 0 0 0 0 0 0 0 0 0 0 0 0 0 0 0 0 0 0 0 0 0 0 0 0 0 0 0 0 0 0 0 0 0 0 0 0 0 0 0 0 0 0 0 0 0 0 0 0 0 0 0 0 0 0 0 0 0 0 0 0 0 0 0 0 0 0 0 0 0 0 0 0 0 0 0 0 0 0 0 0 0 0 0 0 0 0 0 0 0 0 0 0 0 0 0 0 0 0 0 0 0 0 0 0 0 0 0 0 0 0 0 0 0 0 0 0 0 0 0 0 0 0 0 0 0 0 0 0 0 0 0 0 0 0 0 0 0 0 0 0 0 0 0 0 0 0 0 0 0 0 0 0 0 0 0 0 0 0 0 0 0 0 0 0 0 0 0 0 0 0 0 0 0 0 0 0 0 0 0 0 0 0 0 0 0 0 0 0 0 0 0 0 0 0 0 0 0 0 0 0 0 0 0 0 0 0 0 0 0 0 0 0 0 0 0 0 0 0 0 0 0 0 0 0 0 0 0 0 0 0 0 0 0 0 0 0 0 0 0 0 0 0 0 0 0 0 0 0 0 0 0 0 0 0 0 0 0 0 0 0 0 0 0 0 0 0 0 0 0 0 0 0 0 0 0 0 0 0 0 0 0 0 0 0 0 0 0 0 0 0 0 0 0 0 0 0 0 0 0 0 0 0 0 0 0 0 0 0 0 0 0 0 0 0 0 0 0 0 0 0 0 0 0 0 0 0 0 0 0 0 0 0 0 0 0 0 0 0 0 0 0 0 0 0 0 0 0 0 0 0 0 0 0 0 0 0 0 0 0 0 0 0 0 0 0 0 0 0 0 0 0 0 0 0 0 0 0 0 0 0 0 0 0 0 0 0 0 0 0 0 0 0 0 0 0 0 0 0 0 0 0 0 0 0 0 0 0 0 0 0 0 0 0 0 0 0 0 0 0 0 0 0 0 0 0 0 0 0 0 0 0 0 0 0 0 0 0 0 0 0 0 0 0 0 0 0 0 0 0 0 0 0 0 0 0 0 0 0 0 0 0 0 0 0 0 0 0 0 0 0 0 0 0 0 0 0 0 0 0 0 0 0 0 0 0 0 0 0 0 0 0 0 0 0 0 0 0 0 0 0 0 0 0 0 0 0 0 0 0 0 0 0 0 0 0 0 0 0 0 0 0 0 0 0 0 0 0 0 0 0 0 0 0 0 0 0 0 0 0 0 0 0 0 0 0 0 0 0 0 0 0 0 0 0 0 0 0 0 0 0 0 0 0 0 0 0 0 0 0 0 0 0 0 0 0 0 0 0 0 0 0 0 0 0 0 0 0 0 0 0 0 0 0 0 0 0 0 0 0 0 0 0 0 0 0 0 0 0 0 0 0 0 0 0 0 0 0 0 0 0 0 0 0 0 0 0 0 0 0 0 0 0 0 0 0 0 0 0 0 0 0 0 0 0 0 0 0 0 0 0 0 0 0 0 0 0 0 0 0 0 0 0 0 0 0 0 0 0 0 0 0 0 0 0 0 0 0 0 0 0 0 0 0 0 0 0 0 0 0 0 0 0 0 0 0 0 0 0 0 0 0 0 0 0 0 0 0 0 0 0 0 0 0 0 0 0 0 0 0 0 0 0 0 0 0 0 0 0 0 0 0 0 0 0 0 0 0 0 0 0 0 0 0 0 0 0 0 0 0 0 0 0 0 0 0 0 0 0 0 0 0 0 0 0 0 0 0 0 0 0 0 0 0 0 0 0 0 0 0 0 0 0 0 0 0 0 0 0 0 0 0 0 0 0 0 0 0 0 0 0 0 0 0 0 0 0 0 0 0 0 0 0 0 0 0 0 0 0 0 0 0 0 0 0 0 0 0 0 0 0 0 0 0 0 0 0 0 0 0 0 0 0 0 0 0 0 0 0 0 0 0 0 0 0 0 0 0 0 0 0 0 0 0 0 0 0 0 0 0 0 0 0 0 0 0 0 0 0 0 0 0 0 0 0 0 0 0 0 0 0 0 0 0 0 0 0 0 0 0 0 0 0 0 0 0 0 0 0 0 0 0 0 0 0 0 0 0 0 0 0 0 0 0 0 0 0 0 0 0 0 0 0 0 0 0 0 0 0 0 0 0 0 0 0 0 0 0 0 0 0 0 0 0 0 0 0 0 0 0 0 0 0 0 0 0 0 0 0 0 0 0 0 0 0 0 0 0 0 0 0 0 0 0 0 0 0 0 0 0 0 0 0 0 0 0 0 0 0 0 0 0 0 0 0 0 0 0 0 0 0 0 0 0 0 0 0 0 0 0 0 0 0 0 0 0 0 0 0 0 0 0 0 0 0 0 0 0 0 0 0 0 0 0 0 0 0 0 0 0 0 0 0 0 0 0 0 0 0 0 0 0 0 0 0 0 0 0 0 0 0 0 0 0 0 0 0 0 0 0 0 0 0 0 0 0 0 0 0 0 0 0 0 0 0 0 0 0 0 0 0 0 0 0 0 0 0 0 0 0 0 0 0 0 0 0 0 0 0 0 0 0 0 0 0 0 0 0 0 0 0 0 0 SP88 Bacteria;Bacteroidetes;Flavobacteriia;Flavobacteriales;Flavobacteriaceae;Capnocytophaga;sp. HMT332 0 5 0 0 0 5 0 6 2 0 1 6 5 0 0 0 0 7 36 4 0 0 0 0 14 0 0 0 16 78 0 0 103 0 0 2 0 0 3 0 0 0 2 0 5 0 0 0 0 0 15 0 0 4 1 0 0 0 0 0 0 0 0 0 69 3 1 0 2 6 25 0 12 0 0 0 1 0 0 0 0 0 0 1 0 0 0 6 0 8 1 0 3 7 0 6 1 15 1 0 0 0 0 0 2 0 0 17 1 1 0 0 5 0 0 0 0 0 1 0 0 0 0 1 0 0 0 0 0 409 0 0 0 0 35 0 0 0 0 0 0 0 20 153 0 1 11 36 0 0 0 0 0 5 0 0 10 0 2 0 2 8 0 3 4 3 1 5 0 0 0 0 0 3 3 0 0 0 0 0 0 0 3 1 0 3 0 0 1 12 0 0 6 0 0 4 0 0 0 0 0 0 23 0 0 0 0 0 0 4 3 0 0 0 0 0 1 0 0 3 0 2 0 42 0 0 5 0 0 0 0 0 1 1 0 0 0 0 0 18 0 0 0 1 0 0 0 0 0 0 1 0 0 1 0 0 0 0 0 0 6 0 0 38 19 0 0 0 0 50 0 0 24 0 0 0 12 3 7 0 9 60 0 2 19 4 0 0 0 7 0 0 0 0 11 0 0 3 0 1 0 0 39 2 0 0 0 0 18 0 0 0 0 0 0 0 0 2 0 0 0 0 0 0 0 0 0 0 0 0 0 0 0 0 0 0 0 0 0 0 0 0 0 0 0 0 0 0 0 0 0 0 0 0 0 0 0 0 0 0 0 10 0 0 0 9 0 0 92 0 0 0 0 9 0 0 0 0 0 0 0 0 103 25 0 8 0 1 0 0 0 0 0 109 0 0 12 0 8 1 0 0 0 0 41 0 3 0 0 0 0 1 0 0 0 0 0 0 0 0 3 3 2 0 0 0 0 0 0 0 2 279 4 31 0 0 37 0 0 0 11 0 0 0 0 1 0 0 40 0 0 0 19 0 0 0 0 0 0 15 2 0 0 0 0 2 0 1 0 0 0 14 0 118 0 0 1 0 0 8 42 0 0 0 18 40 112 80 5 0 7 0 0 151 44 0 0 0 0 1 18 0 0 0 10 0 0 0 0 0 7 0 0 0 0 0 0 0 0 0 0 11 0 0 1 0 0 0 0 1 0 256 199 0 1 0 1 0 0 1 0 0 0 0 0 0 32 0 0 0 1 0 0 1 4 0 0 0 0 371 0 0 0 5 0 0 0 0 0 0 0 0 0 0 7 0 0 0 0 0 0 5 22 0 0 0 10 0 0 0 0 0 0 0 0 0 0 0 0 0 0 0 0 87 0 0 0 0 0 24 37 7 5 0 0 0 0 0 0 0 0 0 0 12 16 0 5 0 0 50 41 0 0 0 0 50 0 0 0 0 1 1 2 391 74 0 0 0 0 0 0 0 0 2 0 3 64 0 0 1 0 0 0 0 11 0 0 0 0 0 0 75 0 108 0 0 0 0 0 0 0 0 118 0 0 3 0 0 0 92 15 0 0 0 0 4 0 0 0 6 74 0 0 1 0 0 0 0 0 3 0 0 0 0 0 0 1 0 0 0 0 0 16 0 0 0 62 1 0 1 2 0 0 2 0 0 2 4 88 0 5 0 4 104 51 0 0 324 0 0 0 0 298 0 0 0 0 0 0 0 9 0 0 0 0 0 30 13 0 3 39 0 80 7 0 0 0 0 125 32 0 0 0 0 0 0 0 0 0 0 0 8 0 16 0 0 0 0 0 2 0 0 0 0 0 0 0 0 0 1 0 0 1 0 0 32 0 0 0 81 0 3 0 0 0 0 0 2 7 0 1 0 0 0 0 2 0 42 0 0 0 0 0 0 0 0 0 4 12 0 0 0 0 0 0 0 0 0 0 0 0 0 13 0 0 1 0 68 13 0 1 0 0 60 0 0 0 0 2 0 8 2 0 0 0 0 0 1 0 0 0 0 0 0 0 0 0 0 28 0 0 0 2 0 4 0 0 37 201 0 132 28 0 18 3 18 0 0 11 0 0 0 0 829 1 0 0 0 0 0 145 0 1 0 0 0 0 0 0 0 38 0 12 10 0 2 0 0 0 0 0 0 121 114 0 2 37 0 0 0 0 0 0 62 0 1 0 0 7 0 0 13 0 0 0 0 9 0 0 95 17 0 0 2 0 0 0 7 0 127 45 0 0 22 0 1 5 0 0 0 0 0 0 0 0 1 0 0 0 0 0 0 0 0 0 0 0 0 0 0 0 0 2 0 1 0 11 4 11 0 1 26 0 8 4 0 0 55 0 0 143 6 0 42 0 0 3 0 0 0 49 9 0 0 0 0 48 8 0 2 16 0 0 0 39 0 0 0 0 0 4 0 0 0 88 18 516 0 15 0 0 0 0 0 1 1 0 0 0 0 0 14 3 0 0 0 0 0 0 0 0 0 42 0 0 0 0 0 0 1 0 0 0 0 0 0 0 0 26 0 0 0 2 8 205 0 0 0 0 27 1 0 1 60 0 0 0 2 0 0 1 0 0 139 423 0 0 38 10 0 17 7 0 0 2 0 0 0 64 0 0 1 2 0 3 1 6 9 1 773 0 0 40 0 0 0 0 0 0 0 0 0 0 0 0 0 0 12 0 0 0 0 67 0 3 0 14 0 0 19 2 0 0 0 0 0 0 71 5 0 28 6 0 22 0 1 0 0 0 2 0 7 31 0 0 0 0 0 0 10 0 1 7 0 11 4 0 0 0 0 0 0 0 0 0 0 0 34 0 0 0 0 0 29 7 0 0 3 0 13 8 0 0 2 0 0 134 10 0 0 1 0 0 115 0 0 0 0 0 0 0 0 0 0 0 0 27 1 0 0 179 510 0 6 0 0 14 0 0 67 25 0 0 3 0 0 1073 27 0 0 0 0 0 8 3 0 1 0 0 0 9 0 0 52 0 0 0 2 0 0 0 0 0 3 0 0 1 0 26 0 3 0 7 0 0 62 2 0 0 0 0 0 0 3 0 0 4 1 0 150 0 0 0 0 19 2 0 0 25 0 90 1 0 0 160 51 7 0 0 0 0 3 1 0 0 0 0 0 0 2 0 22 57 0 0 0 25 0 0 0 0 0 0 0 0 0 0 0 0 0 0 0 0 0 1 30 0 0 0 0 11 0 3 6 13 0 0 6 11 0 0 234 0 0 3 88 0 6 0 0 2 5 0 10 0 0 0 0 0 1 2 2 0 0 0 0 0 0 18 0 0 0 0 0 0 2 0 1 0 9 0 0 0 0 0 5 0 0 0 0 0 10 5 11 0 0 3 0 0 1 0 0 0 0 0 13 0 0 8 3 0 19 0 2 713 45 18 0 0 0 2 0 0 0 0 27 3 0 0 1 0 0 1 0 0 1 0 0 0 0 0 0 0 3 0 4 70 0 6 0 11 1 0 0 0 0 0 0 3 4 0 0 29 301 0 0 11 0 1 12 0 0 0 1 7 6 0 0 89 0 10 81 0 0 26 0 0 326 0 0 0 0 0 0 0 0 0 74 30 0 25 43 0 1 1 0 0 0 0 0 11 54 0 0 0 0 0 110 43 0 2 0 0 74 0 4 0 0 1 0 5 0 0 30 9 0 0 0 4 0 1 124 0 1 30 0 0 0 19 0 3 0 0 0 0 5 0 2 15 0 0 0 0 0 41 0 0 1 0 0 17 0 0 2 6 45 0 431 14 0 0 16 0 0 0 0 0 4 0 0 4 0 0 14 0 0 0 0 0 2 1 0 8 1 0 0 1 1 1 0 18 3 0 2 23 0 0 0 0 0 11 0 0 8 0 0 0 0 0 40 23 0 0 0 0 0 0 1 0 0 0 6 0 0 0 0 0 0 15 9 0 1 0 0 0 0 0 0 0 0 0 0 0 0 0 8 0 4 0 3 0 0 0 6 0 0 7 0 0 0 11 0 1 1 17 0 13 37 0 6 109 0 0 0 0 0 5 24 0 0 0 0 0 0 0 0 0 4 0 0 0 0 0 0 0 0 0 0 0 142 0 0 0 0 0 0 37 1 0 9 1 0 1 0 SP89 Bacteria;Firmicutes;Bacilli;Lactobacillales;Streptococcaceae;Streptococcus;downii 127 198 542 222 28420 1362 2 219 589 6112 365 633 522 2020 402 90 3705 5564 868 504 1066 1805 2764 618 112 254 898 1641 2849 13004 887 195 2056 63 701 872 102 3918 1277 13531 391 1706 2104 303 2158 243 10213 255 1324 1995 476 1182 939 424 1043 4080 328 1087 21810 628 3787 14436 1524 23 1283 8382 13221 809 7221 2509 957 11276 19085 3019 414 3439 761 604 14923 7895 3811 19188 7212 8669 35 366 1357 1047 16360 221 5166 485 7354 726 144 8819 8634 620 48 1902 41 11144 10 42 27433 12527 1867 3598 1998 14083 5892 8493 5717 4463 415 4396 1483 392 2685 7475 6 2455 1101 760 2053 1532 1159 773 1172 16474 367 1499 55 3876 926 12148 1531 358 996 507 2038 37712 1831 1850 25601 230 194 1495 2345 2283 230 479 532 2213 8247 3696 495 16794 1067 4421 4418 2459 1255 837 223 924 183 1177 868 8063 3281 481 2953 403 12 429 3349 2949 1842 2706 114 2513 5975 743 2071 2514 2831 1692 2 541 732 3176 1384 1379 173 9728 425 4559 6095 786 3775 471 1083 232 153 171 14132 209 1933 2 9 4712 668 309 1333 3432 1423 1343 16853 617 9538 2374 6386 5380 98 873 2863 8379 3528 219 40 2483 1166 4921 1298 407 368 483 11001 2493 4685 1401 1121 869 421 1377 1423 1 966 582 119 1860 379 315 47 213 1562 265 2536 44 451 11 484 430 632 141 2219 129 0 0 0 0 0 0 0 0 0 0 0 0 0 0 0 0 0 0 0 0 0 0 0 0 0 0 0 0 0 0 0 0 0 0 0 0 0 0 0 0 0 0 0 0 0 0 0 0 0 0 0 0 0 0 0 0 0 0 0 0 0 0 0 0 0 0 0 0 0 0 0 0 0 0 0 0 0 0 0 0 0 0 0 0 0 0 0 0 0 0 0 0 0 0 0 0 0 0 0 0 0 0 0 0 0 0 0 0 0 0 0 0 0 0 0 0 0 0 0 0 0 0 0 0 0 0 0 0 0 0 0 0 0 0 0 0 0 0 0 0 0 0 0 0 0 0 0 0 0 0 0 0 0 0 0 0 0 0 0 0 0 0 0 0 0 0 0 0 0 0 0 0 0 0 0 0 0 0 0 0 0 0 0 0 0 0 0 0 0 0 0 0 0 0 0 0 0 0 0 0 0 0 0 0 0 0 0 0 0 0 0 0 0 0 0 0 0 0 0 0 0 0 0 0 0 0 0 0 0 0 0 0 0 0 0 0 0 0 0 0 0 0 0 0 0 0 0 0 0 0 0 0 0 0 0 0 0 0 0 0 0 0 0 0 0 0 0 0 0 0 0 0 0 0 0 0 0 0 0 0 0 0 0 0 0 0 0 0 0 0 0 0 0 0 0 0 0 0 0 0 0 0 0 0 0 0 0 0 0 0 0 0 0 0 0 0 0 0 0 0 0 0 0 0 0 0 0 0 0 0 0 0 0 0 0 0 0 0 0 0 0 0 0 0 0 0 0 0 0 0 0 0 0 0 0 0 0 0 0 0 0 0 0 0 0 0 0 0 0 0 0 0 0 0 0 0 0 0 0 0 0 0 0 0 0 0 0 0 0 0 0 0 0 0 0 0 0 0 0 0 0 0 0 0 0 0 0 0 0 0 0 0 0 0 0 0 0 0 0 0 0 0 0 0 0 0 0 0 0 0 0 0 0 0 0 0 0 0 0 0 0 0 0 0 0 0 0 0 0 0 0 0 0 0 0 0 0 0 0 0 0 0 0 0 0 0 0 0 0 0 0 0 0 0 0 0 0 0 0 0 0 0 0 0 0 0 0 0 0 0 0 0 0 0 0 0 0 0 0 0 0 0 0 0 0 0 0 0 0 0 0 0 0 0 0 0 0 0 0 0 0 0 0 0 0 0 0 0 0 0 0 0 0 0 0 0 0 0 0 0 0 0 0 0 0 0 0 0 0 0 0 0 0 0 0 0 0 0 0 0 0 0 0 0 0 0 0 0 0 0 0 0 0 0 0 0 0 0 0 0 0 0 0 0 0 0 0 0 0 0 0 0 0 0 0 0 0 0 0 0 0 0 0 0 0 0 0 0 0 0 0 0 0 0 0 0 0 0 0 0 0 0 0 0 0 0 0 0 0 0 0 0 0 0 0 0 0 0 0 0 0 0 0 0 0 0 0 0 0 0 0 0 0 0 0 0 0 0 0 0 0 0 0 0 0 0 0 0 0 0 0 0 0 0 0 0 0 0 0 0 0 0 0 0 0 0 0 0 0 0 0 0 0 0 0 0 0 0 0 0 0 0 0 0 0 0 0 0 0 0 0 0 0 0 0 0 0 0 0 0 0 0 0 0 0 0 0 0 0 0 0 0 0 0 0 0 0 0 0 0 0 0 0 0 0 0 0 0 0 0 0 0 0 0 0 0 0 0 0 0 0 0 0 0 0 0 0 0 0 0 0 0 0 0 0 0 0 0 0 0 0 0 0 0 0 0 0 0 0 0 0 0 0 0 0 0 0 0 0 0 0 0 0 0 0 0 0 0 0 0 0 0 0 0 0 0 0 0 0 0 0 0 0 0 0 0 0 0 0 0 0 0 0 0 0 0 0 0 0 0 0 0 0 0 0 0 0 0 0 0 0 0 0 0 0 0 0 0 0 0 0 0 0 0 0 0 0 0 0 0 0 0 0 0 0 0 0 0 0 0 0 0 0 0 0 0 0 0 0 0 0 0 0 0 0 0 0 0 0 0 0 0 0 0 0 0 0 0 0 0 0 0 0 0 0 0 0 0 0 0 0 0 0 0 0 0 0 0 0 0 0 0 0 0 0 0 0 0 0 0 0 0 0 0 0 0 0 0 0 0 0 0 0 0 0 0 0 0 0 0 0 0 0 0 0 0 0 0 0 0 0 0 0 0 0 0 0 0 0 0 0 0 0 0 0 0 0 0 0 0 0 0 0 0 0 0 0 0 0 0 0 0 0 0 0 0 0 0 0 0 0 0 0 0 0 0 0 0 0 0 0 0 0 0 0 0 0 0 0 0 0 0 0 0 0 0 0 0 0 0 0 0 0 0 0 0 0 0 0 0 0 0 0 0 0 0 0 0 0 0 0 0 0 0 0 0 0 0 0 0 0 0 0 0 0 0 0 0 0 0 0 0 0 0 0 0 0 0 0 0 0 0 0 0 0 0 0 0 0 0 0 0 0 0 0 0 0 0 0 0 0 0 0 0 0 0 0 0 0 0 0 0 0 0 0 0 0 0 0 0 0 0 0 0 0 0 0 0 0 0 0 0 0 0 0 0 0 0 0 0 0 0 0 0 0 0 0 0 0 0 0 0 0 0 0 0 0 0 0 0 0 0 0 0 0 0 0 0 0 0 0 0 0 0 0 0 0 0 0 0 0 0 0 0 0 0 0 0 0 0 0 0 0 0 0 0 0 0 0 0 0 0 0 0 0 0 0 0 0 0 0 0 0 0 0 0 0 0 0 0 0 0 0 0 0 0 0 0 0 0 0 0 0 0 0 0 0 0 0 0 0 0 0 0 0 0 0 0 0 0 0 0 0 0 0 0 0 0 0 0 0 0 0 0 0 0 0 0 0 0 0 0 0 0 0 0 0 0 0 0 0 0 0 0 0 0 0 0 0 0 0 0 0 0 0 0 0 0 0 0 0 0 0 0 0 0 0 0 0 0 0 0 0 0 0 0 0 0 0 0 0 0 0 0 0 0 0 0 0 0 0 0 0 0 0 0 0 0 0 0 0 0 0 0 0 0 0 0 0 0 0 0 0 0 0 0 0 0 0 0 0 0 0 0 0 0 0 0 0 0 0 0 0 0 0 0 0 0 0 0 0 0 0 0 0 0 0 0 0 0 0 0 0 0 0 0 0 0 0 0 0 0 0 0 0 0 0 0 0 0 0 0 0 0 0 0 0 0 0 0 0 0 0 0 0 0 0 0 0 0 0 0 0 0 0 0 0 0 0 0 0 0 0 0 0 0 0 0 0 0 0 0 0 0 0 0 0 0 0 0 0 0 0 0 0 0 0 0 0 0 0 0 0 0 0 0 0 0 0 0 0 0 0 0 0 0 0 0 0 0 0 0 0 0 0 0 0 0 0 0 0 0 0 0 0 0 0 0 0 0 0 0 0 0 0 0 0 0 0 0 0 0 0 0 0 0 0 0 0 0 0 0 0 0 0 0 0 0 0 0 0 0 0 0 0 0 SP91 Bacteria;Firmicutes;Clostridia;Clostridiales;Lachnospiraceae_[XIV];Oribacterium;sinus 30 143 6 49 181 689 227 754 30 685 131 40 322 41 36 155 4 6 220 331 79 42 42 58 134 544 38 128 110 13 70 117 40 26 152 131 141 3 30 61 229 32 70 167 17 205 43 55 2 70 139 326 121 35 230 25 133 9 19 170 11 14 26 47 600 6 3 624 9 416 413 70 8 71 16 79 127 89 35 14 620 83 30 58 148 238 152 116 9 380 0 11 16 21 121 190 9 13 40 173 181 48 156 140 8 20 24 9 212 13 89 506 40 160 85 15 13 185 241 111 18 91 43 82 105 167 149 148 303 0 369 88 191 64 127 977 225 369 238 91 25 2 48 34 0 148 190 173 528 263 161 238 147 305 119 363 209 32 52 406 203 53 46 42 25 341 69 500 89 55 13 10 9 337 607 235 458 353 9 106 90 49 175 585 1482 411 367 85 325 261 475 264 787 595 201 66 890 341 61 90 2 360 231 345 107 549 88 39 14 33 368 151 640 72 108 101 37 426 0 106 399 335 57 19 430 187 221 57 36 732 152 16 177 48 325 565 412 132 169 49 34 176 598 77 60 388 486 24 368 681 715 98 246 56 92 6 161 121 47 152 54 118 25 55 130 198 395 281 0 0 1 0 0 0 0 1 0 0 0 0 5 3 13 1 0 0 0 1 0 0 6 0 0 0 0 0 0 2 0 1 0 1 3 0 0 0 0 0 0 0 1 0 1 0 0 0 0 0 0 0 0 0 0 0 20 0 0 0 0 0 0 1 0 0 0 0 0 7 0 0 0 0 0 0 1 1 0 0 2 0 0 0 0 0 0 0 0 0 0 19 0 0 0 2 0 0 0 1 1 0 1 0 1 0 1 0 1 0 0 0 0 0 0 0 3 1 0 0 0 0 0 0 0 0 1 1 0 0 0 0 1 0 0 6 0 0 0 0 0 1 0 0 0 0 0 1 0 0 0 1 0 0 0 0 0 0 0 0 0 0 0 0 0 0 0 0 0 2 1 1 0 0 0 0 0 0 0 5 0 0 2 0 0 0 0 2 0 0 1 0 0 0 2 1 0 0 0 0 0 0 0 1 0 8 0 0 1 0 0 0 0 0 0 0 0 0 0 0 0 0 0 0 0 2 0 0 0 0 7 2 1 0 0 0 0 0 0 0 2 0 0 0 0 0 1 0 0 0 0 0 0 0 0 0 1 1 0 0 1 0 0 1 0 0 1 0 0 0 0 0 2 0 3 6 0 0 3 2 0 0 18 0 0 0 1 0 0 0 0 0 0 0 0 0 1 1 0 0 0 2 0 0 0 1 0 1 0 0 0 0 0 0 0 0 1 0 0 0 0 0 0 0 0 0 3 1 0 0 0 0 0 1 0 0 0 0 0 1 0 0 0 0 0 0 0 0 0 0 3 1 0 0 0 0 0 1 0 0 0 1 0 0 0 0 0 1 0 0 0 0 0 2 0 1 1 0 0 0 0 0 0 0 0 1 0 0 2 0 0 0 0 0 1 0 0 0 0 0 2 0 0 1 0 0 1 0 0 0 0 1 3 0 0 0 1 0 0 0 0 0 0 6 0 0 0 0 0 0 32 0 2 0 0 0 0 1 0 0 0 7 5 0 1 0 0 0 0 0 0 0 0 0 1 0 0 0 0 0 0 1 0 0 1 3 0 0 2 0 0 0 0 0 1 1 0 0 0 1 0 0 0 0 0 0 0 0 1 0 2 1 1 0 1 0 0 0 0 0 0 0 0 1 0 0 0 0 0 0 1 0 0 0 0 2 2 3 0 0 0 0 3 0 0 0 0 0 0 0 1 1 0 0 1 0 4 0 0 0 3 0 1 2 0 0 0 0 0 0 0 0 0 0 0 0 0 0 0 0 0 0 12 0 0 0 0 1 0 0 0 0 0 0 0 0 0 0 0 0 0 0 1 0 0 1 0 0 0 0 0 0 0 0 0 0 0 7 0 0 0 0 0 0 0 0 0 0 0 0 0 13 0 0 0 1 0 0 0 0 0 0 2 0 0 0 0 0 0 0 0 0 1 0 0 0 0 0 0 0 0 0 0 0 0 0 0 0 0 0 0 0 0 1 0 0 0 0 0 0 0 0 1 0 0 0 0 1 0 2 0 0 0 0 0 0 0 0 0 0 0 0 1 0 0 1 0 0 0 3 1 0 0 0 1 0 0 0 0 0 0 0 0 0 1 0 0 0 0 0 13 0 0 0 0 1 0 1 0 0 0 0 0 0 0 0 0 0 2 0 1 0 0 0 0 0 0 0 0 0 1 0 0 0 0 0 0 0 0 0 0 11 0 0 0 0 0 0 5 5 2 1 5 7 0 24 10 39 1 5 1 0 7 1 9 20 4 1 13 27 1 23 6 1 8 4 0 31 29 13 0 1 10 10 44 0 5 6 9 6 1 6 60 27 9 8 0 0 1 5 11 0 13 6 15 0 3 5 0 1 1 4 0 2 20 13 17 12 1 1 4 6 1 0 0 6 8 0 1 1 5 2 1 10 1 61 0 1 6 12 10 5 1 0 11 0 4 47 1 5 1 5 32 31 2 0 1 0 44 0 128 1 88 3 2 5 1 20 7 0 0 2 1 0 1 5 41 11 5 0 8 6 21 27 1 8 146 1 0 12 1 1 1 6 0 21 2 0 17 2 0 18 3 15 9 37 14 20 14 7 2 12 4 7 15 0 1 2 2 5 20 8 5 3 5 2 0 2 9 15 4 0 17 5 0 2 4 8 1 5 3 9 10 3 1 12 26 4 33 18 2 1 2 6 4 2 12 5 7 0 0 1 3 0 1 9 0 4 20 1 0 25 1 10 15 7 5 1 9 0 0 12 0 12 11 0 5 5 16 6 0 26 1 1 0 0 1 0 3 0 1 3 1 12 2 4 0 7 3 18 6 0 8 3 2 4 2 7 1 1 6 7 1 9 2 7 1 7 10 0 17 1 4 1 0 22 21 114 13 0 0 42 11 26 1 0 0 7 21 113 0 49 6 0 0 36 0 2 25 1 2 1 30 125 3 23 8 14 25 5 0 22 9 23 5 5 3 6 26 0 0 3 11 52 1 41 18 1 76 7 4 6 1 5 1 17 5 6 13 0 6 32 1 39 8 10 5 11 3 8 2 2 99 6 1 1 0 4 3 1 2 15 22 7 33 1 5 0 31 4 19 3 5 4 0 7 2 0 21 1 0 11 1 2 3 1 1 59 12 146 11 9 0 3 0 30 7 0 0 11 1 51 6 20 10 54 8 2 0 118 0 1 1 4 6 14 9 43 4 6 13 0 3 8 0 17 92 1 0 20 5 0 2 3 2 7 8 2 0 1 4 5 21 0 1 5 2 36 18 0 11 1 0 15 7 3 28 0 0 27 41 1 31 50 29 13 2 65 1 48 2 4 6 79 32 14 14 11 5 1 6 16 0 6 15 1 14 31 23 1 9 20 8 0 28 14 0 10 0 3 64 127 3 0 12 5 13 0 41 11 33 0 11 8 0 1 12 11 1 4 4 9 2 0 4 1 10 1 9 7 0 3 22 19 3 20 6 0 23 1 3 23 4 2 14 25 1 4 50 8 2 4 2 0 0 0 1 4 39 5 3 3 28 5 6 2 0 2 22 7 2 0 1 1 0 5 0 1 3 6 1 4 4 2 17 4 0 2 6 1 5 4 0 3 1 3 59 24 9 12 0 12 4 0 11 4 12 10 42 33 26 1 26 4 16 4 0 2 2 7 14 0 8 48 2 13 2 4 0 4 42 3 21 1 36 0 0 4 14 3 1 28 16 1 2 0 0 0 19 1 8 0 5 24 0 9 4 9 26 3 0 9 2 0 4 5 6 3 33 1 0 1 33 10 13 11 17 4 1 3 6 1 1 23 1 1 2 2 4 4 67 29 5 2 3 1 8 6 0 27 46 16 36 6 2 3 4 2 6 5 11 5 62 2 1 0 22 7 1 14 0 1 0 0 5 0 0 93 2 0 0 1 17 2 5 1 1 2 3 0 1 0 0 3 2 2 5 4 1 0 3 1 0 2 19 13 1 0 5 3 0 0 2 3 8 1 6 16 15 0 27 2 0 0 13 23 63 1 0 6 11 1 12 1 0 0 SP92 Bacteria;Actinobacteria;Actinomycetia;Actinomycetales;Actinomycetaceae;Actinomyces;sp. HMT169 102 19 5 92 13 17 215 0 236 94 4 0 276 0 13 88 1 10 126 2 16 247 9 783 9 87 22 84 122 17 0 5 17 48 64 9 81 3 1 53 5 3 105 1 233 0 109 1658 720 746 33 32 28 84 56 10 8 100 84 29 3 122 83 55 3 15 2 5 5 1 29 91 6 383 207 1 32 24 169 112 9 64 55 30 4 0 97 42 168 43 2 100 28 30 12 1 210 150 15 154 78 156 47 11 1 1 2 103 2 68 3175 36 211 116 8 1 0 9 15 65 222 94 2 32 6 0 76 1 34 7 2 27 15 56 10 0 0 54 0 0 1039 3 229 273 157 44 0 9 4 9 24 9 68 107 187 39 4 7 18 139 25 1 13 32 0 53 247 62 12 7 0 355 8 13 101 34 43 54 11 150 28 0 4 21 76 9 1 14 1 35 35 59 19 9 4 303 24 27 6 2 72 20 5 1 4 5 7 74 72 193 9 131 2 23 152 28 19 134 1 3 2 6 1 3 1 72 0 13 199 31 86 1 25 20 5 0 1 17 90 111 0 0 12 138 741 8 22 1 1 18 7 12 11 62 3 29 4 4 154 3 82 12 86 2 85 189 61 172 0 0 0 0 0 0 0 0 0 0 0 0 0 0 0 0 0 0 0 0 0 0 0 0 0 0 0 0 0 0 0 0 0 0 0 0 0 0 0 0 0 0 0 0 0 0 0 0 0 0 0 0 0 0 0 0 0 0 0 0 0 0 0 0 0 0 0 0 0 0 0 0 0 0 0 0 0 0 0 0 0 0 0 0 0 0 0 0 0 0 0 0 0 0 0 0 0 0 0 0 0 0 0 0 0 0 0 0 0 0 0 0 0 0 0 0 0 0 0 0 0 0 0 0 0 0 0 0 0 0 0 0 0 0 0 0 0 0 0 0 0 0 0 0 0 0 0 0 0 0 0 0 0 0 0 0 0 0 0 0 0 0 0 0 0 0 0 0 0 0 0 0 0 0 0 0 0 0 0 0 0 0 0 0 0 0 0 0 0 0 0 0 0 0 0 0 0 0 0 0 0 0 0 0 0 0 0 0 0 0 0 0 0 0 0 0 0 0 0 0 0 0 0 0 0 0 0 0 0 0 0 0 0 0 0 0 0 0 0 0 0 0 0 0 0 0 0 0 0 0 0 0 0 0 0 0 0 0 0 0 0 0 0 0 0 0 0 0 0 0 0 0 0 0 0 0 0 0 0 0 0 0 0 0 0 0 0 0 0 0 0 0 0 0 0 0 0 0 0 0 0 0 0 0 0 0 0 0 0 0 0 0 0 0 0 0 0 0 0 0 0 0 0 0 0 0 0 0 0 0 0 0 0 0 0 0 0 0 0 0 0 0 0 0 0 0 0 0 0 0 0 0 0 0 0 0 0 0 0 0 0 0 0 0 0 0 0 0 0 0 0 0 0 0 0 0 0 0 0 0 0 0 0 0 0 0 0 0 0 0 0 0 0 0 0 0 0 0 0 0 0 0 0 0 0 0 0 0 0 0 0 0 0 0 0 0 0 0 0 0 0 0 0 0 0 0 0 0 0 0 0 0 0 0 0 0 0 0 0 0 0 0 0 0 0 0 0 0 0 0 0 0 0 0 0 0 0 0 0 0 0 0 0 0 0 0 0 0 0 0 0 0 0 0 0 0 0 0 0 0 0 0 0 0 0 0 0 0 0 0 0 0 0 0 0 0 0 0 0 0 0 0 0 0 0 0 0 0 0 0 0 0 0 0 0 0 0 0 0 0 0 0 0 0 0 0 0 0 0 0 0 0 0 0 0 0 0 0 0 0 0 0 0 0 0 0 0 0 0 0 0 0 0 0 0 0 0 0 0 0 0 0 0 0 0 0 0 0 0 0 0 0 0 0 0 0 0 0 0 0 0 0 0 0 0 0 0 0 0 0 0 0 0 0 0 0 0 0 0 0 0 0 0 0 0 0 0 0 0 0 0 0 0 0 0 0 0 0 0 0 0 0 0 0 0 0 0 0 0 0 0 0 0 0 0 0 0 0 0 0 0 0 0 0 0 0 0 0 0 0 0 0 0 0 0 0 0 0 0 0 0 0 0 0 0 0 0 0 0 0 0 0 0 0 0 0 0 0 0 0 0 0 0 0 0 0 0 0 0 0 0 0 0 0 0 0 0 0 0 0 0 0 0 0 0 0 0 0 0 0 0 0 0 0 0 0 0 0 0 0 0 0 0 0 0 0 0 0 0 0 0 0 0 0 0 0 0 0 0 0 0 0 0 0 0 0 0 0 0 0 0 0 0 0 0 0 0 0 0 0 0 0 0 0 0 0 0 0 0 0 0 0 0 0 0 0 0 0 0 0 0 0 0 0 0 0 0 0 0 0 0 0 0 0 0 0 0 0 0 0 0 0 0 0 0 0 0 0 0 0 0 0 0 0 0 0 0 0 0 0 0 0 0 0 0 0 0 0 0 0 0 0 0 0 0 0 0 0 0 0 0 0 0 0 0 0 0 0 0 0 0 0 0 0 0 0 0 0 0 0 0 0 0 0 0 0 0 0 0 0 0 0 0 0 0 0 0 0 0 0 0 0 0 0 0 0 0 0 0 0 0 0 0 0 0 0 0 0 0 0 0 0 0 0 0 0 0 0 0 0 0 0 0 0 0 0 0 0 0 0 0 0 0 0 0 0 0 0 0 0 0 0 0 0 0 0 0 0 0 0 0 0 0 0 0 0 0 0 0 0 0 0 0 0 0 0 0 0 0 0 0 0 0 0 0 0 0 0 0 0 0 0 0 0 0 0 0 0 0 0 0 0 0 0 0 0 0 0 0 0 0 0 0 0 0 0 0 0 0 0 0 0 0 0 0 0 0 0 0 0 0 0 0 0 0 0 0 0 0 0 0 0 0 0 0 0 0 0 0 0 0 0 0 0 0 0 0 0 0 0 0 0 0 0 0 0 0 0 0 0 0 0 0 0 0 0 0 0 0 0 0 0 0 0 0 0 0 0 0 0 0 0 0 0 0 0 0 0 0 0 0 0 0 0 0 0 0 0 0 0 0 0 0 0 0 0 0 0 0 0 0 0 0 0 0 0 0 0 0 0 0 0 0 0 0 0 0 0 0 0 0 0 0 0 0 0 0 0 0 0 0 0 0 0 0 0 0 0 0 0 0 0 0 0 0 0 0 0 0 0 0 0 0 0 0 0 0 0 0 0 0 0 0 0 0 0 0 0 0 0 0 0 0 0 0 0 0 0 0 0 0 0 0 0 0 0 0 0 0 0 0 0 0 0 0 0 0 0 0 0 0 0 0 0 0 0 0 0 0 0 0 0 0 0 0 0 0 0 0 0 0 0 0 0 0 0 0 0 0 0 0 0 0 0 0 0 0 0 0 0 0 0 0 0 0 0 0 0 0 0 0 0 0 0 0 0 0 0 0 0 0 0 0 0 0 0 0 0 0 0 0 0 0 0 0 0 0 0 0 0 0 0 0 0 0 0 0 0 0 0 0 0 0 0 0 0 0 0 0 0 0 0 0 0 0 0 0 0 0 0 0 0 0 0 0 0 0 0 0 0 0 0 0 0 0 0 0 0 0 0 0 0 0 0 0 0 0 0 0 0 0 0 0 0 0 0 0 0 0 0 0 0 0 0 0 0 0 0 0 0 0 0 0 0 0 0 0 0 0 0 0 0 0 0 0 0 0 0 0 0 0 0 0 0 0 0 0 0 0 0 0 0 0 0 0 0 0 0 0 0 0 0 0 0 0 0 0 0 0 0 0 0 0 0 0 0 0 0 0 0 0 0 0 0 0 0 0 0 0 0 0 0 0 0 0 0 0 0 0 0 0 0 0 0 0 0 0 0 0 0 0 0 0 0 0 0 0 0 0 0 0 0 0 0 0 0 0 0 0 0 0 0 0 0 0 0 0 0 0 0 0 0 0 0 0 0 0 0 0 0 0 0 0 0 0 0 0 0 0 0 0 0 0 0 0 0 0 0 0 0 0 0 0 0 0 0 0 0 0 0 0 0 0 0 0 0 0 0 0 0 0 0 0 0 0 0 0 0 0 0 0 0 0 0 0 0 0 0 0 0 0 0 0 0 0 0 SP94 Bacteria;Firmicutes;Clostridia;Clostridiales;Ruminococcaceae;Ruminococcaceae_[G-1];bacterium HMT075 12 0 31 33 0 183 0 33 2 15 67 282 15 111 0 21 39 31 79 45 0 0 70 237 60 9 5 2 0 1 55 92 178 29 0 24 1 326 2 46 49 12 57 0 24 0 11 0 412 4 85 18 3 14 35 37 86 50 14 96 0 0 0 0 40 6 10 51 238 204 27 15 273 0 13 43 102 3 6 70 0 195 0 82 16 489 2 85 0 42 15 3 26 107 100 37 5 10 15 26 184 16 0 29 222 28 4 5 176 1 5 20 40 1 59 92 44 0 220 287 0 7 2 190 18 59 38 3 25 969 200 138 0 0 100 29 2061 76 14 24 56 28 35 33 0 161 20 111 52 5 0 0 0 37 0 136 299 0 6 0 240 6 65 0 13 28 93 34 9 35 0 0 22 75 7 0 48 71 0 31 13 1 2 114 2 16 43 118 370 75 4 6 343 59 30 0 11 420 63 16 38 0 92 72 2 0 18 36 11 0 19 0 20 12 0 7 3 25 14 1 34 98 8 74 0 0 373 239 2 327 84 9 58 8 28 133 61 43 386 51 8 0 25 21 27 20 209 7 115 2 102 0 6 22 0 2 0 481 1 34 27 6 7 281 0 0 11 11 0 21 0 0 0 0 36 0 1 0 7 0 16 11 0 2 7 0 0 0 0 8 7 0 1 0 8 0 9 29 0 6 2 0 12 13 1 0 3 0 16 1 0 0 0 0 0 0 0 1 0 0 0 6 6 0 0 0 0 0 0 0 0 0 0 0 0 0 0 0 0 0 0 0 0 0 0 0 0 0 0 0 1 0 0 2 0 0 0 1 0 0 0 0 0 0 0 0 0 0 25 0 3 0 0 38 0 0 0 0 0 4 0 0 3 0 0 0 0 0 0 0 0 0 0 0 0 0 2 0 0 1 3 0 8 24 3 0 0 0 0 0 0 38 0 0 0 0 0 0 48 0 0 1 7 0 0 0 0 5 0 0 0 14 0 0 0 1 0 3 0 0 19 0 0 0 0 0 0 0 39 1 0 0 17 0 0 0 0 0 0 57 0 49 0 1 0 0 0 11 3 0 1 0 0 0 2 0 0 0 15 18 0 0 0 0 0 7 47 42 48 119 3 0 0 53 58 0 0 0 0 12 14 0 0 0 6 0 0 0 1 0 0 0 0 0 0 0 1 0 1 0 0 0 0 0 0 0 0 0 0 0 0 1 0 0 1 0 1 0 0 0 0 6 26 5 0 0 46 7 0 0 71 0 3 0 0 0 0 0 0 155 0 1 19 9 87 91 0 0 0 12 0 0 0 0 0 0 0 0 0 0 0 2 2 0 0 1 9 0 0 0 0 0 0 0 3 1 0 1 0 0 0 0 0 43 0 0 0 0 0 23 59 0 0 26 0 1 0 0 0 0 0 0 0 0 0 1 66 0 0 4 3 0 0 2 0 4 3 0 0 0 0 18 2 15 17 0 0 5 0 1 0 0 2 1 7 0 14 0 12 0 1 0 10 0 0 0 3 0 1 0 0 7 0 4 0 0 6 0 1 0 0 1 6 0 0 0 19 0 0 0 2 0 0 2 0 9 1 0 0 0 0 14 3 1 0 0 63 0 0 3 2 0 48 131 0 0 0 0 0 0 0 0 1 0 0 2 13 16 1 2 0 6 0 4 0 0 0 0 33 1 0 0 54 0 5 0 0 0 8 1 6 0 20 0 1 0 2 14 0 57 0 5 0 0 4 0 15 17 0 14 4 41 31 0 0 0 22 0 6 9 0 0 0 2 0 0 4 0 0 0 0 5 0 1 0 0 10 0 0 0 0 0 0 0 0 0 0 0 22 0 6 0 0 0 3 5 0 0 0 0 0 0 0 0 0 0 0 0 5 0 0 0 0 0 0 1 2 7 0 0 3 0 0 0 0 0 0 0 0 0 0 10 0 0 24 0 18 0 0 0 0 0 0 0 0 0 0 24 0 15 0 0 29 17 29 0 9 0 15 0 1 3 5 12 4 0 0 0 5 1 3 0 0 0 0 0 0 0 9 0 1 0 2 0 0 0 37 0 0 0 14 3 0 1 4 27 0 72 4 0 0 0 0 53 0 0 0 1 1 0 49 0 7 0 0 0 0 3 2 0 8 0 2 3 0 1 29 0 0 0 2 0 5 72 0 0 0 1 0 1 0 0 23 180 0 2 1 0 1 0 2 0 0 12 27 0 10 5 0 1 0 0 14 26 0 2 0 58 1 58 27 0 0 10 0 0 0 0 0 0 1 30 0 17 0 140 0 0 0 0 1 20 0 3 31 0 0 0 0 0 0 0 0 6 2 0 4 2 21 0 14 5 0 30 4 0 0 51 5 0 33 0 1 0 9 0 0 3 0 1 5 0 0 0 0 0 2 1 0 0 12 2 3 0 13 286 0 4 2 0 4 1 1 0 1 0 18 0 6 0 0 0 1 0 2 7 0 2 27 2 2 12 1 0 0 0 0 3 20 0 0 0 0 1 0 0 0 0 0 0 0 6 0 0 0 8 0 0 0 2 18 1 295 0 38 0 0 0 0 0 4 0 11 8 0 0 5 36 0 0 0 0 0 31 41 0 0 22 0 0 18 0 0 6 7 11 1 0 37 0 7 0 1 0 2 0 2 24 4 7 0 72 27 0 28 0 2 0 1 0 2 16 2 2 14 5 2 7 0 0 0 0 4 0 5 0 30 38 1 5 2 0 0 0 0 0 0 7 8 0 18 6 1 2 2 1 1 0 10 0 0 2 0 1 2 0 13 0 0 23 0 3 5 0 16 17 0 0 0 0 0 0 5 0 0 0 3 16 2 20 0 3 1 11 41 0 53 0 0 7 26 0 0 1 0 0 13 18 2 6 1 0 0 22 6 0 1 0 0 7 2 0 1 2 3 0 14 8 1 0 49 17 0 42 7 3 4 3 0 19 0 3 1 2 0 0 4 0 0 9 23 1 0 45 1 3 4 0 0 0 4 0 0 15 0 0 0 0 0 0 5 0 24 0 0 0 3 0 0 10 2 0 80 14 0 28 0 0 0 0 1 2 0 1 3 0 31 0 0 11 3 3 0 0 19 6 5 0 1 0 0 22 1 10 3 1 1 0 0 1 0 1 0 1 0 0 0 0 1 9 0 1 0 0 0 5 0 1 5 0 27 1 18 13 2 0 0 0 0 0 0 0 17 0 0 0 0 0 0 0 0 0 0 1 2 0 0 27 1 0 0 0 0 4 2 41 0 3 10 12 2 11 4 0 1 0 9 2 6 0 3 21 0 0 0 7 0 6 35 0 0 0 5 4 0 6 4 0 4 9 0 0 0 1 0 0 0 1 2 1 0 10 0 0 0 0 3 0 1 0 0 0 0 1 11 0 1 0 2 2 1 2 10 1 5 56 2 2 0 0 22 0 1 1 0 29 2 0 2 30 0 0 12 5 0 7 12 0 0 6 5 0 0 4 0 14 41 0 5 60 8 7 16 0 2 4 0 2 2 2 0 90 2 19 0 1 9 0 1 0 5 170 0 0 4 0 3 0 78 0 0 13 2 0 15 0 5 58 0 0 0 0 0 8 3 0 0 12 0 0 5 12 0 1 20 5 8 5 0 16 2 55 0 1 0 6 0 14 3 0 6 0 0 13 0 0 0 1 33 0 4 2 4 3 3 1 0 3 1 1 0 1 0 47 24 2 1 25 19 2 0 1 8 0 6 9 0 0 6 1 16 4 0 0 0 0 0 6 4 0 4 0 2 0 11 3 5 15 15 3 0 6 0 0 0 0 0 1 1 0 0 0 0 0 0 0 1 0 4 41 3 2 4 6 22 1 2 5 11 0 3 0 0 4 0 0 0 0 0 0 5 0 2 3 1 1 10 9 1 31 11 0 0 0 0 0 1 0 8 5 0 308 20 2 6 17 173 4 42 1 0 39 3 1 0 0 0 3 6 0 0 0 2 0 0 0 0 24 11 6 12 0 0 9 51 0 0 0 0 14 17 0 15 0 68 0 49 29 0 1 37 0 5 2 0 0 7 0 0 1 2 0 26 3 2 0 0 17 0 0 0 2 0 6 11 19 13 8 0 3 0 0 0 1 1 0 28 0 18 6 2 1 5 0 SP95 Bacteria;Proteobacteria;Gammaproteobacteria;Pasteurellales;Pasteurellaceae;Haemophilus;pittmaniae 0 0 0 0 0 0 0 0 0 0 0 6 1339 0 4 0 0 0 0 0 0 0 0 0 0 0 0 0 0 0 0 0 0 0 0 3 0 0 0 0 0 0 0 0 0 0 0 0 0 0 0 0 0 0 0 0 0 0 0 0 0 0 0 0 0 0 0 0 0 0 0 0 0 0 0 0 0 0 0 0 0 0 0 0 0 0 0 0 0 0 0 0 0 0 0 0 0 0 14 0 0 0 0 0 0 0 0 0 0 0 0 0 0 0 0 0 0 0 0 0 0 0 0 0 0 0 0 0 0 0 0 0 0 0 2 0 0 0 0 0 0 0 0 0 0 0 0 0 0 0 0 0 0 0 0 0 0 0 0 0 0 0 0 0 0 0 0 0 0 0 0 0 0 0 0 0 0 0 0 0 0 0 0 0 0 0 0 0 0 0 0 0 0 0 0 0 0 0 0 0 0 26 0 0 0 0 0 0 0 0 0 0 0 0 0 0 0 0 0 0 0 0 0 0 0 0 0 0 0 0 0 0 0 0 0 0 0 0 0 0 0 0 0 0 0 0 0 0 0 0 0 0 0 0 0 0 0 0 0 0 0 0 0 0 0 0 0 0 0 0 0 0 0 0 0 0 0 0 0 5 0 0 0 0 22 0 0 0 0 0 0 0 1 0 1 0 3 0 0 1 0 5 0 0 0 0 1 0 1 0 0 0 0 0 0 0 0 0 0 0 4 0 0 0 0 0 0 0 0 0 0 0 0 2 0 0 0 1 0 0 0 0 0 0 0 0 0 0 0 0 1 0 0 1 0 0 0 0 0 0 0 0 0 0 0 0 1 0 0 0 0 0 0 0 1 1 0 0 0 0 0 0 0 0 0 0 0 0 0 0 7 0 0 0 0 0 0 0 0 1 0 0 8 0 0 0 0 0 0 0 1 2 0 0 0 2 0 0 0 0 0 0 0 0 0 0 0 0 5 0 0 0 0 0 0 4 0 0 0 0 0 1 0 0 0 0 0 0 1 4 0 2 0 0 0 1 0 0 0 0 0 0 0 1 0 0 0 0 1 2 0 0 1 0 0 0 0 0 0 0 0 0 0 0 3 1 1 1 0 1 0 0 0 6 2 0 0 0 0 5 2 0 0 0 0 0 0 0 0 0 0 0 0 22 0 0 0 0 1 0 0 0 0 0 0 0 0 1 2 0 1 2 0 0 0 0 0 0 0 1 0 0 0 0 0 0 0 0 0 0 0 0 0 0 0 0 0 0 0 0 0 1 0 1 1 0 0 0 0 0 0 0 0 0 0 3 2 1 0 0 0 1 0 0 0 1 0 0 1 0 0 0 0 0 0 1 0 0 0 0 0 0 2 0 0 0 0 0 0 7 1 6 2 0 0 27 0 0 0 0 0 0 0 0 4 1 0 0 0 0 0 0 0 0 0 0 0 0 0 0 0 2 0 2 1 0 0 0 0 0 0 0 0 0 0 0 0 0 0 2 1 1 0 0 0 0 0 0 0 0 877 0 0 5 0 1 0 0 0 0 0 0 3 1 0 6 26 1 0 0 0 0 0 0 0 0 0 0 0 0 0 0 0 0 0 0 0 0 0 0 0 0 0 0 0 0 0 0 0 0 0 0 0 1 0 0 0 0 0 5 0 0 0 0 0 0 0 0 0 1 0 0 3 0 0 0 0 0 0 0 2 1 3 0 0 0 1 0 0 3 2 0 0 0 0 0 0 2 0 0 0 0 0 0 0 0 0 0 0 0 1 0 0 0 0 0 0 0 0 3 0 1 0 0 0 1 0 0 0 10 0 0 0 0 0 0 0 2 0 0 0 0 1 1 13 0 2 0 0 0 0 0 0 0 0 0 0 0 0 0 8 0 1 0 2 4 0 0 0 0 0 0 0 0 0 0 0 0 0 0 8 1 0 0 5 0 0 0 0 0 0 0 0 0 3 4 0 0 0 0 0 0 0 0 0 1 0 0 1 0 0 0 1 0 0 0 0 0 8 0 0 0 0 0 2 1 0 2 0 0 0 0 0 0 0 0 0 0 0 0 0 0 0 2 3 18 0 0 0 0 0 0 0 9 0 0 0 1 4 179 1 0 0 0 0 0 3 1 0 0 0 0 0 0 0 0 0 0 0 0 0 0 1 1 0 0 1 0 0 0 0 0 0 1 0 1 0 1 3 8 0 0 0 0 0 0 1 0 0 0 0 0 0 0 2 0 0 0 0 0 1 0 1 0 0 0 0 0 0 0 0 0 0 0 0 0 0 1 10 0 0 0 0 0 0 0 0 0 0 0 0 0 0 1 40 0 10 67 0 1 298 0 0 1 0 0 1 0 0 0 42 1 70 0 0 0 0 0 0 0 2 0 0 0 0 0 1 0 0 0 67 9 1 0 1 0 0 0 0 0 0 0 0 50 2 11 12 1 8 0 4 1 21 0 0 5 0 0 0 0 0 0 0 0 0 0 0 0 0 0 80 0 0 4 0 0 1 0 700 16 14 0 0 0 0 0 0 0 0 0 0 0 3 0 2 0 1 6 6 23 3 0 0 0 11 13 0 0 0 0 1 0 0 75 0 0 6 1 0 0 5 0 3 1 1 3 0 18 32 0 1 11 35 76 1 1 32 29 95 6 0 1 4 0 2 0 0 5 0 0 0 49 48 153 15 38 106 1 0 0 0 0 0 12 0 20 2 3 0 11 61 0 0 0 0 3 1 0 0 20 0 0 0 0 0 10 0 0 1 1 0 3 2 4 0 0 0 1 0 0 30 52 0 0 0 9 0 0 0 0 0 190 0 0 0 0 0 33 0 0 0 510 0 13 7 0 2 0 0 171 2 0 0 0 0 0 21 10 0 0 18 0 13 1 1 0 14 4 0 4 0 0 25 11 0 0 908 54 0 26 2 1 0 0 0 0 6 0 0 30 0 0 0 20 110 6 53 17 0 3 24 0 0 0 7 0 1 0 3 0 6 0 0 11 0 0 0 0 0 42 6 0 2 1 0 1 0 0 4 0 30 0 1 5 0 1 6 1 0 1061 406 640 0 59 0 0 6 2 0 2 5 274 2 0 4 0 0 4 0 1 63 8 168 0 0 2 0 0 0 0 0 0 0 86 0 0 0 0 0 0 1 0 0 0 0 0 0 11 39 0 0 5 0 19 0 0 1 35 0 28 0 43 0 125 0 0 54 0 9 0 0 2 0 0 29 0 0 571 11 1 2 2 0 4 2 0 4 2 0 0 0 0 0 30 25 0 0 1 7 0 0 0 9 22 2 193 88 0 4 0 0 0 3 0 0 21 10 2 124 15 0 0 0 0 42 51 0 36 0 23 0 0 3 31 0 1068 1 0 23 0 0 0 7 5 15 0 4 61 0 1 0 5 104 52 0 17 4 0 12 0 0 1 0 0 0 0 1 0 0 8 0 2 0 0 0 1 0 0 0 0 0 0 0 0 0 0 0 0 351 0 12 3 23 24 0 0 0 0 1 0 0 1 1 2 0 580 208 4 6 0 0 2 0 0 7 4 1 0 1 0 0 32 28 2 4 18 0 0 2 0 0 3 0 61 1 0 0 3 1 0 1 2 0 2 1 0 0 0 2 0 4 0 6 1 4 2 1 3 9 0 0 17 0 2 0 0 0 2 0 0 2 0 5 102 20 0 0 35 13 2 0 1 0 0 46 278 125 7 7 78 0 0 2 0 0 0 0 1168 512 0 0 0 0 1 3 1 55 1 15 0 12 20 0 79 0 0 1 4 67 0 0 0 0 0 0 0 0 8 0 0 35 1 11 3 11 5 0 1 9 89 273 16 18 196 5 1633 0 1 0 0 0 1 0 0 104 0 0 0 0 0 6 0 2 12 83 29 35 55 4 0 7 0 0 0 0 422 0 0 81 0 0 0 5 0 0 2 36 0 0 18 127 0 1 0 0 0 59 0 16 23 68 0 10 0 3 0 0 24 7 10 0 0 0 0 0 1 0 0 0 0 0 0 0 0 0 0 4 1 0 3 1 0 3 0 2 0 0 0 0 92 0 0 1 0 6 0 0 9 0 0 133 165 0 23 1 4 1 0 0 0 0 0 0 15 0 0 127 28 128 128 100 0 31 0 SP96 Bacteria;Bacteroidetes;Bacteroidia;Bacteroidales;Prevotellaceae;Prevotella;nigrescens 0 0 0 0 0 4 0 0 1 0 0 0 0 0 0 0 0 0 1 2 0 0 0 61 0 0 0 0 16 21 0 0 46 458 0 0 0 18 0 0 0 0 1 0 0 11 0 0 7 0 0 0 1 1 0 0 11 0 1 0 0 0 0 0 0 0 0 2 1 2 3 0 0 1 0 0 0 3 0 0 2 0 0 2 8 0 0 5 6 8 1 0 4 47 2 0 0 2 0 3 2 1 0 0 0 0 0 3 6 0 0 6 2 18 0 0 0 0 9 0 0 9 1 2 0 0 2 0 62 0 7 12 0 1 5 4 8 0 0 1 0 0 0 32 0 1 10 15 0 4 2 0 74 0 1 0 1 0 4 0 1 2 1 0 0 0 20 0 1 0 0 0 10 3 0 0 0 0 0 0 0 0 0 29 0 0 0 0 0 0 1 0 0 3 3 8 3 0 0 0 7 0 4 5 0 17 0 7 0 0 3 0 6 0 0 1 13 3 0 0 0 13 0 0 6 0 0 0 1 38 0 0 5 1 0 0 20 7 4 0 0 0 114 1 2 15 3 0 0 0 11 19 0 2 0 0 0 0 1 16 4 10 0 3 7 0 0 2 0 0 0 0 1 0 0 0 26 1 2 0 9 9 0 142 0 0 0 1 0 3 38 0 0 0 116 0 5 0 0 7 9 0 130 20 0 0 16 0 0 0 0 0 0 0 0 0 0 0 0 0 0 0 0 0 0 0 0 0 0 0 1 1 0 0 0 0 0 0 0 0 0 0 0 19 0 16 0 0 0 0 0 0 0 0 0 0 0 1 0 0 0 10 0 0 0 0 0 0 0 0 0 0 0 18 0 0 0 0 0 17 0 0 4 0 0 0 0 37 1 0 0 0 0 2 0 4 0 0 0 25 0 0 0 0 0 0 0 23 0 0 0 26 0 0 0 0 1 0 23 0 8 1 1 10 0 29 0 0 0 0 0 0 103 1 0 0 0 0 0 0 1 0 0 0 0 0 0 0 47 0 0 0 0 0 0 1 0 5 0 21 0 0 0 0 0 0 0 0 0 0 8 0 0 1 0 0 11 5 0 0 4 0 0 0 3 6 7 4 0 5 3 0 0 107 14 0 0 0 0 1 33 0 0 0 0 0 0 0 2 0 85 0 0 0 0 0 0 6 0 0 0 0 0 0 0 1 0 0 0 5 0 0 0 0 0 0 5 23 0 158 0 2 0 0 0 0 1 141 0 0 12 3 0 0 4 0 0 0 0 51 0 13 0 14 3 0 0 0 0 1 0 0 0 0 0 8 0 0 0 0 0 1 0 0 0 0 11 1 0 0 6 0 0 0 0 33 0 0 0 1 0 0 0 20 0 0 0 0 0 0 0 0 0 0 0 0 2 0 7 0 0 0 0 0 0 0 0 0 2 0 0 0 0 0 2 5 14 0 5 3 0 14 0 1 0 0 0 0 1 0 0 0 0 8 0 0 38 0 0 1 1 0 178 17 0 0 3 0 0 0 0 0 1 0 0 0 33 0 0 1 0 15 6 0 0 0 0 0 0 11 0 0 1 0 0 1 0 0 0 0 2 0 4 12 0 0 0 0 13 1 0 0 56 5 0 0 0 0 0 0 0 0 0 0 0 0 20 23 70 0 0 0 0 4 0 197 2 9 34 1 0 35 2 0 0 0 0 2 13 0 1 0 1 0 56 6 1 0 0 10 1 20 0 0 0 0 3 9 0 98 0 0 36 7 0 0 0 0 6 87 0 0 1 0 0 0 0 0 0 0 0 0 0 9 0 8 5 0 0 0 0 0 0 0 0 0 0 0 3 0 0 0 0 0 0 0 0 0 0 0 2 7 0 0 0 0 0 0 16 0 0 0 0 0 0 0 0 0 0 0 0 0 0 0 2 0 0 0 0 0 0 0 0 0 2 0 0 243 0 0 0 0 2 0 0 0 0 1 0 0 4 0 0 1 4 0 65 0 0 0 0 26 0 0 0 0 0 0 0 0 0 0 0 0 0 0 0 0 7 0 7 0 0 0 0 0 0 1 0 0 3 0 0 0 0 0 0 8 0 0 0 0 0 0 0 0 0 11 1 0 2 0 9 0 0 0 0 0 1 51 2 0 6 5 0 5 14 0 0 0 0 0 5 3 0 36 6 0 0 0 0 0 0 57 0 1 0 0 4 0 0 0 0 66 21 0 131 115 0 5 0 0 29 3 0 29 0 44 0 14 7 0 2 21 0 2 0 0 0 0 1 0 0 0 0 17 0 0 0 0 0 0 0 0 0 0 0 0 0 0 0 0 0 7 0 0 19 1 0 0 2 77 0 21 9 0 7 0 50 2 0 0 0 22 0 0 37 33 5 0 27 0 0 0 0 0 1 2 0 0 0 0 0 0 0 608 0 2 0 0 150 3 0 0 0 0 0 1 0 0 0 1 0 0 0 0 0 0 0 1 1 12 0 0 0 0 0 0 0 0 0 0 16 0 0 7 0 0 0 1 0 0 0 0 0 2 0 0 0 0 0 0 0 0 0 0 0 0 0 4 5 0 28 1 0 0 7 13 0 4 10 0 0 0 0 0 0 52 1 0 34 0 0 0 0 0 1 0 1 0 0 8 0 0 5 0 0 0 0 2 0 63 0 0 2 0 0 0 0 0 0 185 1 0 18 26 0 0 0 0 0 0 79 16 2 0 18 9 0 28 0 0 0 0 0 0 0 73 2 0 112 0 0 10 0 0 0 2 7 0 0 74 8 0 0 0 0 0 0 0 0 23 0 0 270 54 0 1 0 0 0 1 29 0 3 0 0 409 0 0 0 0 0 2 0 0 27 0 0 1 0 0 0 105 0 0 9 40 0 2 0 0 0 1 15 0 125 3 0 15 0 0 0 1 0 0 138 0 0 0 11 31 0 636 0 0 89 0 0 0 1 1 0 1 0 0 0 0 0 2 1 0 0 7 0 0 0 0 0 0 0 0 0 1 0 11 0 0 0 0 0 0 0 123 0 16 0 0 305 3 2 0 10 0 0 0 10 0 0 0 0 0 0 0 3 0 0 0 0 34 1 0 152 0 434 26 0 0 0 0 0 0 0 0 416 6 0 0 26 0 1 0 0 0 0 0 0 0 0 0 0 0 0 0 0 1890 0 1 0 0 32 0 0 238 2 0 0 0 0 0 0 0 17 0 208 11 0 0 0 0 0 0 0 0 0 0 0 46 1 0 1562 0 0 0 0 1 0 17 0 0 29 18 0 11 11 0 0 2 15 0 1 66 0 172 0 0 1 1 56 0 0 0 0 0 0 54 0 0 4 0 0 241 0 5 0 0 0 0 0 0 0 0 16 0 0 1 0 0 0 304 0 0 0 0 0 1 0 0 0 1 0 27 0 0 0 1177 5 0 0 10 1 0 0 0 0 175 7 0 0 6 0 0 11 1 0 3 16 0 0 8 6 0 31 2 0 95 0 0 0 0 24 0 225 0 2 0 0 0 0 0 1 262 0 1 0 0 0 0 3 0 0 0 0 0 201 1 0 0 37 0 0 0 0 1 15 0 3 25 0 0 3 0 0 21 0 0 24 1 6 0 1 43 0 9 60 0 0 0 0 0 1 2 0 0 0 0 0 0 1 0 5 0 0 35 0 1 0 0 0 0 13 0 0 0 8 0 0 1 0 0 0 0 0 441 26 0 0 0 0 0 0 1 190 0 5 0 0 1 0 0 4 0 0 0 0 0 0 0 0 0 0 1 0 0 1 23 0 0 0 0 0 2 0 134 0 0 0 24 1 0 1 0 0 0 0 0 0 0 0 4 0 1 0 0 131 2 3 45 0 0 2 1 0 94 3 0 30 0 0 0 0 2 0 8 0 0 0 0 0 0 9 0 0 0 0 0 12 0 7 0 0 278 0 0 0 0 0 0 249 4 0 55 1 2 0 0 0 0 0 0 0 25 3 0 49 108 0 3 1 0 18 0 0 50 78 0 2 0 0 24 39 0 9 0 1029 0 15 0 0 12 32 0 2 0 0 0 30 1 0 7 0 0 0 0 0 0 14 65 0 0 0 0 0 1 0 0 0 0 0 3 9 0 0 2 1 0 9 1 0 0 0 0 0 0 SP98 Bacteria;Actinobacteria;Actinomycetia;Actinomycetales;Actinomycetaceae;Actinomyces;oris 2 9 177 18 150 84 1 33 93 230 6 509 522 23 6 54 24 131 11 14 40 24 29 23 76 26 181 22 388 193 6 2 4 3 11 10 9 25 0 6 2 22 6 10 10 0 405 210 25 14 1 10 8 65 3 0 8 28 11 20 39 4 10 166 1 48 41 45 9 4 24 53 12 14 0 3 4 4 5 59 4 9 9 9 1 2 20 10 75 6 37 6 251 24 206 12 96 30 2 22 76 276 1 21 93 3 8 18 6 81 42 52 34 13 9 0 2 80 42 6 87 44 0 49 15 0 1 5 2 452 16 2 55 29 1 4 0 39 90 7 96 113 2337 62 61 2 16 30 12 10 16 4 56 7 106 18 3 92 34 5 55 31 1 147 24 13 201 11 62 930 70 12 7 137 15 13 13 12 2 168 17 15 20 42 10 28 9 0 0 7 12 18 9 23 2 12 0 2 0 4 143 4 4 0 3 51 59 28 44 2 1 34 8 26 34 14 227 19 18 18 347 3 57 43 0 13 2 51 30 5 72 22 50 3 22 3 4 1 9 2 24 1 3 7 25 193 15 22 6 31 3 2 3 1 4 57 145 20 75 9 64 11 17 6 22 227 5 49 0 0 0 0 0 0 0 0 0 0 0 0 0 0 0 0 0 0 0 0 0 0 0 0 0 0 0 0 0 0 0 0 0 0 0 0 0 0 0 0 0 0 0 0 0 0 0 0 0 0 0 0 0 0 0 0 0 0 0 0 0 0 0 0 0 0 0 0 0 0 0 0 0 0 0 0 0 0 0 0 0 0 0 0 0 0 0 0 0 0 0 0 0 0 0 0 0 0 0 0 0 0 0 0 0 0 0 0 0 0 0 0 0 0 0 0 0 0 0 0 0 0 0 0 0 0 0 0 0 0 0 0 0 0 0 0 0 0 0 0 0 0 0 0 0 0 0 0 0 0 0 0 0 0 0 0 0 0 0 0 0 0 0 0 0 0 0 0 0 0 0 0 0 0 0 0 0 0 0 0 0 0 0 0 0 0 0 0 0 0 0 0 0 0 0 0 0 0 0 0 0 0 0 0 0 0 0 0 0 0 0 0 0 0 0 0 0 0 0 0 0 0 0 0 0 0 0 0 0 0 0 0 0 0 0 0 0 0 0 0 0 0 0 0 0 0 0 0 0 0 0 0 0 0 0 0 0 0 0 0 0 0 0 0 0 0 0 0 0 0 0 0 0 0 0 0 0 0 0 0 0 0 0 0 0 0 0 0 0 0 0 0 0 0 0 0 0 0 0 0 0 0 0 0 0 0 0 0 0 0 0 0 0 0 0 0 0 0 0 0 0 0 0 0 0 0 0 0 0 0 0 0 0 0 0 0 0 0 0 0 0 0 0 0 0 0 0 0 0 0 0 0 0 0 0 0 0 0 0 0 0 0 0 0 0 0 0 0 0 0 0 0 0 0 0 0 0 0 0 0 0 0 0 0 0 0 0 0 0 0 0 0 0 0 0 0 0 0 0 0 0 0 0 0 0 0 0 0 0 0 0 0 0 0 0 0 0 0 0 0 0 0 0 0 0 0 0 0 0 0 0 0 0 0 0 0 0 0 0 0 0 0 0 0 0 0 0 0 0 0 0 0 0 0 0 0 0 0 0 0 0 0 0 0 0 0 0 0 0 0 0 0 0 0 0 0 0 0 0 0 0 0 0 0 0 0 0 0 0 0 0 0 0 0 0 0 0 0 0 0 0 0 0 0 0 0 0 0 0 0 0 0 0 0 0 0 0 0 0 0 0 0 0 0 0 0 0 0 0 0 0 0 0 0 0 0 0 0 0 0 0 0 0 0 0 0 0 0 0 0 0 0 0 0 0 0 0 0 0 0 0 0 0 0 0 0 0 0 0 0 0 0 0 0 0 0 0 0 0 0 0 0 0 0 0 0 0 0 0 0 0 0 0 0 0 0 0 0 0 0 0 0 0 0 0 0 0 0 0 0 0 0 0 0 0 0 0 0 0 0 0 0 0 0 0 0 0 0 0 0 0 0 0 0 0 0 0 0 0 0 0 0 0 0 0 0 0 0 0 0 0 0 0 0 0 0 0 0 0 0 0 0 0 0 0 0 0 0 0 0 0 0 0 0 0 0 0 0 0 0 0 0 0 0 0 0 0 0 0 0 0 0 0 0 0 0 0 0 0 0 0 0 0 0 0 0 0 0 0 0 0 0 0 0 0 0 0 0 0 0 0 0 0 0 0 0 0 0 0 0 0 0 0 0 0 0 0 0 0 0 0 0 0 0 0 0 0 0 0 0 0 0 0 0 0 0 0 0 0 0 0 0 0 0 0 0 0 0 0 0 0 0 0 0 0 0 0 0 0 0 0 0 0 0 0 0 0 0 0 0 0 0 0 0 0 0 0 0 0 0 0 0 0 0 0 0 0 0 0 0 0 0 0 0 0 0 0 0 0 0 0 0 0 0 0 0 0 0 0 0 0 0 0 0 0 0 0 0 0 0 0 0 0 0 0 0 0 0 0 0 0 0 0 0 0 0 0 0 0 0 0 0 0 0 0 0 0 0 0 0 0 0 0 0 0 0 0 0 0 0 0 0 0 0 0 0 0 0 0 0 0 0 0 0 0 0 0 0 0 0 0 0 0 0 0 0 0 0 0 0 0 0 0 0 0 0 0 0 0 0 0 0 0 0 0 0 0 0 0 0 0 0 0 0 0 0 0 0 0 0 0 0 0 0 0 0 0 0 0 0 0 0 0 0 0 0 0 0 0 0 0 0 0 0 0 0 0 0 0 0 0 0 0 0 0 0 0 0 0 0 0 0 0 0 0 0 0 0 0 0 0 0 0 0 0 0 0 0 0 0 0 0 0 0 0 0 0 0 0 0 0 0 0 0 0 0 0 0 0 0 0 0 0 0 0 0 0 0 0 0 0 0 0 0 0 0 0 0 0 0 0 0 0 0 0 0 0 0 0 0 0 0 0 0 0 0 0 0 0 0 0 0 0 0 0 0 0 0 0 0 0 0 0 0 0 0 0 0 0 0 0 0 0 0 0 0 0 0 0 0 0 0 0 0 0 0 0 0 0 0 0 0 0 0 0 0 0 0 0 0 0 0 0 0 0 0 0 0 0 0 0 0 0 0 0 0 0 0 0 0 0 0 0 0 0 0 0 0 0 0 0 0 0 0 0 0 0 0 0 0 0 0 0 0 0 0 0 0 0 0 0 0 0 0 0 0 0 0 0 0 0 0 0 0 0 0 0 0 0 0 0 0 0 0 0 0 0 0 0 0 0 0 0 0 0 0 0 0 0 0 0 0 0 0 0 0 0 0 0 0 0 0 0 0 0 0 0 0 0 0 0 0 0 0 0 0 0 0 0 0 0 0 0 0 0 0 0 0 0 0 0 0 0 0 0 0 0 0 0 0 0 0 0 0 0 0 0 0 0 0 0 0 0 0 0 0 0 0 0 0 0 0 0 0 0 0 0 0 0 0 0 0 0 0 0 0 0 0 0 0 0 0 0 0 0 0 0 0 0 0 0 0 0 0 0 0 0 0 0 0 0 0 0 0 0 0 0 0 0 0 0 0 0 0 0 0 0 0 0 0 0 0 0 0 0 0 0 0 0 0 0 0 0 0 0 0 0 0 0 0 0 0 0 0 0 0 0 0 0 0 0 0 0 0 0 0 0 0 0 0 0 0 0 0 0 0 0 0 0 0 0 0 0 0 0 0 0 0 0 0 0 0 0 0 0 0 0 0 0 0 0 0 0 0 0 0 0 0 0 0 0 0 0 0 0 0 0 0 0 0 0 0 0 0 0 0 0 0 0 0 0 0 0 0 0 0 0 0 0 0 0 0 0 0 0 0 0 0 0 0 0 0 0 0 0 0 0 0 0 0 0 0 0 0 0 0 0 0 0 0 0 0 0 0 0 0 0 0 0 0 0 0 0 0 0 0 0 0 0 0 0 0 0 0 0 0 0 0 0 0 0 0 0 0 0 0 0 0 0 0 0 0 0 0 0 0 0 0 0 0 0 0 0 0 0 0 0 0 0 0 0 0 0 0 0 0 0 0 0 0 0 0 0 0 0 0 0 0 0 0 0 0 0 0 0 0 SP99 Bacteria;Bacteroidetes;Bacteroidia;Bacteroidales;Prevotellaceae;Prevotella;saccharolytica 0 1 5 0 0 5 1 0 0 0 0 16 15 0 5 0 0 0 2 1 0 0 1 5 1 0 2 0 12 16 0 0 23 1 3 0 0 0 0 0 0 0 0 0 0 2 0 0 13 0 3 0 0 0 0 0 0 0 0 3 0 0 0 0 0 0 1 0 15 0 7 3 0 0 0 0 0 0 0 2 0 0 0 0 0 0 0 2 1 0 4 0 8 18 0 0 1 6 1 0 0 1 0 0 7 0 0 18 0 2 0 0 0 5 0 0 0 0 1 0 0 1 0 0 0 0 0 0 0 18 1 18 2 0 2 4 0 0 0 0 0 0 13 1 0 3 6 0 0 0 2 0 11 0 0 0 0 0 1 0 0 2 0 0 0 0 0 0 5 0 0 0 0 2 0 0 0 1 0 0 0 0 0 1 0 0 0 0 0 0 0 0 0 0 0 0 0 0 0 1 2 0 0 0 0 0 1 0 4 0 0 0 0 0 0 0 1 0 0 0 1 1 0 10 0 2 0 3 0 0 0 0 6 2 0 4 0 0 1 4 0 0 1 1 3 0 0 0 0 0 0 0 0 2 0 0 0 0 0 0 0 0 2 2 1 0 0 0 0 30 0 0 2 0 6 0 18 4 98 0 13 15 0 35 3 0 3 0 0 1 80 0 7 0 25 5 8 0 0 1 0 0 44 11 0 0 2 0 4 0 0 0 0 0 0 0 0 12 1 0 0 7 9 0 4 1 0 0 0 0 0 2 0 0 0 0 0 0 0 0 0 0 0 7 0 0 0 2 0 0 0 0 0 3 0 0 0 0 0 0 0 0 0 0 0 0 0 0 4 0 9 0 0 9 0 0 0 0 0 0 0 0 10 8 0 0 14 6 0 0 0 0 0 0 0 0 4 0 0 3 0 0 0 2 0 0 0 8 0 5 1 29 0 44 0 0 1 0 28 0 0 0 0 3 0 12 0 0 0 0 0 0 13 14 0 0 20 0 0 0 2 0 0 0 0 0 0 0 37 2 19 0 6 0 0 0 0 0 0 89 41 8 0 6 0 0 0 45 2 0 2 0 0 2 0 0 3 0 0 9 5 0 0 0 34 7 14 12 3 14 10 0 0 32 15 0 0 0 0 3 10 0 0 0 0 0 0 0 0 0 7 0 0 0 0 0 0 1 0 0 0 0 0 0 6 2 0 1 0 2 0 0 47 0 2 0 1 29 0 8 0 1 12 1 2 0 8 19 0 0 13 0 0 1 0 0 0 5 0 23 0 7 0 59 52 65 0 0 0 2 1 0 0 2 0 2 12 0 0 0 0 0 0 0 0 0 7 0 0 0 0 0 0 0 0 5 0 0 0 0 0 16 0 33 1 0 0 0 0 6 0 2 1 0 0 0 14 0 2 0 0 0 0 0 2 19 66 0 0 13 27 2 0 30 9 11 0 0 6 1 0 0 5 59 3 0 0 11 0 0 5 0 0 2 5 1 24 0 0 0 0 0 54 33 8 0 0 0 7 0 0 0 0 1 0 0 7 0 0 0 0 7 17 0 0 3 12 0 11 4 6 0 0 3 6 32 0 0 0 0 50 4 0 0 0 0 0 0 0 9 1 0 22 0 0 6 0 0 0 0 0 0 8 0 0 0 15 19 17 0 26 0 0 0 1 0 1 3 57 0 0 24 59 0 7 0 0 4 15 0 13 0 27 0 11 10 4 3 0 41 1 37 64 0 1 0 22 10 0 20 1 4 13 19 0 0 6 0 1 40 4 0 0 0 0 0 9 0 0 0 0 8 0 1 0 1 9 0 0 0 0 0 1 0 0 1 0 0 11 0 0 0 0 0 0 33 0 2 1 0 0 0 0 1 0 0 0 3 3 0 0 0 0 0 0 0 0 15 0 0 18 0 0 7 0 0 0 0 1 0 0 1 0 0 53 0 13 0 0 0 0 0 4 0 0 0 0 73 12 0 0 22 3 5 80 0 72 0 16 0 0 3 0 9 0 0 0 0 30 0 0 0 0 0 0 0 0 0 11 0 8 0 7 0 0 0 0 0 0 0 0 0 0 0 44 1 0 0 0 0 0 10 0 22 0 0 0 8 3 0 11 0 4 0 0 1 0 15 2 3 6 0 0 2 0 1 1 0 1 19 7 0 31 22 1 7 14 1 0 0 0 0 0 28 0 4 0 0 6 0 0 29 0 1 27 0 16 3 0 3 0 0 27 2 0 0 0 10 25 14 7 0 0 10 0 5 5 0 0 0 0 1 0 0 0 15 0 0 0 0 0 8 0 0 89 0 0 0 0 0 0 0 0 0 0 0 6 0 0 0 0 4 0 7 4 0 0 1 3 0 8 2 0 2 0 0 4 0 0 0 1 2 0 0 0 0 20 1 0 1 15 0 0 0 2 27 0 0 2 0 1 0 0 0 0 1 0 0 0 0 0 0 0 0 0 6 0 0 2 0 0 17 2 0 0 0 0 0 0 1 0 0 4 0 0 1 0 0 0 0 0 0 0 0 0 3 0 0 0 6 0 0 35 1 2 0 4 0 0 2 0 0 1 0 0 0 0 0 0 1 0 0 0 0 0 0 0 20 0 0 15 0 0 0 3 0 0 0 1 0 0 0 0 0 1 0 0 0 0 9 0 0 0 0 0 1 0 0 0 0 0 39 0 0 9 8 0 0 0 1 0 0 5 13 0 0 7 21 0 6 0 0 0 0 0 0 0 5 1 0 5 1 0 0 0 0 0 5 10 0 0 3 0 0 0 0 0 0 0 22 0 1 4 0 31 14 0 0 1 0 0 0 35 0 0 0 0 18 6 0 0 0 0 2 7 1 1 1 0 2 5 0 0 4 0 0 7 6 0 0 0 0 0 4 4 0 1 4 0 1 0 0 0 3 2 0 27 0 0 0 7 8 0 5 0 0 5 0 0 2 6 2 0 10 0 2 23 1 0 31 2 2 0 0 1 0 0 0 0 0 1 0 0 1 0 0 0 0 0 15 0 0 88 10 6 5 0 0 44 12 1 0 17 0 0 20 9 0 0 0 0 0 0 13 0 0 0 1 0 3 0 0 13 0 12 1 0 0 1 0 14 5 1 0 39 1 6 1 8 0 0 2 0 0 0 0 0 0 3 3 0 2 8 0 0 10 0 1 0 0 1 0 0 18 1 0 0 0 0 0 0 0 0 0 2 6 0 10 0 0 0 0 0 1 2 0 0 3 1 0 19 7 0 0 0 0 0 1 0 0 6 0 0 1 1 0 0 2 13 0 2 13 0 2 3 0 2 7 73 0 0 0 0 3 0 3 1 0 0 2 0 6 0 0 0 0 0 0 0 0 0 2 3 0 0 0 0 0 0 28 0 0 12 1 0 0 1 0 2 2 0 4 28 2 14 69 1 0 0 3 5 0 0 0 0 3 1 0 1 2 2 0 5 0 0 5 6 0 0 3 0 0 20 1 0 6 14 0 1 0 6 4 17 0 4 0 0 0 3 1 0 26 4 5 0 3 1 0 1 0 1 14 0 0 17 0 0 0 2 0 0 2 0 0 5 0 1 30 0 0 0 0 0 0 11 0 1 3 3 0 2 12 0 2 1 0 1 1 0 0 4 3 0 0 0 0 0 11 0 0 3 0 0 3 1 0 0 0 6 0 0 0 0 0 2 0 0 1 0 0 0 3 0 11 13 0 0 36 35 0 0 1 11 0 0 0 0 0 0 0 0 6 0 0 0 0 0 3 0 0 2 0 0 0 1 18 0 22 0 0 0 0 0 0 0 0 0 0 1 0 0 0 0 5 0 0 0 0 0 1 0 0 2 0 0 0 0 1 0 0 0 0 0 9 1 0 0 1 0 0 0 0 0 7 0 0 2 0 0 8 13 1 0 0 0 0 0 0 1 0 0 11 10 0 0 0 14 0 7 1 0 10 0 0 0 0 0 0 0 0 0 0 0 0 2 31 0 5 0 8 4 0 0 25 4 0 0 0 0 8 8 0 2 0 15 0 8 4 0 0 9 0 0 0 0 0 1 0 0 7 1 0 0 0 1 0 1 14 0 0 0 0 0 0 0 0 1 1 0 1 0 0 0 0 1 0 7 0 0 0 4 0 1 0 SP993 Bacteria;Proteobacteria;Gammaproteobacteria;Enterobacterales;Enterobacteriaceae;Enterobacter;cancerogenus 0 2 0 0 0 0 0 0 0 1 0 0 0 0 10914 0 0 0 1 0 0 0 0 0 0 0 0 0 2 0 0 0 0 0 0 0 0 0 0 0 0 0 0 0 0 0 0 0 0 0 0 0 0 0 0 0 0 0 0 0 0 0 0 0 0 0 0 0 0 0 0 0 0 0 0 0 0 0 0 0 0 0 0 0 0 0 0 0 0 0 0 0 0 0 0 0 0 0 0 0 0 0 0 0 0 0 0 0 0 0 0 0 0 0 0 0 0 0 0 0 0 0 0 0 0 0 0 0 0 0 0 0 0 0 0 0 0 0 0 0 0 0 0 0 0 0 0 0 0 0 0 0 0 0 0 0 0 0 0 0 0 0 0 0 0 0 0 0 0 0 0 0 0 0 0 0 0 0 0 0 0 0 0 0 0 0 0 0 0 0 0 0 0 0 0 0 0 0 0 0 0 0 0 0 0 0 0 0 0 0 0 0 0 0 0 0 0 0 0 0 3 0 0 0 0 0 0 0 0 0 0 0 0 0 0 0 0 0 0 0 0 0 0 0 0 0 0 0 0 1 0 0 0 0 0 0 0 0 0 0 0 0 0 1 0 0 0 0 0 0 0 0 0 0 0 0 0 0 0 0 0 0 0 0 0 0 0 0 0 0 0 0 0 0 0 0 0 0 0 0 0 0 0 0 0 0 0 0 0 0 0 0 0 0 0 0 0 0 0 0 0 0 0 0 0 0 0 0 0 0 0 0 0 0 0 0 0 0 0 0 0 0 0 0 0 0 0 0 0 0 0 0 0 0 0 0 0 0 0 0 0 0 0 0 0 0 0 0 0 0 0 0 0 0 0 0 0 0 0 0 0 0 0 0 0 0 0 0 0 0 0 0 0 0 0 0 0 0 0 0 0 0 0 0 0 0 0 0 0 0 0 0 0 0 0 0 0 0 0 0 0 0 0 0 0 0 0 0 0 0 0 0 0 0 0 0 0 0 0 0 0 0 0 0 0 0 0 0 0 0 0 0 0 0 0 0 0 0 0 0 0 0 0 0 0 0 0 0 0 0 0 0 0 0 0 0 0 0 0 0 0 0 0 0 0 0 0 0 0 0 0 0 0 0 0 0 0 0 0 0 0 0 0 0 0 0 0 0 0 0 0 0 0 0 0 0 0 0 0 0 0 0 0 0 0 0 0 0 0 0 0 0 0 0 0 0 0 0 0 0 0 0 0 0 0 0 0 0 0 0 0 0 0 0 0 0 0 0 0 0 0 0 0 0 0 0 0 0 0 0 0 0 0 0 0 0 0 0 0 0 0 0 0 0 0 0 0 0 0 0 0 0 0 0 0 0 0 0 0 0 0 0 0 0 0 0 0 0 0 0 0 0 0 0 0 0 0 0 0 0 0 0 0 0 0 0 0 0 0 0 0 0 0 0 0 0 0 0 0 0 0 0 0 0 0 0 0 0 0 0 0 0 0 0 0 0 0 0 0 0 0 0 0 0 0 0 0 0 0 0 0 0 0 0 0 0 0 0 0 0 0 0 0 0 0 0 0 0 0 0 0 0 0 0 0 0 0 0 0 0 0 0 0 0 0 0 0 0 0 0 0 0 0 0 0 0 0 0 0 0 0 0 0 0 0 0 0 0 0 0 0 0 0 0 0 0 0 0 0 0 0 0 0 0 0 0 0 0 0 0 0 0 0 0 0 0 0 0 0 0 0 0 0 0 0 0 0 0 0 0 0 0 0 0 0 0 0 0 0 0 0 0 0 0 0 0 0 0 0 0 0 0 0 0 0 0 0 0 0 0 0 0 0 0 0 0 0 0 0 0 0 0 0 0 0 0 0 0 0 0 0 0 0 0 0 0 0 0 0 0 0 0 0 0 0 0 0 0 0 0 0 0 0 0 0 0 0 0 0 0 0 0 0 0 0 0 0 0 0 0 0 0 0 0 0 0 0 0 0 0 0 0 0 0 0 0 0 0 0 0 0 0 0 0 0 0 0 0 0 0 0 0 0 0 0 0 0 0 0 0 0 0 0 0 0 0 0 0 0 0 0 0 0 0 0 0 0 0 0 0 0 0 0 0 0 0 0 0 0 0 0 0 0 0 0 0 0 0 0 0 0 0 0 0 0 0 0 0 0 0 0 0 0 0 0 0 0 0 0 0 0 0 0 0 0 0 0 0 0 0 0 0 0 0 0 0 0 0 0 0 0 0 0 0 0 0 0 0 0 0 0 0 0 0 0 0 0 0 0 0 0 0 0 0 0 0 0 0 0 0 0 0 0 0 0 0 0 0 0 0 0 0 0 0 0 0 0 0 0 0 0 0 0 0 0 0 0 0 0 0 0 0 0 0 0 0 0 0 0 0 0 0 0 0 0 0 0 0 0 0 0 0 0 0 0 0 0 0 0 0 0 0 0 0 0 0 0 0 0 0 0 0 0 0 0 0 0 0 0 0 0 0 0 0 0 0 0 0 0 0 0 0 0 0 0 0 0 0 0 0 0 0 0 0 0 0 0 0 0 0 0 0 0 0 0 0 0 0 0 0 0 0 0 0 0 0 0 0 0 0 0 0 0 0 0 0 0 0 0 0 0 0 0 0 0 0 0 0 0 0 0 0 0 0 0 0 0 0 0 0 0 0 0 0 0 0 0 0 0 0 0 0 0 0 0 0 0 0 0 0 0 0 0 0 0 0 0 0 0 0 0 0 0 0 0 0 0 0 0 0 0 0 0 0 0 0 0 0 0 0 0 0 0 0 0 0 0 0 0 0 0 0 0 0 0 0 0 0 0 0 0 0 0 0 0 0 0 0 0 0 0 0 0 0 0 0 0 0 0 0 0 0 0 0 0 0 0 0 0 0 0 0 0 0 0 0 0 0 0 0 0 0 0 0 0 0 0 0 0 0 0 0 0 0 0 0 0 0 0 0 0 0 0 0 0 0 0 0 0 0 0 0 0 0 0 0 0 0 0 0 0 0 0 0 0 0 0 0 0 0 0 0 0 0 0 0 0 0 0 0 0 0 0 0 0 0 0 0 0 0 0 0 0 0 0 0 0 0 0 0 0 0 0 0 0 0 0 0 0 0 0 0 0 0 0 0 0 0 0 0 0 0 0 0 0 0 0 0 0 0 0 0 0 0 0 0 0 0 0 0 0 0 0 0 0 0 0 0 0 0 0 0 0 0 0 0 0 0 0 0 0 0 0 0 0 0 0 0 0 0 0 0 0 0 0 0 0 0 0 0 0 0 0 0 0 0 0 0 0 0 0 0 0 0 0 0 0 0 0 0 0 0 0 0 0 0 0 0 0 0 0 0 0 0 0 0 0 0 0 0 0 0 0 0 0 0 0 0 0 0 0 0 0 0 0 0 0 0 0 0 0 0 0 0 0 0 0 0 0 0 0 0 0 0 0 0 0 0 0 0 0 0 0 0 0 0 0 0 0 0 0 0 0 0 0 0 0 0 0 0 0 0 0 0 0 0 0 0 0 0 0 0 0 0 0 0 0 0 0 0 0 0 0 0 0 0 0 0 0 0 0 0 0 0 0 0 0 0 0 0 0 0 0 0 0 0 0 0 0 0 0 0 0 0 0 0 0 0 0 0 0 0 0 0 0 0 0 0 0 0 0 0 0 0 0 0 0 0 0 0 0 0 0 0 0 0 0 0 0 0 0 0 0 0 0 0 0 0 0 0 0 0 0 0 0 0 0 0 0 0 0 0 0 0 0 0 0 0 0 0 0 0 0 0 0 0 0 0 0 0 0 0 0 0 0 0 0 0 0 0 0 0 0 0 0 0 0 0 0 0 0 0 0 0 0 0 0 0 0 0 0 0 0 0 0 0 0 0 0 0 0 0 0 0 0 0 0 0 0 0 0 0 0 0 0 0 0 0 0 0 0 0 0 0 0 0 0 0 0 0 0 0 0 0 0 0 0 0 0 0 0 0 0 0 0 0 0 0 0 0 0 0 0 0 0 0 0 0 0 0 0 0 0 0 0 0 0 0 0 0 0 0 0 0 0 0 0 0 0 0 0 0 0 0 0 0 0 0 0 0 0 0 0 0 0 0 0 0 0 0 0 0 0 0 0 0 0 0 0 0 0 0 0 0 SPN103 Bacteria;Firmicutes;Bacilli;Lactobacillales;Streptococcaceae;Streptococcus;salivarius_nov_94.747% 33 99 37 218 9 9 15 13 4 68 71 8 13 13 0 249 31 30 17 24 54 47 57 24 118 197 33 380 0 3 30 92 3 93 93 70 170 3 87 11 4 0 3 68 79 7 24 342 21 44 69 109 173 68 37 94 92 70 1 76 68 4 40 0 44 4 6 23 7 6 41 11 37 143 344 3 113 78 1 61 41 8 146 31 22 211 89 166 31 15 0 152 0 0 91 3 0 4 6 236 359 14 84 61 2 7 54 0 22 20 43 29 77 14 9 8 53 13 14 21 180 104 231 8 64 157 51 45 16 3 28 1 271 89 39 0 30 271 3 9 29 0 19 48 1 14 53 4 27 20 96 146 52 281 19 101 26 76 119 168 9 0 23 22 25 156 14 34 7 59 0 34 115 49 154 198 126 134 2 25 172 85 23 45 61 185 88 21 0 41 48 10 80 66 116 83 23 28 44 29 1 8 75 8 27 18 0 0 9 1 49 51 71 98 26 18 2 173 3 35 4 46 11 42 82 8 8 7 5 11 83 1 49 20 22 6 79 82 6 2 0 4 1 17 0 69 55 13 42 204 29 2 17 23 269 178 54 72 70 18 78 92 29 38 88 325 65 75 0 0 0 0 0 0 0 0 0 0 0 0 0 0 0 0 0 0 0 0 0 0 0 0 0 0 0 0 0 0 0 0 0 0 0 0 0 0 0 0 0 0 0 0 0 0 0 0 0 0 0 0 0 0 0 0 0 0 0 0 0 0 0 0 0 0 0 0 0 0 0 0 0 0 0 0 0 0 0 0 0 0 0 0 0 0 0 0 0 0 0 0 0 0 0 0 0 0 0 0 0 0 0 0 0 0 0 0 0 0 0 0 0 0 0 0 0 0 0 0 0 0 0 0 0 0 0 0 0 0 0 0 0 0 0 0 0 0 0 0 0 0 0 0 0 0 0 0 0 0 0 0 0 0 0 0 0 0 0 0 0 0 0 0 0 0 0 0 0 0 0 0 0 0 0 0 0 0 0 0 0 0 0 0 0 0 0 0 0 0 0 0 0 0 0 0 0 0 0 0 0 0 0 0 0 0 0 0 0 0 0 0 0 0 0 0 0 0 0 0 0 0 0 0 0 0 0 0 0 0 0 0 0 0 0 0 0 0 0 0 0 0 0 0 0 0 0 0 0 0 0 0 0 0 0 0 0 0 0 0 0 0 0 0 0 0 0 0 0 0 0 0 0 0 0 0 0 0 0 0 0 0 0 0 0 0 0 0 0 0 0 0 0 0 0 0 0 0 0 0 0 0 0 0 0 0 0 0 0 0 0 0 0 0 0 0 0 0 0 0 0 0 0 0 0 0 0 0 0 0 0 0 0 0 0 0 0 0 0 0 0 0 0 0 0 0 0 0 0 0 0 0 0 0 0 0 0 0 0 0 0 0 0 0 0 0 0 0 0 0 0 0 0 0 0 0 0 0 0 0 0 0 0 0 0 0 0 0 0 0 0 0 0 0 0 0 0 0 0 0 0 0 0 0 0 0 0 0 0 0 0 0 0 0 0 0 0 0 0 0 0 0 0 0 0 0 0 0 0 0 0 0 0 0 0 0 0 0 0 0 0 0 0 0 0 0 0 0 0 0 0 0 0 0 0 0 0 0 0 0 0 0 0 0 0 0 0 0 0 0 0 0 0 0 0 0 0 0 0 0 0 0 0 0 0 0 0 0 0 0 0 0 0 0 0 0 0 0 0 0 0 0 0 0 0 0 0 0 0 0 0 0 0 0 0 0 0 0 0 0 0 0 0 0 0 0 0 0 0 0 0 0 0 0 0 0 0 0 0 0 0 0 0 0 0 0 0 0 0 0 0 0 0 0 0 0 0 0 0 0 0 0 0 0 0 0 0 0 0 0 0 0 0 0 0 0 0 0 0 0 0 0 0 0 0 0 0 0 0 0 0 0 0 0 0 0 0 0 0 0 0 0 0 0 0 0 0 0 0 0 0 0 0 0 0 0 0 0 0 0 0 0 0 0 0 0 0 0 0 0 0 0 0 0 0 0 0 0 0 0 0 0 0 0 0 0 0 0 0 0 0 0 0 0 0 0 0 0 0 0 0 0 0 0 0 0 0 0 0 0 0 0 0 0 0 0 0 0 0 0 0 0 0 0 0 0 0 0 0 0 0 0 0 0 0 0 0 0 0 0 0 0 0 0 0 0 0 0 0 0 0 0 0 0 0 0 0 0 0 0 0 0 0 0 0 0 0 0 0 0 0 0 0 0 0 0 0 0 0 0 0 0 0 0 0 0 0 0 0 0 0 0 0 0 0 0 0 0 0 0 0 0 0 0 0 0 0 0 0 0 0 0 0 0 0 0 0 0 0 0 0 0 0 0 0 0 0 0 0 0 0 0 0 0 0 0 0 0 0 0 0 0 0 0 0 0 0 0 0 0 0 0 0 0 0 0 0 0 0 0 0 0 0 0 0 0 0 0 0 0 0 0 0 0 0 0 0 0 0 0 0 0 0 0 0 0 0 0 0 0 0 0 0 0 0 0 0 0 0 0 0 0 0 0 0 0 0 0 0 0 0 0 0 0 0 0 0 0 0 0 0 0 0 0 0 0 0 0 0 0 0 0 0 0 0 0 0 0 0 0 0 0 0 0 0 0 0 0 0 0 0 0 0 0 0 0 0 0 0 0 0 0 0 0 0 0 0 0 0 0 0 0 0 0 0 0 0 0 0 0 0 0 0 0 0 0 0 0 0 0 0 0 0 0 0 0 0 0 0 0 0 0 0 0 0 0 0 0 0 0 0 0 0 0 0 0 0 0 0 0 0 0 0 0 0 0 0 0 0 0 0 0 0 0 0 0 0 0 0 0 0 0 0 0 0 0 0 0 0 0 0 0 0 0 0 0 0 0 0 0 0 0 0 0 0 0 0 0 0 0 0 0 0 0 0 0 0 0 0 0 0 0 0 0 0 0 0 0 0 0 0 0 0 0 0 0 0 0 0 0 0 0 0 0 0 0 0 0 0 0 0 0 0 0 0 0 0 0 0 0 0 0 0 0 0 0 0 0 0 0 0 0 0 0 0 0 0 0 0 0 0 0 0 0 0 0 0 0 0 0 0 0 0 0 0 0 0 0 0 0 0 0 0 0 0 0 0 0 0 0 0 0 0 0 0 0 0 0 0 0 0 0 0 0 0 0 0 0 0 0 0 0 0 0 0 0 0 0 0 0 0 0 0 0 0 0 0 0 0 0 0 0 0 0 0 0 0 0 0 0 0 0 0 0 0 0 0 0 0 0 0 0 0 0 0 0 0 0 0 0 0 0 0 0 0 0 0 0 0 0 0 0 0 0 0 0 0 0 0 0 0 0 0 0 0 0 0 0 0 0 0 0 0 0 0 0 0 0 0 0 0 0 0 0 0 0 0 0 0 0 0 0 0 0 0 0 0 0 0 0 0 0 0 0 0 0 0 0 0 0 0 0 0 0 0 0 0 0 0 0 0 0 0 0 0 0 0 0 0 0 0 0 0 0 0 0 0 0 0 0 0 0 0 0 0 0 0 0 0 0 0 0 0 0 0 0 0 0 0 0 0 0 0 0 0 0 0 0 0 0 0 0 0 0 0 0 0 0 0 0 0 0 0 0 0 0 0 0 0 0 0 0 0 0 0 0 0 0 0 0 0 0 0 0 0 0 0 0 0 0 0 0 0 0 0 0 0 0 0 0 0 0 0 0 0 0 0 0 0 0 0 0 0 0 0 0 0 0 0 0 0 0 0 0 0 0 0 0 0 0 0 0 0 0 0 0 0 0 0 0 0 0 0 0 0 0 0 0 0 0 0 0 0 0 0 0 0 0 0 0 0 0 0 0 0 0 0 0 0 0 0 0 0 0 0 0 0 0 0 0 0 0 0 0 0 0 0 0 0 0 0 0 0 0 0 0 0 0 0 0 0 0 0 0 0 0 0 0 0 0 0 0 0 0 0 0 0 0 0 0 0 0 0 0 0 0 0 0 0 0 0 0 0 0 0 0 0 0 0 0 0 0 0 0 0 0 0 0 0 0 0 0 0 0 0 0 0 0 0 0 0 0 0 0 0 0 0 0 0 0 0 0 0 0 0 0 SPN113 Bacteria;Firmicutes;Bacilli;Lactobacillales;Aerococcaceae;Abiotrophia;defectiva_nov_94.622% 0 142 530 6 19 30 171 12 43 139 19 315 27 14 10 4 69 125 19 2 8 3 46 71 24 1 107 1 256 542 19 10 94 7 25 3 44 270 14 34 9 433 11 5 35 8 163 25 44 24 18 4 1 43 7 4 11 47 168 98 22 22 1 360 1 255 35 2 121 0 74 36 6 12 30 40 5 2 55 144 16 5 58 38 0 14 1 32 104 1 27 2 25 21 10 134 191 15 7 25 78 209 6 10 73 40 23 27 4 35 50 62 17 5 14 13 8 13 23 4 7 4 7 13 3 52 1 0 3 258 8 0 1 45 9 18 3 18 146 0 80 442 152 123 259 89 6 16 3 21 6 2 1 104 30 3 18 30 36 29 24 114 1 12 73 22 26 6 55 32 1242 16 12 69 2 34 8 18 19 89 2 39 6 5 0 59 9 12 66 15 20 133 18 7 33 214 1 7 13 61 71 0 10 2 1 6 64 138 35 305 1 7 13 4 4 5 31 6 53 8 205 0 74 112 1 20 0 67 202 0 14 37 35 4 1 2 12 63 5 45 8 0 0 91 29 2 5 11 3 17 0 4 2 15 5 18 69 7 26 6 20 0 42 5 24 7 0 1 0 0 0 0 0 0 0 0 0 0 0 0 0 0 0 0 0 0 0 0 0 0 0 0 0 0 0 0 0 0 0 0 0 0 0 0 0 0 0 0 0 0 0 0 0 0 0 0 0 0 0 0 0 0 0 0 0 0 0 0 0 0 0 0 0 0 0 0 0 0 0 0 0 0 0 0 0 0 0 0 0 0 0 0 0 0 0 0 0 0 0 0 0 0 0 0 0 0 0 0 0 0 0 0 0 0 0 0 0 0 0 0 0 0 0 0 0 0 0 0 0 0 0 0 0 0 0 0 0 0 0 0 0 0 0 0 0 0 0 0 0 0 0 0 0 0 0 0 0 0 0 0 0 0 0 0 0 0 0 0 0 0 0 0 0 0 0 0 0 0 0 0 0 0 0 0 0 0 0 0 0 0 0 0 0 0 0 0 0 0 0 0 0 0 0 0 0 0 0 0 0 0 0 0 0 0 0 0 0 0 0 0 0 0 0 0 0 0 0 0 0 0 0 0 0 0 0 0 0 0 0 0 0 0 0 0 0 0 0 0 0 0 0 0 0 0 0 0 0 0 0 0 0 0 0 0 0 0 0 0 0 0 0 0 0 0 0 0 0 0 0 0 0 0 0 0 0 0 0 0 0 0 0 0 0 0 0 0 0 0 0 0 0 0 0 0 0 0 0 0 0 0 0 0 0 0 0 0 0 0 0 0 0 0 0 0 0 0 0 0 0 0 0 0 0 0 0 0 0 0 0 0 0 0 0 0 0 0 0 0 0 0 0 0 0 0 0 0 0 0 0 0 0 0 0 0 0 0 0 0 0 0 0 0 0 0 0 0 0 0 0 0 0 0 0 0 0 0 0 0 0 0 0 0 0 0 0 0 0 0 0 0 0 0 0 0 0 0 0 0 0 0 0 0 0 0 0 0 0 0 0 0 0 0 0 0 0 0 0 0 0 0 0 0 0 0 0 0 0 0 0 0 0 0 0 0 0 0 0 0 0 0 0 0 0 0 0 0 0 0 0 0 0 0 0 0 0 0 0 0 0 0 0 0 0 0 0 0 0 0 0 0 0 0 0 0 0 0 0 0 0 0 0 0 0 0 0 0 0 0 0 0 0 0 0 0 0 0 0 0 0 0 0 0 0 0 0 0 0 0 0 0 0 0 0 0 0 0 0 0 0 0 0 0 0 0 0 0 0 0 0 0 0 0 0 0 0 0 0 0 0 0 0 0 0 0 0 0 0 0 0 0 0 0 0 0 0 0 0 0 0 0 0 0 0 0 0 0 0 0 0 0 0 0 0 0 0 0 0 0 0 0 0 0 0 0 0 0 0 0 0 0 0 0 0 0 0 0 0 0 0 0 0 0 0 0 0 0 0 0 0 0 0 0 0 0 0 0 0 0 0 0 0 0 0 0 0 0 0 0 0 0 0 0 0 0 0 0 0 0 0 0 0 0 0 0 0 0 0 0 0 0 0 0 0 0 0 0 0 0 0 0 0 0 0 0 0 0 0 0 0 0 0 0 0 0 0 0 0 0 0 0 0 0 0 0 0 0 0 0 0 0 0 0 0 0 0 0 0 0 0 0 0 0 0 0 0 0 0 0 0 0 0 0 0 0 0 0 0 0 0 0 0 0 0 0 0 0 0 0 0 0 0 0 0 0 0 0 0 0 0 0 0 0 0 0 0 0 0 0 0 0 0 0 0 0 0 0 0 0 0 0 0 0 0 0 0 0 0 0 0 0 0 0 0 0 0 0 0 0 0 0 0 0 0 0 0 0 0 0 0 0 0 0 0 0 0 0 0 0 0 0 0 0 0 0 0 0 0 0 0 0 0 0 0 0 0 0 0 0 0 0 0 0 0 0 0 0 0 0 0 0 0 0 0 0 0 0 0 0 0 0 0 0 0 0 0 0 0 0 0 0 0 0 0 0 0 0 0 0 0 0 0 0 0 0 0 0 0 0 0 0 0 0 0 0 0 0 0 0 0 0 0 0 0 0 0 0 0 0 0 0 0 0 0 0 0 0 0 0 0 0 0 0 0 0 0 0 0 0 0 0 0 0 0 0 0 0 0 0 0 0 0 0 0 0 0 0 0 0 0 0 0 0 0 0 0 0 0 0 0 0 0 0 0 0 0 0 0 0 0 0 0 0 0 0 0 0 0 0 0 0 0 0 0 0 0 0 0 0 0 0 0 0 0 0 0 0 0 0 0 0 0 0 0 0 0 0 0 0 0 0 0 0 0 0 0 0 0 0 0 0 0 0 0 0 0 0 0 0 0 0 0 0 0 0 0 0 0 0 0 0 0 0 0 0 0 0 0 0 0 0 0 0 0 0 0 0 0 0 0 0 0 0 0 0 0 0 0 0 0 0 0 0 0 0 0 0 0 0 0 0 0 0 0 0 0 0 0 0 0 0 0 0 0 0 0 0 0 0 0 0 0 0 0 0 0 0 0 0 0 0 0 0 0 0 0 0 0 0 0 0 0 0 0 0 0 0 0 0 0 0 0 0 0 0 0 0 0 0 0 0 0 0 0 0 0 0 0 0 0 0 0 0 0 0 0 0 0 0 0 0 0 0 0 0 0 0 0 0 0 0 0 0 0 0 0 0 0 0 0 0 0 0 0 0 0 0 0 0 0 0 0 0 0 0 0 0 0 0 0 0 0 0 0 0 0 0 0 0 0 0 0 0 0 0 0 0 0 0 0 0 0 0 0 0 0 0 0 0 0 0 0 0 0 0 0 0 0 0 0 0 0 0 0 0 0 0 0 0 0 0 0 0 0 0 0 0 0 0 0 0 0 0 0 0 0 0 0 0 0 0 0 0 0 0 0 0 0 0 0 0 0 0 0 0 0 0 0 0 0 0 0 0 0 0 0 0 0 0 0 0 0 0 0 0 0 0 0 0 0 0 0 0 0 0 0 0 0 0 0 0 0 0 0 0 0 0 0 0 0 0 0 0 0 0 0 0 0 0 0 0 0 0 0 0 0 0 0 0 0 0 0 0 0 0 0 0 0 0 0 0 0 0 0 0 0 0 0 0 0 0 0 0 0 0 0 0 0 0 0 0 0 0 0 0 0 0 0 0 0 0 0 0 0 0 0 0 0 0 0 0 0 0 0 0 0 0 0 0 0 0 0 0 0 0 0 0 0 0 0 0 0 0 0 0 0 0 0 0 0 0 0 0 0 0 0 0 0 0 0 0 0 0 0 0 0 0 0 0 0 0 0 0 0 0 0 0 0 0 0 0 0 0 0 0 0 0 0 0 0 0 0 0 0 0 0 0 0 0 0 0 0 0 0 0 0 0 0 0 0 0 0 0 0 0 0 0 0 0 0 0 0 0 0 0 0 0 0 0 0 0 0 0 0 0 0 0 0 0 0 0 0 0 0 0 0 0 0 0 0 0 0 0 0 0 0 0 0 0 0 0 0 0 0 0 0 0 0 0 0 0 0 0 0 0 0 0 0 0 0 0 0 0 0 0 0 0 0 0 0 0 0 0 0 0 SPN117 Bacteria;Bacteroidetes;Bacteroidia;Bacteroidales;Porphyromonadaceae;Porphyromonas;catoniae_nov_97.951% 0 21 0 0 0 0 0 6 0 0 11 0 26 1 233 0 0 119 22 3 0 0 0 0 16 1 0 0 0 82 2 19 1 15 0 0 0 0 0 0 1 0 54 0 0 0 0 0 0 0 43 0 0 0 0 0 4 23 9 131 16 0 0 0 4 0 0 0 4 585 28 0 50 0 0 0 11 0 0 0 0 0 0 13 0 0 0 44 9 0 2677 0 250 1 0 474 0 35 285 0 2 1 0 0 0 76 0 1 45 0 0 1 0 0 5 2 10 0 0 0 0 0 0 0 0 0 0 1 52 1 0 142 0 58 954 35 0 0 1 0 209 0 0 0 0 79 0 1 1 0 0 0 0 3 0 0 5 0 780 0 1140 3 0 0 13 0 102 1 0 0 0 0 0 10 67 0 0 0 0 0 0 0 0 0 0 5 44 0 74 3 1 0 4 0 1 9 0 0 12 127 127 6 5 0 0 1 0 10 0 0 0 0 1 0 0 3 0 0 0 13 0 75 5 0 0 94 1 579 0 0 0 1 0 0 0 0 1 0 0 2834 134 0 0 0 1 0 0 4 0 0 0 0 1 22 0 0 0 0 0 0 47 0 0 81 3 0 0 0 0 0 0 0 0 0 0 0 0 0 0 0 0 0 0 0 0 0 0 0 0 0 0 0 0 0 0 0 0 0 0 0 0 0 0 0 0 0 0 0 0 0 0 0 0 0 0 0 0 0 0 0 0 0 0 0 0 0 0 0 0 0 0 0 0 0 0 0 0 0 0 0 0 0 0 0 0 0 0 0 0 0 0 0 0 0 0 0 0 0 0 0 0 0 0 0 0 0 0 0 0 0 0 0 0 0 0 0 0 0 0 0 0 0 0 0 0 0 0 0 0 0 0 0 0 0 0 0 0 0 0 0 0 0 0 0 0 0 0 0 0 0 0 0 0 0 0 0 0 0 0 0 0 0 0 0 0 0 0 0 0 0 0 0 0 0 0 0 0 0 0 0 0 0 0 0 0 0 0 0 0 0 0 0 0 0 0 0 0 0 0 0 0 0 0 0 0 0 0 0 0 0 0 0 0 0 0 0 0 0 0 0 0 0 0 0 0 0 0 0 0 0 0 0 0 0 0 0 0 0 0 0 0 0 0 0 0 0 0 0 0 0 0 0 0 0 0 0 0 0 0 0 0 0 0 0 0 0 0 0 0 0 0 0 0 0 0 0 0 0 0 0 0 0 0 0 0 0 0 0 0 0 0 0 0 0 0 0 0 0 0 0 0 0 0 0 0 0 0 0 0 0 0 0 0 0 0 0 0 0 0 0 0 0 0 0 0 0 0 0 0 0 0 0 0 0 0 0 0 0 0 0 0 0 0 0 0 0 0 0 0 0 0 0 0 0 0 0 0 0 0 0 0 0 0 0 0 0 0 0 0 0 0 0 0 0 0 0 0 0 0 0 0 0 0 0 0 0 0 0 0 0 0 0 0 0 0 0 0 0 0 0 0 0 0 0 0 0 0 0 0 0 0 0 0 0 0 0 0 0 0 0 0 0 0 0 0 0 0 0 0 0 0 0 0 0 0 0 0 0 0 0 0 0 0 0 0 0 0 0 0 0 0 0 0 0 0 0 0 0 0 0 0 0 0 0 0 0 0 0 0 0 0 0 0 0 0 0 0 0 0 0 0 0 0 0 0 0 0 0 0 0 0 0 0 0 0 0 0 0 0 0 0 0 0 0 0 0 0 0 0 0 0 0 0 0 0 0 0 0 0 0 0 0 0 0 0 0 0 0 0 0 0 0 0 0 0 0 0 0 0 0 0 0 0 0 0 0 0 0 0 0 0 0 0 0 0 0 0 0 0 0 0 0 0 0 0 0 0 0 0 0 0 0 0 0 0 0 0 0 0 0 0 0 0 0 0 0 0 0 0 0 0 0 0 0 0 0 0 0 0 0 0 0 0 0 0 0 0 0 0 0 0 0 0 0 0 0 0 0 0 0 0 0 0 0 0 0 0 0 0 0 0 0 0 0 0 0 0 0 0 0 0 0 0 0 0 0 0 0 0 0 0 0 0 0 0 0 0 0 0 0 0 0 0 0 0 0 0 0 0 0 0 0 0 0 0 0 0 0 0 0 0 0 0 0 0 0 0 0 0 0 0 0 0 0 0 0 0 0 0 0 0 0 0 0 0 0 0 0 0 0 0 0 0 0 0 0 0 0 0 0 0 0 0 0 0 0 0 0 0 0 0 0 0 0 0 0 0 0 0 0 0 0 0 0 0 0 0 0 0 0 0 0 0 0 0 0 0 0 0 0 0 0 0 0 0 0 0 0 0 0 0 0 0 0 0 0 0 0 0 0 0 0 0 0 0 0 0 0 0 0 0 0 0 0 0 0 0 0 0 0 0 0 0 0 0 0 0 0 0 0 0 0 0 0 0 0 0 0 0 0 0 0 0 0 0 0 0 0 0 0 0 0 0 0 0 0 0 0 0 0 0 0 0 0 0 0 0 0 0 0 0 0 0 0 0 0 0 0 0 0 0 0 0 0 0 0 0 0 0 0 0 0 0 0 0 0 0 0 0 0 0 0 0 0 0 0 0 0 0 0 0 0 0 0 0 0 0 0 0 0 0 0 0 0 0 0 0 0 0 0 0 0 0 0 0 0 0 0 0 0 0 0 0 0 0 0 0 0 0 0 0 0 0 0 0 0 0 0 0 0 0 0 0 0 0 0 0 0 0 0 0 0 0 0 0 0 0 0 0 0 0 0 0 0 0 0 0 0 0 0 0 0 0 0 0 0 0 0 0 0 0 0 0 0 0 0 0 0 0 0 0 0 0 0 0 0 0 0 0 0 0 0 0 0 0 0 0 0 0 0 0 0 0 0 0 0 0 0 0 0 0 0 0 0 0 0 0 0 0 0 0 0 0 0 0 0 0 0 0 0 0 0 0 0 0 0 0 0 0 0 0 0 0 0 0 0 0 0 0 0 0 0 0 0 0 0 0 0 0 0 0 0 0 0 0 0 0 0 0 0 0 0 0 0 0 0 0 0 0 0 0 0 0 0 0 0 0 0 0 0 0 0 0 0 0 0 0 0 0 0 0 0 0 0 0 0 0 0 0 0 0 0 0 0 0 0 0 0 0 0 0 0 0 0 0 0 0 0 0 0 0 0 0 0 0 0 0 0 0 0 0 0 0 0 0 0 0 0 0 0 0 0 0 0 0 0 0 0 0 0 0 0 0 0 0 0 0 0 0 0 0 0 0 0 0 0 0 0 0 0 0 0 0 0 0 0 0 0 0 0 0 0 0 0 0 0 0 0 0 0 0 0 0 0 0 0 0 0 0 0 0 0 0 0 0 0 0 0 0 0 0 0 0 0 0 0 0 0 0 0 0 0 0 0 0 0 0 0 0 0 0 0 0 0 0 0 0 0 0 0 0 0 0 0 0 0 0 0 0 0 0 0 0 0 0 0 0 0 0 0 0 0 0 0 0 0 0 0 0 0 0 0 0 0 0 0 0 0 0 0 0 0 0 0 0 0 0 0 0 0 0 0 0 0 0 0 0 0 0 0 0 0 0 0 0 0 0 0 0 0 0 0 0 0 0 0 0 0 0 0 0 0 0 0 0 0 0 0 0 0 0 0 0 0 0 0 0 0 0 0 0 0 0 0 0 0 0 0 0 0 0 0 0 0 0 0 0 0 0 0 0 0 0 0 0 0 0 0 0 0 0 0 0 0 0 0 0 0 0 0 0 0 0 0 0 0 0 0 0 0 0 0 0 0 0 0 0 0 0 0 0 0 0 0 0 0 0 0 0 0 0 0 0 0 0 0 0 0 0 0 0 0 0 0 0 0 0 0 0 0 0 0 0 0 0 0 0 0 0 0 0 0 0 0 0 0 0 0 0 0 0 0 0 0 0 0 0 0 0 0 0 0 0 0 0 0 0 0 0 0 0 0 0 0 0 0 0 0 0 0 0 0 0 0 0 0 0 0 0 0 0 0 0 0 0 0 0 0 0 0 0 0 0 0 0 0 0 0 0 0 0 0 0 0 0 0 0 0 0 0 0 0 0 0 0 0 0 0 0 0 0 0 0 0 0 0 0 0 0 0 0 0 0 0 SPN118 Bacteria;Firmicutes;Bacilli;Lactobacillales;Carnobacteriaceae;Granulicatella;elegans_nov_94.389% 0 43 4 15 2 10 4 0 2 56 11 182 0 28 6 9 52 27 0 0 0 1 30 4 8 0 16 4 1 40 38 1 19 2 15 12 18 74 3 384 26 69 1 34 78 1 52 4 183 31 7 0 6 7 5 49 2 56 28 16 55 111 0 1 2 98 152 3 72 2 34 52 9 5 0 20 56 7 69 5 2 58 35 142 0 49 3 38 44 4 286 3 303 155 10 11 566 28 89 42 33 29 78 5 48 244 54 2 26 0 2 65 32 30 94 115 7 0 38 52 0 6 5 14 8 14 2 11 3 342 7 9 5 16 18 312 1 3 3 1 335 123 14 38 67 15 17 50 0 19 0 2 8 3 10 1 4 81 5 29 92 47 3 194 17 13 15 6 32 26 0 7 98 5 0 10 24 12 5 64 1 32 125 10 19 31 21 1 3 4 8 6 98 7 16 25 3 15 82 9 197 21 6 4 8 0 466 6 11 1 2 8 3 0 5 122 359 20 392 2 98 20 73 32 1 2 14 38 5 0 1 57 14 4 0 0 14 14 134 71 28 3 0 7 82 0 9 1 6 2 4 18 0 0 1 2 5 1 1 0 6 2 2 1 26 0 3 1 0 0 0 0 0 0 0 0 0 0 0 0 0 0 0 0 0 0 0 0 0 0 0 0 0 0 0 0 0 0 0 0 0 0 0 0 0 0 0 0 0 0 0 0 0 0 0 0 0 0 0 0 0 0 0 0 0 0 0 0 0 0 0 0 0 0 0 0 0 0 0 0 0 0 0 0 0 0 0 0 0 0 0 0 0 0 0 0 0 0 0 0 0 0 0 0 0 0 0 0 0 0 0 0 0 0 0 0 0 0 0 0 0 0 0 0 0 0 0 0 0 0 0 0 0 0 0 0 0 0 0 0 0 0 0 0 0 0 0 0 0 0 0 0 0 0 0 0 0 0 0 0 0 0 0 0 0 0 0 0 0 0 0 0 0 0 0 0 0 0 0 0 0 0 0 0 0 0 0 0 0 0 0 0 0 0 0 0 0 0 0 0 0 0 0 0 0 0 0 0 0 0 0 0 0 0 0 0 0 0 0 0 0 0 0 0 0 0 0 0 0 0 0 0 0 0 0 0 0 0 0 0 0 0 0 0 0 0 0 0 0 0 0 0 0 0 0 0 0 0 0 0 0 0 0 0 0 0 0 0 0 0 0 0 0 0 0 0 0 0 0 0 0 0 0 0 0 0 0 0 0 0 0 0 0 0 0 0 0 0 0 0 0 0 0 0 0 0 0 0 0 0 0 0 0 0 0 0 0 0 0 0 0 0 0 0 0 0 0 0 0 0 0 0 0 0 0 0 0 0 0 0 0 0 0 0 0 0 0 0 0 0 0 0 0 0 0 0 0 0 0 0 0 0 0 0 0 0 0 0 0 0 0 0 0 0 0 0 0 0 0 0 0 0 0 0 0 0 0 0 0 0 0 0 0 0 0 0 0 0 0 0 0 0 0 0 0 0 0 0 0 0 0 0 0 0 0 0 0 0 0 0 0 0 0 0 0 0 0 0 0 0 0 0 0 0 0 0 0 0 0 0 0 0 0 0 0 0 0 0 0 0 0 0 0 0 0 0 0 0 0 0 0 0 0 0 0 0 0 0 0 0 0 0 0 0 0 0 0 0 0 0 0 0 0 0 0 0 0 0 0 0 0 0 0 0 0 0 0 0 0 0 0 0 0 0 0 0 0 0 0 0 0 0 0 0 0 0 0 0 0 0 0 0 0 0 0 0 0 0 0 0 0 0 0 0 0 0 0 0 0 0 0 0 0 0 0 0 0 0 0 0 0 0 0 0 0 0 0 0 0 0 0 0 0 0 0 0 0 0 0 0 0 0 0 0 0 0 0 0 0 0 0 0 0 0 0 0 0 0 0 0 0 0 0 0 0 0 0 0 0 0 0 0 0 0 0 0 0 0 0 0 0 0 0 0 0 0 0 0 0 0 0 0 0 0 0 0 0 0 0 0 0 0 0 0 0 0 0 0 0 0 0 0 0 0 0 0 0 0 0 0 0 0 0 0 0 0 0 0 0 0 0 0 0 0 0 0 0 0 0 0 0 0 0 0 0 0 0 0 0 0 0 0 0 0 0 0 0 0 0 0 0 0 0 0 0 0 0 0 0 0 0 0 0 0 0 0 0 0 0 0 0 0 0 0 0 0 0 0 0 0 0 0 0 0 0 0 0 0 0 0 0 0 0 0 0 0 0 0 0 0 0 0 0 0 0 0 0 0 0 0 0 0 0 0 0 0 0 0 0 0 0 0 0 0 0 0 0 0 0 0 0 0 0 0 0 0 0 0 0 0 0 0 0 0 0 0 0 0 0 0 0 0 0 0 0 0 0 0 0 0 0 0 0 0 0 0 0 0 0 0 0 0 0 0 0 0 0 0 0 0 0 0 0 0 0 0 0 0 0 0 0 0 0 0 0 0 0 0 0 0 0 0 0 0 0 0 0 0 0 0 0 0 0 0 0 0 0 0 0 0 0 0 0 0 0 0 0 0 0 0 0 0 0 0 0 0 0 0 0 0 0 0 0 0 0 0 0 0 0 0 0 0 0 0 0 0 0 0 0 0 0 0 0 0 0 0 0 0 0 0 0 0 0 0 0 0 0 0 0 0 0 0 0 0 0 0 0 0 0 0 0 0 0 0 0 0 0 0 0 0 0 0 0 0 0 0 0 0 0 0 0 0 0 0 0 0 0 0 0 0 0 0 0 0 0 0 0 0 0 0 0 0 0 0 0 0 0 0 0 0 0 0 0 0 0 0 0 0 0 0 0 0 0 0 0 0 0 0 0 0 0 0 0 0 0 0 0 0 0 0 0 0 0 0 0 0 0 0 0 0 0 0 0 0 0 0 0 0 0 0 0 0 0 0 0 0 0 0 0 0 0 0 0 0 0 0 0 0 0 0 0 0 0 0 0 0 0 0 0 0 0 0 0 0 0 0 0 0 0 0 0 0 0 0 0 0 0 0 0 0 0 0 0 0 0 0 0 0 0 0 0 0 0 0 0 0 0 0 0 0 0 0 0 0 0 0 0 0 0 0 0 0 0 0 0 0 0 0 0 0 0 0 0 0 0 0 0 0 0 0 0 0 0 0 0 0 0 0 0 0 0 0 0 0 0 0 0 0 0 0 0 0 0 0 0 0 0 0 0 0 0 0 0 0 0 0 0 0 0 0 0 0 0 0 0 0 0 0 0 0 0 0 0 0 0 0 0 0 0 0 0 0 0 0 0 0 0 0 0 0 0 0 0 0 0 0 0 0 0 0 0 0 0 0 0 0 0 0 0 0 0 0 0 0 0 0 0 0 0 0 0 0 0 0 0 0 0 0 0 0 0 0 0 0 0 0 0 0 0 0 0 0 0 0 0 0 0 0 0 0 0 0 0 0 0 0 0 0 0 0 0 0 0 0 0 0 0 0 0 0 0 0 0 0 0 0 0 0 0 0 0 0 0 0 0 0 0 0 0 0 0 0 0 0 0 0 0 0 0 0 0 0 0 0 0 0 0 0 0 0 0 0 0 0 0 0 0 0 0 0 0 0 0 0 0 0 0 0 0 0 0 0 0 0 0 0 0 0 0 0 0 0 0 0 0 0 0 0 0 0 0 0 0 0 0 0 0 0 0 0 0 0 0 0 0 0 0 0 0 0 0 0 0 0 0 0 0 0 0 0 0 0 0 0 0 0 0 0 0 0 0 0 0 0 0 0 0 0 0 0 0 0 0 0 0 0 0 0 0 0 0 0 0 0 0 0 0 0 0 0 0 0 0 0 0 0 0 0 0 0 0 0 0 0 0 0 0 0 0 0 0 0 0 0 0 0 0 0 0 0 0 0 0 0 0 0 0 0 0 0 0 0 0 0 0 0 0 0 0 0 0 0 0 0 0 0 0 0 0 0 0 0 0 0 0 0 0 0 0 0 0 0 0 0 0 0 0 0 0 0 0 0 0 0 0 0 0 0 0 0 0 0 0 0 0 0 0 0 0 0 0 0 0 0 0 0 0 0 0 0 0 0 0 0 0 0 0 0 0 0 0 0 0 0 0 0 0 0 0 0 0 0 0 0 SPN120 Bacteria;Bacteroidetes;Bacteroidia;Bacteroidales;Prevotellaceae;Alloprevotella;sp. HMT473 nov_97.342% 0 0 0 0 0 79 0 40 0 0 0 10 0 2 0 0 0 0 216 432 0 0 0 3 8 1 0 0 0 0 100 4 0 26 3 0 0 0 1 0 243 3 0 94 1 0 0 0 0 1 0 0 0 0 5 4 0 5 0 8 0 0 1 2 286 0 0 1258 8 127 0 26 2 0 0 15 6 1 0 0 1 12 0 13 5 1 3 1 0 1 0 0 0 5 0 151 0 3 0 0 0 2 0 2 0 4 0 0 910 0 0 1 0 94 10 79 22 33 19 4 0 0 404 30 2 0 2 0 0 0 17 28 0 0 104 80 2158 3 0 0 0 0 4 5 0 6 81 143 0 0 0 12 2 0 0 0 56 0 0 0 0 0 10 0 0 0 0 1 0 0 0 0 2 5 0 0 13 13 7 0 0 0 4 83 0 50 6 10 86 1 0 0 124 2 0 0 0 63 7 1 0 35 105 310 0 0 1 0 0 0 45 1 1 0 0 26 0 0 0 0 0 0 0 2 0 22 492 12 0 0 0 0 0 0 0 28 3 6 570 0 0 14 48 0 1 0 34 87 0 0 8 10 3 1 0 0 5 0 0 2 0 0 0 3 4 0 0 0 0 0 0 0 0 0 0 0 0 0 0 0 0 0 0 0 0 0 0 0 0 0 0 0 0 0 0 0 0 0 0 0 0 0 0 0 0 0 0 0 0 0 0 0 0 0 0 0 0 0 0 0 0 0 0 0 0 0 0 0 0 0 0 0 0 0 0 0 0 0 0 0 0 0 0 0 0 0 0 0 0 0 0 0 0 0 0 0 0 0 0 0 0 0 0 0 0 0 0 0 0 0 0 0 0 0 0 0 0 0 0 0 0 0 0 0 0 0 0 0 0 0 0 0 0 0 0 0 0 0 0 0 0 0 0 0 0 0 0 0 0 0 0 0 0 0 0 0 0 0 0 0 0 0 0 0 0 0 0 0 0 0 0 0 0 0 0 0 0 0 0 0 0 0 0 0 0 0 0 0 0 0 0 0 0 0 0 0 0 0 0 0 0 0 0 0 0 0 0 0 0 0 0 0 0 0 0 0 0 0 0 0 0 0 0 0 0 0 0 0 0 0 0 0 0 0 0 0 0 0 0 0 0 0 0 0 0 0 0 0 0 0 0 0 0 0 0 0 0 0 0 0 0 0 0 0 0 0 0 0 0 0 0 0 0 0 0 0 0 0 0 0 0 0 0 0 0 0 0 0 0 0 0 0 0 0 0 0 0 0 0 0 0 0 0 0 0 0 0 0 0 0 0 0 0 0 0 0 0 0 0 0 0 0 0 0 0 0 0 0 0 0 0 0 0 0 0 0 0 0 0 0 0 0 0 0 0 0 0 0 0 0 0 0 0 0 0 0 0 0 0 0 0 0 0 0 0 0 0 0 0 0 0 0 0 0 0 0 0 0 0 0 0 0 0 0 0 0 0 0 0 0 0 0 0 0 0 0 0 0 0 0 0 0 0 0 0 0 0 0 0 0 0 0 0 0 0 0 0 0 0 0 0 0 0 0 0 0 0 0 0 0 0 0 0 0 0 0 0 0 0 0 0 0 0 0 0 0 0 0 0 0 0 0 0 0 0 0 0 0 0 0 0 0 0 0 0 0 0 0 0 0 0 0 0 0 0 0 0 0 0 0 0 0 0 0 0 0 0 0 0 0 0 0 0 0 0 0 0 0 0 0 0 0 0 0 0 0 0 0 0 0 0 0 0 0 0 0 0 0 0 0 0 0 0 0 0 0 0 0 0 0 0 0 0 0 0 0 0 0 0 0 0 0 0 0 0 0 0 0 0 0 0 0 0 0 0 0 0 0 0 0 0 0 0 0 0 0 0 0 0 0 0 0 0 0 0 0 0 0 0 0 0 0 0 0 0 0 0 0 0 0 0 0 0 0 0 0 0 0 0 0 0 0 0 0 0 0 0 0 0 0 0 0 0 0 0 0 0 0 0 0 0 0 0 0 0 0 0 0 0 0 0 0 0 0 0 0 0 0 0 0 0 0 0 0 0 0 0 0 0 0 0 0 0 0 0 0 0 0 0 0 0 0 0 0 0 0 0 0 0 0 0 0 0 0 0 0 0 0 0 0 0 0 0 0 0 0 0 0 0 0 0 0 0 0 0 0 0 0 0 0 0 0 0 0 0 0 0 0 0 0 0 0 0 0 0 0 0 0 0 0 0 0 0 0 0 0 0 0 0 0 0 0 0 0 0 0 0 0 0 0 0 0 0 0 0 0 0 0 0 0 0 0 0 0 0 0 0 0 0 0 0 0 0 0 0 0 0 0 0 0 0 0 0 0 0 0 0 0 0 0 0 0 0 0 0 0 0 0 0 0 0 0 0 0 0 0 0 0 0 0 0 0 0 0 0 0 0 0 0 0 0 0 0 0 0 0 0 0 0 0 0 0 0 0 0 0 0 0 0 0 0 0 0 0 0 0 0 0 0 0 0 0 0 0 0 0 0 0 0 0 0 0 0 0 0 0 0 0 0 0 0 0 0 0 0 0 0 0 0 0 0 0 0 0 0 0 0 0 0 0 0 0 0 0 0 0 0 0 0 0 0 0 0 0 0 0 0 0 0 0 0 0 0 0 0 0 0 0 0 0 0 0 0 0 0 0 0 0 0 0 0 0 0 0 0 0 0 0 0 0 0 0 0 0 0 0 0 0 0 0 0 0 0 0 0 0 0 0 0 0 0 0 0 0 0 0 0 0 0 0 0 0 0 0 0 0 0 0 0 0 0 0 0 0 0 0 0 0 0 0 0 0 0 0 0 0 0 0 0 0 0 0 0 0 0 0 0 0 0 0 0 0 0 0 0 0 0 0 0 0 0 0 0 0 0 0 0 0 0 0 0 0 0 0 0 0 0 0 0 0 0 0 0 0 0 0 0 0 0 0 0 0 0 0 0 0 0 0 0 0 0 0 0 0 0 0 0 0 0 0 0 0 0 0 0 0 0 0 0 0 0 0 0 0 0 0 0 0 0 0 0 0 0 0 0 0 0 0 0 0 0 0 0 0 0 0 0 0 0 0 0 0 0 0 0 0 0 0 0 0 0 0 0 0 0 0 0 0 0 0 0 0 0 0 0 0 0 0 0 0 0 0 0 0 0 0 0 0 0 0 0 0 0 0 0 0 0 0 0 0 0 0 0 0 0 0 0 0 0 0 0 0 0 0 0 0 0 0 0 0 0 0 0 0 0 0 0 0 0 0 0 0 0 0 0 0 0 0 0 0 0 0 0 0 0 0 0 0 0 0 0 0 0 0 0 0 0 0 0 0 0 0 0 0 0 0 0 0 0 0 0 0 0 0 0 0 0 0 0 0 0 0 0 0 0 0 0 0 0 0 0 0 0 0 0 0 0 0 0 0 0 0 0 0 0 0 0 0 0 0 0 0 0 0 0 0 0 0 0 0 0 0 0 0 0 0 0 0 0 0 0 0 0 0 0 0 0 0 0 0 0 0 0 0 0 0 0 0 0 0 0 0 0 0 0 0 0 0 0 0 0 0 0 0 0 0 0 0 0 0 0 0 0 0 0 0 0 0 0 0 0 0 0 0 0 0 0 0 0 0 0 0 0 0 0 0 0 0 0 0 0 0 0 0 0 0 0 0 0 0 0 0 0 0 0 0 0 0 0 0 0 0 0 0 0 0 0 0 0 0 0 0 0 0 0 0 0 0 0 0 0 0 0 0 0 0 0 0 0 0 0 0 0 0 0 0 0 0 0 0 0 0 0 0 0 0 0 0 0 0 0 0 0 0 0 0 0 0 0 0 0 0 0 0 0 0 0 0 0 0 0 0 0 0 0 0 0 0 0 0 0 0 0 0 0 0 0 0 0 0 0 0 0 0 0 0 0 0 0 0 0 0 0 0 0 0 0 0 0 0 0 0 0 0 0 0 0 0 0 0 0 0 0 0 0 0 0 0 0 0 0 0 0 0 0 0 0 0 0 0 0 0 0 0 0 0 0 0 0 0 0 0 0 0 0 0 0 0 0 0 0 0 0 0 0 0 0 0 0 0 0 0 0 0 0 0 0 0 0 0 0 0 0 0 0 0 0 0 0 0 0 0 0 0 SPN121 Bacteria;Firmicutes;Bacilli;Lactobacillales;Carnobacteriaceae;Granulicatella;adiacens_nov_95.161% 269 770 622 298 185 93 791 186 440 282 117 271 189 841 18 795 299 935 364 152 226 1225 605 200 297 635 1208 851 254 346 406 426 337 154 282 285 536 219 433 514 121 422 219 239 558 186 251 1155 276 706 82 255 447 1144 264 801 210 428 461 328 492 973 386 265 293 362 669 101 1127 249 145 396 1065 229 759 570 275 231 202 1019 327 193 918 419 139 1086 535 672 775 47 331 238 211 208 396 341 92 350 446 423 915 257 1044 449 124 664 516 884 188 664 483 735 133 173 225 350 242 127 80 918 740 376 377 260 269 709 242 325 120 265 258 149 536 694 382 563 146 406 531 137 358 151 224 476 142 199 377 204 219 626 104 417 284 722 451 368 130 820 256 391 432 312 170 635 854 1367 330 554 703 754 0 387 583 879 252 482 879 1105 258 439 274 828 569 288 107 701 252 248 210 80 544 269 248 363 403 402 89 104 316 449 675 110 159 104 81 22 331 326 717 1059 106 320 314 298 540 172 779 337 195 233 496 449 149 488 102 112 72 273 761 32 186 696 804 334 206 101 324 464 222 137 516 125 39 1198 284 634 434 192 90 556 75 122 284 120 481 726 1008 1388 252 400 442 313 959 181 326 1057 313 460 0 0 0 0 0 0 0 0 0 0 0 0 0 0 0 0 0 0 0 0 0 0 0 0 0 0 0 0 0 0 0 0 0 0 0 0 0 0 0 0 0 0 0 0 0 0 0 0 0 0 0 0 0 0 0 0 0 0 0 0 0 0 0 0 0 0 0 0 0 0 0 0 0 0 0 0 0 0 0 0 0 0 0 0 0 0 0 0 0 0 0 0 0 0 0 0 0 0 0 0 0 0 0 0 0 0 0 0 0 0 0 0 0 0 0 0 0 0 0 0 0 0 0 0 0 0 0 0 0 0 0 0 0 0 0 0 0 0 0 0 0 0 0 0 0 0 0 0 0 0 0 0 0 0 0 0 0 0 0 0 0 0 0 0 0 0 0 0 0 0 0 0 0 0 0 0 0 0 0 0 0 0 0 0 0 0 0 0 0 0 0 0 0 0 0 0 0 0 0 0 0 0 0 0 0 0 0 0 0 0 0 0 0 0 0 0 0 0 0 0 0 0 0 0 0 0 0 0 0 0 0 0 0 0 0 0 0 0 0 0 0 0 0 0 0 0 0 0 0 0 0 0 0 0 0 0 0 0 0 0 0 0 0 0 0 0 0 0 0 0 0 0 0 0 0 0 0 0 0 0 0 0 0 0 0 0 0 0 0 0 0 0 0 0 0 0 0 0 0 0 0 0 0 0 0 0 0 0 0 0 0 0 0 0 0 0 0 0 0 0 0 0 0 0 0 0 0 0 0 0 0 0 0 0 0 0 0 0 0 0 0 0 0 0 0 0 0 0 0 0 0 0 0 0 0 0 0 0 0 0 0 0 0 0 0 0 0 0 0 0 0 0 0 0 0 0 0 0 0 0 0 0 0 0 0 0 0 0 0 0 0 0 0 0 0 0 0 0 0 0 0 0 0 0 0 0 0 0 0 0 0 0 0 0 0 0 0 0 0 0 0 0 0 0 0 0 0 0 0 0 0 0 0 0 0 0 0 0 0 0 0 0 0 0 0 0 0 0 0 0 0 0 0 0 0 0 0 0 0 0 0 0 0 0 0 0 0 0 0 0 0 0 0 0 0 0 0 0 0 0 0 0 0 0 0 0 0 0 0 0 0 0 0 0 0 0 0 0 0 0 0 0 0 0 0 0 0 0 0 0 0 0 0 0 0 0 0 0 0 0 0 0 0 0 0 0 0 0 0 0 0 0 0 0 0 0 0 0 0 0 0 0 0 0 0 0 0 0 0 0 0 0 0 0 0 0 0 0 0 0 0 0 0 0 0 0 0 0 0 0 0 0 0 0 0 0 0 0 0 0 0 0 0 0 0 0 0 0 0 0 0 0 0 0 0 0 0 0 0 0 0 0 0 0 0 0 0 0 0 0 0 0 0 0 0 0 0 0 0 0 0 0 0 0 0 0 0 0 0 0 0 0 0 0 0 0 0 0 0 0 0 0 0 0 0 0 0 0 0 0 0 0 0 0 0 0 0 0 0 0 0 0 0 0 0 0 0 0 0 0 0 0 0 0 0 0 0 0 0 0 0 0 0 0 0 0 0 0 0 0 0 0 0 0 0 0 0 0 0 0 0 0 0 0 0 0 0 0 0 0 0 0 0 0 0 0 0 0 0 0 0 0 0 0 0 0 0 0 0 0 0 0 0 0 0 0 0 0 0 0 0 0 0 0 0 0 0 0 0 0 0 0 0 0 0 0 0 0 0 0 0 0 0 0 0 0 0 0 0 0 0 0 0 0 0 0 0 0 0 0 0 0 0 0 0 0 0 0 0 0 0 0 0 0 0 0 0 0 0 0 0 0 0 0 0 0 0 0 0 0 0 0 0 0 0 0 0 0 0 0 0 0 0 0 0 0 0 0 0 0 0 0 0 0 0 0 0 0 0 0 0 0 0 0 0 0 0 0 0 0 0 0 0 0 0 0 0 0 0 0 0 0 0 0 0 0 0 0 0 0 0 0 0 0 0 0 0 0 0 0 0 0 0 0 0 0 0 0 0 0 0 0 0 0 0 0 0 0 0 0 0 0 0 0 0 0 0 0 0 0 0 0 0 0 0 0 0 0 0 0 0 0 0 0 0 0 0 0 0 0 0 0 0 0 0 0 0 0 0 0 0 0 0 0 0 0 0 0 0 0 0 0 0 0 0 0 0 0 0 0 0 0 0 0 0 0 0 0 0 0 0 0 0 0 0 0 0 0 0 0 0 0 0 0 0 0 0 0 0 0 0 0 0 0 0 0 0 0 0 0 0 0 0 0 0 0 0 0 0 0 0 0 0 0 0 0 0 0 0 0 0 0 0 0 0 0 0 0 0 0 0 0 0 0 0 0 0 0 0 0 0 0 0 0 0 0 0 0 0 0 0 0 0 0 0 0 0 0 0 0 0 0 0 0 0 0 0 0 0 0 0 0 0 0 0 0 0 0 0 0 0 0 0 0 0 0 0 0 0 0 0 0 0 0 0 0 0 0 0 0 0 0 0 0 0 0 0 0 0 0 0 0 0 0 0 0 0 0 0 0 0 0 0 0 0 0 0 0 0 0 0 0 0 0 0 0 0 0 0 0 0 0 0 0 0 0 0 0 0 0 0 0 0 0 0 0 0 0 0 0 0 0 0 0 0 0 0 0 0 0 0 0 0 0 0 0 0 0 0 0 0 0 0 0 0 0 0 0 0 0 0 0 0 0 0 0 0 0 0 0 0 0 0 0 0 0 0 0 0 0 0 0 0 0 0 0 0 0 0 0 0 0 0 0 0 0 0 0 0 0 0 0 0 0 0 0 0 0 0 0 0 0 0 0 0 0 0 0 0 0 0 0 0 0 0 0 0 0 0 0 0 0 0 0 0 0 0 0 0 0 0 0 0 0 0 0 0 0 0 0 0 0 0 0 0 0 0 0 0 0 0 0 0 0 0 0 0 0 0 0 0 0 0 0 0 0 0 0 0 0 0 0 0 0 0 0 0 0 0 0 0 0 0 0 0 0 0 0 0 0 0 0 0 0 0 0 0 0 0 0 0 0 0 0 0 0 0 0 0 0 0 0 0 0 0 0 0 0 0 0 0 0 0 0 0 0 0 0 0 0 0 0 0 0 0 0 0 0 0 0 0 0 0 0 0 0 0 0 0 0 0 0 0 0 0 0 0 0 0 0 0 0 0 0 0 0 0 0 0 0 0 0 0 0 0 0 0 0 0 0 0 0 0 0 0 0 0 0 0 0 0 0 0 0 0 0 0 0 0 0 0 0 0 0 0 0 0 0 0 0 0 0 0 0 0 0 0 0 0 0 0 0 0 0 0 0 0 0 0 0 0 0 0 0 0 0 0 0 0 0 0 0 0 0 0 0 0 0 0 0 0 0 0 0 0 0 0 0 0 0 0 0 0 0 0 0 0 0 0 0 0 0 0 0 0 0 0 0 0 0 0 0 0 0 0 0 0 0 0 0 0 0 0 0 0 0 0 0 0 0 0 0 0 0 0 0 0 0 0 0 0 0 0 0 0 0 SPN122 Bacteria;Fusobacteria;Fusobacteriia;Fusobacteriales;Leptotrichiaceae;Leptotrichia;sp. HMT215 nov_96.963% 0 0 0 0 0 0 0 7 0 0 0 0 601 1 0 0 32 0 0 0 0 0 0 0 12 0 0 0 0 0 0 0 0 0 0 0 0 0 0 0 0 0 322 0 0 0 0 0 0 25 0 0 0 0 0 0 0 0 0 0 0 0 0 0 862 199 0 0 268 402 0 0 0 0 0 0 0 0 0 0 0 3 0 0 0 0 0 0 0 0 0 0 0 132 0 5 0 362 46 0 0 0 0 0 0 4 0 0 829 0 0 0 1 0 0 0 243 0 0 0 0 0 0 0 0 0 0 0 0 0 0 0 0 0 0 920 754 0 0 83 0 2 0 0 3 0 0 2 0 130 0 6 0 0 0 0 0 0 0 0 0 0 0 0 0 0 0 0 18 0 0 0 17 0 0 0 27 29 0 0 0 0 573 0 0 0 188 0 0 0 0 0 28 0 0 0 0 0 0 108 0 4 0 0 0 0 0 0 0 0 0 0 0 0 0 0 0 0 0 0 0 0 0 0 0 0 250 0 0 0 0 4 0 0 0 1333 0 0 0 0 0 1 9 0 0 0 0 97 1 0 0 132 55 0 0 0 0 0 0 0 0 0 0 0 0 0 0 0 0 0 0 0 0 0 0 0 0 0 0 0 0 0 0 0 0 0 0 0 0 0 0 0 0 0 0 0 0 0 0 0 0 0 0 0 0 0 0 0 0 0 0 0 0 0 0 0 0 0 0 0 0 0 0 0 0 0 0 0 0 0 0 0 0 0 0 0 0 0 0 0 0 0 0 0 0 0 0 0 0 0 0 0 0 0 0 0 0 0 0 0 0 0 0 0 0 0 0 0 0 0 0 0 0 0 0 0 0 0 0 0 0 0 0 0 0 0 0 0 0 0 0 0 0 0 0 0 0 0 0 0 0 0 0 0 0 0 0 0 0 0 0 0 0 0 0 0 0 0 0 0 0 0 0 0 0 0 0 0 0 0 0 0 0 0 0 0 0 0 0 0 0 0 0 0 0 0 0 0 0 0 0 0 0 0 0 0 0 0 0 0 0 0 0 0 0 0 0 0 0 0 0 0 0 0 0 0 0 0 0 0 0 0 0 0 0 0 0 0 0 0 0 0 0 0 0 0 0 0 0 0 0 0 0 0 0 0 0 0 0 0 0 0 0 0 0 0 0 0 0 0 0 0 0 0 0 0 0 0 0 0 0 0 0 0 0 0 0 0 0 0 0 0 0 0 0 0 0 0 0 0 0 0 0 0 0 0 0 0 0 0 0 0 0 0 0 0 0 0 0 0 0 0 0 0 0 0 0 0 0 0 0 0 0 0 0 0 0 0 0 0 0 0 0 0 0 0 0 0 0 0 0 0 0 0 0 0 0 0 0 0 0 0 0 0 0 0 0 0 0 0 0 0 0 0 0 0 0 0 0 0 0 0 0 0 0 0 0 0 0 0 0 0 0 0 0 0 0 0 0 0 0 0 0 0 0 0 0 0 0 0 0 0 0 0 0 0 0 0 0 0 0 0 0 0 0 0 0 0 0 0 0 0 0 0 0 0 0 0 0 0 0 0 0 0 0 0 0 0 0 0 0 0 0 0 0 0 0 0 0 0 0 0 0 0 0 0 0 0 0 0 0 0 0 0 0 0 0 0 0 0 0 0 0 0 0 0 0 0 0 0 0 0 0 0 0 0 0 0 0 0 0 0 0 0 0 0 0 0 0 0 0 0 0 0 0 0 0 0 0 0 0 0 0 0 0 0 0 0 0 0 0 0 0 0 0 0 0 0 0 0 0 0 0 0 0 0 0 0 0 0 0 0 0 0 0 0 0 0 0 0 0 0 0 0 0 0 0 0 0 0 0 0 0 0 0 0 0 0 0 0 0 0 0 0 0 0 0 0 0 0 0 0 0 0 0 0 0 0 0 0 0 0 0 0 0 0 0 0 0 0 0 0 0 0 0 0 0 0 0 0 0 0 0 0 0 0 0 0 0 0 0 0 0 0 0 0 0 0 0 0 0 0 0 0 0 0 0 0 0 0 0 0 0 0 0 0 0 0 0 0 0 0 0 0 0 0 0 0 0 0 0 0 0 0 0 0 0 0 0 0 0 0 0 0 0 0 0 0 0 0 0 0 0 0 0 0 0 0 0 0 0 0 0 0 0 0 0 0 0 0 0 0 0 0 0 0 0 0 0 0 0 0 0 0 0 0 0 0 0 0 0 0 0 0 0 0 0 0 0 0 0 0 0 0 0 0 0 0 0 0 0 0 0 0 0 0 0 0 0 0 0 0 0 0 0 0 0 0 0 0 0 0 0 0 0 0 0 0 0 0 0 0 0 0 0 0 0 0 0 0 0 0 0 0 0 0 0 0 0 0 0 0 0 0 0 0 0 0 0 0 0 0 0 0 0 0 0 0 0 0 0 0 0 0 0 0 0 0 0 0 0 0 0 0 0 0 0 0 0 0 0 0 0 0 0 0 0 0 0 0 0 0 0 0 0 0 0 0 0 0 0 0 0 0 0 0 0 0 0 0 0 0 0 0 0 0 0 0 0 0 0 0 0 0 0 0 0 0 0 0 0 0 0 0 0 0 0 0 0 0 0 0 0 0 0 0 0 0 0 0 0 0 0 0 0 0 0 0 0 0 0 0 0 0 0 0 0 0 0 0 0 0 0 0 0 0 0 0 0 0 0 0 0 0 0 0 0 0 0 0 0 0 0 0 0 0 0 0 0 0 0 0 0 0 0 0 0 0 0 0 0 0 0 0 0 0 0 0 0 0 0 0 0 0 0 0 0 0 0 0 0 0 0 0 0 0 0 0 0 0 0 0 0 0 0 0 0 0 0 0 0 0 0 0 0 0 0 0 0 0 0 0 0 0 0 0 0 0 0 0 0 0 0 0 0 0 0 0 0 0 0 0 0 0 0 0 0 0 0 0 0 0 0 0 0 0 0 0 0 0 0 0 0 0 0 0 0 0 0 0 0 0 0 0 0 0 0 0 0 0 0 0 0 0 0 0 0 0 0 0 0 0 0 0 0 0 0 0 0 0 0 0 0 0 0 0 0 0 0 0 0 0 0 0 0 0 0 0 0 0 0 0 0 0 0 0 0 0 0 0 0 0 0 0 0 0 0 0 0 0 0 0 0 0 0 0 0 0 0 0 0 0 0 0 0 0 0 0 0 0 0 0 0 0 0 0 0 0 0 0 0 0 0 0 0 0 0 0 0 0 0 0 0 0 0 0 0 0 0 0 0 0 0 0 0 0 0 0 0 0 0 0 0 0 0 0 0 0 0 0 0 0 0 0 0 0 0 0 0 0 0 0 0 0 0 0 0 0 0 0 0 0 0 0 0 0 0 0 0 0 0 0 0 0 0 0 0 0 0 0 0 0 0 0 0 0 0 0 0 0 0 0 0 0 0 0 0 0 0 0 0 0 0 0 0 0 0 0 0 0 0 0 0 0 0 0 0 0 0 0 0 0 0 0 0 0 0 0 0 0 0 0 0 0 0 0 0 0 0 0 0 0 0 0 0 0 0 0 0 0 0 0 0 0 0 0 0 0 0 0 0 0 0 0 0 0 0 0 0 0 0 0 0 0 0 0 0 0 0 0 0 0 0 0 0 0 0 0 0 0 0 0 0 0 0 0 0 0 0 0 0 0 0 0 0 0 0 0 0 0 0 0 0 0 0 0 0 0 0 0 0 0 0 0 0 0 0 0 0 0 0 0 0 0 0 0 0 0 0 0 0 0 0 0 0 0 0 0 0 0 0 0 0 0 0 0 0 0 0 0 0 0 0 0 0 0 0 0 0 0 0 0 0 0 0 0 0 0 0 0 0 0 0 0 0 0 0 0 0 0 0 0 0 0 0 0 0 0 0 0 0 0 0 0 0 0 0 0 0 0 0 0 0 0 0 0 0 0 0 0 0 0 0 0 0 0 0 0 0 0 0 0 0 0 0 0 0 0 0 0 0 0 0 0 0 0 0 0 0 0 0 0 0 0 0 0 0 0 0 0 0 0 0 0 0 0 0 0 0 0 0 0 0 0 0 0 0 0 0 0 0 0 0 0 0 0 0 0 0 0 0 0 0 0 0 0 0 0 0 0 0 0 0 0 SPN123 Bacteria;Fusobacteria;Fusobacteriia;Fusobacteriales;Leptotrichiaceae;Streptobacillus;notomytis_nov_93.856% 2 77 0 0 4 11 14 0 20 76 6 896 0 2 12 0 433 0 0 0 0 0 17 9 7 0 0 0 0 0 135 17 18 10 9 14 52 0 0 421 3 66 6 116 3 33 94 0 436 1 6 3 6 0 11 1 0 8 3 0 0 1784 0 1 9 44 19 7 89 0 255 5 69 0 0 45 51 0 0 10 37 25 14 373 0 98 0 70 2 0 30 7 271 6 20 1 1 17 2 14 27 52 25 42 29 3 32 0 3 1 0 4 2 0 30 238 0 0 3 155 0 4 2 10 0 2 7 14 0 1 2 0 1 8 65 8 23 2 0 0 12 21 0 17 1 1 36 9 0 4 0 0 0 0 3 8 0 15 0 8 0 14 4 3 2 0 6 0 0 6 8 0 6 34 0 0 0 0 40 173 0 7 24 1 9 29 0 0 0 12 1 0 5 0 6 206 0 4 93 1 32 0 1 1 3 12 5 0 2 0 1 6 0 0 0 0 20 4 268 0 16 15 31 1 48 0 41 75 0 0 0 6 0 5 0 0 5 1 26 93 3 0 0 12 14 3 2 0 2 0 0 5 2 0 0 0 0 0 0 0 2 0 0 1 88 2 0 0 0 0 0 0 0 0 0 0 0 0 0 0 0 0 0 0 0 0 0 0 0 0 0 0 0 0 0 0 0 0 0 0 0 0 0 0 0 0 0 0 0 0 0 0 0 0 0 0 0 0 0 0 0 0 0 0 0 0 0 0 0 0 0 0 0 0 0 0 0 0 0 0 0 0 0 0 0 0 0 0 0 0 0 0 0 0 0 0 0 0 0 0 0 0 0 0 0 0 0 0 0 0 0 0 0 0 0 0 0 0 0 0 0 0 0 0 0 0 0 0 0 0 0 0 0 0 0 0 0 0 0 0 0 0 0 0 0 0 0 0 0 0 0 0 0 0 0 0 0 0 0 0 0 0 0 0 0 0 0 0 0 0 0 0 0 0 0 0 0 0 0 0 0 0 0 0 0 0 0 0 0 0 0 0 0 0 0 0 0 0 0 0 0 0 0 0 0 0 0 0 0 0 0 0 0 0 0 0 0 0 0 0 0 0 0 0 0 0 0 0 0 0 0 0 0 0 0 0 0 0 0 0 0 0 0 0 0 0 0 0 0 0 0 0 0 0 0 0 0 0 0 0 0 0 0 0 0 0 0 0 0 0 0 0 0 0 0 0 0 0 0 0 0 0 0 0 0 0 0 0 0 0 0 0 0 0 0 0 0 0 0 0 0 0 0 0 0 0 0 0 0 0 0 0 0 0 0 0 0 0 0 0 0 0 0 0 0 0 0 0 0 0 0 0 0 0 0 0 0 0 0 0 0 0 0 0 0 0 0 0 0 0 0 0 0 0 0 0 0 0 0 0 0 0 0 0 0 0 0 0 0 0 0 0 0 0 0 0 0 0 0 0 0 0 0 0 0 0 0 0 0 0 0 0 0 0 0 0 0 0 0 0 0 0 0 0 0 0 0 0 0 0 0 0 0 0 0 0 0 0 0 0 0 0 0 0 0 0 0 0 0 0 0 0 0 0 0 0 0 0 0 0 0 0 0 0 0 0 0 0 0 0 0 0 0 0 0 0 0 0 0 0 0 0 0 0 0 0 0 0 0 0 0 0 0 0 0 0 0 0 0 0 0 0 0 0 0 0 0 0 0 0 0 0 0 0 0 0 0 0 0 0 0 0 0 0 0 0 0 0 0 0 0 0 0 0 0 0 0 0 0 0 0 0 0 0 0 0 0 0 0 0 0 0 0 0 0 0 0 0 0 0 0 0 0 0 0 0 0 0 0 0 0 0 0 0 0 0 0 0 0 0 0 0 0 0 0 0 0 0 0 0 0 0 0 0 0 0 0 0 0 0 0 0 0 0 0 0 0 0 0 0 0 0 0 0 0 0 0 0 0 0 0 0 0 0 0 0 0 0 0 0 0 0 0 0 0 0 0 0 0 0 0 0 0 0 0 0 0 0 0 0 0 0 0 0 0 0 0 0 0 0 0 0 0 0 0 0 0 0 0 0 0 0 0 0 0 0 0 0 0 0 0 0 0 0 0 0 0 0 0 0 0 0 0 0 0 0 0 0 0 0 0 0 0 0 0 0 0 0 0 0 0 0 0 0 0 0 0 0 0 0 0 0 0 0 0 0 0 0 0 0 0 0 0 0 0 0 0 0 0 0 0 0 0 0 0 0 0 0 0 0 0 0 0 0 0 0 0 0 0 0 0 0 0 0 0 0 0 0 0 0 0 0 0 0 0 0 0 0 0 0 0 0 0 0 0 0 0 0 0 0 0 0 0 0 0 0 0 0 0 0 0 0 0 0 0 0 0 0 0 0 0 0 0 0 0 0 0 0 0 0 0 0 0 0 0 0 0 0 0 0 0 0 0 0 0 0 0 0 0 0 0 0 0 0 0 0 0 0 0 0 0 0 0 0 0 0 0 0 0 0 0 0 0 0 0 0 0 0 0 0 0 0 0 0 0 0 0 0 0 0 0 0 0 0 0 0 0 0 0 0 0 0 0 0 0 0 0 0 0 0 0 0 0 0 0 0 0 0 0 0 0 0 0 0 0 0 0 0 0 0 0 0 0 0 0 0 0 0 0 0 0 0 0 0 0 0 0 0 0 0 0 0 0 0 0 0 0 0 0 0 0 0 0 0 0 0 0 0 0 0 0 0 0 0 0 0 0 0 0 0 0 0 0 0 0 0 0 0 0 0 0 0 0 0 0 0 0 0 0 0 0 0 0 0 0 0 0 0 0 0 0 0 0 0 0 0 0 0 0 0 0 0 0 0 0 0 0 0 0 0 0 0 0 0 0 0 0 0 0 0 0 0 0 0 0 0 0 0 0 0 0 0 0 0 0 0 0 0 0 0 0 0 0 0 0 0 0 0 0 0 0 0 0 0 0 0 0 0 0 0 0 0 0 0 0 0 0 0 0 0 0 0 0 0 0 0 0 0 0 0 0 0 0 0 0 0 0 0 0 0 0 0 0 0 0 0 0 0 0 0 0 0 0 0 0 0 0 0 0 0 0 0 0 0 0 0 0 0 0 0 0 0 0 0 0 0 0 0 0 0 0 0 0 0 0 0 0 0 0 0 0 0 0 0 0 0 0 0 0 0 0 0 0 0 0 0 0 0 0 0 0 0 0 0 0 0 0 0 0 0 0 0 0 0 0 0 0 0 0 0 0 0 0 0 0 0 0 0 0 0 0 0 0 0 0 0 0 0 0 0 0 0 0 0 0 0 0 0 0 0 0 0 0 0 0 0 0 0 0 0 0 0 0 0 0 0 0 0 0 0 0 0 0 0 0 0 0 0 0 0 0 0 0 0 0 0 0 0 0 0 0 0 0 0 0 0 0 0 0 0 0 0 0 0 0 0 0 0 0 0 0 0 0 0 0 0 0 0 0 0 0 0 0 0 0 0 0 0 0 0 0 0 0 0 0 0 0 0 0 0 0 0 0 0 0 0 0 0 0 0 0 0 0 0 0 0 0 0 0 0 0 0 0 0 0 0 0 0 0 0 0 0 0 0 0 0 0 0 0 0 0 0 0 0 0 0 0 0 0 0 0 0 0 0 0 0 0 0 0 0 0 0 0 0 0 0 0 0 0 0 0 0 0 0 0 0 0 0 0 0 0 0 0 0 0 0 0 0 0 0 0 0 0 0 0 0 0 0 0 0 0 0 0 0 0 0 0 0 0 0 0 0 0 0 0 0 0 0 0 0 0 0 0 0 0 0 0 0 0 0 0 0 0 0 0 0 0 0 0 0 0 0 0 0 0 0 0 0 0 0 0 0 0 0 0 0 0 0 0 0 0 0 0 0 0 0 0 0 0 0 0 0 0 0 0 0 0 0 0 0 0 0 0 0 0 0 0 0 0 0 0 0 0 0 0 0 0 0 0 0 0 0 0 0 0 0 0 0 0 0 0 0 0 0 0 0 0 0 0 0 0 0 0 0 0 0 0 0 0 0 0 0 0 0 0 0 0 0 0 0 0 0 0 0 0 0 0 0 0 0 0 0 0 0 0 0 0 0 0 0 0 0 0 0 0 0 0 0 0 0 0 0 0 0 SPN124 Bacteria;Firmicutes;Bacilli;Lactobacillales;Streptococcaceae;Streptococcus;oralis_subsp._dentisani_clade_398_nov_83.903% 0 41 6 9 208 13 21 14 0 31 0 56 156 12 64 10 29 59 22 23 55 82 20 14 70 7 26 23 90 50 21 27 8 56 70 203 15 21 132 31 34 48 26 34 28 29 57 124 1 11 11 0 11 60 43 30 8 20 17 30 45 16 102 70 63 25 15 23 64 92 46 44 100 11 3 11 7 11 26 35 6 104 6 46 4 0 116 9 0 19 6 24 22 42 7 11 26 91 12 4 2 19 19 26 1 91 29 24 52 37 51 12 0 19 42 67 30 43 27 22 177 25 56 92 79 12 24 59 32 17 25 100 0 197 39 76 100 23 2 74 13 22 10 24 40 7 31 62 6 33 26 30 81 24 6 2 15 2 104 6 6 13 24 30 2 1 0 3 5 2 151 0 5 55 0 5 2 4 16 10 42 16 34 83 23 60 25 212 11 18 11 7 5 6 14 14 139 25 15 89 38 7 38 20 1 15 17 2 23 0 2 75 22 51 73 17 4 0 3 7 59 8 3 7 48 23 62 48 59 18 19 4 51 39 74 6 18 2 33 12 3 85 23 6 1 6 3 20 13 70 12 5 3 1 0 1 2 2 1 2 11 12 2 7 28 0 28 18 0 0 0 0 0 0 0 0 0 0 0 0 0 0 0 0 0 0 0 0 0 0 0 0 0 0 0 0 0 0 0 0 0 0 0 0 0 0 0 0 0 0 0 0 0 0 0 0 0 0 0 0 0 0 0 0 0 0 0 0 0 0 0 0 0 0 0 0 0 0 0 0 0 0 0 0 0 0 0 0 0 0 0 0 0 0 0 0 0 0 0 0 0 0 0 0 0 0 0 0 0 0 0 0 0 0 0 0 0 0 0 0 0 0 0 0 0 0 0 0 0 0 0 0 0 0 0 0 0 0 0 0 0 0 0 0 0 0 0 0 0 0 0 0 0 0 0 0 0 0 0 0 0 0 0 0 0 0 0 0 0 0 0 0 0 0 0 0 0 0 0 0 0 0 0 0 0 0 0 0 0 0 0 0 0 0 0 0 0 0 0 0 0 0 0 0 0 0 0 0 0 0 0 0 0 0 0 0 0 0 0 0 0 0 0 0 0 0 0 0 0 0 0 0 0 0 0 0 0 0 0 0 0 0 0 0 0 0 0 0 0 0 0 0 0 0 0 0 0 0 0 0 0 0 0 0 0 0 0 0 0 0 0 0 0 0 0 0 0 0 0 0 0 0 0 0 0 0 0 0 0 0 0 0 0 0 0 0 0 0 0 0 0 0 0 0 0 0 0 0 0 0 0 0 0 0 0 0 0 0 0 0 0 0 0 0 0 0 0 0 0 0 0 0 0 0 0 0 0 0 0 0 0 0 0 0 0 0 0 0 0 0 0 0 0 0 0 0 0 0 0 0 0 0 0 0 0 0 0 0 0 0 0 0 0 0 0 0 0 0 0 0 0 0 0 0 0 0 0 0 0 0 0 0 0 0 0 0 0 0 0 0 0 0 0 0 0 0 0 0 0 0 0 0 0 0 0 0 0 0 0 0 0 0 0 0 0 0 0 0 0 0 0 0 0 0 0 0 0 0 0 0 0 0 0 0 0 0 0 0 0 0 0 0 0 0 0 0 0 0 0 0 0 0 0 0 0 0 0 0 0 0 0 0 0 0 0 0 0 0 0 0 0 0 0 0 0 0 0 0 0 0 0 0 0 0 0 0 0 0 0 0 0 0 0 0 0 0 0 0 0 0 0 0 0 0 0 0 0 0 0 0 0 0 0 0 0 0 0 0 0 0 0 0 0 0 0 0 0 0 0 0 0 0 0 0 0 0 0 0 0 0 0 0 0 0 0 0 0 0 0 0 0 0 0 0 0 0 0 0 0 0 0 0 0 0 0 0 0 0 0 0 0 0 0 0 0 0 0 0 0 0 0 0 0 0 0 0 0 0 0 0 0 0 0 0 0 0 0 0 0 0 0 0 0 0 0 0 0 0 0 0 0 0 0 0 0 0 0 0 0 0 0 0 0 0 0 0 0 0 0 0 0 0 0 0 0 0 0 0 0 0 0 0 0 0 0 0 0 0 0 0 0 0 0 0 0 0 0 0 0 0 0 0 0 0 0 0 0 0 0 0 0 0 0 0 0 0 0 0 0 0 0 0 0 0 0 0 0 0 0 0 0 0 0 0 0 0 0 0 0 0 0 0 0 0 0 0 0 0 0 0 0 0 0 0 0 0 0 0 0 0 0 0 0 0 0 0 0 0 0 0 0 0 0 0 0 0 0 0 0 0 0 0 0 0 0 0 0 0 0 0 0 0 0 0 0 0 0 0 0 0 0 0 0 0 0 0 0 0 0 0 0 0 0 0 0 0 0 0 0 0 0 0 0 0 0 0 0 0 0 0 0 0 0 0 0 0 0 0 0 0 0 0 0 0 0 0 0 0 0 0 0 0 0 0 0 0 0 0 0 0 0 0 0 0 0 0 0 0 0 0 0 0 0 0 0 0 0 0 0 0 0 0 0 0 0 0 0 0 0 0 0 0 0 0 0 0 0 0 0 0 0 0 0 0 0 0 0 0 0 0 0 0 0 0 0 0 0 0 0 0 0 0 0 0 0 0 0 0 0 0 0 0 0 0 0 0 0 0 0 0 0 0 0 0 0 0 0 0 0 0 0 0 0 0 0 0 0 0 0 0 0 0 0 0 0 0 0 0 0 0 0 0 0 0 0 0 0 0 0 0 0 0 0 0 0 0 0 0 0 0 0 0 0 0 0 0 0 0 0 0 0 0 0 0 0 0 0 0 0 0 0 0 0 0 0 0 0 0 0 0 0 0 0 0 0 0 0 0 0 0 0 0 0 0 0 0 0 0 0 0 0 0 0 0 0 0 0 0 0 0 0 0 0 0 0 0 0 0 0 0 0 0 0 0 0 0 0 0 0 0 0 0 0 0 0 0 0 0 0 0 0 0 0 0 0 0 0 0 0 0 0 0 0 0 0 0 0 0 0 0 0 0 0 0 0 0 0 0 0 0 0 0 0 0 0 0 0 0 0 0 0 0 0 0 0 0 0 0 0 0 0 0 0 0 0 0 0 0 0 0 0 0 0 0 0 0 0 0 0 0 0 0 0 0 0 0 0 0 0 0 0 0 0 0 0 0 0 0 0 0 0 0 0 0 0 0 0 0 0 0 0 0 0 0 0 0 0 0 0 0 0 0 0 0 0 0 0 0 0 0 0 0 0 0 0 0 0 0 0 0 0 0 0 0 0 0 0 0 0 0 0 0 0 0 0 0 0 0 0 0 0 0 0 0 0 0 0 0 0 0 0 0 0 0 0 0 0 0 0 0 0 0 0 0 0 0 0 0 0 0 0 0 0 0 0 0 0 0 0 0 0 0 0 0 0 0 0 0 0 0 0 0 0 0 0 0 0 0 0 0 0 0 0 0 0 0 0 0 0 0 0 0 0 0 0 0 0 0 0 0 0 0 0 0 0 0 0 0 0 0 0 0 0 0 0 0 0 0 0 0 0 0 0 0 0 0 0 0 0 0 0 0 0 0 0 0 0 0 0 0 0 0 0 0 0 0 0 0 0 0 0 0 0 0 0 0 0 0 0 0 0 0 0 0 0 0 0 0 0 0 0 0 0 0 0 0 0 0 0 0 0 0 0 0 0 0 0 0 0 0 0 0 0 0 0 0 0 0 0 0 0 0 0 0 0 0 0 0 0 0 0 0 0 0 0 0 0 0 0 0 0 0 0 0 0 0 0 0 0 0 0 0 0 0 0 0 0 0 0 0 0 0 0 0 0 0 0 0 0 0 0 0 0 0 0 0 0 0 0 0 0 0 0 0 0 0 0 0 0 0 0 0 0 0 0 0 0 0 0 0 0 0 0 0 0 0 0 0 0 0 0 0 0 0 0 0 0 0 0 0 0 0 0 0 0 0 0 0 0 0 0 0 0 0 0 0 0 0 0 0 0 0 0 0 0 0 0 0 0 0 0 0 0 0 0 0 0 0 0 0 0 0 0 0 0 0 0 0 0 0 0 0 0 0 0 0 0 0 0 0 0 0 0 0 0 0 0 0 0 0 0 0 0 0 0 0 0 0 0 0 0 0 0 0 SPN125 Bacteria;Actinobacteria;Actinomycetia;Micrococcales;Microbacteriaceae;Curtobacterium;herbarum_nov_84.725% 0 14 0 31 1 20 7 37 24 20 2 12 16 7 139 0 5 3 37 22 27 0 5 3 4 4 8 3 47 17 6 1 9 113 21 4 1 0 13 4 5 11 146 1 29 13 59 1 2 131 0 0 0 7 53 23 4 27 2 14 8 16 46 10 63 2 6 1 11 29 11 64 95 3 2 6 6 5 10 2 57 25 8 8 45 0 10 7 0 5 17 0 73 85 7 23 14 26 30 3 1 12 11 5 0 41 63 1 15 0 45 4 0 12 4 13 8 29 1 92 34 12 65 58 19 3 6 18 7 4 49 7 0 62 36 28 0 2 2 44 8 3 4 61 1 4 3 12 14 39 0 50 91 3 0 0 4 19 92 2 82 9 27 0 6 9 462 89 74 5 2 10 3 36 83 0 1 0 536 110 2 8 33 13 16 74 7 31 26 91 41 4 19 0 1 0 25 11 10 146 147 58 34 107 239 0 2 0 105 35 8 116 95 56 14 76 4 11 0 48 3 17 8 35 5 182 38 198 43 10 19 17 14 172 19 52 48 12 10 209 38 23 0 7 2 4 15 36 18 0 0 44 13 3 1 0 1 1 3 3 0 3 0 4 0 0 8 0 0 0 0 0 0 0 0 0 0 0 0 0 0 0 0 0 0 0 0 0 0 0 0 0 0 0 0 0 0 0 0 0 0 0 0 0 0 0 0 0 0 0 0 0 0 0 0 0 0 0 0 0 0 0 0 0 0 0 0 0 0 0 0 0 0 0 0 0 0 0 0 0 0 0 0 0 0 0 0 0 0 0 0 0 0 0 0 0 0 0 0 0 0 0 0 0 0 0 0 0 0 0 0 0 0 0 0 0 0 0 0 0 0 0 0 0 0 0 0 0 0 0 0 0 0 0 0 0 0 0 0 0 0 0 0 0 0 0 0 0 0 0 0 0 0 0 0 0 0 0 0 0 0 0 0 0 0 0 0 0 0 0 0 0 0 0 0 0 0 0 0 0 0 0 0 0 0 0 0 0 0 0 0 0 0 0 0 0 0 0 0 0 0 0 0 0 0 0 0 0 0 0 0 0 0 0 0 0 0 0 0 0 0 0 0 0 0 0 0 0 0 0 0 0 0 0 0 0 0 0 0 0 0 0 0 0 0 0 0 0 0 0 0 0 0 0 0 0 0 0 0 0 0 0 0 0 0 0 0 0 0 0 0 0 0 0 0 0 0 0 0 0 0 0 0 0 0 0 0 0 0 0 0 0 0 0 0 0 0 0 0 0 0 0 0 0 0 0 0 0 0 0 0 0 0 0 0 0 0 0 0 0 0 0 0 0 0 0 0 0 0 0 0 0 0 0 0 0 0 0 0 0 0 0 0 0 0 0 0 0 0 0 0 0 0 0 0 0 0 0 0 0 0 0 0 0 0 0 0 0 0 0 0 0 0 0 0 0 0 0 0 0 0 0 0 0 0 0 0 0 0 0 0 0 0 0 0 0 0 0 0 0 0 0 0 0 0 0 0 0 0 0 0 0 0 0 0 0 0 0 0 0 0 0 0 0 0 0 0 0 0 0 0 0 0 0 0 0 0 0 0 0 0 0 0 0 0 0 0 0 0 0 0 0 0 0 0 0 0 0 0 0 0 0 0 0 0 0 0 0 0 0 0 0 0 0 0 0 0 0 0 0 0 0 0 0 0 0 0 0 0 0 0 0 0 0 0 0 0 0 0 0 0 0 0 0 0 0 0 0 0 0 0 0 0 0 0 0 0 0 0 0 0 0 0 0 0 0 0 0 0 0 0 0 0 0 0 0 0 0 0 0 0 0 0 0 0 0 0 0 0 0 0 0 0 0 0 0 0 0 0 0 0 0 0 0 0 0 0 0 0 0 0 0 0 0 0 0 0 0 0 0 0 0 0 0 0 0 0 0 0 0 0 0 0 0 0 0 0 0 0 0 0 0 0 0 0 0 0 0 0 0 0 0 0 0 0 0 0 0 0 0 0 0 0 0 0 0 0 0 0 0 0 0 0 0 0 0 0 0 0 0 0 0 0 0 0 0 0 0 0 0 0 0 0 0 0 0 0 0 0 0 0 0 0 0 0 0 0 0 0 0 0 0 0 0 0 0 0 0 0 0 0 0 0 0 0 0 0 0 0 0 0 0 0 0 0 0 0 0 0 0 0 0 0 0 0 0 0 0 0 0 0 0 0 0 0 0 0 0 0 0 0 0 0 0 0 0 0 0 0 0 0 0 0 0 0 0 0 0 0 0 0 0 0 0 0 0 0 0 0 0 0 0 0 0 0 0 0 0 0 0 0 0 0 0 0 0 0 0 0 0 0 0 0 0 0 0 0 0 0 0 0 0 0 0 0 0 0 0 0 0 0 0 0 0 0 0 0 0 0 0 0 0 0 0 0 0 0 0 0 0 0 0 0 0 0 0 0 0 0 0 0 0 0 0 0 0 0 0 0 0 0 0 0 0 0 0 0 0 0 0 0 0 0 0 0 0 0 0 0 0 0 0 0 0 0 0 0 0 0 0 0 0 0 0 0 0 0 0 0 0 0 0 0 0 0 0 0 0 0 0 0 0 0 0 0 0 0 0 0 0 0 0 0 0 0 0 0 0 0 0 0 0 0 0 0 0 0 0 0 0 0 0 0 0 0 0 0 0 0 0 0 0 0 0 0 0 0 0 0 0 0 0 0 0 0 0 0 0 0 0 0 0 0 0 0 0 0 0 0 0 0 0 0 0 0 0 0 0 0 0 0 0 0 0 0 0 0 0 0 0 0 0 0 0 0 0 0 0 0 0 0 0 0 0 0 0 0 0 0 0 0 0 0 0 0 0 0 0 0 0 0 0 0 0 0 0 0 0 0 0 0 0 0 0 0 0 0 0 0 0 0 0 0 0 0 0 0 0 0 0 0 0 0 0 0 0 0 0 0 0 0 0 0 0 0 0 0 0 0 0 0 0 0 0 0 0 0 0 0 0 0 0 0 0 0 0 0 0 0 0 0 0 0 0 0 0 0 0 0 0 0 0 0 0 0 0 0 0 0 0 0 0 0 0 0 0 0 0 0 0 0 0 0 0 0 0 0 0 0 0 0 0 0 0 0 0 0 0 0 0 0 0 0 0 0 0 0 0 0 0 0 0 0 0 0 0 0 0 0 0 0 0 0 0 0 0 0 0 0 0 0 0 0 0 0 0 0 0 0 0 0 0 0 0 0 0 0 0 0 0 0 0 0 0 0 0 0 0 0 0 0 0 0 0 0 0 0 0 0 0 0 0 0 0 0 0 0 0 0 0 0 0 0 0 0 0 0 0 0 0 0 0 0 0 0 0 0 0 0 0 0 0 0 0 0 0 0 0 0 0 0 0 0 0 0 0 0 0 0 0 0 0 0 0 0 0 0 0 0 0 0 0 0 0 0 0 0 0 0 0 0 0 0 0 0 0 0 0 0 0 0 0 0 0 0 0 0 0 0 0 0 0 0 0 0 0 0 0 0 0 0 0 0 0 0 0 0 0 0 0 0 0 0 0 0 0 0 0 0 0 0 0 0 0 0 0 0 0 0 0 0 0 0 0 0 0 0 0 0 0 0 0 0 0 0 0 0 0 0 0 0 0 0 0 0 0 0 0 0 0 0 0 0 0 0 0 0 0 0 0 0 0 0 0 0 0 0 0 0 0 0 0 0 0 0 0 0 0 0 0 0 0 0 0 0 0 0 0 0 0 0 0 0 0 0 0 0 0 0 0 0 0 0 0 0 0 0 0 0 0 0 0 0 0 0 0 0 0 0 0 0 0 0 0 0 0 0 0 0 0 0 0 0 0 0 0 0 0 0 0 0 0 0 0 0 0 0 0 0 0 0 0 0 0 0 0 0 0 0 0 0 0 0 0 0 0 0 0 0 0 0 0 0 0 0 0 0 0 0 0 0 0 0 0 0 0 0 0 0 0 0 0 0 0 0 0 0 0 0 0 0 0 0 0 0 0 0 0 0 0 0 0 0 0 0 0 0 0 0 0 0 0 0 0 0 0 0 0 0 0 0 0 0 0 0 0 0 0 0 0 0 0 0 0 0 0 0 0 0 0 0 0 0 0 0 0 0 0 0 0 0 0 0 0 SPN126 Bacteria;Firmicutes;Bacilli;Bacillales;Gemellaceae;Gemella;haemolysans_nov_93.400% 55 61 14 0 127 9 0 16 5 6 38 30 21 69 5 58 13 36 18 34 30 17 4 62 34 41 16 22 30 65 17 49 130 9 52 105 29 49 19 9 30 47 18 14 0 4 12 46 48 31 4 6 18 38 12 20 27 48 21 59 17 27 20 0 24 51 13 4 69 24 13 21 30 13 33 198 20 37 25 25 49 18 56 55 7 25 20 24 90 2 22 7 11 13 30 64 18 33 37 24 49 16 19 40 86 14 6 31 21 32 28 9 6 53 32 19 0 8 7 15 22 23 2 39 3 36 6 35 3 23 34 19 158 44 5 32 51 21 4 16 24 65 26 67 50 57 21 67 33 15 16 14 25 67 32 89 14 33 7 10 50 51 1 21 53 17 36 22 64 11 2 22 39 53 9 34 77 97 9 21 7 15 46 25 8 76 26 4 37 7 33 120 41 48 25 32 34 24 29 16 36 4 12 16 0 6 14 21 15 0 7 4 63 25 11 15 13 12 23 15 9 8 7 54 4 8 8 20 87 4 3 15 82 3 3 14 10 32 12 11 38 14 2 8 29 27 41 25 8 19 4 19 21 14 20 13 123 22 13 11 72 18 90 29 18 11 6 36 0 0 0 0 0 0 0 0 0 0 0 0 0 0 0 0 0 0 0 0 0 0 0 0 0 0 0 0 0 0 0 0 0 0 0 0 0 0 0 0 0 0 0 0 0 0 0 0 0 0 0 0 0 0 0 0 0 0 0 0 0 0 0 0 0 0 0 0 0 0 0 0 0 0 0 0 0 0 0 0 0 0 0 0 0 0 0 0 0 0 0 0 0 0 0 0 0 0 0 0 0 0 0 0 0 0 0 0 0 0 0 0 0 0 0 0 0 0 0 0 0 0 0 0 0 0 0 0 0 0 0 0 0 0 0 0 0 0 0 0 0 0 0 0 0 0 0 0 0 0 0 0 0 0 0 0 0 0 0 0 0 0 0 0 0 0 0 0 0 0 0 0 0 0 0 0 0 0 0 0 0 0 0 0 0 0 0 0 0 0 0 0 0 0 0 0 0 0 0 0 0 0 0 0 0 0 0 0 0 0 0 0 0 0 0 0 0 0 0 0 0 0 0 0 0 0 0 0 0 0 0 0 0 0 0 0 0 0 0 0 0 0 0 0 0 0 0 0 0 0 0 0 0 0 0 0 0 0 0 0 0 0 0 0 0 0 0 0 0 0 0 0 0 0 0 0 0 0 0 0 0 0 0 0 0 0 0 0 0 0 0 0 0 0 0 0 0 0 0 0 0 0 0 0 0 0 0 0 0 0 0 0 0 0 0 0 0 0 0 0 0 0 0 0 0 0 0 0 0 0 0 0 0 0 0 0 0 0 0 0 0 0 0 0 0 0 0 0 0 0 0 0 0 0 0 0 0 0 0 0 0 0 0 0 0 0 0 0 0 0 0 0 0 0 0 0 0 0 0 0 0 0 0 0 0 0 0 0 0 0 0 0 0 0 0 0 0 0 0 0 0 0 0 0 0 0 0 0 0 0 0 0 0 0 0 0 0 0 0 0 0 0 0 0 0 0 0 0 0 0 0 0 0 0 0 0 0 0 0 0 0 0 0 0 0 0 0 0 0 0 0 0 0 0 0 0 0 0 0 0 0 0 0 0 0 0 0 0 0 0 0 0 0 0 0 0 0 0 0 0 0 0 0 0 0 0 0 0 0 0 0 0 0 0 0 0 0 0 0 0 0 0 0 0 0 0 0 0 0 0 0 0 0 0 0 0 0 0 0 0 0 0 0 0 0 0 0 0 0 0 0 0 0 0 0 0 0 0 0 0 0 0 0 0 0 0 0 0 0 0 0 0 0 0 0 0 0 0 0 0 0 0 0 0 0 0 0 0 0 0 0 0 0 0 0 0 0 0 0 0 0 0 0 0 0 0 0 0 0 0 0 0 0 0 0 0 0 0 0 0 0 0 0 0 0 0 0 0 0 0 0 0 0 0 0 0 0 0 0 0 0 0 0 0 0 0 0 0 0 0 0 0 0 0 0 0 0 0 0 0 0 0 0 0 0 0 0 0 0 0 0 0 0 0 0 0 0 0 0 0 0 0 0 0 0 0 0 0 0 0 0 0 0 0 0 0 0 0 0 0 0 0 0 0 0 0 0 0 0 0 0 0 0 0 0 0 0 0 0 0 0 0 0 0 0 0 0 0 0 0 0 0 0 0 0 0 0 0 0 0 0 0 0 0 0 0 0 0 0 0 0 0 0 0 0 0 0 0 0 0 0 0 0 0 0 0 0 0 0 0 0 0 0 0 0 0 0 0 0 0 0 0 0 0 0 0 0 0 0 0 0 0 0 0 0 0 0 0 0 0 0 0 0 0 0 0 0 0 0 0 0 0 0 0 0 0 0 0 0 0 0 0 0 0 0 0 0 0 0 0 0 0 0 0 0 0 0 0 0 0 0 0 0 0 0 0 0 0 0 0 0 0 0 0 0 0 0 0 0 0 0 0 0 0 0 0 0 0 0 0 0 0 0 0 0 0 0 0 0 0 0 0 0 0 0 0 0 0 0 0 0 0 0 0 0 0 0 0 0 0 0 0 0 0 0 0 0 0 0 0 0 0 0 0 0 0 0 0 0 0 0 0 0 0 0 0 0 0 0 0 0 0 0 0 0 0 0 0 0 0 0 0 0 0 0 0 0 0 0 0 0 0 0 0 0 0 0 0 0 0 0 0 0 0 0 0 0 0 0 0 0 0 0 0 0 0 0 0 0 0 0 0 0 0 0 0 0 0 0 0 0 0 0 0 0 0 0 0 0 0 0 0 0 0 0 0 0 0 0 0 0 0 0 0 0 0 0 0 0 0 0 0 0 0 0 0 0 0 0 0 0 0 0 0 0 0 0 0 0 0 0 0 0 0 0 0 0 0 0 0 0 0 0 0 0 0 0 0 0 0 0 0 0 0 0 0 0 0 0 0 0 0 0 0 0 0 0 0 0 0 0 0 0 0 0 0 0 0 0 0 0 0 0 0 0 0 0 0 0 0 0 0 0 0 0 0 0 0 0 0 0 0 0 0 0 0 0 0 0 0 0 0 0 0 0 0 0 0 0 0 0 0 0 0 0 0 0 0 0 0 0 0 0 0 0 0 0 0 0 0 0 0 0 0 0 0 0 0 0 0 0 0 0 0 0 0 0 0 0 0 0 0 0 0 0 0 0 0 0 0 0 0 0 0 0 0 0 0 0 0 0 0 0 0 0 0 0 0 0 0 0 0 0 0 0 0 0 0 0 0 0 0 0 0 0 0 0 0 0 0 0 0 0 0 0 0 0 0 0 0 0 0 0 0 0 0 0 0 0 0 0 0 0 0 0 0 0 0 0 0 0 0 0 0 0 0 0 0 0 0 0 0 0 0 0 0 0 0 0 0 0 0 0 0 0 0 0 0 0 0 0 0 0 0 0 0 0 0 0 0 0 0 0 0 0 0 0 0 0 0 0 0 0 0 0 0 0 0 0 0 0 0 0 0 0 0 0 0 0 0 0 0 0 0 0 0 0 0 0 0 0 0 0 0 0 0 0 0 0 0 0 0 0 0 0 0 0 0 0 0 0 0 0 0 0 0 0 0 0 0 0 0 0 0 0 0 0 0 0 0 0 0 0 0 0 0 0 0 0 0 0 0 0 0 0 0 0 0 0 0 0 0 0 0 0 0 0 0 0 0 0 0 0 0 0 0 0 0 0 0 0 0 0 0 0 0 0 0 0 0 0 0 0 0 0 0 0 0 0 0 0 0 0 0 0 0 0 0 0 0 0 0 0 0 0 0 0 0 0 0 0 0 0 0 0 0 0 0 0 0 0 0 0 0 0 0 0 0 0 0 0 0 0 0 0 0 0 0 0 0 0 0 0 0 0 0 0 0 0 0 0 0 0 0 0 0 0 0 0 0 0 0 0 0 0 0 0 0 0 0 0 0 0 0 0 0 0 0 0 0 0 0 0 0 0 0 0 0 0 0 0 0 0 0 0 0 0 0 0 0 0 0 0 0 0 0 0 0 0 0 0 0 0 0 0 0 0 0 0 0 0 0 0 0 0 0 0 0 0 0 0 0 0 0 0 0 SPN127 Bacteria;Firmicutes;Bacilli;Lactobacillales;Carnobacteriaceae;Granulicatella;adiacens_nov_97.782% 19 83 30 25 1 10 66 20 25 14 14 7 17 39 3 27 39 26 22 6 4 54 34 3 23 31 69 41 19 10 35 30 6 21 58 31 25 7 17 9 7 19 18 14 47 8 9 19 12 40 8 34 57 76 27 23 21 26 11 23 32 5 20 7 41 25 25 14 32 12 7 26 84 14 44 13 29 7 19 36 29 30 66 5 15 123 37 25 33 2 3 30 2 21 30 15 1 13 24 44 57 8 65 28 1 7 24 3 10 25 25 45 10 12 7 11 15 14 18 8 17 27 19 13 35 39 31 30 16 12 16 8 65 11 30 17 12 16 26 31 14 4 1 45 3 20 12 17 13 62 19 82 43 58 16 25 5 24 21 48 17 11 18 25 51 62 17 48 1 33 0 42 28 41 23 23 79 63 42 24 12 48 8 22 13 36 35 16 15 26 70 8 29 13 46 20 28 7 17 11 8 9 19 8 22 0 5 2 31 60 5 47 35 40 48 17 8 34 1 21 5 47 7 35 18 21 11 9 15 5 23 45 41 24 35 20 20 26 26 21 17 13 20 35 5 26 16 17 17 34 15 10 22 19 56 28 47 122 14 17 17 35 61 19 47 49 17 23 0 0 0 0 0 0 0 0 0 0 0 0 0 0 0 0 0 0 0 0 0 0 0 0 0 0 0 0 0 0 0 0 0 0 0 0 0 0 0 0 0 0 0 0 0 0 0 0 0 0 0 0 0 0 0 0 0 0 0 0 0 0 0 0 0 0 0 0 0 0 0 0 0 0 0 0 0 0 0 0 0 0 0 0 0 0 0 0 0 0 0 0 0 0 0 0 0 0 0 0 0 0 0 0 0 0 0 0 0 0 0 0 0 0 0 0 0 0 0 0 0 0 0 0 0 0 0 0 0 0 0 0 0 0 0 0 0 0 0 0 0 0 0 0 0 0 0 0 0 0 0 0 0 0 0 0 0 0 0 0 0 0 0 0 0 0 0 0 0 0 0 0 0 0 0 0 0 0 0 0 0 0 0 0 0 0 0 0 0 0 0 0 0 0 0 0 0 0 0 0 0 0 0 0 0 0 0 0 0 0 0 0 0 0 0 0 0 0 0 0 0 0 0 0 0 0 0 0 0 0 0 0 0 0 0 0 0 0 0 0 0 0 0 0 0 0 0 0 0 0 0 0 0 0 0 0 0 0 0 0 0 0 0 0 0 0 0 0 0 0 0 0 0 0 0 0 0 0 0 0 0 0 0 0 0 0 0 0 0 0 0 0 0 0 0 0 0 0 0 0 0 0 0 0 0 0 0 0 0 0 0 0 0 0 0 0 0 0 0 0 0 0 0 0 0 0 0 0 0 0 0 0 0 0 0 0 0 0 0 0 0 0 0 0 0 0 0 0 0 0 0 0 0 0 0 0 0 0 0 0 0 0 0 0 0 0 0 0 0 0 0 0 0 0 0 0 0 0 0 0 0 0 0 0 0 0 0 0 0 0 0 0 0 0 0 0 0 0 0 0 0 0 0 0 0 0 0 0 0 0 0 0 0 0 0 0 0 0 0 0 0 0 0 0 0 0 0 0 0 0 0 0 0 0 0 0 0 0 0 0 0 0 0 0 0 0 0 0 0 0 0 0 0 0 0 0 0 0 0 0 0 0 0 0 0 0 0 0 0 0 0 0 0 0 0 0 0 0 0 0 0 0 0 0 0 0 0 0 0 0 0 0 0 0 0 0 0 0 0 0 0 0 0 0 0 0 0 0 0 0 0 0 0 0 0 0 0 0 0 0 0 0 0 0 0 0 0 0 0 0 0 0 0 0 0 0 0 0 0 0 0 0 0 0 0 0 0 0 0 0 0 0 0 0 0 0 0 0 0 0 0 0 0 0 0 0 0 0 0 0 0 0 0 0 0 0 0 0 0 0 0 0 0 0 0 0 0 0 0 0 0 0 0 0 0 0 0 0 0 0 0 0 0 0 0 0 0 0 0 0 0 0 0 0 0 0 0 0 0 0 0 0 0 0 0 0 0 0 0 0 0 0 0 0 0 0 0 0 0 0 0 0 0 0 0 0 0 0 0 0 0 0 0 0 0 0 0 0 0 0 0 0 0 0 0 0 0 0 0 0 0 0 0 0 0 0 0 0 0 0 0 0 0 0 0 0 0 0 0 0 0 0 0 0 0 0 0 0 0 0 0 0 0 0 0 0 0 0 0 0 0 0 0 0 0 0 0 0 0 0 0 0 0 0 0 0 0 0 0 0 0 0 0 0 0 0 0 0 0 0 0 0 0 0 0 0 0 0 0 0 0 0 0 0 0 0 0 0 0 0 0 0 0 0 0 0 0 0 0 0 0 0 0 0 0 0 0 0 0 0 0 0 0 0 0 0 0 0 0 0 0 0 0 0 0 0 0 0 0 0 0 0 0 0 0 0 0 0 0 0 0 0 0 0 0 0 0 0 0 0 0 0 0 0 0 0 0 0 0 0 0 0 0 0 0 0 0 0 0 0 0 0 0 0 0 0 0 0 0 0 0 0 0 0 0 0 0 0 0 0 0 0 0 0 0 0 0 0 0 0 0 0 0 0 0 0 0 0 0 0 0 0 0 0 0 0 0 0 0 0 0 0 0 0 0 0 0 0 0 0 0 0 0 0 0 0 0 0 0 0 0 0 0 0 0 0 0 0 0 0 0 0 0 0 0 0 0 0 0 0 0 0 0 0 0 0 0 0 0 0 0 0 0 0 0 0 0 0 0 0 0 0 0 0 0 0 0 0 0 0 0 0 0 0 0 0 0 0 0 0 0 0 0 0 0 0 0 0 0 0 0 0 0 0 0 0 0 0 0 0 0 0 0 0 0 0 0 0 0 0 0 0 0 0 0 0 0 0 0 0 0 0 0 0 0 0 0 0 0 0 0 0 0 0 0 0 0 0 0 0 0 0 0 0 0 0 0 0 0 0 0 0 0 0 0 0 0 0 0 0 0 0 0 0 0 0 0 0 0 0 0 0 0 0 0 0 0 0 0 0 0 0 0 0 0 0 0 0 0 0 0 0 0 0 0 0 0 0 0 0 0 0 0 0 0 0 0 0 0 0 0 0 0 0 0 0 0 0 0 0 0 0 0 0 0 0 0 0 0 0 0 0 0 0 0 0 0 0 0 0 0 0 0 0 0 0 0 0 0 0 0 0 0 0 0 0 0 0 0 0 0 0 0 0 0 0 0 0 0 0 0 0 0 0 0 0 0 0 0 0 0 0 0 0 0 0 0 0 0 0 0 0 0 0 0 0 0 0 0 0 0 0 0 0 0 0 0 0 0 0 0 0 0 0 0 0 0 0 0 0 0 0 0 0 0 0 0 0 0 0 0 0 0 0 0 0 0 0 0 0 0 0 0 0 0 0 0 0 0 0 0 0 0 0 0 0 0 0 0 0 0 0 0 0 0 0 0 0 0 0 0 0 0 0 0 0 0 0 0 0 0 0 0 0 0 0 0 0 0 0 0 0 0 0 0 0 0 0 0 0 0 0 0 0 0 0 0 0 0 0 0 0 0 0 0 0 0 0 0 0 0 0 0 0 0 0 0 0 0 0 0 0 0 0 0 0 0 0 0 0 0 0 0 0 0 0 0 0 0 0 0 0 0 0 0 0 0 0 0 0 0 0 0 0 0 0 0 0 0 0 0 0 0 0 0 0 0 0 0 0 0 0 0 0 0 0 0 0 0 0 0 0 0 0 0 0 0 0 0 0 0 0 0 0 0 0 0 0 0 0 0 0 0 0 0 0 0 0 0 0 0 0 0 0 0 0 0 0 0 0 0 0 0 0 0 0 0 0 0 0 0 0 0 0 0 0 0 0 0 0 0 0 0 0 0 0 0 0 0 0 0 0 0 0 0 0 0 0 0 0 0 0 0 0 0 0 0 0 0 0 0 0 0 0 0 0 0 0 0 0 0 0 0 0 0 0 0 0 0 0 0 0 0 0 0 0 0 0 0 0 0 0 0 0 0 0 0 0 0 0 0 0 0 0 0 0 0 0 0 0 0 0 0 0 0 0 0 0 0 0 0 0 0 0 0 0 0 0 0 0 0 0 0 0 0 0 0 0 0 0 0 0 0 0 0 0 SPN129 Bacteria;Proteobacteria;Betaproteobacteria;Neisseriales;Neisseriaceae;Neisseria;flava_nov_97.951% 0 0 0 4 0 7 0 1 0 0 0 75 20 1 22 0 0 0 5 0 2 0 0 0 0 0 0 0 8 10 2 0 1 7 4 0 0 0 3 0 1 1 211 0 8 4 82 0 0 107 0 0 0 0 1 0 2 5 0 11 0 4 1 1 1 6 0 0 1 5 1 15 318 0 0 10 0 0 4 0 17 0 0 0 0 0 5 0 0 0 17 0 42 37 0 2 5 7 3 0 0 20 9 2 0 13 81 0 0 0 16 0 0 0 0 12 2 2 0 45 4 1 15 0 9 0 1 0 0 0 20 0 0 127 315 111 0 0 0 0 6 0 3 34 0 0 0 9 0 7 0 23 39 0 0 0 0 0 6 1 69 32 0 0 0 1 170 62 20 0 6 0 0 4 0 0 0 0 45 34 0 0 13 1 15 50 0 24 2 9 3 0 2 0 0 0 0 0 1 40 5 63 12 7 532 0 1 1 4 1 3 321 425 0 1 196 25 0 0 59 14 0 0 71 7 428 2 13 3 1 7 8 0 140 0 0 125 4 1 1262 13 26 0 0 0 0 1 20 4 0 0 211 1 0 0 0 0 0 0 0 0 0 0 1 1 0 0 0 0 0 0 0 0 0 0 0 0 0 0 0 0 0 0 0 0 0 0 0 0 0 0 0 0 0 0 0 0 0 0 0 0 0 0 0 0 0 0 0 0 0 0 0 0 0 0 0 0 0 0 0 0 0 0 0 0 0 0 0 0 0 0 0 0 0 0 0 0 0 0 0 0 0 0 0 0 0 0 0 0 0 0 0 0 0 0 0 0 0 0 0 0 0 0 0 0 0 0 0 0 0 0 0 0 0 0 0 0 0 0 0 0 0 0 0 0 0 0 0 0 0 0 0 0 0 0 0 0 0 0 0 0 0 0 0 0 0 0 0 0 0 0 0 0 0 0 0 0 0 0 0 0 0 0 0 0 0 0 0 0 0 0 0 0 0 0 0 0 0 0 0 0 0 0 0 0 0 0 0 0 0 0 0 0 0 0 0 0 0 0 0 0 0 0 0 0 0 0 0 0 0 0 0 0 0 0 0 0 0 0 0 0 0 0 0 0 0 0 0 0 0 0 0 0 0 0 0 0 0 0 0 0 0 0 0 0 0 0 0 0 0 0 0 0 0 0 0 0 0 0 0 0 0 0 0 0 0 0 0 0 0 0 0 0 0 0 0 0 0 0 0 0 0 0 0 0 0 0 0 0 0 0 0 0 0 0 0 0 0 0 0 0 0 0 0 0 0 0 0 0 0 0 0 0 0 0 0 0 0 0 0 0 0 0 0 0 0 0 0 0 0 0 0 0 0 0 0 0 0 0 0 0 0 0 0 0 0 0 0 0 0 0 0 0 0 0 0 0 0 0 0 0 0 0 0 0 0 0 0 0 0 0 0 0 0 0 0 0 0 0 0 0 0 0 0 0 0 0 0 0 0 0 0 0 0 0 0 0 0 0 0 0 0 0 0 0 0 0 0 0 0 0 0 0 0 0 0 0 0 0 0 0 0 0 0 0 0 0 0 0 0 0 0 0 0 0 0 0 0 0 0 0 0 0 0 0 0 0 0 0 0 0 0 0 0 0 0 0 0 0 0 0 0 0 0 0 0 0 0 0 0 0 0 0 0 0 0 0 0 0 0 0 0 0 0 0 0 0 0 0 0 0 0 0 0 0 0 0 0 0 0 0 0 0 0 0 0 0 0 0 0 0 0 0 0 0 0 0 0 0 0 0 0 0 0 0 0 0 0 0 0 0 0 0 0 0 0 0 0 0 0 0 0 0 0 0 0 0 0 0 0 0 0 0 0 0 0 0 0 0 0 0 0 0 0 0 0 0 0 0 0 0 0 0 0 0 0 0 0 0 0 0 0 0 0 0 0 0 0 0 0 0 0 0 0 0 0 0 0 0 0 0 0 0 0 0 0 0 0 0 0 0 0 0 0 0 0 0 0 0 0 0 0 0 0 0 0 0 0 0 0 0 0 0 0 0 0 0 0 0 0 0 0 0 0 0 0 0 0 0 0 0 0 0 0 0 0 0 0 0 0 0 0 0 0 0 0 0 0 0 0 0 0 0 0 0 0 0 0 0 0 0 0 0 0 0 0 0 0 0 0 0 0 0 0 0 0 0 0 0 0 0 0 0 0 0 0 0 0 0 0 0 0 0 0 0 0 0 0 0 0 0 0 0 0 0 0 0 0 0 0 0 0 0 0 0 0 0 0 0 0 0 0 0 0 0 0 0 0 0 0 0 0 0 0 0 0 0 0 0 0 0 0 0 0 0 0 0 0 0 0 0 0 0 0 0 0 0 0 0 0 0 0 0 0 0 0 0 0 0 0 0 0 0 0 0 0 0 0 0 0 0 0 0 0 0 0 0 0 0 0 0 0 0 0 0 0 0 0 0 0 0 0 0 0 0 0 0 0 0 0 0 0 0 0 0 0 0 0 0 0 0 0 0 0 0 0 0 0 0 0 0 0 0 0 0 0 0 0 0 0 0 0 0 0 0 0 0 0 0 0 0 0 0 0 0 0 0 0 0 0 0 0 0 0 0 0 0 0 0 0 0 0 0 0 0 0 0 0 0 0 0 0 0 0 0 0 0 0 0 0 0 0 0 0 0 0 0 0 0 0 0 0 0 0 0 0 0 0 0 0 0 0 0 0 0 0 0 0 0 0 0 0 0 0 0 0 0 0 0 0 0 0 0 0 0 0 0 0 0 0 0 0 0 0 0 0 0 0 0 0 0 0 0 0 0 0 0 0 0 0 0 0 0 0 0 0 0 0 0 0 0 0 0 0 0 0 0 0 0 0 0 0 0 0 0 0 0 0 0 0 0 0 0 0 0 0 0 0 0 0 0 0 0 0 0 0 0 0 0 0 0 0 0 0 0 0 0 0 0 0 0 0 0 0 0 0 0 0 0 0 0 0 0 0 0 0 0 0 0 0 0 0 0 0 0 0 0 0 0 0 0 0 0 0 0 0 0 0 0 0 0 0 0 0 0 0 0 0 0 0 0 0 0 0 0 0 0 0 0 0 0 0 0 0 0 0 0 0 0 0 0 0 0 0 0 0 0 0 0 0 0 0 0 0 0 0 0 0 0 0 0 0 0 0 0 0 0 0 0 0 0 0 0 0 0 0 0 0 0 0 0 0 0 0 0 0 0 0 0 0 0 0 0 0 0 0 0 0 0 0 0 0 0 0 0 0 0 0 0 0 0 0 0 0 0 0 0 0 0 0 0 0 0 0 0 0 0 0 0 0 0 0 0 0 0 0 0 0 0 0 0 0 0 0 0 0 0 0 0 0 0 0 0 0 0 0 0 0 0 0 0 0 0 0 0 0 0 0 0 0 0 0 0 0 0 0 0 0 0 0 0 0 0 0 0 0 0 0 0 0 0 0 0 0 0 0 0 0 0 0 0 0 0 0 0 0 0 0 0 0 0 0 0 0 0 0 0 0 0 0 0 0 0 0 0 0 0 0 0 0 0 0 0 0 0 0 0 0 0 0 0 0 0 0 0 0 0 0 0 0 0 0 0 0 0 0 0 0 0 0 0 0 0 0 0 0 0 0 0 0 0 0 0 0 0 0 0 0 0 0 0 0 0 0 0 0 0 0 0 0 0 0 0 0 0 0 0 0 0 0 0 0 0 0 0 0 0 0 0 0 0 0 0 0 0 0 0 0 0 0 0 0 0 0 0 0 0 0 0 0 0 0 0 0 0 0 0 0 0 0 0 0 0 0 0 0 0 0 0 0 0 0 0 0 0 0 0 0 0 0 0 0 0 0 0 0 0 0 0 0 0 0 0 0 0 0 0 0 0 0 0 0 0 0 0 0 0 0 0 0 0 0 0 0 0 0 0 0 0 0 0 0 0 0 0 0 0 0 0 0 0 0 0 0 0 0 0 0 0 0 0 0 0 0 0 0 0 0 0 0 0 0 0 0 0 0 0 0 0 0 0 0 0 0 0 0 0 0 0 0 0 0 0 0 0 0 0 0 0 0 0 0 0 0 0 0 0 0 0 0 0 0 0 0 0 0 0 0 0 0 0 0 0 0 0 0 0 0 0 0 0 0 0 0 SPN130 Bacteria;Firmicutes;Bacilli;Lactobacillales;Streptococcaceae;Streptococcus;sinensis_nov_83.991% 3 58 1 1 2 4 1 7 2 4 12 17 36 4 22 4 3 6 22 2 56 2 1 8 88 11 0 21 11 14 92 26 6 104 20 24 8 7 98 21 115 13 72 5 0 259 21 0 1 19 3 1 0 1 18 120 2 3 2 23 2 8 32 6 56 30 0 23 88 129 4 157 162 0 0 9 0 0 26 4 109 76 1 20 0 15 18 1 0 15 82 0 3 64 6 3 3 135 113 15 2 3 0 157 1 2 71 3 35 66 1 4 3 49 40 22 54 10 58 113 78 72 2 17 17 3 12 55 17 12 48 31 0 10 27 143 101 14 0 60 7 11 13 4 1 21 5 21 2 4 12 42 74 2 2 1 1 4 21 3 5 8 4 8 2 1 6 0 0 2 0 0 2 8 1 1 2 1 13 0 2 1 12 23 22 14 35 54 10 48 9 0 1 1 3 1 3 17 1 107 0 16 78 41 10 2 8 1 4 2 14 23 48 148 189 13 2 0 2 34 37 32 2 12 15 9 64 52 3 20 2 0 4 7 78 24 5 1 122 13 155 76 37 1 0 0 18 73 40 0 59 27 1 1 0 1 4 0 0 0 0 0 0 2 1 0 14 2 0 0 0 0 0 0 0 0 0 0 0 0 0 0 0 0 0 0 0 0 0 0 0 0 0 0 0 0 0 0 0 0 0 0 0 0 0 0 0 0 0 0 0 0 0 0 0 0 0 0 0 0 0 0 0 0 0 0 0 0 0 0 0 0 0 0 0 0 0 0 0 0 0 0 0 0 0 0 0 0 0 0 0 0 0 0 0 0 0 0 0 0 0 0 0 0 0 0 0 0 0 0 0 0 0 0 0 0 0 0 0 0 0 0 0 0 0 0 0 0 0 0 0 0 0 0 0 0 0 0 0 0 0 0 0 0 0 0 0 0 0 0 0 0 0 0 0 0 0 0 0 0 0 0 0 0 0 0 0 0 0 0 0 0 0 0 0 0 0 0 0 0 0 0 0 0 0 0 0 0 0 0 0 0 0 0 0 0 0 0 0 0 0 0 0 0 0 0 0 0 0 0 0 0 0 0 0 0 0 0 0 0 0 0 0 0 0 0 0 0 0 0 0 0 0 0 0 0 0 0 0 0 0 0 0 0 0 0 0 0 0 0 0 0 0 0 0 0 0 0 0 0 0 0 0 0 0 0 0 0 0 0 0 0 0 0 0 0 0 0 0 0 0 0 0 0 0 0 0 0 0 0 0 0 0 0 0 0 0 0 0 0 0 0 0 0 0 0 0 0 0 0 0 0 0 0 0 0 0 0 0 0 0 0 0 0 0 0 0 0 0 0 0 0 0 0 0 0 0 0 0 0 0 0 0 0 0 0 0 0 0 0 0 0 0 0 0 0 0 0 0 0 0 0 0 0 0 0 0 0 0 0 0 0 0 0 0 0 0 0 0 0 0 0 0 0 0 0 0 0 0 0 0 0 0 0 0 0 0 0 0 0 0 0 0 0 0 0 0 0 0 0 0 0 0 0 0 0 0 0 0 0 0 0 0 0 0 0 0 0 0 0 0 0 0 0 0 0 0 0 0 0 0 0 0 0 0 0 0 0 0 0 0 0 0 0 0 0 0 0 0 0 0 0 0 0 0 0 0 0 0 0 0 0 0 0 0 0 0 0 0 0 0 0 0 0 0 0 0 0 0 0 0 0 0 0 0 0 0 0 0 0 0 0 0 0 0 0 0 0 0 0 0 0 0 0 0 0 0 0 0 0 0 0 0 0 0 0 0 0 0 0 0 0 0 0 0 0 0 0 0 0 0 0 0 0 0 0 0 0 0 0 0 0 0 0 0 0 0 0 0 0 0 0 0 0 0 0 0 0 0 0 0 0 0 0 0 0 0 0 0 0 0 0 0 0 0 0 0 0 0 0 0 0 0 0 0 0 0 0 0 0 0 0 0 0 0 0 0 0 0 0 0 0 0 0 0 0 0 0 0 0 0 0 0 0 0 0 0 0 0 0 0 0 0 0 0 0 0 0 0 0 0 0 0 0 0 0 0 0 0 0 0 0 0 0 0 0 0 0 0 0 0 0 0 0 0 0 0 0 0 0 0 0 0 0 0 0 0 0 0 0 0 0 0 0 0 0 0 0 0 0 0 0 0 0 0 0 0 0 0 0 0 0 0 0 0 0 0 0 0 0 0 0 0 0 0 0 0 0 0 0 0 0 0 0 0 0 0 0 0 0 0 0 0 0 0 0 0 0 0 0 0 0 0 0 0 0 0 0 0 0 0 0 0 0 0 0 0 0 0 0 0 0 0 0 0 0 0 0 0 0 0 0 0 0 0 0 0 0 0 0 0 0 0 0 0 0 0 0 0 0 0 0 0 0 0 0 0 0 0 0 0 0 0 0 0 0 0 0 0 0 0 0 0 0 0 0 0 0 0 0 0 0 0 0 0 0 0 0 0 0 0 0 0 0 0 0 0 0 0 0 0 0 0 0 0 0 0 0 0 0 0 0 0 0 0 0 0 0 0 0 0 0 0 0 0 0 0 0 0 0 0 0 0 0 0 0 0 0 0 0 0 0 0 0 0 0 0 0 0 0 0 0 0 0 0 0 0 0 0 0 0 0 0 0 0 0 0 0 0 0 0 0 0 0 0 0 0 0 0 0 0 0 0 0 0 0 0 0 0 0 0 0 0 0 0 0 0 0 0 0 0 0 0 0 0 0 0 0 0 0 0 0 0 0 0 0 0 0 0 0 0 0 0 0 0 0 0 0 0 0 0 0 0 0 0 0 0 0 0 0 0 0 0 0 0 0 0 0 0 0 0 0 0 0 0 0 0 0 0 0 0 0 0 0 0 0 0 0 0 0 0 0 0 0 0 0 0 0 0 0 0 0 0 0 0 0 0 0 0 0 0 0 0 0 0 0 0 0 0 0 0 0 0 0 0 0 0 0 0 0 0 0 0 0 0 0 0 0 0 0 0 0 0 0 0 0 0 0 0 0 0 0 0 0 0 0 0 0 0 0 0 0 0 0 0 0 0 0 0 0 0 0 0 0 0 0 0 0 0 0 0 0 0 0 0 0 0 0 0 0 0 0 0 0 0 0 0 0 0 0 0 0 0 0 0 0 0 0 0 0 0 0 0 0 0 0 0 0 0 0 0 0 0 0 0 0 0 0 0 0 0 0 0 0 0 0 0 0 0 0 0 0 0 0 0 0 0 0 0 0 0 0 0 0 0 0 0 0 0 0 0 0 0 0 0 0 0 0 0 0 0 0 0 0 0 0 0 0 0 0 0 0 0 0 0 0 0 0 0 0 0 0 0 0 0 0 0 0 0 0 0 0 0 0 0 0 0 0 0 0 0 0 0 0 0 0 0 0 0 0 0 0 0 0 0 0 0 0 0 0 0 0 0 0 0 0 0 0 0 0 0 0 0 0 0 0 0 0 0 0 0 0 0 0 0 0 0 0 0 0 0 0 0 0 0 0 0 0 0 0 0 0 0 0 0 0 0 0 0 0 0 0 0 0 0 0 0 0 0 0 0 0 0 0 0 0 0 0 0 0 0 0 0 0 0 0 0 0 0 0 0 0 0 0 0 0 0 0 0 0 0 0 0 0 0 0 0 0 0 0 0 0 0 0 0 0 0 0 0 0 0 0 0 0 0 0 0 0 0 0 0 0 0 0 0 0 0 0 0 0 0 0 0 0 0 0 0 0 0 0 0 0 0 0 0 0 0 0 0 0 0 0 0 0 0 0 0 0 0 0 0 0 0 0 0 0 0 0 0 0 0 0 0 0 0 0 0 0 0 0 0 0 0 0 0 0 0 0 0 0 0 0 0 0 0 0 0 0 0 0 0 0 0 0 0 0 0 0 0 0 0 0 0 0 0 0 0 0 0 0 0 0 0 0 0 0 0 0 0 0 0 0 0 0 0 0 0 0 0 0 0 0 0 0 0 0 0 0 0 0 0 0 0 0 0 0 0 0 0 0 0 0 0 0 0 0 0 0 0 0 0 0 0 0 0 0 0 0 0 0 0 0 0 0 0 0 0 0 0 0 0 0 0 0 0 0 0 0 0 0 0 0 0 0 0 0 0 0 0 0 0 0 0 0 SPN131 Bacteria;Actinobacteria;Actinomycetia;Micrococcales;Micrococcaceae;Kocuria;polaris_nov_89.220% 2 31 0 1 0 23 3 20 0 8 1 7 4 14 2 1 1 20 39 14 3 0 4 1 6 0 0 0 6 0 42 18 60 49 37 9 3 7 22 9 78 3 29 7 11 4 60 1 9 9 0 0 0 6 22 111 0 14 17 11 11 3 41 7 71 47 21 0 62 44 4 18 70 1 1 13 17 10 5 1 67 52 5 1 38 18 7 2 0 1 43 0 20 11 8 67 1 99 69 10 9 25 30 36 2 11 22 4 30 13 0 6 3 33 1 57 31 12 5 33 18 23 2 14 13 2 2 0 8 1 63 37 0 62 4 62 23 3 6 91 2 0 0 11 0 6 13 9 1 81 2 51 19 14 1 6 6 5 76 27 137 41 310 0 5 1 1 39 18 15 0 9 40 72 64 3 27 16 35 13 0 91 55 13 2 37 92 56 158 105 19 11 39 2 10 0 10 6 11 105 27 107 33 103 109 0 1 0 12 8 5 24 16 1 109 60 11 2 4 44 3 25 1 13 4 21 46 118 33 0 42 14 12 1 3 43 56 12 49 60 139 98 0 1 0 1 10 88 16 0 14 35 159 0 1 6 12 4 0 11 5 2 4 12 19 0 1 4 0 0 0 0 0 0 0 0 0 0 0 0 0 0 0 0 0 0 0 0 0 0 0 0 0 0 0 0 0 0 0 0 0 0 0 0 0 0 0 0 0 0 0 0 0 0 0 0 0 0 0 0 0 0 0 0 0 0 0 0 0 0 0 0 0 0 0 0 0 0 0 0 0 0 0 0 0 0 0 0 0 0 0 0 0 0 0 0 0 0 0 0 0 0 0 0 0 0 0 0 0 0 0 0 0 0 0 0 0 0 0 0 0 0 0 0 0 0 0 0 0 0 0 0 0 0 0 0 0 0 0 0 0 0 0 0 0 0 0 0 0 0 0 0 0 0 0 0 0 0 0 0 0 0 0 0 0 0 0 0 0 0 0 0 0 0 0 0 0 0 0 0 0 0 0 0 0 0 0 0 0 0 0 0 0 0 0 0 0 0 0 0 0 0 0 0 0 0 0 0 0 0 0 0 0 0 0 0 0 0 0 0 0 0 0 0 0 0 0 0 0 0 0 0 0 0 0 0 0 0 0 0 0 0 0 0 0 0 0 0 0 0 0 0 0 0 0 0 0 0 0 0 0 0 0 0 0 0 0 0 0 0 0 0 0 0 0 0 0 0 0 0 0 0 0 0 0 0 0 0 0 0 0 0 0 0 0 0 0 0 0 0 0 0 0 0 0 0 0 0 0 0 0 0 0 0 0 0 0 0 0 0 0 0 0 0 0 0 0 0 0 0 0 0 0 0 0 0 0 0 0 0 0 0 0 0 0 0 0 0 0 0 0 0 0 0 0 0 0 0 0 0 0 0 0 0 0 0 0 0 0 0 0 0 0 0 0 0 0 0 0 0 0 0 0 0 0 0 0 0 0 0 0 0 0 0 0 0 0 0 0 0 0 0 0 0 0 0 0 0 0 0 0 0 0 0 0 0 0 0 0 0 0 0 0 0 0 0 0 0 0 0 0 0 0 0 0 0 0 0 0 0 0 0 0 0 0 0 0 0 0 0 0 0 0 0 0 0 0 0 0 0 0 0 0 0 0 0 0 0 0 0 0 0 0 0 0 0 0 0 0 0 0 0 0 0 0 0 0 0 0 0 0 0 0 0 0 0 0 0 0 0 0 0 0 0 0 0 0 0 0 0 0 0 0 0 0 0 0 0 0 0 0 0 0 0 0 0 0 0 0 0 0 0 0 0 0 0 0 0 0 0 0 0 0 0 0 0 0 0 0 0 0 0 0 0 0 0 0 0 0 0 0 0 0 0 0 0 0 0 0 0 0 0 0 0 0 0 0 0 0 0 0 0 0 0 0 0 0 0 0 0 0 0 0 0 0 0 0 0 0 0 0 0 0 0 0 0 0 0 0 0 0 0 0 0 0 0 0 0 0 0 0 0 0 0 0 0 0 0 0 0 0 0 0 0 0 0 0 0 0 0 0 0 0 0 0 0 0 0 0 0 0 0 0 0 0 0 0 0 0 0 0 0 0 0 0 0 0 0 0 0 0 0 0 0 0 0 0 0 0 0 0 0 0 0 0 0 0 0 0 0 0 0 0 0 0 0 0 0 0 0 0 0 0 0 0 0 0 0 0 0 0 0 0 0 0 0 0 0 0 0 0 0 0 0 0 0 0 0 0 0 0 0 0 0 0 0 0 0 0 0 0 0 0 0 0 0 0 0 0 0 0 0 0 0 0 0 0 0 0 0 0 0 0 0 0 0 0 0 0 0 0 0 0 0 0 0 0 0 0 0 0 0 0 0 0 0 0 0 0 0 0 0 0 0 0 0 0 0 0 0 0 0 0 0 0 0 0 0 0 0 0 0 0 0 0 0 0 0 0 0 0 0 0 0 0 0 0 0 0 0 0 0 0 0 0 0 0 0 0 0 0 0 0 0 0 0 0 0 0 0 0 0 0 0 0 0 0 0 0 0 0 0 0 0 0 0 0 0 0 0 0 0 0 0 0 0 0 0 0 0 0 0 0 0 0 0 0 0 0 0 0 0 0 0 0 0 0 0 0 0 0 0 0 0 0 0 0 0 0 0 0 0 0 0 0 0 0 0 0 0 0 0 0 0 0 0 0 0 0 0 0 0 0 0 0 0 0 0 0 0 0 0 0 0 0 0 0 0 0 0 0 0 0 0 0 0 0 0 0 0 0 0 0 0 0 0 0 0 0 0 0 0 0 0 0 0 0 0 0 0 0 0 0 0 0 0 0 0 0 0 0 0 0 0 0 0 0 0 0 0 0 0 0 0 0 0 0 0 0 0 0 0 0 0 0 0 0 0 0 0 0 0 0 0 0 0 0 0 0 0 0 0 0 0 0 0 0 0 0 0 0 0 0 0 0 0 0 0 0 0 0 0 0 0 0 0 0 0 0 0 0 0 0 0 0 0 0 0 0 0 0 0 0 0 0 0 0 0 0 0 0 0 0 0 0 0 0 0 0 0 0 0 0 0 0 0 0 0 0 0 0 0 0 0 0 0 0 0 0 0 0 0 0 0 0 0 0 0 0 0 0 0 0 0 0 0 0 0 0 0 0 0 0 0 0 0 0 0 0 0 0 0 0 0 0 0 0 0 0 0 0 0 0 0 0 0 0 0 0 0 0 0 0 0 0 0 0 0 0 0 0 0 0 0 0 0 0 0 0 0 0 0 0 0 0 0 0 0 0 0 0 0 0 0 0 0 0 0 0 0 0 0 0 0 0 0 0 0 0 0 0 0 0 0 0 0 0 0 0 0 0 0 0 0 0 0 0 0 0 0 0 0 0 0 0 0 0 0 0 0 0 0 0 0 0 0 0 0 0 0 0 0 0 0 0 0 0 0 0 0 0 0 0 0 0 0 0 0 0 0 0 0 0 0 0 0 0 0 0 0 0 0 0 0 0 0 0 0 0 0 0 0 0 0 0 0 0 0 0 0 0 0 0 0 0 0 0 0 0 0 0 0 0 0 0 0 0 0 0 0 0 0 0 0 0 0 0 0 0 0 0 0 0 0 0 0 0 0 0 0 0 0 0 0 0 0 0 0 0 0 0 0 0 0 0 0 0 0 0 0 0 0 0 0 0 0 0 0 0 0 0 0 0 0 0 0 0 0 0 0 0 0 0 0 0 0 0 0 0 0 0 0 0 0 0 0 0 0 0 0 0 0 0 0 0 0 0 0 0 0 0 0 0 0 0 0 0 0 0 0 0 0 0 0 0 0 0 0 0 0 0 0 0 0 0 0 0 0 0 0 0 0 0 0 0 0 0 0 0 0 0 0 0 0 0 0 0 0 0 0 0 0 0 0 0 0 0 0 0 0 0 0 0 0 0 0 0 0 0 0 0 0 0 0 0 0 0 0 0 0 0 0 0 0 0 0 0 0 0 0 0 0 0 0 0 0 0 0 0 0 0 0 0 0 0 0 0 0 0 0 0 0 0 0 0 0 0 0 0 0 0 0 0 0 0 0 0 0 0 0 0 0 0 0 0 0 0 0 0 0 0 0 0 0 0 0 0 0 0 0 0 0 0 0 SPN132 Bacteria;Bacteroidetes;Bacteroidia;Bacteroidales;Prevotellaceae;Alloprevotella;sp. HMT308 nov_97.347% 0 0 0 1 2 7 0 0 0 0 4 1 0 0 2 0 0 5 55 4 16 0 0 0 0 0 0 0 0 0 0 3 0 2 111 2 16 0 0 0 3 0 3 0 0 0 0 0 0 0 0 1 0 0 209 2 25 30 0 0 0 0 0 0 0 0 0 19 0 0 0 11 0 0 0 0 0 11 0 0 36 0 0 5 0 0 0 23 0 909 0 0 0 0 5 0 0 0 0 3 0 2 0 0 1 0 41 0 0 0 0 0 105 2 180 0 1 0 3 0 0 102 0 30 8 4 0 3 0 0 0 0 0 2 37 6 1720 0 0 0 0 0 2 0 0 0 3 31 107 0 84 0 7 0 4 0 4 0 0 0 0 0 3 0 0 2 0 13 0 0 0 0 0 2 0 0 9 5 0 0 0 0 0 3 11 0 2 1 0 275 18 0 7 0 58 0 0 398 41 1 0 1 174 2 6 65 0 0 0 0 0 0 0 1 0 5 0 0 0 0 0 1 0 0 3 26 305 4 0 0 0 0 1 0 0 3 6 8 69 0 0 19 383 0 0 10 14 0 7 0 3 0 0 0 0 0 12 0 0 20 0 0 0 65 324 0 0 0 0 0 0 0 0 0 0 0 0 0 0 0 0 0 0 0 0 0 0 0 0 0 0 0 0 0 0 0 0 0 0 0 0 0 0 0 0 0 0 0 0 0 0 0 0 0 0 0 0 0 0 0 0 0 0 0 0 0 0 0 0 0 0 0 0 0 0 0 0 0 0 0 0 0 0 0 0 0 0 0 0 0 0 0 0 0 0 0 0 0 0 0 0 0 0 0 0 0 0 0 0 0 0 0 0 0 0 0 0 0 0 0 0 0 0 0 0 0 0 0 0 0 0 0 0 0 0 0 0 0 0 0 0 0 0 0 0 0 0 0 0 0 0 0 0 0 0 0 0 0 0 0 0 0 0 0 0 0 0 0 0 0 0 0 0 0 0 0 0 0 0 0 0 0 0 0 0 0 0 0 0 0 0 0 0 0 0 0 0 0 0 0 0 0 0 0 0 0 0 0 0 0 0 0 0 0 0 0 0 0 0 0 0 0 0 0 0 0 0 0 0 0 0 0 0 0 0 0 0 0 0 0 0 0 0 0 0 0 0 0 0 0 0 0 0 0 0 0 0 0 0 0 0 0 0 0 0 0 0 0 0 0 0 0 0 0 0 0 0 0 0 0 0 0 0 0 0 0 0 0 0 0 0 0 0 0 0 0 0 0 0 0 0 0 0 0 0 0 0 0 0 0 0 0 0 0 0 0 0 0 0 0 0 0 0 0 0 0 0 0 0 0 0 0 0 0 0 0 0 0 0 0 0 0 0 0 0 0 0 0 0 0 0 0 0 0 0 0 0 0 0 0 0 0 0 0 0 0 0 0 0 0 0 0 0 0 0 0 0 0 0 0 0 0 0 0 0 0 0 0 0 0 0 0 0 0 0 0 0 0 0 0 0 0 0 0 0 0 0 0 0 0 0 0 0 0 0 0 0 0 0 0 0 0 0 0 0 0 0 0 0 0 0 0 0 0 0 0 0 0 0 0 0 0 0 0 0 0 0 0 0 0 0 0 0 0 0 0 0 0 0 0 0 0 0 0 0 0 0 0 0 0 0 0 0 0 0 0 0 0 0 0 0 0 0 0 0 0 0 0 0 0 0 0 0 0 0 0 0 0 0 0 0 0 0 0 0 0 0 0 0 0 0 0 0 0 0 0 0 0 0 0 0 0 0 0 0 0 0 0 0 0 0 0 0 0 0 0 0 0 0 0 0 0 0 0 0 0 0 0 0 0 0 0 0 0 0 0 0 0 0 0 0 0 0 0 0 0 0 0 0 0 0 0 0 0 0 0 0 0 0 0 0 0 0 0 0 0 0 0 0 0 0 0 0 0 0 0 0 0 0 0 0 0 0 0 0 0 0 0 0 0 0 0 0 0 0 0 0 0 0 0 0 0 0 0 0 0 0 0 0 0 0 0 0 0 0 0 0 0 0 0 0 0 0 0 0 0 0 0 0 0 0 0 0 0 0 0 0 0 0 0 0 0 0 0 0 0 0 0 0 0 0 0 0 0 0 0 0 0 0 0 0 0 0 0 0 0 0 0 0 0 0 0 0 0 0 0 0 0 0 0 0 0 0 0 0 0 0 0 0 0 0 0 0 0 0 0 0 0 0 0 0 0 0 0 0 0 0 0 0 0 0 0 0 0 0 0 0 0 0 0 0 0 0 0 0 0 0 0 0 0 0 0 0 0 0 0 0 0 0 0 0 0 0 0 0 0 0 0 0 0 0 0 0 0 0 0 0 0 0 0 0 0 0 0 0 0 0 0 0 0 0 0 0 0 0 0 0 0 0 0 0 0 0 0 0 0 0 0 0 0 0 0 0 0 0 0 0 0 0 0 0 0 0 0 0 0 0 0 0 0 0 0 0 0 0 0 0 0 0 0 0 0 0 0 0 0 0 0 0 0 0 0 0 0 0 0 0 0 0 0 0 0 0 0 0 0 0 0 0 0 0 0 0 0 0 0 0 0 0 0 0 0 0 0 0 0 0 0 0 0 0 0 0 0 0 0 0 0 0 0 0 0 0 0 0 0 0 0 0 0 0 0 0 0 0 0 0 0 0 0 0 0 0 0 0 0 0 0 0 0 0 0 0 0 0 0 0 0 0 0 0 0 0 0 0 0 0 0 0 0 0 0 0 0 0 0 0 0 0 0 0 0 0 0 0 0 0 0 0 0 0 0 0 0 0 0 0 0 0 0 0 0 0 0 0 0 0 0 0 0 0 0 0 0 0 0 0 0 0 0 0 0 0 0 0 0 0 0 0 0 0 0 0 0 0 0 0 0 0 0 0 0 0 0 0 0 0 0 0 0 0 0 0 0 0 0 0 0 0 0 0 0 0 0 0 0 0 0 0 0 0 0 0 0 0 0 0 0 0 0 0 0 0 0 0 0 0 0 0 0 0 0 0 0 0 0 0 0 0 0 0 0 0 0 0 0 0 0 0 0 0 0 0 0 0 0 0 0 0 0 0 0 0 0 0 0 0 0 0 0 0 0 0 0 0 0 0 0 0 0 0 0 0 0 0 0 0 0 0 0 0 0 0 0 0 0 0 0 0 0 0 0 0 0 0 0 0 0 0 0 0 0 0 0 0 0 0 0 0 0 0 0 0 0 0 0 0 0 0 0 0 0 0 0 0 0 0 0 0 0 0 0 0 0 0 0 0 0 0 0 0 0 0 0 0 0 0 0 0 0 0 0 0 0 0 0 0 0 0 0 0 0 0 0 0 0 0 0 0 0 0 0 0 0 0 0 0 0 0 0 0 0 0 0 0 0 0 0 0 0 0 0 0 0 0 0 0 0 0 0 0 0 0 0 0 0 0 0 0 0 0 0 0 0 0 0 0 0 0 0 0 0 0 0 0 0 0 0 0 0 0 0 0 0 0 0 0 0 0 0 0 0 0 0 0 0 0 0 0 0 0 0 0 0 0 0 0 0 0 0 0 0 0 0 0 0 0 0 0 0 0 0 0 0 0 0 0 0 0 0 0 0 0 0 0 0 0 0 0 0 0 0 0 0 0 0 0 0 0 0 0 0 0 0 0 0 0 0 0 0 0 0 0 0 0 0 0 0 0 0 0 0 0 0 0 0 0 0 0 0 0 0 0 0 0 0 0 0 0 0 0 0 0 0 0 0 0 0 0 0 0 0 0 0 0 0 0 0 0 0 0 0 0 0 0 0 0 0 0 0 0 0 0 0 0 0 0 0 0 0 0 0 0 0 0 0 0 0 0 0 0 0 0 0 0 0 0 0 0 0 0 0 0 0 0 0 0 0 0 0 0 0 0 0 0 0 0 0 0 0 0 0 0 0 0 0 0 0 0 0 0 0 0 0 0 0 0 0 0 0 0 0 0 0 0 0 0 0 0 0 0 0 0 0 0 0 0 0 0 0 0 0 0 0 0 0 0 0 0 0 0 0 0 0 0 0 0 0 0 0 0 0 0 0 0 0 0 0 0 0 0 0 0 0 0 0 0 0 0 0 0 0 0 0 0 0 0 0 0 0 0 0 0 0 SPN133 Bacteria;Actinobacteria;Actinomycetia;Corynebacteriales;Corynebacteriaceae;Corynebacterium;durum_nov_97.699% 34 96 674 18 31 7 5 20 137 61 1 86 0 14 9 5 1 25 3 6 2 27 0 71 16 6 743 15 9 2 0 3 14 19 3 4 8 13 2 0 9 117 15 26 61 0 36 30 18 147 2 2 4 0 8 1 0 9 6 115 0 7 1 0 0 0 6 0 9 6 115 33 21 44 35 6 22 1 54 203 0 19 3 6 1 0 13 49 11 0 12 2 2 10 1 44 12 11 0 16 41 31 16 21 10 6 0 0 5 0 2 11 11 0 11 0 4 33 1 40 15 19 3 9 5 0 7 7 4 84 12 0 11 4 16 0 0 3 0 1 0 2 0 43 138 7 2 2 3 0 5 8 28 0 33 11 6 86 38 13 4 45 4 3 6 2 100 47 12 356 0 59 0 4 4 12 0 1 4 11 2 0 4 2 19 36 6 4 0 18 61 78 2 12 6 3 0 2 39 17 15 0 8 1 0 0 51 5 15 1 1 6 4 6 3 14 24 1 5 19 16 32 2 0 22 11 2 11 0 3 29 1 8 0 1 0 0 4 5 25 4 1 0 13 4 33 9 3 0 4 0 1 2 5 1 0 35 0 10 5 22 3 3 2 17 1 5 44 0 0 0 0 0 0 0 0 0 0 0 0 0 0 0 0 0 0 0 0 0 0 0 0 0 0 0 0 0 0 0 0 0 0 0 0 0 0 0 0 0 0 0 0 0 0 0 0 0 0 0 0 0 0 0 0 0 0 0 0 0 0 0 0 0 0 0 0 0 0 0 0 0 0 0 0 0 0 0 0 0 0 0 0 0 0 0 0 0 0 0 0 0 0 0 0 0 0 0 0 0 0 0 0 0 0 0 0 0 0 0 0 0 0 0 0 0 0 0 0 0 0 0 0 0 0 0 0 0 0 0 0 0 0 0 0 0 0 0 0 0 0 0 0 0 0 0 0 0 0 0 0 0 0 0 0 0 0 0 0 0 0 0 0 0 0 0 0 0 0 0 0 0 0 0 0 0 0 0 0 0 0 0 0 0 0 0 0 0 0 0 0 0 0 0 0 0 0 0 0 0 0 0 0 0 0 0 0 0 0 0 0 0 0 0 0 0 0 0 0 0 0 0 0 0 0 0 0 0 0 0 0 0 0 0 0 0 0 0 0 0 0 0 0 0 0 0 0 0 0 0 0 0 0 0 0 0 0 0 0 0 0 0 0 0 0 0 0 0 0 0 0 0 0 0 0 0 0 0 0 0 0 0 0 0 0 0 0 0 0 0 0 0 0 0 0 0 0 0 0 0 0 0 0 0 0 0 0 0 0 0 0 0 0 0 0 0 0 0 0 0 0 0 0 0 0 0 0 0 0 0 0 0 0 0 0 0 0 0 0 0 0 0 0 0 0 0 0 0 0 0 0 0 0 0 0 0 0 0 0 0 0 0 0 0 0 0 0 0 0 0 0 0 0 0 0 0 0 0 0 0 0 0 0 0 0 0 0 0 0 0 0 0 0 0 0 0 0 0 0 0 0 0 0 0 0 0 0 0 0 0 0 0 0 0 0 0 0 0 0 0 0 0 0 0 0 0 0 0 0 0 0 0 0 0 0 0 0 0 0 0 0 0 0 0 0 0 0 0 0 0 0 0 0 0 0 0 0 0 0 0 0 0 0 0 0 0 0 0 0 0 0 0 0 0 0 0 0 0 0 0 0 0 0 0 0 0 0 0 0 0 0 0 0 0 0 0 0 0 0 0 0 0 0 0 0 0 0 0 0 0 0 0 0 0 0 0 0 0 0 0 0 0 0 0 0 0 0 0 0 0 0 0 0 0 0 0 0 0 0 0 0 0 0 0 0 0 0 0 0 0 0 0 0 0 0 0 0 0 0 0 0 0 0 0 0 0 0 0 0 0 0 0 0 0 0 0 0 0 0 0 0 0 0 0 0 0 0 0 0 0 0 0 0 0 0 0 0 0 0 0 0 0 0 0 0 0 0 0 0 0 0 0 0 0 0 0 0 0 0 0 0 0 0 0 0 0 0 0 0 0 0 0 0 0 0 0 0 0 0 0 0 0 0 0 0 0 0 0 0 0 0 0 0 0 0 0 0 0 0 0 0 0 0 0 0 0 0 0 0 0 0 0 0 0 0 0 0 0 0 0 0 0 0 0 0 0 0 0 0 0 0 0 0 0 0 0 0 0 0 0 0 0 0 0 0 0 0 0 0 0 0 0 0 0 0 0 0 0 0 0 0 0 0 0 0 0 0 0 0 0 0 0 0 0 0 0 0 0 0 0 0 0 0 0 0 0 0 0 0 0 0 0 0 0 0 0 0 0 0 0 0 0 0 0 0 0 0 0 0 0 0 0 0 0 0 0 0 0 0 0 0 0 0 0 0 0 0 0 0 0 0 0 0 0 0 0 0 0 0 0 0 0 0 0 0 0 0 0 0 0 0 0 0 0 0 0 0 0 0 0 0 0 0 0 0 0 0 0 0 0 0 0 0 0 0 0 0 0 0 0 0 0 0 0 0 0 0 0 0 0 0 0 0 0 0 0 0 0 0 0 0 0 0 0 0 0 0 0 0 0 0 0 0 0 0 0 0 0 0 0 0 0 0 0 0 0 0 0 0 0 0 0 0 0 0 0 0 0 0 0 0 0 0 0 0 0 0 0 0 0 0 0 0 0 0 0 0 0 0 0 0 0 0 0 0 0 0 0 0 0 0 0 0 0 0 0 0 0 0 0 0 0 0 0 0 0 0 0 0 0 0 0 0 0 0 0 0 0 0 0 0 0 0 0 0 0 0 0 0 0 0 0 0 0 0 0 0 0 0 0 0 0 0 0 0 0 0 0 0 0 0 0 0 0 0 0 0 0 0 0 0 0 0 0 0 0 0 0 0 0 0 0 0 0 0 0 0 0 0 0 0 0 0 0 0 0 0 0 0 0 0 0 0 0 0 0 0 0 0 0 0 0 0 0 0 0 0 0 0 0 0 0 0 0 0 0 0 0 0 0 0 0 0 0 0 0 0 0 0 0 0 0 0 0 0 0 0 0 0 0 0 0 0 0 0 0 0 0 0 0 0 0 0 0 0 0 0 0 0 0 0 0 0 0 0 0 0 0 0 0 0 0 0 0 0 0 0 0 0 0 0 0 0 0 0 0 0 0 0 0 0 0 0 0 0 0 0 0 0 0 0 0 0 0 0 0 0 0 0 0 0 0 0 0 0 0 0 0 0 0 0 0 0 0 0 0 0 0 0 0 0 0 0 0 0 0 0 0 0 0 0 0 0 0 0 0 0 0 0 0 0 0 0 0 0 0 0 0 0 0 0 0 0 0 0 0 0 0 0 0 0 0 0 0 0 0 0 0 0 0 0 0 0 0 0 0 0 0 0 0 0 0 0 0 0 0 0 0 0 0 0 0 0 0 0 0 0 0 0 0 0 0 0 0 0 0 0 0 0 0 0 0 0 0 0 0 0 0 0 0 0 0 0 0 0 0 0 0 0 0 0 0 0 0 0 0 0 0 0 0 0 0 0 0 0 0 0 0 0 0 0 0 0 0 0 0 0 0 0 0 0 0 0 0 0 0 0 0 0 0 0 0 0 0 0 0 0 0 0 0 0 0 0 0 0 0 0 0 0 0 0 0 0 0 0 0 0 0 0 0 0 0 0 0 0 0 0 0 0 0 0 0 0 0 0 0 0 0 0 0 0 0 0 0 0 0 0 0 0 0 0 0 0 0 0 0 0 0 0 0 0 0 0 0 0 0 0 0 0 0 0 0 0 0 0 0 0 0 0 0 0 0 0 0 0 0 0 0 0 0 0 0 0 0 0 0 0 0 0 0 0 0 0 0 0 0 0 0 0 0 0 0 0 0 0 0 0 0 0 0 0 0 0 0 0 0 0 0 0 0 0 0 0 0 0 0 0 0 0 0 0 0 0 0 0 0 0 0 0 0 0 0 0 0 0 0 0 0 0 0 0 0 0 0 0 0 0 0 0 0 0 0 0 0 0 0 0 0 0 0 0 0 0 0 0 0 0 0 0 0 0 0 0 0 0 0 0 0 0 0 0 0 0 0 0 0 0 0 0 0 0 0 0 0 0 0 0 0 0 0 0 0 0 0 0 SPN15 Bacteria;Firmicutes;Bacilli;Lactobacillales;Streptococcaceae;Streptococcus;parasanguinis_clade_411_nov_97.976% 390 856 5 12 51 64 82 395 16 64 647 2 29 0 56 415 8 1 0 291 76 525 82 13 435 272 423 10 3 3 0 109 42 24 22 1 5249 2 372 32 0 0 0 60 37 0 17 335 4 13 322 1736 2261 1 46 31 463 374 71 71 3 0 8 0 819 12 1 16 2 0 1 13 6 15 129 0 69 59 1 0 8 0 301 12 395 639 13 196 1623 38 5 2 24 43 702 49 0 39 1 578 374 17 0 1 3 10 125 1 2 33 3 68 3172 71 203 4 5 0 6 0 5 5 98 39 3 903 156 13 13 256 0 0 522 187 13 0 0 51 8 2 36 1 370 3 3 7 479 74 825 0 27 18 22 401 2 3 24 27 19 6 3 0 0 2 3 2371 0 17 0 10 0 1270 5 1 303 157 40 32 1 0 14 46 0 23 122 3 4 0 0 532 35 1 39 456 22 1478 133 1178 32 2 12 1 16 0 135 107 1 2 77 0 52 39 0 658 467 5 1 38 19 3 3 1656 65 3 1033 1 0 73 11 230 27 0 0 2 4 0 83 79 55 11 118 0 8 0 0 1993 1 0 0 10 2 0 0 3 89 56 222 1 2484 1 543 394 0 1 1 722 620 616 0 0 0 0 0 0 0 0 0 0 0 0 0 0 0 0 0 0 0 0 0 0 0 0 0 0 0 0 0 0 0 0 0 0 0 0 0 0 0 0 0 0 0 0 0 0 0 0 0 0 0 0 0 0 0 0 0 0 0 0 0 0 0 0 0 0 0 0 0 0 0 0 0 0 0 0 0 0 0 0 0 0 0 0 0 0 0 0 0 0 0 0 0 0 0 0 0 0 0 0 0 0 0 0 0 0 0 0 0 0 0 0 0 0 0 0 0 0 0 0 0 0 0 0 0 0 0 0 0 0 0 0 0 0 0 0 0 0 0 0 0 0 0 0 0 0 0 0 0 0 0 0 0 0 0 0 0 0 0 0 0 0 0 0 0 0 0 0 0 0 0 0 0 0 0 0 0 0 0 0 0 0 0 0 0 0 0 0 0 0 0 0 0 0 0 0 0 0 0 0 0 0 0 0 0 0 0 0 0 0 0 0 0 0 0 0 0 0 0 0 0 0 0 0 0 0 0 0 0 0 0 0 0 0 0 0 0 0 0 0 0 0 0 0 0 0 0 0 0 0 0 0 0 0 0 0 0 0 0 0 0 0 0 0 0 0 0 0 0 0 0 0 0 0 0 0 0 0 0 0 0 0 0 0 0 0 0 0 0 0 0 0 0 0 0 0 0 0 0 0 0 0 0 0 0 0 0 0 0 0 0 0 0 0 0 0 0 0 0 0 0 0 0 0 0 0 0 0 0 0 0 0 0 0 0 0 0 0 0 0 0 0 0 0 0 0 0 0 0 0 0 0 0 0 0 0 0 0 0 0 0 0 0 0 0 0 0 0 0 0 0 0 0 0 0 0 0 0 0 0 0 0 0 0 0 0 0 0 0 0 0 0 0 0 0 0 0 0 0 0 0 0 0 0 0 0 0 0 0 0 0 0 0 0 0 0 0 0 0 0 0 0 0 0 0 0 0 0 0 0 0 0 0 0 0 0 0 0 0 0 0 0 0 0 0 0 0 0 0 0 0 0 0 0 0 0 0 0 0 0 0 0 0 0 0 0 0 0 0 0 0 0 0 0 0 0 0 0 0 0 0 0 0 0 0 0 0 0 0 0 0 0 0 0 0 0 0 0 0 0 0 0 0 0 0 0 0 0 0 0 0 0 0 0 0 0 0 0 0 0 0 0 0 0 0 0 0 0 0 0 0 0 0 0 0 0 0 0 0 0 0 0 0 0 0 0 0 0 0 0 0 0 0 0 0 0 0 0 0 0 0 0 0 0 0 0 0 0 0 0 0 0 0 0 0 0 0 0 0 0 0 0 0 0 0 0 0 0 0 0 0 0 0 0 0 0 0 0 0 0 0 0 0 0 0 0 0 0 0 0 0 0 0 0 0 0 0 0 0 0 0 0 0 0 0 0 0 0 0 0 0 0 0 0 0 0 0 0 0 0 0 0 0 0 0 0 0 0 0 0 0 0 0 0 0 0 0 0 0 0 0 0 0 0 0 0 0 0 0 0 0 0 0 0 0 0 0 0 0 0 0 0 0 0 0 0 0 0 0 0 0 0 0 0 0 0 0 0 0 0 0 0 0 0 0 0 0 0 0 0 0 0 0 0 0 0 0 0 0 0 0 0 0 0 0 0 0 0 0 0 0 0 0 0 0 0 0 0 0 0 0 0 0 0 0 0 0 0 0 0 0 0 0 0 0 0 0 0 0 0 0 0 0 0 0 0 0 0 0 0 0 0 0 0 0 0 0 0 0 0 0 0 0 0 0 0 0 0 0 0 0 0 0 0 0 0 0 0 0 0 0 0 0 0 0 0 0 0 0 0 0 0 0 0 0 0 0 0 0 0 0 0 0 0 0 0 0 0 0 0 0 0 0 0 0 0 0 0 0 0 0 0 0 0 0 0 0 0 0 0 0 0 0 0 0 0 0 0 0 0 0 0 0 0 0 0 0 0 0 0 0 0 0 0 0 0 0 0 0 0 0 0 0 0 0 0 0 0 0 0 0 0 0 0 0 0 0 0 0 0 0 0 0 0 0 0 0 0 0 0 0 0 0 0 0 0 0 0 0 0 0 0 0 0 0 0 0 0 0 0 0 0 0 0 0 0 0 0 0 0 0 0 0 0 0 0 0 0 0 0 0 0 0 0 0 0 0 0 0 0 0 0 0 0 0 0 0 0 0 0 0 0 0 0 0 0 0 0 0 0 0 0 0 0 0 0 0 0 0 0 0 0 0 0 0 0 0 0 0 0 0 0 0 0 0 0 0 0 0 0 0 0 0 0 0 0 0 0 0 0 0 0 0 0 0 0 0 0 0 0 0 0 0 0 0 0 0 0 0 0 0 0 0 0 0 0 0 0 0 0 0 0 0 0 0 0 0 0 0 0 0 0 0 0 0 0 0 0 0 0 0 0 0 0 0 0 0 0 0 0 0 0 0 0 0 0 0 0 0 0 0 0 0 0 0 0 0 0 0 0 0 0 0 0 0 0 0 0 0 0 0 0 0 0 0 0 0 0 0 0 0 0 0 0 0 0 0 0 0 0 0 0 0 0 0 0 0 0 0 0 0 0 0 0 0 0 0 0 0 0 0 0 0 0 0 0 0 0 0 0 0 0 0 0 0 0 0 0 0 0 0 0 0 0 0 0 0 0 0 0 0 0 0 0 0 0 0 0 0 0 0 0 0 0 0 0 0 0 0 0 0 0 0 0 0 0 0 0 0 0 0 0 0 0 0 0 0 0 0 0 0 0 0 0 0 0 0 0 0 0 0 0 0 0 0 0 0 0 0 0 0 0 0 0 0 0 0 0 0 0 0 0 0 0 0 0 0 0 0 0 0 0 0 0 0 0 0 0 0 0 0 0 0 0 0 0 0 0 0 0 0 0 0 0 0 0 0 0 0 0 0 0 0 0 0 0 0 0 0 0 0 0 0 0 0 0 0 0 0 0 0 0 0 0 0 0 0 0 0 0 0 0 0 0 0 0 0 0 0 0 0 0 0 0 0 0 0 0 0 0 0 0 0 0 0 0 0 0 0 0 0 0 0 0 0 0 0 0 0 0 0 0 0 0 0 0 0 0 0 0 0 0 0 0 0 0 0 0 0 0 0 0 0 0 0 0 0 0 0 0 0 0 0 0 0 0 0 0 0 0 0 0 0 0 0 0 0 0 0 0 0 0 0 0 0 0 0 0 0 0 0 0 0 0 0 0 0 0 0 0 0 0 0 0 0 0 0 0 0 0 0 0 0 0 0 0 0 0 0 0 0 0 0 0 0 0 0 0 0 0 0 0 0 0 0 0 0 0 0 0 0 0 0 0 0 0 0 0 0 0 0 0 0 0 0 0 0 0 0 0 0 0 0 0 0 0 0 0 0 0 0 0 0 0 0 0 0 0 0 0 0 0 0 0 0 0 0 0 0 0 0 0 0 0 0 0 0 0 0 0 0 0 0 0 0 0 0 0 0 0 0 0 0 0 0 0 0 0 0 0 0 0 0 0 0 0 SPN37 Bacteria;Actinobacteria;Actinobacteria;Actinomycetales;Actinomycetaceae;Schaalia;meyeri_nov_89.918% 288 230 7 152 121 241 4 773 31 43 134 20 185 113 29 294 107 18 45 46 641 96 141 26 202 128 12 224 14 34 107 153 62 71 203 211 120 65 77 10 112 48 92 93 61 46 29 78 7 158 38 74 56 42 169 60 256 76 10 32 128 38 119 14 205 14 14 84 119 89 162 123 33 298 56 94 141 74 36 63 69 173 70 9 275 315 231 126 27 93 14 46 4 4 585 331 5 34 8 259 73 66 123 131 45 84 107 5 58 35 59 37 29 115 134 20 70 245 36 33 162 25 57 120 127 480 101 141 120 15 114 60 108 102 24 42 58 285 138 64 29 0 16 59 1 150 106 13 203 55 101 157 57 65 432 128 142 176 83 209 75 6 128 22 130 170 27 362 55 170 0 201 338 110 331 571 162 202 46 112 55 146 75 116 97 193 87 236 162 104 367 255 118 169 234 33 78 117 47 148 10 114 134 51 31 42 6 0 19 4 24 22 81 87 79 117 5 173 6 109 11 24 107 14 21 150 24 113 4 44 157 5 293 15 591 130 84 141 23 15 27 62 47 26 18 279 207 31 30 290 34 10 310 123 167 62 359 348 75 116 181 165 137 260 64 320 179 464 0 0 0 0 0 0 0 0 0 0 0 0 0 0 0 0 0 0 0 0 0 0 0 0 0 0 0 0 0 0 0 0 0 0 0 0 0 0 0 0 0 0 0 0 0 0 0 0 0 0 0 0 0 0 0 0 0 0 0 0 0 0 0 0 0 0 0 0 0 0 0 0 0 0 0 0 0 0 0 0 0 0 0 0 0 0 0 0 0 0 0 0 0 0 0 0 0 0 0 0 0 0 0 0 0 0 0 0 0 0 0 0 0 0 0 0 0 0 0 0 0 0 0 0 0 0 0 0 0 0 0 0 0 0 0 0 0 0 0 0 0 0 0 0 0 0 0 0 0 0 0 0 0 0 0 0 0 0 0 0 0 0 0 0 0 0 0 0 0 0 0 0 0 0 0 0 0 0 0 0 0 0 0 0 0 0 0 0 0 0 0 0 0 0 0 0 0 0 0 0 0 0 0 0 0 0 0 0 0 0 0 0 0 0 0 0 0 0 0 0 0 0 0 0 0 0 0 0 0 0 0 0 0 0 0 0 0 0 0 0 0 0 0 0 0 0 0 0 0 0 0 0 0 0 0 0 0 0 0 0 0 0 0 0 0 0 0 0 0 0 0 0 0 0 0 0 0 0 0 0 0 0 0 0 0 0 0 0 0 0 0 0 0 0 0 0 0 0 0 0 0 0 0 0 0 0 0 0 0 0 0 0 0 0 0 0 0 0 0 0 0 0 0 0 0 0 0 0 0 0 0 0 0 0 0 0 0 0 0 0 0 0 0 0 0 0 0 0 0 0 0 0 0 0 0 0 0 0 0 0 0 0 0 0 0 0 0 0 0 0 0 0 0 0 0 0 0 0 0 0 0 0 0 0 0 0 0 0 0 0 0 0 0 0 0 0 0 0 0 0 0 0 0 0 0 0 0 0 0 0 0 0 0 0 0 0 0 0 0 0 0 0 0 0 0 0 0 0 0 0 0 0 0 0 0 0 0 0 0 0 0 0 0 0 0 0 0 0 0 0 0 0 0 0 0 0 0 0 0 0 0 0 0 0 0 0 0 0 0 0 0 0 0 0 0 0 0 0 0 0 0 0 0 0 0 0 0 0 0 0 0 0 0 0 0 0 0 0 0 0 0 0 0 0 0 0 0 0 0 0 0 0 0 0 0 0 0 0 0 0 0 0 0 0 0 0 0 0 0 0 0 0 0 0 0 0 0 0 0 0 0 0 0 0 0 0 0 0 0 0 0 0 0 0 0 0 0 0 0 0 0 0 0 0 0 0 0 0 0 0 0 0 0 0 0 0 0 0 0 0 0 0 0 0 0 0 0 0 0 0 0 0 0 0 0 0 0 0 0 0 0 0 0 0 0 0 0 0 0 0 0 0 0 0 0 0 0 0 0 0 0 0 0 0 0 0 0 0 0 0 0 0 0 0 0 0 0 0 0 0 0 0 0 0 0 0 0 0 0 0 0 0 0 0 0 0 0 0 0 0 0 0 0 0 0 0 0 0 0 0 0 0 0 0 0 0 0 0 0 0 0 0 0 0 0 0 0 0 0 0 0 0 0 0 0 0 0 0 0 0 0 0 0 0 0 0 0 0 0 0 0 0 0 0 0 0 0 0 0 0 0 0 0 0 0 0 0 0 0 0 0 0 0 0 0 0 0 0 0 0 0 0 0 0 0 0 0 0 0 0 0 0 0 0 0 0 0 0 0 0 0 0 0 0 0 0 0 0 0 0 0 0 0 0 0 0 0 0 0 0 0 0 0 0 0 0 0 0 0 0 0 0 0 0 0 0 0 0 0 0 0 0 0 0 0 0 0 0 0 0 0 0 0 0 0 0 0 0 0 0 0 0 0 0 0 0 0 0 0 0 0 0 0 0 0 0 0 0 0 0 0 0 0 0 0 0 0 0 0 0 0 0 0 0 0 0 0 0 0 0 0 0 0 0 0 0 0 0 0 0 0 0 0 0 0 0 0 0 0 0 0 0 0 0 0 0 0 0 0 0 0 0 0 0 0 0 0 0 0 0 0 0 0 0 0 0 0 0 0 0 0 0 0 0 0 0 0 0 0 0 0 0 0 0 0 0 0 0 0 0 0 0 0 0 0 0 0 0 0 0 0 0 0 0 0 0 0 0 0 0 0 0 0 0 0 0 0 0 0 0 0 0 0 0 0 0 0 0 0 0 0 0 0 0 0 0 0 0 0 0 0 0 0 0 0 0 0 0 0 0 0 0 0 0 0 0 0 0 0 0 0 0 0 0 0 0 0 0 0 0 0 0 0 0 0 0 0 0 0 0 0 0 0 0 0 0 0 0 0 0 0 0 0 0 0 0 0 0 0 0 0 0 0 0 0 0 0 0 0 0 0 0 0 0 0 0 0 0 0 0 0 0 0 0 0 0 0 0 0 0 0 0 0 0 0 0 0 0 0 0 0 0 0 0 0 0 0 0 0 0 0 0 0 0 0 0 0 0 0 0 0 0 0 0 0 0 0 0 0 0 0 0 0 0 0 0 0 0 0 0 0 0 0 0 0 0 0 0 0 0 0 0 0 0 0 0 0 0 0 0 0 0 0 0 0 0 0 0 0 0 0 0 0 0 0 0 0 0 0 0 0 0 0 0 0 0 0 0 0 0 0 0 0 0 0 0 0 0 0 0 0 0 0 0 0 0 0 0 0 0 0 0 0 0 0 0 0 0 0 0 0 0 0 0 0 0 0 0 0 0 0 0 0 0 0 0 0 0 0 0 0 0 0 0 0 0 0 0 0 0 0 0 0 0 0 0 0 0 0 0 0 0 0 0 0 0 0 0 0 0 0 0 0 0 0 0 0 0 0 0 0 0 0 0 0 0 0 0 0 0 0 0 0 0 0 0 0 0 0 0 0 0 0 0 0 0 0 0 0 0 0 0 0 0 0 0 0 0 0 0 0 0 0 0 0 0 0 0 0 0 0 0 0 0 0 0 0 0 0 0 0 0 0 0 0 0 0 0 0 0 0 0 0 0 0 0 0 0 0 0 0 0 0 0 0 0 0 0 0 0 0 0 0 0 0 0 0 0 0 0 0 0 0 0 0 0 0 0 0 0 0 0 0 0 0 0 0 0 0 0 0 0 0 0 0 0 0 0 0 0 0 0 0 0 0 0 0 0 0 0 0 0 0 0 0 0 0 0 0 0 0 0 0 0 0 0 0 0 0 0 0 0 0 0 0 0 0 0 0 0 0 0 0 0 0 0 0 0 0 0 0 0 0 0 0 0 0 0 0 0 0 0 0 0 0 0 0 0 0 0 0 0 0 0 0 0 0 0 0 0 0 0 0 0 0 0 0 0 0 0 0 0 0 0 0 0 0 0 0 0 0 0 0 0 0 0 0 0 0 0 0 0 0 0 0 0 0 0 0 0 0 0 0 0 0 0 0 0 0 0 0 0 0 0 0 0 0 0 0 0 0 0 0 0 0 0 0 0 0 0 0 0 0 0 0 0 0 0 0 0 0 0 0 0 0 0 SPN4 Bacteria;Firmicutes;Bacilli;Bacillales;Gemellaceae;Gemella;haemolysans_nov_94.188% 53 602 23 91 418 449 694 110 82 506 225 565 78 439 23 121 237 549 78 72 92 99 463 315 183 144 272 69 149 369 144 100 291 29 154 309 73 442 101 418 138 857 51 174 184 134 360 199 1214 375 109 79 81 96 136 208 152 302 642 241 327 480 51 874 121 686 571 47 806 90 151 300 372 126 191 781 279 165 1079 515 153 375 473 1172 32 234 98 177 1639 7 532 53 433 179 122 212 949 159 153 592 230 281 351 123 1500 272 282 1559 93 274 525 145 177 382 370 600 52 164 147 277 114 198 48 144 48 420 99 195 93 1293 85 89 244 203 65 689 125 162 27 127 489 1726 252 418 1027 346 120 361 124 36 53 85 80 391 341 651 227 639 54 194 280 693 31 212 316 201 143 345 215 154 204 208 339 319 7 48 262 323 73 434 175 215 298 78 133 225 148 37 96 16 169 236 301 177 104 1240 63 187 933 60 632 40 55 156 15 39 1035 72 211 35 63 418 85 80 67 68 804 157 1116 60 300 454 292 284 37 66 75 288 361 5 49 764 224 36 30 36 66 192 242 67 205 49 7 232 490 101 90 67 60 160 20 78 67 27 27 65 442 91 233 85 205 93 253 62 174 34 47 92 0 0 0 0 0 0 0 0 0 0 0 0 0 0 0 0 0 0 0 0 0 0 0 0 0 0 0 0 0 0 0 0 0 0 0 0 0 0 0 0 0 0 0 0 0 0 0 0 0 0 0 0 0 0 0 0 0 0 0 0 0 0 0 0 0 0 0 0 0 0 0 0 0 0 0 0 0 0 0 0 0 0 0 0 0 0 0 0 0 0 0 0 0 0 0 0 0 0 0 0 0 0 0 0 0 0 0 0 0 0 0 0 0 0 0 0 0 0 0 0 0 0 0 0 0 0 0 0 0 0 0 0 0 0 0 0 0 0 0 0 0 0 0 0 0 0 0 0 0 0 0 0 0 0 0 0 0 0 0 0 0 0 0 0 0 0 0 0 0 0 0 0 0 0 0 0 0 0 0 0 0 0 0 0 0 0 0 0 0 0 0 0 0 0 0 0 0 0 0 0 0 0 0 0 0 0 0 0 0 0 0 0 0 0 0 0 0 0 0 0 0 0 0 0 0 0 0 0 0 0 0 0 0 0 0 0 0 0 0 0 0 0 0 0 0 0 0 0 0 0 0 0 0 0 0 0 0 0 0 0 0 0 0 0 0 0 0 0 0 0 0 0 0 0 0 0 0 0 0 0 0 0 0 0 0 0 0 0 0 0 0 0 0 0 0 0 0 0 0 0 0 0 0 0 0 0 0 0 0 0 0 0 0 0 0 0 0 0 0 0 0 0 0 0 0 0 0 0 0 0 0 0 0 0 0 0 0 0 0 0 0 0 0 0 0 0 0 0 0 0 0 0 0 0 0 0 0 0 0 0 0 0 0 0 0 0 0 0 0 0 0 0 0 0 0 0 0 0 0 0 0 0 0 0 0 0 0 0 0 0 0 0 0 0 0 0 0 0 0 0 0 0 0 0 0 0 0 0 0 0 0 0 0 0 0 0 0 0 0 0 0 0 0 0 0 0 0 0 0 0 0 0 0 0 0 0 0 0 0 0 0 0 0 0 0 0 0 0 0 0 0 0 0 0 0 0 0 0 0 0 0 0 0 0 0 0 0 0 0 0 0 0 0 0 0 0 0 0 0 0 0 0 0 0 0 0 0 0 0 0 0 0 0 0 0 0 0 0 0 0 0 0 0 0 0 0 0 0 0 0 0 0 0 0 0 0 0 0 0 0 0 0 0 0 0 0 0 0 0 0 0 0 0 0 0 0 0 0 0 0 0 0 0 0 0 0 0 0 0 0 0 0 0 0 0 0 0 0 0 0 0 0 0 0 0 0 0 0 0 0 0 0 0 0 0 0 0 0 0 0 0 0 0 0 0 0 0 0 0 0 0 0 0 0 0 0 0 0 0 0 0 0 0 0 0 0 0 0 0 0 0 0 0 0 0 0 0 0 0 0 0 0 0 0 0 0 0 0 0 0 0 0 0 0 0 0 0 0 0 0 0 0 0 0 0 0 0 0 0 0 0 0 0 0 0 0 0 0 0 0 0 0 0 0 0 0 0 0 0 0 0 0 0 0 0 0 0 0 0 0 0 0 0 0 0 0 0 0 0 0 0 0 0 0 0 0 0 0 0 0 0 0 0 0 0 0 0 0 0 0 0 0 0 0 0 0 0 0 0 0 0 0 0 0 0 0 0 0 0 0 0 0 0 0 0 0 0 0 0 0 0 0 0 0 0 0 0 0 0 0 0 0 0 0 0 0 0 0 0 0 0 0 0 0 0 0 0 0 0 0 0 0 0 0 0 0 0 0 0 0 0 0 0 0 0 0 0 0 0 0 0 0 0 0 0 0 0 0 0 0 0 0 0 0 0 0 0 0 0 0 0 0 0 0 0 0 0 0 0 0 0 0 0 0 0 0 0 0 0 0 0 0 0 0 0 0 0 0 0 0 0 0 0 0 0 0 0 0 0 0 0 0 0 0 0 0 0 0 0 0 0 0 0 0 0 0 0 0 0 0 0 0 0 0 0 0 0 0 0 0 0 0 0 0 0 0 0 0 0 0 0 0 0 0 0 0 0 0 0 0 0 0 0 0 0 0 0 0 0 0 0 0 0 0 0 0 0 0 0 0 0 0 0 0 0 0 0 0 0 0 0 0 0 0 0 0 0 0 0 0 0 0 0 0 0 0 0 0 0 0 0 0 0 0 0 0 0 0 0 0 0 0 0 0 0 0 0 0 0 0 0 0 0 0 0 0 0 0 0 0 0 0 0 0 0 0 0 0 0 0 0 0 0 0 0 0 0 0 0 0 0 0 0 0 0 0 0 0 0 0 0 0 0 0 0 0 0 0 0 0 0 0 0 0 0 0 0 0 0 0 0 0 0 0 0 0 0 0 0 0 0 0 0 0 0 0 0 0 0 0 0 0 0 0 0 0 0 0 0 0 0 0 0 0 0 0 0 0 0 0 0 0 0 0 0 0 0 0 0 0 0 0 0 0 0 0 0 0 0 0 0 0 0 0 0 0 0 0 0 0 0 0 0 0 0 0 0 0 0 0 0 0 0 0 0 0 0 0 0 0 0 0 0 0 0 0 0 0 0 0 0 0 0 0 0 0 0 0 0 0 0 0 0 0 0 0 0 0 0 0 0 0 0 0 0 0 0 0 0 0 0 0 0 0 0 0 0 0 0 0 0 0 0 0 0 0 0 0 0 0 0 0 0 0 0 0 0 0 0 0 0 0 0 0 0 0 0 0 0 0 0 0 0 0 0 0 0 0 0 0 0 0 0 0 0 0 0 0 0 0 0 0 0 0 0 0 0 0 0 0 0 0 0 0 0 0 0 0 0 0 0 0 0 0 0 0 0 0 0 0 0 0 0 0 0 0 0 0 0 0 0 0 0 0 0 0 0 0 0 0 0 0 0 0 0 0 0 0 0 0 0 0 0 0 0 0 0 0 0 0 0 0 0 0 0 0 0 0 0 0 0 0 0 0 0 0 0 0 0 0 0 0 0 0 0 0 0 0 0 0 0 0 0 0 0 0 0 0 0 0 0 0 0 0 0 0 0 0 0 0 0 0 0 0 0 0 0 0 0 0 0 0 0 0 0 0 0 0 0 0 0 0 0 0 0 0 0 0 0 0 0 0 0 0 0 0 0 0 0 0 0 0 0 0 0 0 0 0 0 0 0 0 0 0 0 0 0 0 0 0 0 0 0 0 0 0 0 0 0 0 0 0 0 0 0 0 0 0 0 0 0 0 0 0 0 0 0 0 0 0 0 0 0 0 0 0 0 0 0 0 0 0 0 0 0 0 0 0 0 0 0 0 0 0 0 0 0 0 0 0 0 0 0 0 0 0 0 0 0 0 0 0 0 0 0 0 0 0 0 0 0 0 0 0 0 0 0 0 0 0 0 0 0 0 0 0 0 0 0 0 0 0 0 0 0 0 0 0 0 0 0 0 0 0 0 0 0 0 0 0 0 0 0 0 0 0 0 0 0 0 0 0 0 0 0 0 0 0 0 0 0 0 0 0 0 0 0 0 0 0 0 0 0 0 0 0 SPN41 Bacteria;Firmicutes;Bacilli;Lactobacillales;Streptococcaceae;Streptococcus;downii_nov_94.343% 2 82 1 7 338 198 42 15 11 142 14 154 9 65 6 4 54 103 6 9 9 26 93 95 28 14 104 4 39 150 16 8 110 2 27 40 37 256 4 240 11 393 19 38 19 12 144 26 471 56 6 1 28 26 25 21 8 46 248 36 65 147 2 432 20 274 205 10 104 30 41 137 162 39 27 144 52 16 654 156 75 244 60 464 16 68 33 22 572 2 185 13 286 66 40 169 539 8 31 97 8 146 53 0 865 100 30 166 15 86 109 22 29 135 114 159 14 29 34 136 1 43 4 47 8 87 5 17 15 749 26 23 23 42 18 409 20 24 4 30 229 1357 120 99 568 95 17 145 46 13 4 18 7 35 130 144 26 188 7 35 35 126 2 22 38 12 28 88 79 38 126 36 74 140 1 10 39 57 21 88 5 37 103 10 22 35 26 8 12 3 37 25 41 20 12 260 6 47 246 8 214 6 8 11 6 2 349 10 21 7 1 121 6 10 14 13 247 10 700 11 155 73 147 82 3 12 14 106 140 0 19 349 9 16 7 4 1 15 122 20 88 7 0 10 163 12 4 4 8 11 2 7 16 0 0 4 60 7 37 3 34 0 39 10 18 1 1 9 0 0 0 0 0 0 0 0 0 0 0 0 0 0 0 0 0 0 0 0 0 0 0 0 0 0 0 0 0 0 0 0 0 0 0 0 0 0 0 0 0 0 0 0 0 0 0 0 0 0 0 0 0 0 0 0 0 0 0 0 0 0 0 0 0 0 0 0 0 0 0 0 0 0 0 0 0 0 0 0 0 0 0 0 0 0 0 0 0 0 0 0 0 0 0 0 0 0 0 0 0 0 0 0 0 0 0 0 0 0 0 0 0 0 0 0 0 0 0 0 0 0 0 0 0 0 0 0 0 0 0 0 0 0 0 0 0 0 0 0 0 0 0 0 0 0 0 0 0 0 0 0 0 0 0 0 0 0 0 0 0 0 0 0 0 0 0 0 0 0 0 0 0 0 0 0 0 0 0 0 0 0 0 0 0 0 0 0 0 0 0 0 0 0 0 0 0 0 0 0 0 0 0 0 0 0 0 0 0 0 0 0 0 0 0 0 0 0 0 0 0 0 0 0 0 0 0 0 0 0 0 0 0 0 0 0 0 0 0 0 0 0 0 0 0 0 0 0 0 0 0 0 0 0 0 0 0 0 0 0 0 0 0 0 0 0 0 0 0 0 0 0 0 0 0 0 0 0 0 0 0 0 0 0 0 0 0 0 0 0 0 0 0 0 0 0 0 0 0 0 0 0 0 0 0 0 0 0 0 0 0 0 0 0 0 0 0 0 0 0 0 0 0 0 0 0 0 0 0 0 0 0 0 0 0 0 0 0 0 0 0 0 0 0 0 0 0 0 0 0 0 0 0 0 0 0 0 0 0 0 0 0 0 0 0 0 0 0 0 0 0 0 0 0 0 0 0 0 0 0 0 0 0 0 0 0 0 0 0 0 0 0 0 0 0 0 0 0 0 0 0 0 0 0 0 0 0 0 0 0 0 0 0 0 0 0 0 0 0 0 0 0 0 0 0 0 0 0 0 0 0 0 0 0 0 0 0 0 0 0 0 0 0 0 0 0 0 0 0 0 0 0 0 0 0 0 0 0 0 0 0 0 0 0 0 0 0 0 0 0 0 0 0 0 0 0 0 0 0 0 0 0 0 0 0 0 0 0 0 0 0 0 0 0 0 0 0 0 0 0 0 0 0 0 0 0 0 0 0 0 0 0 0 0 0 0 0 0 0 0 0 0 0 0 0 0 0 0 0 0 0 0 0 0 0 0 0 0 0 0 0 0 0 0 0 0 0 0 0 0 0 0 0 0 0 0 0 0 0 0 0 0 0 0 0 0 0 0 0 0 0 0 0 0 0 0 0 0 0 0 0 0 0 0 0 0 0 0 0 0 0 0 0 0 0 0 0 0 0 0 0 0 0 0 0 0 0 0 0 0 0 0 0 0 0 0 0 0 0 0 0 0 0 0 0 0 0 0 0 0 0 0 0 0 0 0 0 0 0 0 0 0 0 0 0 0 0 0 0 0 0 0 0 0 0 0 0 0 0 0 0 0 0 0 0 0 0 0 0 0 0 0 0 0 0 0 0 0 0 0 0 0 0 0 0 0 0 0 0 0 0 0 0 0 0 0 0 0 0 0 0 0 0 0 0 0 0 0 0 0 0 0 0 0 0 0 0 0 0 0 0 0 0 0 0 0 0 0 0 0 0 0 0 0 0 0 0 0 0 0 0 0 0 0 0 0 0 0 0 0 0 0 0 0 0 0 0 0 0 0 0 0 0 0 0 0 0 0 0 0 0 0 0 0 0 0 0 0 0 0 0 0 0 0 0 0 0 0 0 0 0 0 0 0 0 0 0 0 0 0 0 0 0 0 0 0 0 0 0 0 0 0 0 0 0 0 0 0 0 0 0 0 0 0 0 0 0 0 0 0 0 0 0 0 0 0 0 0 0 0 0 0 0 0 0 0 0 0 0 0 0 0 0 0 0 0 0 0 0 0 0 0 0 0 0 0 0 0 0 0 0 0 0 0 0 0 0 0 0 0 0 0 0 0 0 0 0 0 0 0 0 0 0 0 0 0 0 0 0 0 0 0 0 0 0 0 0 0 0 0 0 0 0 0 0 0 0 0 0 0 0 0 0 0 0 0 0 0 0 0 0 0 0 0 0 0 0 0 0 0 0 0 0 0 0 0 0 0 0 0 0 0 0 0 0 0 0 0 0 0 0 0 0 0 0 0 0 0 0 0 0 0 0 0 0 0 0 0 0 0 0 0 0 0 0 0 0 0 0 0 0 0 0 0 0 0 0 0 0 0 0 0 0 0 0 0 0 0 0 0 0 0 0 0 0 0 0 0 0 0 0 0 0 0 0 0 0 0 0 0 0 0 0 0 0 0 0 0 0 0 0 0 0 0 0 0 0 0 0 0 0 0 0 0 0 0 0 0 0 0 0 0 0 0 0 0 0 0 0 0 0 0 0 0 0 0 0 0 0 0 0 0 0 0 0 0 0 0 0 0 0 0 0 0 0 0 0 0 0 0 0 0 0 0 0 0 0 0 0 0 0 0 0 0 0 0 0 0 0 0 0 0 0 0 0 0 0 0 0 0 0 0 0 0 0 0 0 0 0 0 0 0 0 0 0 0 0 0 0 0 0 0 0 0 0 0 0 0 0 0 0 0 0 0 0 0 0 0 0 0 0 0 0 0 0 0 0 0 0 0 0 0 0 0 0 0 0 0 0 0 0 0 0 0 0 0 0 0 0 0 0 0 0 0 0 0 0 0 0 0 0 0 0 0 0 0 0 0 0 0 0 0 0 0 0 0 0 0 0 0 0 0 0 0 0 0 0 0 0 0 0 0 0 0 0 0 0 0 0 0 0 0 0 0 0 0 0 0 0 0 0 0 0 0 0 0 0 0 0 0 0 0 0 0 0 0 0 0 0 0 0 0 0 0 0 0 0 0 0 0 0 0 0 0 0 0 0 0 0 0 0 0 0 0 0 0 0 0 0 0 0 0 0 0 0 0 0 0 0 0 0 0 0 0 0 0 0 0 0 0 0 0 0 0 0 0 0 0 0 0 0 0 0 0 0 0 0 0 0 0 0 0 0 0 0 0 0 0 0 0 0 0 0 0 0 0 0 0 0 0 0 0 0 0 0 0 0 0 0 0 0 0 0 0 0 0 0 0 0 0 0 0 0 0 0 0 0 0 0 0 0 0 0 0 0 0 0 0 0 0 0 0 0 0 0 0 0 0 0 0 0 0 0 0 0 0 0 0 0 0 0 0 0 0 0 0 0 0 0 0 0 0 0 0 0 0 0 0 0 0 0 0 0 0 0 0 0 0 0 0 0 0 0 0 0 0 0 0 0 0 0 0 0 0 0 0 0 0 0 0 0 0 0 0 0 0 0 0 0 0 0 0 0 0 0 0 0 0 0 0 0 0 0 0 0 0 0 0 0 0 0 0 0 0 0 0 0 0 0 0 0 0 0 0 0 0 0 0 0 0 0 0 0 0 0 0 0 0 0 0 0 0 0 0 0 0 0 0 0 0 0 0 0 0 0 0 SPN49 Bacteria;Bacteroidetes;Bacteroidia;Bacteroidales;Prevotellaceae;Prevotella;sp. HMT305 nov_93.865% 1 14 0 1 0 29 1 23 0 0 42 1 3 7 8 30 52 0 273 178 0 0 0 0 0 0 0 0 0 0 31 80 2 0 109 2 0 0 0 0 737 0 19 0 0 437 0 0 0 0 0 0 0 0 301 44 1 14 0 22 0 0 0 0 2171 3 0 250 7 1090 0 11 0 0 0 7 59 19 0 0 201 321 0 32 0 24 4 1 3 45 0 0 0 11 29 14 0 21 2 0 0 0 0 9 0 4 121 0 1173 0 0 2 0 838 8 3 881 0 686 7 0 394 0 72 30 31 13 7 20 0 1099 466 0 12 75 4 4964 6 2 44 0 0 0 4 0 2 147 244 75 0 123 83 25 4 2 7 319 0 0 16 5 0 9 0 0 0 0 66 0 0 0 0 0 1 0 1 42 22 1 0 1 1 5 104 0 15 19 29 37 416 25 3 54 14 0 0 0 140 16 0 0 30 0 232 1 0 0 0 0 1 127 3 12 0 0 210 0 9 0 23 3 52 0 5 0 281 3020 3 1 35 21 0 4 0 3 66 6 0 833 4 0 286 931 1 0 22 36 17 2490 0 871 2 6 5 0 4 85 11 0 50 0 1 4 888 48 1 51 0 0 0 0 0 0 0 0 0 0 0 0 0 0 0 0 0 0 0 0 0 0 0 0 0 0 0 0 0 0 0 0 0 0 0 0 0 0 0 0 0 0 0 0 0 0 0 0 0 0 0 0 0 0 0 0 0 0 0 0 0 0 0 0 0 0 0 0 0 0 0 0 0 0 0 0 0 0 0 0 0 0 0 0 0 0 0 0 0 0 0 0 0 0 0 0 0 0 0 0 0 0 0 0 0 0 0 0 0 0 0 0 0 0 0 0 0 0 0 0 0 0 0 0 0 0 0 0 0 0 0 0 0 0 0 0 0 0 0 0 0 0 0 0 0 0 0 0 0 0 0 0 0 0 0 0 0 0 0 0 0 0 0 0 0 0 0 0 0 0 0 0 0 0 0 0 0 0 0 0 0 0 0 0 0 0 0 0 0 0 0 0 0 0 0 0 0 0 0 0 0 0 0 0 0 0 0 0 0 0 0 0 0 0 0 0 0 0 0 0 0 0 0 0 0 0 0 0 0 0 0 0 0 0 0 0 0 0 0 0 0 0 0 0 0 0 0 0 0 0 0 0 0 0 0 0 0 0 0 0 0 0 0 0 0 0 0 0 0 0 0 0 0 0 0 0 0 0 0 0 0 0 0 0 0 0 0 0 0 0 0 0 0 0 0 0 0 0 0 0 0 0 0 0 0 0 0 0 0 0 0 0 0 0 0 0 0 0 0 0 0 0 0 0 0 0 0 0 0 0 0 0 0 0 0 0 0 0 0 0 0 0 0 0 0 0 0 0 0 0 0 0 0 0 0 0 0 0 0 0 0 0 0 0 0 0 0 0 0 0 0 0 0 0 0 0 0 0 0 0 0 0 0 0 0 0 0 0 0 0 0 0 0 0 0 0 0 0 0 0 0 0 0 0 0 0 0 0 0 0 0 0 0 0 0 0 0 0 0 0 0 0 0 0 0 0 0 0 0 0 0 0 0 0 0 0 0 0 0 0 0 0 0 0 0 0 0 0 0 0 0 0 0 0 0 0 0 0 0 0 0 0 0 0 0 0 0 0 0 0 0 0 0 0 0 0 0 0 0 0 0 0 0 0 0 0 0 0 0 0 0 0 0 0 0 0 0 0 0 0 0 0 0 0 0 0 0 0 0 0 0 0 0 0 0 0 0 0 0 0 0 0 0 0 0 0 0 0 0 0 0 0 0 0 0 0 0 0 0 0 0 0 0 0 0 0 0 0 0 0 0 0 0 0 0 0 0 0 0 0 0 0 0 0 0 0 0 0 0 0 0 0 0 0 0 0 0 0 0 0 0 0 0 0 0 0 0 0 0 0 0 0 0 0 0 0 0 0 0 0 0 0 0 0 0 0 0 0 0 0 0 0 0 0 0 0 0 0 0 0 0 0 0 0 0 0 0 0 0 0 0 0 0 0 0 0 0 0 0 0 0 0 0 0 0 0 0 0 0 0 0 0 0 0 0 0 0 0 0 0 0 0 0 0 0 0 0 0 0 0 0 0 0 0 0 0 0 0 0 0 0 0 0 0 0 0 0 0 0 0 0 0 0 0 0 0 0 0 0 0 0 0 0 0 0 0 0 0 0 0 0 0 0 0 0 0 0 0 0 0 0 0 0 0 0 0 0 0 0 0 0 0 0 0 0 0 0 0 0 0 0 0 0 0 0 0 0 0 0 0 0 0 0 0 0 0 0 0 0 0 0 0 0 0 0 0 0 0 0 0 0 0 0 0 0 0 0 0 0 0 0 0 0 0 0 0 0 0 0 0 0 0 0 0 0 0 0 0 0 0 0 0 0 0 0 0 0 0 0 0 0 0 0 0 0 0 0 0 0 0 0 0 0 0 0 0 0 0 0 0 0 0 0 0 0 0 0 0 0 0 0 0 0 0 0 0 0 0 0 0 0 0 0 0 0 0 0 0 0 0 0 0 0 0 0 0 0 0 0 0 0 0 0 0 0 0 0 0 0 0 0 0 0 0 0 0 0 0 0 0 0 0 0 0 0 0 0 0 0 0 0 0 0 0 0 0 0 0 0 0 0 0 0 0 0 0 0 0 0 0 0 0 0 0 0 0 0 0 0 0 0 0 0 0 0 0 0 0 0 0 0 0 0 0 0 0 0 0 0 0 0 0 0 0 0 0 0 0 0 0 0 0 0 0 0 0 0 0 0 0 0 0 0 0 0 0 0 0 0 0 0 0 0 0 0 0 0 0 0 0 0 0 0 0 0 0 0 0 0 0 0 0 0 0 0 0 0 0 0 0 0 0 0 0 0 0 0 0 0 0 0 0 0 0 0 0 0 0 0 0 0 0 0 0 0 0 0 0 0 0 0 0 0 0 0 0 0 0 0 0 0 0 0 0 0 0 0 0 0 0 0 0 0 0 0 0 0 0 0 0 0 0 0 0 0 0 0 0 0 0 0 0 0 0 0 0 0 0 0 0 0 0 0 0 0 0 0 0 0 0 0 0 0 0 0 0 0 0 0 0 0 0 0 0 0 0 0 0 0 0 0 0 0 0 0 0 0 0 0 0 0 0 0 0 0 0 0 0 0 0 0 0 0 0 0 0 0 0 0 0 0 0 0 0 0 0 0 0 0 0 0 0 0 0 0 0 0 0 0 0 0 0 0 0 0 0 0 0 0 0 0 0 0 0 0 0 0 0 0 0 0 0 0 0 0 0 0 0 0 0 0 0 0 0 0 0 0 0 0 0 0 0 0 0 0 0 0 0 0 0 0 0 0 0 0 0 0 0 0 0 0 0 0 0 0 0 0 0 0 0 0 0 0 0 0 0 0 0 0 0 0 0 0 0 0 0 0 0 0 0 0 0 0 0 0 0 0 0 0 0 0 0 0 0 0 0 0 0 0 0 0 0 0 0 0 0 0 0 0 0 0 0 0 0 0 0 0 0 0 0 0 0 0 0 0 0 0 0 0 0 0 0 0 0 0 0 0 0 0 0 0 0 0 0 0 0 0 0 0 0 0 0 0 0 0 0 0 0 0 0 0 0 0 0 0 0 0 0 0 0 0 0 0 0 0 0 0 0 0 0 0 0 0 0 0 0 0 0 0 0 0 0 0 0 0 0 0 0 0 0 0 0 0 0 0 0 0 0 0 0 0 0 0 0 0 0 0 0 0 0 0 0 0 0 0 0 0 0 0 0 0 0 0 0 0 0 0 0 0 0 0 0 0 0 0 0 0 0 0 0 0 0 0 0 0 0 0 0 0 0 0 0 0 0 0 0 0 0 0 0 0 0 0 0 0 0 0 0 0 0 0 0 0 0 0 0 0 0 0 0 0 0 0 0 0 0 0 0 0 0 0 0 0 0 0 0 0 0 0 0 0 0 0 0 0 0 0 0 0 0 0 0 0 0 0 0 0 0 0 0 0 0 0 0 0 0 0 0 0 0 0 0 0 0 0 0 0 0 0 0 0 0 0 0 0 0 0 0 0 0 0 0 0 0 0 0 0 0 0 0 0 0 0 0 0 0 0 SPN66 Bacteria;Firmicutes;Bacilli;Lactobacillales;Streptococcaceae;Streptococcus;sp. HMT061 nov_84.538% 705 1386 822 972 1760 981 1506 483 1378 1265 293 277 226 534 153 671 1445 646 221 159 498 1276 1117 454 751 596 892 821 929 287 156 216 678 301 429 829 554 408 582 468 151 592 210 538 887 88 562 629 336 1003 287 163 183 1108 425 499 799 1159 771 196 1308 877 790 583 433 360 1335 97 1914 251 377 406 561 467 941 339 494 319 656 590 292 502 830 297 252 501 355 801 669 127 323 366 201 487 674 968 337 454 420 767 689 243 706 828 1015 1011 600 484 228 764 702 1837 286 457 295 435 147 461 117 573 476 154 218 448 184 751 184 331 167 340 135 158 627 469 99 201 82 513 1413 340 405 358 394 922 481 345 269 129 511 1007 158 407 299 686 753 1135 186 1032 307 574 940 287 356 549 710 1117 324 812 605 1078 38 1102 774 898 903 1051 829 734 838 1046 524 1452 919 251 220 940 384 378 387 248 347 1468 341 366 699 445 240 555 566 1010 793 197 309 205 192 117 345 412 679 1434 173 264 271 528 804 272 227 548 786 299 123 386 1087 440 223 242 148 924 573 79 336 576 1221 186 909 235 147 743 213 185 808 164 46 1340 1139 651 315 190 65 497 208 290 406 128 964 993 475 1105 719 295 658 345 755 416 450 552 497 657 0 0 0 0 0 0 0 0 0 0 0 0 0 0 0 0 0 0 0 0 0 0 0 0 0 0 0 0 0 0 0 0 0 0 0 0 0 0 0 0 0 0 0 0 0 0 0 0 0 0 0 0 0 0 0 0 0 0 0 0 0 0 0 0 0 0 0 0 0 0 0 0 0 0 0 0 0 0 0 0 0 0 0 0 0 0 0 0 0 0 0 0 0 0 0 0 0 0 0 0 0 0 0 0 0 0 0 0 0 0 0 0 0 0 0 0 0 0 0 0 0 0 0 0 0 0 0 0 0 0 0 0 0 0 0 0 0 0 0 0 0 0 0 0 0 0 0 0 0 0 0 0 0 0 0 0 0 0 0 0 0 0 0 0 0 0 0 0 0 0 0 0 0 0 0 0 0 0 0 0 0 0 0 0 0 0 0 0 0 0 0 0 0 0 0 0 0 0 0 0 0 0 0 0 0 0 0 0 0 0 0 0 0 0 0 0 0 0 0 0 0 0 0 0 0 0 0 0 0 0 0 0 0 0 0 0 0 0 0 0 0 0 0 0 0 0 0 0 0 0 0 0 0 0 0 0 0 0 0 0 0 0 0 0 0 0 0 0 0 0 0 0 0 0 0 0 0 0 0 0 0 0 0 0 0 0 0 0 0 0 0 0 0 0 0 0 0 0 0 0 0 0 0 0 0 0 0 0 0 0 0 0 0 0 0 0 0 0 0 0 0 0 0 0 0 0 0 0 0 0 0 0 0 0 0 0 0 0 0 0 0 0 0 0 0 0 0 0 0 0 0 0 0 0 0 0 0 0 0 0 0 0 0 0 0 0 0 0 0 0 0 0 0 0 0 0 0 0 0 0 0 0 0 0 0 0 0 0 0 0 0 0 0 0 0 0 0 0 0 0 0 0 0 0 0 0 0 0 0 0 0 0 0 0 0 0 0 0 0 0 0 0 0 0 0 0 0 0 0 0 0 0 0 0 0 0 0 0 0 0 0 0 0 0 0 0 0 0 0 0 0 0 0 0 0 0 0 0 0 0 0 0 0 0 0 0 0 0 0 0 0 0 0 0 0 0 0 0 0 0 0 0 0 0 0 0 0 0 0 0 0 0 0 0 0 0 0 0 0 0 0 0 0 0 0 0 0 0 0 0 0 0 0 0 0 0 0 0 0 0 0 0 0 0 0 0 0 0 0 0 0 0 0 0 0 0 0 0 0 0 0 0 0 0 0 0 0 0 0 0 0 0 0 0 0 0 0 0 0 0 0 0 0 0 0 0 0 0 0 0 0 0 0 0 0 0 0 0 0 0 0 0 0 0 0 0 0 0 0 0 0 0 0 0 0 0 0 0 0 0 0 0 0 0 0 0 0 0 0 0 0 0 0 0 0 0 0 0 0 0 0 0 0 0 0 0 0 0 0 0 0 0 0 0 0 0 0 0 0 0 0 0 0 0 0 0 0 0 0 0 0 0 0 0 0 0 0 0 0 0 0 0 0 0 0 0 0 0 0 0 0 0 0 0 0 0 0 0 0 0 0 0 0 0 0 0 0 0 0 0 0 0 0 0 0 0 0 0 0 0 0 0 0 0 0 0 0 0 0 0 0 0 0 0 0 0 0 0 0 0 0 0 0 0 0 0 0 0 0 0 0 0 0 0 0 0 0 0 0 0 0 0 0 0 0 0 0 0 0 0 0 0 0 0 0 0 0 0 0 0 0 0 0 0 0 0 0 0 0 0 0 0 0 0 0 0 0 0 0 0 0 0 0 0 0 0 0 0 0 0 0 0 0 0 0 0 0 0 0 0 0 0 0 0 0 0 0 0 0 0 0 0 0 0 0 0 0 0 0 0 0 0 0 0 0 0 0 0 0 0 0 0 0 0 0 0 0 0 0 0 0 0 0 0 0 0 0 0 0 0 0 0 0 0 0 0 0 0 0 0 0 0 0 0 0 0 0 0 0 0 0 0 0 0 0 0 0 0 0 0 0 0 0 0 0 0 0 0 0 0 0 0 0 0 0 0 0 0 0 0 0 0 0 0 0 0 0 0 0 0 0 0 0 0 0 0 0 0 0 0 0 0 0 0 0 0 0 0 0 0 0 0 0 0 0 0 0 0 0 0 0 0 0 0 0 0 0 0 0 0 0 0 0 0 0 0 0 0 0 0 0 0 0 0 0 0 0 0 0 0 0 0 0 0 0 0 0 0 0 0 0 0 0 0 0 0 0 0 0 0 0 0 0 0 0 0 0 0 0 0 0 0 0 0 0 0 0 0 0 0 0 0 0 0 0 0 0 0 0 0 0 0 0 0 0 0 0 0 0 0 0 0 0 0 0 0 0 0 0 0 0 0 0 0 0 0 0 0 0 0 0 0 0 0 0 0 0 0 0 0 0 0 0 0 0 0 0 0 0 0 0 0 0 0 0 0 0 0 0 0 0 0 0 0 0 0 0 0 0 0 0 0 0 0 0 0 0 0 0 0 0 0 0 0 0 0 0 0 0 0 0 0 0 0 0 0 0 0 0 0 0 0 0 0 0 0 0 0 0 0 0 0 0 0 0 0 0 0 0 0 0 0 0 0 0 0 0 0 0 0 0 0 0 0 0 0 0 0 0 0 0 0 0 0 0 0 0 0 0 0 0 0 0 0 0 0 0 0 0 0 0 0 0 0 0 0 0 0 0 0 0 0 0 0 0 0 0 0 0 0 0 0 0 0 0 0 0 0 0 0 0 0 0 0 0 0 0 0 0 0 0 0 0 0 0 0 0 0 0 0 0 0 0 0 0 0 0 0 0 0 0 0 0 0 0 0 0 0 0 0 0 0 0 0 0 0 0 0 0 0 0 0 0 0 0 0 0 0 0 0 0 0 0 0 0 0 0 0 0 0 0 0 0 0 0 0 0 0 0 0 0 0 0 0 0 0 0 0 0 0 0 0 0 0 0 0 0 0 0 0 0 0 0 0 0 0 0 0 0 0 0 0 0 0 0 0 0 0 0 0 0 0 0 0 0 0 0 0 0 0 0 0 0 0 0 0 0 0 0 0 0 0 0 0 0 0 0 0 0 0 0 0 0 0 0 0 0 0 0 0 0 0 0 0 0 0 0 0 0 0 0 0 0 0 0 0 0 0 0 0 0 0 0 0 0 0 0 0 0 0 0 0 0 0 0 0 0 0 0 0 0 0 0 0 0 0 0 0 0 0 0 0 0 0 0 0 0 0 0 0 0 0 0 0 0 0 0 0 0 0 0 0 0 0 0 0 0 0 0 0 0 0 0 0 0 0 0 0 0 0 0 0 0 0 0 0 0 0 0 0 0 0 0 0 0 0 0 0 0 0 0 0 0 0 0 0 0 0 0 0 0 0 0 0 0 0 0 0 0 0 0 0 0 0 0 0 0 0 0 0 0 0 0 0 0 0 0 0 0 0 0 0 0 0 0 0 0 0 0 0 0 0 0 0 0 0 0 0 0 0 0 0 0 0 0 0 0 0 0 0 0 0 0 0 0 0 SPN71 Bacteria;Firmicutes;Bacilli;Lactobacillales;Streptococcaceae;Streptococcus;sanguinis_nov_97.782% 0 0 0 0 1 0 0 0 3 857 46 2 1 0 0 0 1 0 0 0 0 0 0 0 1 1 0 30 2 0 6 13 4 46 1 0 0 2404 4 0 0 0 0 45 242 0 206 0 1 1 0 2 4 22 147 1 0 127 0 0 0 2 1 1204 0 0 1 0 9 0 0 29 0 0 3 0 0 0 0 0 0 0 492 0 0 0 0 17 929 91 0 3 0 0 0 0 337 0 0 0 799 10 0 0 0 0 0 0 142 0 0 0 0 0 97 2 0 0 0 0 1 2 0 4 7 1 26 9 0 3 5 27 0 2 2 0 0 0 0 3 0 0 0 61 0 0 1 1 462 3 2 1 0 0 0 0 0 1 82 11 0 6 2 0 0 0 0 0 0 0 8188 0 1 8 0 0 0 0 0 0 0 0 0 0 0 2 133 0 0 0 0 54 0 160 2 508 0 0 0 0 1 0 0 0 0 0 691 0 3 0 0 0 0 0 0 0 87 1 1 0 0 0 0 1 279 2 0 0 1 18 0 2 0 3 0 21 0 0 2 2 108 0 0 0 0 0 0 0 6 0 0 0 0 1 0 0 0 3 0 0 0 12 1 263 533 0 0 0 0 0 0 0 0 0 0 0 0 0 0 0 0 0 0 0 0 0 0 0 0 0 0 0 0 0 0 0 0 0 0 0 0 0 0 0 0 0 0 0 0 0 0 0 0 0 0 0 0 0 0 0 0 0 0 0 0 0 0 0 0 0 0 0 0 0 0 0 0 0 0 0 0 0 0 0 0 0 0 0 0 0 0 0 0 0 0 0 0 0 0 0 0 0 0 0 0 0 0 0 0 0 0 0 0 0 0 0 0 0 0 0 0 0 0 0 0 0 0 0 0 0 0 0 0 0 0 0 0 0 0 0 0 0 0 0 0 0 0 0 0 0 0 0 0 0 0 0 0 0 0 0 0 0 0 0 0 0 0 0 0 0 0 0 0 0 0 0 0 0 0 0 0 0 0 0 0 0 0 0 0 0 0 0 0 0 0 0 0 0 0 0 0 0 0 0 0 0 0 0 0 0 0 0 0 0 0 0 0 0 0 0 0 0 0 0 0 0 0 0 0 0 0 0 0 0 0 0 0 0 0 0 0 0 0 0 0 0 0 0 0 0 0 0 0 0 0 0 0 0 0 0 0 0 0 0 0 0 0 0 0 0 0 0 0 0 0 0 0 0 0 0 0 0 0 0 0 0 0 0 0 0 0 0 0 0 0 0 0 0 0 0 0 0 0 0 0 0 0 0 0 0 0 0 0 0 0 0 0 0 0 0 0 0 0 0 0 0 0 0 0 0 0 0 0 0 0 0 0 0 0 0 0 0 0 0 0 0 0 0 0 0 0 0 0 0 0 0 0 0 0 0 0 0 0 0 0 0 0 0 0 0 0 0 0 0 0 0 0 0 0 0 0 0 0 0 0 0 0 0 0 0 0 0 0 0 0 0 0 0 0 0 0 0 0 0 0 0 0 0 0 0 0 0 0 0 0 0 0 0 0 0 0 0 0 0 0 0 0 0 0 0 0 0 0 0 0 0 0 0 0 0 0 0 0 0 0 0 0 0 0 0 0 0 0 0 0 0 0 0 0 0 0 0 0 0 0 0 0 0 0 0 0 0 0 0 0 0 0 0 0 0 0 0 0 0 0 0 0 0 0 0 0 0 0 0 0 0 0 0 0 0 0 0 0 0 0 0 0 0 0 0 0 0 0 0 0 0 0 0 0 0 0 0 0 0 0 0 0 0 0 0 0 0 0 0 0 0 0 0 0 0 0 0 0 0 0 0 0 0 0 0 0 0 0 0 0 0 0 0 0 0 0 0 0 0 0 0 0 0 0 0 0 0 0 0 0 0 0 0 0 0 0 0 0 0 0 0 0 0 0 0 0 0 0 0 0 0 0 0 0 0 0 0 0 0 0 0 0 0 0 0 0 0 0 0 0 0 0 0 0 0 0 0 0 0 0 0 0 0 0 0 0 0 0 0 0 0 0 0 0 0 0 0 0 0 0 0 0 0 0 0 0 0 0 0 0 0 0 0 0 0 0 0 0 0 0 0 0 0 0 0 0 0 0 0 0 0 0 0 0 0 0 0 0 0 0 0 0 0 0 0 0 0 0 0 0 0 0 0 0 0 0 0 0 0 0 0 0 0 0 0 0 0 0 0 0 0 0 0 0 0 0 0 0 0 0 0 0 0 0 0 0 0 0 0 0 0 0 0 0 0 0 0 0 0 0 0 0 0 0 0 0 0 0 0 0 0 0 0 0 0 0 0 0 0 0 0 0 0 0 0 0 0 0 0 0 0 0 0 0 0 0 0 0 0 0 0 0 0 0 0 0 0 0 0 0 0 0 0 0 0 0 0 0 0 0 0 0 0 0 0 0 0 0 0 0 0 0 0 0 0 0 0 0 0 0 0 0 0 0 0 0 0 0 0 0 0 0 0 0 0 0 0 0 0 0 0 0 0 0 0 0 0 0 0 0 0 0 0 0 0 0 0 0 0 0 0 0 0 0 0 0 0 0 0 0 0 0 0 0 0 0 0 0 0 0 0 0 0 0 0 0 0 0 0 0 0 0 0 0 0 0 0 0 0 0 0 0 0 0 0 0 0 0 0 0 0 0 0 0 0 0 0 0 0 0 0 0 0 0 0 0 0 0 0 0 0 0 0 0 0 0 0 0 0 0 0 0 0 0 0 0 0 0 0 0 0 0 0 0 0 0 0 0 0 0 0 0 0 0 0 0 0 0 0 0 0 0 0 0 0 0 0 0 0 0 0 0 0 0 0 0 0 0 0 0 0 0 0 0 0 0 0 0 0 0 0 0 0 0 0 0 0 0 0 0 0 0 0 0 0 0 0 0 0 0 0 0 0 0 0 0 0 0 0 0 0 0 0 0 0 0 0 0 0 0 0 0 0 0 0 0 0 0 0 0 0 0 0 0 0 0 0 0 0 0 0 0 0 0 0 0 0 0 0 0 0 0 0 0 0 0 0 0 0 0 0 0 0 0 0 0 0 0 0 0 0 0 0 0 0 0 0 0 0 0 0 0 0 0 0 0 0 0 0 0 0 0 0 0 0 0 0 0 0 0 0 0 0 0 0 0 0 0 0 0 0 0 0 0 0 0 0 0 0 0 0 0 0 0 0 0 0 0 0 0 0 0 0 0 0 0 0 0 0 0 0 0 0 0 0 0 0 0 0 0 0 0 0 0 0 0 0 0 0 0 0 0 0 0 0 0 0 0 0 0 0 0 0 0 0 0 0 0 0 0 0 0 0 0 0 0 0 0 0 0 0 0 0 0 0 0 0 0 0 0 0 0 0 0 0 0 0 0 0 0 0 0 0 0 0 0 0 0 0 0 0 0 0 0 0 0 0 0 0 0 0 0 0 0 0 0 0 0 0 0 0 0 0 0 0 0 0 0 0 0 0 0 0 0 0 0 0 0 0 0 0 0 0 0 0 0 0 0 0 0 0 0 0 0 0 0 0 0 0 0 0 0 0 0 0 0 0 0 0 0 0 0 0 0 0 0 0 0 0 0 0 0 0 0 0 0 0 0 0 0 0 0 0 0 0 0 0 0 0 0 0 0 0 0 0 0 0 0 0 0 0 0 0 0 0 0 0 0 0 0 0 0 0 0 0 0 0 0 0 0 0 0 0 0 0 0 0 0 0 0 0 0 0 0 0 0 0 0 0 0 0 0 0 0 0 0 0 0 0 0 0 0 0 0 0 0 0 0 0 0 0 0 0 0 0 0 0 0 0 0 0 0 0 0 0 0 0 0 0 0 0 0 0 0 0 0 0 0 0 0 0 0 0 0 0 0 0 0 0 0 0 0 0 0 0 0 0 0 0 0 0 0 0 0 0 0 0 0 0 0 0 0 0 0 0 0 0 0 0 0 0 0 0 0 0 0 0 0 0 0 0 0 0 0 0 0 0 0 0 0 0 0 0 0 0 0 0 0 0 0 0 0 0 0 0 0 0 0 0 0 0 0 0 0 0 0 0 0 0 0 0 0 0 0 0 0 0 0 0 0 0 0 0 0 0 0 0 0 0 0 0 0 0 0 0 0 0 0 0 SPN76 Bacteria;Actinobacteria;Actinomycetia;Micrococcales;Promicromonosporaceae;Cellulosimicrobium;arenosum_nov_92.077% 199 319 27 139 114 229 10 125 40 27 130 10 328 151 39 183 89 27 89 44 475 107 180 25 130 70 5 70 14 40 108 133 54 41 131 193 77 35 101 3 109 51 122 69 52 25 51 65 3 146 59 81 56 28 109 100 242 149 29 32 181 76 126 14 192 21 12 58 145 93 131 141 68 418 99 109 78 88 31 42 78 175 52 4 211 159 199 83 69 73 9 24 2 8 189 207 2 44 28 110 52 31 108 109 38 97 96 4 66 17 91 39 15 130 27 27 43 215 22 18 188 7 47 88 57 688 77 159 65 29 162 78 156 127 30 46 107 91 147 84 9 1 20 68 7 80 95 19 112 81 149 120 50 84 325 98 77 188 70 142 152 16 135 29 193 140 16 141 58 214 0 229 102 120 419 554 188 261 92 86 16 120 144 74 38 306 70 279 281 68 233 441 78 44 226 20 94 137 40 217 27 124 67 26 38 24 6 4 19 3 32 33 84 64 70 161 7 53 7 192 5 39 94 35 13 186 29 207 13 15 84 6 338 12 477 97 84 137 34 17 40 78 22 31 19 444 215 37 14 386 38 21 255 41 196 89 328 151 78 116 209 187 145 44 92 465 122 379 0 0 0 0 0 0 0 0 0 0 0 0 0 0 0 0 0 0 0 0 0 0 0 0 0 0 0 0 0 0 0 0 0 0 0 0 0 0 0 0 0 0 0 0 0 0 0 0 0 0 0 0 0 0 0 0 0 0 0 0 0 0 0 0 0 0 0 0 0 0 0 0 0 0 0 0 0 0 0 0 0 0 0 0 0 0 0 0 0 0 0 0 0 0 0 0 0 0 0 0 0 0 0 0 0 0 0 0 0 0 0 0 0 0 0 0 0 0 0 0 0 0 0 0 0 0 0 0 0 0 0 0 0 0 0 0 0 0 0 0 0 0 0 0 0 0 0 0 0 0 0 0 0 0 0 0 0 0 0 0 0 0 0 0 0 0 0 0 0 0 0 0 0 0 0 0 0 0 0 0 0 0 0 0 0 0 0 0 0 0 0 0 0 0 0 0 0 0 0 0 0 0 0 0 0 0 0 0 0 0 0 0 0 0 0 0 0 0 0 0 0 0 0 0 0 0 0 0 0 0 0 0 0 0 0 0 0 0 0 0 0 0 0 0 0 0 0 0 0 0 0 0 0 0 0 0 0 0 0 0 0 0 0 0 0 0 0 0 0 0 0 0 0 0 0 0 0 0 0 0 0 0 0 0 0 0 0 0 0 0 0 0 0 0 0 0 0 0 0 0 0 0 0 0 0 0 0 0 0 0 0 0 0 0 0 0 0 0 0 0 0 0 0 0 0 0 0 0 0 0 0 0 0 0 0 0 0 0 0 0 0 0 0 0 0 0 0 0 0 0 0 0 0 0 0 0 0 0 0 0 0 0 0 0 0 0 0 0 0 0 0 0 0 0 0 0 0 0 0 0 0 0 0 0 0 0 0 0 0 0 0 0 0 0 0 0 0 0 0 0 0 0 0 0 0 0 0 0 0 0 0 0 0 0 0 0 0 0 0 0 0 0 0 0 0 0 0 0 0 0 0 0 0 0 0 0 0 0 0 0 0 0 0 0 0 0 0 0 0 0 0 0 0 0 0 0 0 0 0 0 0 0 0 0 0 0 0 0 0 0 0 0 0 0 0 0 0 0 0 0 0 0 0 0 0 0 0 0 0 0 0 0 0 0 0 0 0 0 0 0 0 0 0 0 0 0 0 0 0 0 0 0 0 0 0 0 0 0 0 0 0 0 0 0 0 0 0 0 0 0 0 0 0 0 0 0 0 0 0 0 0 0 0 0 0 0 0 0 0 0 0 0 0 0 0 0 0 0 0 0 0 0 0 0 0 0 0 0 0 0 0 0 0 0 0 0 0 0 0 0 0 0 0 0 0 0 0 0 0 0 0 0 0 0 0 0 0 0 0 0 0 0 0 0 0 0 0 0 0 0 0 0 0 0 0 0 0 0 0 0 0 0 0 0 0 0 0 0 0 0 0 0 0 0 0 0 0 0 0 0 0 0 0 0 0 0 0 0 0 0 0 0 0 0 0 0 0 0 0 0 0 0 0 0 0 0 0 0 0 0 0 0 0 0 0 0 0 0 0 0 0 0 0 0 0 0 0 0 0 0 0 0 0 0 0 0 0 0 0 0 0 0 0 0 0 0 0 0 0 0 0 0 0 0 0 0 0 0 0 0 0 0 0 0 0 0 0 0 0 0 0 0 0 0 0 0 0 0 0 0 0 0 0 0 0 0 0 0 0 0 0 0 0 0 0 0 0 0 0 0 0 0 0 0 0 0 0 0 0 0 0 0 0 0 0 0 0 0 0 0 0 0 0 0 0 0 0 0 0 0 0 0 0 0 0 0 0 0 0 0 0 0 0 0 0 0 0 0 0 0 0 0 0 0 0 0 0 0 0 0 0 0 0 0 0 0 0 0 0 0 0 0 0 0 0 0 0 0 0 0 0 0 0 0 0 0 0 0 0 0 0 0 0 0 0 0 0 0 0 0 0 0 0 0 0 0 0 0 0 0 0 0 0 0 0 0 0 0 0 0 0 0 0 0 0 0 0 0 0 0 0 0 0 0 0 0 0 0 0 0 0 0 0 0 0 0 0 0 0 0 0 0 0 0 0 0 0 0 0 0 0 0 0 0 0 0 0 0 0 0 0 0 0 0 0 0 0 0 0 0 0 0 0 0 0 0 0 0 0 0 0 0 0 0 0 0 0 0 0 0 0 0 0 0 0 0 0 0 0 0 0 0 0 0 0 0 0 0 0 0 0 0 0 0 0 0 0 0 0 0 0 0 0 0 0 0 0 0 0 0 0 0 0 0 0 0 0 0 0 0 0 0 0 0 0 0 0 0 0 0 0 0 0 0 0 0 0 0 0 0 0 0 0 0 0 0 0 0 0 0 0 0 0 0 0 0 0 0 0 0 0 0 0 0 0 0 0 0 0 0 0 0 0 0 0 0 0 0 0 0 0 0 0 0 0 0 0 0 0 0 0 0 0 0 0 0 0 0 0 0 0 0 0 0 0 0 0 0 0 0 0 0 0 0 0 0 0 0 0 0 0 0 0 0 0 0 0 0 0 0 0 0 0 0 0 0 0 0 0 0 0 0 0 0 0 0 0 0 0 0 0 0 0 0 0 0 0 0 0 0 0 0 0 0 0 0 0 0 0 0 0 0 0 0 0 0 0 0 0 0 0 0 0 0 0 0 0 0 0 0 0 0 0 0 0 0 0 0 0 0 0 0 0 0 0 0 0 0 0 0 0 0 0 0 0 0 0 0 0 0 0 0 0 0 0 0 0 0 0 0 0 0 0 0 0 0 0 0 0 0 0 0 0 0 0 0 0 0 0 0 0 0 0 0 0 0 0 0 0 0 0 0 0 0 0 0 0 0 0 0 0 0 0 0 0 0 0 0 0 0 0 0 0 0 0 0 0 0 0 0 0 0 0 0 0 0 0 0 0 0 0 0 0 0 0 0 0 0 0 0 0 0 0 0 0 0 0 0 0 0 0 0 0 0 0 0 0 0 0 0 0 0 0 0 0 0 0 0 0 0 0 0 0 0 0 0 0 0 0 0 0 0 0 0 0 0 0 0 0 0 0 0 0 0 0 0 0 0 0 0 0 0 0 0 0 0 0 0 0 0 0 0 0 0 0 0 0 0 0 0 0 0 0 0 0 0 0 0 0 0 0 0 0 0 0 0 0 0 0 0 0 0 0 0 0 0 0 0 0 0 0 0 0 0 0 0 0 0 0 0 0 0 0 0 0 0 0 0 0 0 0 0 0 0 0 0 0 0 0 0 0 0 0 0 0 0 0 0 0 0 0 0 0 0 0 0 0 0 0 0 0 0 0 0 0 0 0 0 0 0 0 0 0 0 0 0 0 0 0 0 0 0 0 0 0 0 0 0 0 0 0 0 0 0 0 0 0 0 0 0 0 0 0 0 0 0 0 0 0 0 0 0 0 0 0 0 0 0 0 0 0 0 0 0 0 0 0 0 0 0 0 0 0 0 0 0 0 0 0 0 0 0 0 0 0 0 0 0 0 0 0 0 0 0 0 0 SPN79 Bacteria;Firmicutes;Bacilli;Lactobacillales;Streptococcaceae;Streptococcus;mitis_nov_95.758% 1 86 72 4 8 27 265 2 17 87 4 458 19 14 26 3 50 95 3 4 2 0 59 44 9 0 45 3 156 276 46 3 58 3 9 7 7 174 6 278 26 161 9 34 68 2 124 11 394 18 2 0 2 16 17 21 5 40 75 56 23 546 2 245 10 67 134 2 253 11 46 66 32 3 8 29 26 0 109 30 12 27 46 174 1 54 9 13 52 0 404 0 275 158 14 60 859 22 123 36 29 93 91 8 49 312 51 399 19 9 19 49 9 37 98 111 26 4 29 53 4 8 3 9 7 21 2 10 2 378 1 9 10 15 48 512 1 1 86 0 448 176 139 79 137 53 26 68 0 23 2 2 2 17 17 2 5 55 10 32 155 167 0 140 30 13 15 8 73 25 460 12 66 64 0 10 32 33 31 104 0 30 111 4 11 39 27 6 24 4 15 29 53 3 15 68 0 13 49 12 340 33 11 2 7 0 408 91 272 205 2 9 4 3 5 52 745 10 267 3 285 7 60 72 0 4 18 69 120 0 7 88 10 55 0 0 5 33 38 57 21 3 0 27 131 0 0 3 3 1 0 21 1 2 0 6 18 2 6 2 5 1 15 4 33 0 1 1 0 0 0 0 0 0 0 0 0 0 0 0 0 0 0 0 0 0 0 0 0 0 0 0 0 0 0 0 0 0 0 0 0 0 0 0 0 0 0 0 0 0 0 0 0 0 0 0 0 0 0 0 0 0 0 0 0 0 0 0 0 0 0 0 0 0 0 0 0 0 0 0 0 0 0 0 0 0 0 0 0 0 0 0 0 0 0 0 0 0 0 0 0 0 0 0 0 0 0 0 0 0 0 0 0 0 0 0 0 0 0 0 0 0 0 0 0 0 0 0 0 0 0 0 0 0 0 0 0 0 0 0 0 0 0 0 0 0 0 0 0 0 0 0 0 0 0 0 0 0 0 0 0 0 0 0 0 0 0 0 0 0 0 0 0 0 0 0 0 0 0 0 0 0 0 0 0 0 0 0 0 0 0 0 0 0 0 0 0 0 0 0 0 0 0 0 0 0 0 0 0 0 0 0 0 0 0 0 0 0 0 0 0 0 0 0 0 0 0 0 0 0 0 0 0 0 0 0 0 0 0 0 0 0 0 0 0 0 0 0 0 0 0 0 0 0 0 0 0 0 0 0 0 0 0 0 0 0 0 0 0 0 0 0 0 0 0 0 0 0 0 0 0 0 0 0 0 0 0 0 0 0 0 0 0 0 0 0 0 0 0 0 0 0 0 0 0 0 0 0 0 0 0 0 0 0 0 0 0 0 0 0 0 0 0 0 0 0 0 0 0 0 0 0 0 0 0 0 0 0 0 0 0 0 0 0 0 0 0 0 0 0 0 0 0 0 0 0 0 0 0 0 0 0 0 0 0 0 0 0 0 0 0 0 0 0 0 0 0 0 0 0 0 0 0 0 0 0 0 0 0 0 0 0 0 0 0 0 0 0 0 0 0 0 0 0 0 0 0 0 0 0 0 0 0 0 0 0 0 0 0 0 0 0 0 0 0 0 0 0 0 0 0 0 0 0 0 0 0 0 0 0 0 0 0 0 0 0 0 0 0 0 0 0 0 0 0 0 0 0 0 0 0 0 0 0 0 0 0 0 0 0 0 0 0 0 0 0 0 0 0 0 0 0 0 0 0 0 0 0 0 0 0 0 0 0 0 0 0 0 0 0 0 0 0 0 0 0 0 0 0 0 0 0 0 0 0 0 0 0 0 0 0 0 0 0 0 0 0 0 0 0 0 0 0 0 0 0 0 0 0 0 0 0 0 0 0 0 0 0 0 0 0 0 0 0 0 0 0 0 0 0 0 0 0 0 0 0 0 0 0 0 0 0 0 0 0 0 0 0 0 0 0 0 0 0 0 0 0 0 0 0 0 0 0 0 0 0 0 0 0 0 0 0 0 0 0 0 0 0 0 0 0 0 0 0 0 0 0 0 0 0 0 0 0 0 0 0 0 0 0 0 0 0 0 0 0 0 0 0 0 0 0 0 0 0 0 0 0 0 0 0 0 0 0 0 0 0 0 0 0 0 0 0 0 0 0 0 0 0 0 0 0 0 0 0 0 0 0 0 0 0 0 0 0 0 0 0 0 0 0 0 0 0 0 0 0 0 0 0 0 0 0 0 0 0 0 0 0 0 0 0 0 0 0 0 0 0 0 0 0 0 0 0 0 0 0 0 0 0 0 0 0 0 0 0 0 0 0 0 0 0 0 0 0 0 0 0 0 0 0 0 0 0 0 0 0 0 0 0 0 0 0 0 0 0 0 0 0 0 0 0 0 0 0 0 0 0 0 0 0 0 0 0 0 0 0 0 0 0 0 0 0 0 0 0 0 0 0 0 0 0 0 0 0 0 0 0 0 0 0 0 0 0 0 0 0 0 0 0 0 0 0 0 0 0 0 0 0 0 0 0 0 0 0 0 0 0 0 0 0 0 0 0 0 0 0 0 0 0 0 0 0 0 0 0 0 0 0 0 0 0 0 0 0 0 0 0 0 0 0 0 0 0 0 0 0 0 0 0 0 0 0 0 0 0 0 0 0 0 0 0 0 0 0 0 0 0 0 0 0 0 0 0 0 0 0 0 0 0 0 0 0 0 0 0 0 0 0 0 0 0 0 0 0 0 0 0 0 0 0 0 0 0 0 0 0 0 0 0 0 0 0 0 0 0 0 0 0 0 0 0 0 0 0 0 0 0 0 0 0 0 0 0 0 0 0 0 0 0 0 0 0 0 0 0 0 0 0 0 0 0 0 0 0 0 0 0 0 0 0 0 0 0 0 0 0 0 0 0 0 0 0 0 0 0 0 0 0 0 0 0 0 0 0 0 0 0 0 0 0 0 0 0 0 0 0 0 0 0 0 0 0 0 0 0 0 0 0 0 0 0 0 0 0 0 0 0 0 0 0 0 0 0 0 0 0 0 0 0 0 0 0 0 0 0 0 0 0 0 0 0 0 0 0 0 0 0 0 0 0 0 0 0 0 0 0 0 0 0 0 0 0 0 0 0 0 0 0 0 0 0 0 0 0 0 0 0 0 0 0 0 0 0 0 0 0 0 0 0 0 0 0 0 0 0 0 0 0 0 0 0 0 0 0 0 0 0 0 0 0 0 0 0 0 0 0 0 0 0 0 0 0 0 0 0 0 0 0 0 0 0 0 0 0 0 0 0 0 0 0 0 0 0 0 0 0 0 0 0 0 0 0 0 0 0 0 0 0 0 0 0 0 0 0 0 0 0 0 0 0 0 0 0 0 0 0 0 0 0 0 0 0 0 0 0 0 0 0 0 0 0 0 0 0 0 0 0 0 0 0 0 0 0 0 0 0 0 0 0 0 0 0 0 0 0 0 0 0 0 0 0 0 0 0 0 0 0 0 0 0 0 0 0 0 0 0 0 0 0 0 0 0 0 0 0 0 0 0 0 0 0 0 0 0 0 0 0 0 0 0 0 0 0 0 0 0 0 0 0 0 0 0 0 0 0 0 0 0 0 0 0 0 0 0 0 0 0 0 0 0 0 0 0 0 0 0 0 0 0 0 0 0 0 0 0 0 0 0 0 0 0 0 0 0 0 0 0 0 0 0 0 0 0 0 0 0 0 0 0 0 0 0 0 0 0 0 0 0 0 0 0 0 0 0 0 0 0 0 0 0 0 0 0 0 0 0 0 0 0 0 0 0 0 0 0 0 0 0 0 0 0 0 0 0 0 0 0 0 0 0 0 0 0 0 0 0 0 0 0 0 0 0 0 0 0 0 0 0 0 0 0 0 0 0 0 0 0 0 0 0 0 0 0 0 0 0 0 0 0 0 0 0 0 0 0 0 0 0 0 0 0 0 0 0 0 0 0 0 0 0 0 0 0 0 0 0 0 0 0 0 0 0 0 0 0 0 0 0 0 0 0 0 0 0 0 0 0 0 0 0 0 0 0 0 0 0 0 0 0 0 0 0 0 0 0 0 0 0 0 0 0 0 0 0 0 0 0 0 0 0 0 0 0 0 0 0 0 0 0 0 0 0 0 0 0 0 0 0 0 0 0 0 0 0 0 0 0 0 0 0 0 0 0 0 0 SPN91 Bacteria;Firmicutes;Bacilli;Lactobacillales;Streptococcaceae;Streptococcus;ovis_nov_88.084% 42 127 33 417 124 70 37 39 20 235 87 11 26 7 5 137 137 40 14 23 103 42 89 26 236 135 24 225 13 0 10 37 3 153 112 115 162 4 85 8 2 1 2 92 105 1 34 169 30 66 158 45 23 37 59 48 215 140 2 45 153 12 84 0 53 3 15 19 6 6 101 21 23 211 297 5 129 76 2 34 30 24 82 21 27 70 52 132 22 12 1 112 1 7 196 5 0 11 2 286 221 9 30 91 11 7 33 0 13 33 45 70 80 20 20 9 29 36 6 13 153 41 105 14 17 119 39 16 12 6 16 0 152 46 10 3 14 237 13 26 19 1 39 74 0 34 41 0 77 28 89 111 28 163 45 310 43 72 167 148 16 2 25 11 28 75 19 73 6 67 0 108 102 46 427 371 81 69 4 51 375 106 27 37 75 190 91 28 0 58 29 53 94 57 159 62 53 133 51 67 1 10 84 11 45 76 1 3 14 0 51 31 78 98 53 19 4 179 1 39 2 22 62 23 69 35 10 30 3 24 113 3 103 10 73 12 25 98 11 10 2 1 0 15 0 70 35 9 28 153 48 1 19 34 343 235 16 51 126 15 88 56 23 59 62 141 66 82 0 0 0 0 0 0 0 0 0 0 0 0 0 0 0 0 0 0 0 0 0 0 0 0 0 0 0 0 0 0 0 0 0 0 0 0 0 0 0 0 0 0 0 0 0 0 0 0 0 0 0 0 0 0 0 0 0 0 0 0 0 0 0 0 0 0 0 0 0 0 0 0 0 0 0 0 0 0 0 0 0 0 0 0 0 0 0 0 0 0 0 0 0 0 0 0 0 0 0 0 0 0 0 0 0 0 0 0 0 0 0 0 0 0 0 0 0 0 0 0 0 0 0 0 0 0 0 0 0 0 0 0 0 0 0 0 0 0 0 0 0 0 0 0 0 0 0 0 0 0 0 0 0 0 0 0 0 0 0 0 0 0 0 0 0 0 0 0 0 0 0 0 0 0 0 0 0 0 0 0 0 0 0 0 0 0 0 0 0 0 0 0 0 0 0 0 0 0 0 0 0 0 0 0 0 0 0 0 0 0 0 0 0 0 0 0 0 0 0 0 0 0 0 0 0 0 0 0 0 0 0 0 0 0 0 0 0 0 0 0 0 0 0 0 0 0 0 0 0 0 0 0 0 0 0 0 0 0 0 0 0 0 0 0 0 0 0 0 0 0 0 0 0 0 0 0 0 0 0 0 0 0 0 0 0 0 0 0 0 0 0 0 0 0 0 0 0 0 0 0 0 0 0 0 0 0 0 0 0 0 0 0 0 0 0 0 0 0 0 0 0 0 0 0 0 0 0 0 0 0 0 0 0 0 0 0 0 0 0 0 0 0 0 0 0 0 0 0 0 0 0 0 0 0 0 0 0 0 0 0 0 0 0 0 0 0 0 0 0 0 0 0 0 0 0 0 0 0 0 0 0 0 0 0 0 0 0 0 0 0 0 0 0 0 0 0 0 0 0 0 0 0 0 0 0 0 0 0 0 0 0 0 0 0 0 0 0 0 0 0 0 0 0 0 0 0 0 0 0 0 0 0 0 0 0 0 0 0 0 0 0 0 0 0 0 0 0 0 0 0 0 0 0 0 0 0 0 0 0 0 0 0 0 0 0 0 0 0 0 0 0 0 0 0 0 0 0 0 0 0 0 0 0 0 0 0 0 0 0 0 0 0 0 0 0 0 0 0 0 0 0 0 0 0 0 0 0 0 0 0 0 0 0 0 0 0 0 0 0 0 0 0 0 0 0 0 0 0 0 0 0 0 0 0 0 0 0 0 0 0 0 0 0 0 0 0 0 0 0 0 0 0 0 0 0 0 0 0 0 0 0 0 0 0 0 0 0 0 0 0 0 0 0 0 0 0 0 0 0 0 0 0 0 0 0 0 0 0 0 0 0 0 0 0 0 0 0 0 0 0 0 0 0 0 0 0 0 0 0 0 0 0 0 0 0 0 0 0 0 0 0 0 0 0 0 0 0 0 0 0 0 0 0 0 0 0 0 0 0 0 0 0 0 0 0 0 0 0 0 0 0 0 0 0 0 0 0 0 0 0 0 0 0 0 0 0 0 0 0 0 0 0 0 0 0 0 0 0 0 0 0 0 0 0 0 0 0 0 0 0 0 0 0 0 0 0 0 0 0 0 0 0 0 0 0 0 0 0 0 0 0 0 0 0 0 0 0 0 0 0 0 0 0 0 0 0 0 0 0 0 0 0 0 0 0 0 0 0 0 0 0 0 0 0 0 0 0 0 0 0 0 0 0 0 0 0 0 0 0 0 0 0 0 0 0 0 0 0 0 0 0 0 0 0 0 0 0 0 0 0 0 0 0 0 0 0 0 0 0 0 0 0 0 0 0 0 0 0 0 0 0 0 0 0 0 0 0 0 0 0 0 0 0 0 0 0 0 0 0 0 0 0 0 0 0 0 0 0 0 0 0 0 0 0 0 0 0 0 0 0 0 0 0 0 0 0 0 0 0 0 0 0 0 0 0 0 0 0 0 0 0 0 0 0 0 0 0 0 0 0 0 0 0 0 0 0 0 0 0 0 0 0 0 0 0 0 0 0 0 0 0 0 0 0 0 0 0 0 0 0 0 0 0 0 0 0 0 0 0 0 0 0 0 0 0 0 0 0 0 0 0 0 0 0 0 0 0 0 0 0 0 0 0 0 0 0 0 0 0 0 0 0 0 0 0 0 0 0 0 0 0 0 0 0 0 0 0 0 0 0 0 0 0 0 0 0 0 0 0 0 0 0 0 0 0 0 0 0 0 0 0 0 0 0 0 0 0 0 0 0 0 0 0 0 0 0 0 0 0 0 0 0 0 0 0 0 0 0 0 0 0 0 0 0 0 0 0 0 0 0 0 0 0 0 0 0 0 0 0 0 0 0 0 0 0 0 0 0 0 0 0 0 0 0 0 0 0 0 0 0 0 0 0 0 0 0 0 0 0 0 0 0 0 0 0 0 0 0 0 0 0 0 0 0 0 0 0 0 0 0 0 0 0 0 0 0 0 0 0 0 0 0 0 0 0 0 0 0 0 0 0 0 0 0 0 0 0 0 0 0 0 0 0 0 0 0 0 0 0 0 0 0 0 0 0 0 0 0 0 0 0 0 0 0 0 0 0 0 0 0 0 0 0 0 0 0 0 0 0 0 0 0 0 0 0 0 0 0 0 0 0 0 0 0 0 0 0 0 0 0 0 0 0 0 0 0 0 0 0 0 0 0 0 0 0 0 0 0 0 0 0 0 0 0 0 0 0 0 0 0 0 0 0 0 0 0 0 0 0 0 0 0 0 0 0 0 0 0 0 0 0 0 0 0 0 0 0 0 0 0 0 0 0 0 0 0 0 0 0 0 0 0 0 0 0 0 0 0 0 0 0 0 0 0 0 0 0 0 0 0 0 0 0 0 0 0 0 0 0 0 0 0 0 0 0 0 0 0 0 0 0 0 0 0 0 0 0 0 0 0 0 0 0 0 0 0 0 0 0 0 0 0 0 0 0 0 0 0 0 0 0 0 0 0 0 0 0 0 0 0 0 0 0 0 0 0 0 0 0 0 0 0 0 0 0 0 0 0 0 0 0 0 0 0 0 0 0 0 0 0 0 0 0 0 0 0 0 0 0 0 0 0 0 0 0 0 0 0 0 0 0 0 0 0 0 0 0 0 0 0 0 0 0 0 0 0 0 0 0 0 0 0 0 0 0 0 0 0 0 0 0 0 0 0 0 0 0 0 0 0 0 0 0 0 0 0 0 0 0 0 0 0 0 0 0 0 0 0 0 0 0 0 0 0 0 0 0 0 0 0 0 0 0 0 0 0 0 0 0 0 0 0 0 0 0 0 0 0 0 0 0 0 0 0 0 0 0 0 0 0 0 0 0 0 0 0 0 0 0 0 0 0 0 0 0 0 0 0 0 0 0 0 0 0 0 0 0 0 0 0 0 0 0 0 0 0 0 0 0 0 0 0 0 0 0 0 0 0 0 0 0 0 0 0 0 0 0 0 0 0 0 0 0 0 0 0 0 0 0 0 0 0 0 0 0 0 0 0 0 0 0 0 0 0 0 0 SPP101 Bacteria;Fusobacteria;Fusobacteria;Fusobacteriales;Fusobacteriaceae;Fusobacterium;multispecies_spp101_3 0 0 0 0 0 0 0 0 0 0 0 0 0 0 0 0 0 0 0 0 0 0 0 0 0 0 0 0 0 0 0 0 0 0 0 0 0 0 0 0 0 0 0 0 0 0 0 0 0 0 0 0 0 0 0 0 0 0 0 0 0 0 0 0 0 0 0 0 0 0 0 0 0 0 0 0 0 0 0 0 0 0 0 0 0 0 0 0 0 0 0 0 0 0 0 0 0 0 0 0 0 0 0 0 0 0 0 0 0 0 0 0 0 0 0 0 0 0 0 0 0 0 0 0 0 0 0 0 0 0 0 0 0 0 0 0 0 0 0 0 0 0 0 0 0 0 0 0 0 0 0 0 0 0 0 0 0 0 0 0 0 0 0 0 0 0 0 0 0 0 0 0 0 0 0 0 0 0 0 0 0 0 0 0 0 0 0 0 0 0 0 0 0 0 0 0 0 0 0 0 0 0 0 0 0 0 0 0 0 0 0 0 0 0 0 0 0 0 0 0 0 0 0 0 0 0 0 0 0 0 0 0 0 0 0 0 0 0 0 0 0 0 0 0 0 0 0 0 0 0 0 0 0 0 0 0 0 0 0 0 0 0 0 0 0 0 0 0 0 6 1 0 1 0 6 0 3 1 11 6 21 9 2 14 9 4 3 3 9 19 19 1 7 0 20 15 12 13 0 9 4 7 25 17 9 0 12 0 11 0 4 3 0 1 10 1 5 3 0 1 0 16 6 0 4 0 0 0 0 0 0 0 5 0 0 0 0 0 0 0 1 1 0 4 5 0 0 4 5 0 3 2 0 7 14 1 0 7 3 0 0 5 1 3 0 2 0 1 11 0 5 0 5 24 0 0 1 0 0 12 1 0 1 3 0 2 13 4 0 0 1 0 0 8 9 0 8 0 1 10 1 0 3 9 6 0 0 4 0 1 1 16 6 20 10 0 10 0 15 0 1 0 4 6 0 9 5 0 0 3 1 4 4 9 0 7 2 0 0 1 1 2 0 0 0 9 0 0 6 9 7 2 8 0 1 2 0 4 0 5 8 23 0 0 2 2 0 8 0 4 8 13 2 0 3 0 7 7 4 7 8 2 1 8 12 16 17 13 0 6 2 5 1 25 26 16 5 21 0 16 10 32 0 2 11 0 2 19 1 0 6 6 4 1 0 2 1 3 0 5 0 1 0 0 16 1 5 1 0 3 2 14 4 0 20 0 12 28 2 2 0 1 10 1 3 1 6 4 2 3 12 2 0 1 1 1 0 3 0 8 0 4 13 6 1 3 0 4 0 5 0 0 0 3 1 3 13 3 0 0 0 5 0 0 0 12 6 1 5 0 3 0 7 6 0 3 4 14 0 0 0 1 0 17 5 0 1 0 3 6 6 5 17 2 0 1 3 5 5 2 0 4 0 2 5 4 43 0 3 6 4 2 11 2 8 22 4 0 2 1 2 12 8 15 2 0 0 8 6 0 1 7 0 9 0 1 10 0 1 4 2 0 2 12 7 2 3 0 4 0 6 7 36 4 0 3 13 0 2 0 0 0 2 0 0 4 2 0 0 2 20 0 1 8 1 9 0 2 0 2 4 6 4 7 7 0 3 5 0 3 1 1 6 3 0 8 1 3 0 1 6 1 9 0 6 3 11 20 13 7 21 13 3 1 26 0 5 2 20 18 1 6 15 0 2 0 2 4 32 2 13 8 8 0 10 3 4 8 0 16 2 22 13 3 4 0 41 24 3 24 12 5 20 17 0 5 5 0 20 21 4 1 0 1 0 1 9 2 8 0 0 6 2 1 0 9 13 0 0 1 2 11 0 1 0 1 8 1 30 0 9 0 0 1 0 5 6 0 1 4 0 0 0 0 0 0 0 2 4 0 0 2 1 0 0 2 5 17 5 0 8 2 6 4 2 3 0 3 4 0 0 5 1 0 14 0 42 21 7 0 1 0 5 3 2 2 1 4 10 5 0 4 5 25 2 0 3 0 9 0 1 4 9 4 7 3 2 3 9 8 11 0 0 12 5 0 1 0 8 0 12 0 8 0 2 0 3 11 12 22 11 9 0 6 3 3 0 0 8 1 0 3 3 8 3 0 0 6 0 18 16 0 5 10 1 6 3 12 8 5 12 0 38 10 0 2 26 4 5 8 13 11 23 31 0 21 20 1 2 1 0 12 0 13 0 4 0 16 11 1 6 19 0 16 10 2 35 27 0 10 5 1 6 6 0 12 0 9 3 19 14 7 3 12 5 9 1 3 0 1 0 4 2 3 9 13 0 0 0 0 0 1 0 0 14 11 0 0 0 0 0 4 0 8 9 0 22 11 12 0 3 21 2 21 2 1 9 3 27 0 13 5 0 1 16 0 5 9 2 1 6 2 0 5 0 0 16 8 0 0 35 12 5 0 14 15 0 2 8 0 12 9 1 2 3 21 41 0 13 0 0 51 5 0 20 12 6 0 8 9 0 6 4 1 0 0 0 15 0 0 0 0 20 12 0 2 1 0 3 1 2 2 1 3 0 15 2 0 2 14 4 0 18 1 28 0 17 1 0 21 3 0 1 5 1 0 5 7 0 8 1 0 0 5 13 0 0 43 1 0 17 1 0 0 0 0 1 23 14 0 1 2 13 0 2 0 3 0 2 14 0 7 20 3 10 9 1 2 1 0 0 10 1 16 16 4 3 13 1 12 15 0 19 18 4 0 23 14 2 32 8 2 14 19 3 2 0 23 5 0 16 5 0 8 4 4 0 4 12 0 0 8 8 0 7 5 0 3 0 16 0 4 12 2 30 13 0 2 9 0 1 8 14 1 4 0 0 36 18 0 0 6 2 28 22 0 10 9 0 33 23 2 1 21 15 0 19 24 1 6 1 0 2 12 11 1 10 8 1 33 0 0 3 7 1 0 15 1 0 1 62 16 0 13 0 0 15 4 0 16 9 4 0 22 2 0 8 3 1 28 12 0 0 6 4 0 0 16 1 0 12 1 0 5 0 17 2 5 0 40 0 1 26 8 14 41 16 0 32 16 22 0 49 18 4 26 6 0 0 1 0 0 4 17 9 0 16 0 0 23 8 0 5 0 36 8 0 13 14 0 22 30 1 1 39 23 10 14 13 3 1 4 0 1 9 4 0 0 19 34 0 9 22 0 0 13 1 10 14 0 4 0 0 3 1 0 1 0 0 1 0 2 5 0 11 12 0 4 2 1 6 3 0 0 1 0 0 3 29 0 42 32 0 1 4 21 0 5 2 0 16 3 1 13 2 0 0 0 19 0 2 25 0 8 27 0 3 4 46 1 0 27 10 27 0 11 3 1 0 4 0 31 2 8 0 9 1 0 0 3 1 2 7 3 0 13 9 0 0 47 0 0 29 0 0 2 7 1 25 8 0 12 43 0 29 16 20 0 0 25 12 3 0 0 0 19 8 0 3 27 1 0 14 6 0 10 16 0 0 14 0 0 60 4 0 29 48 4 3 0 6 9 11 0 10 0 0 0 2 0 0 25 5 8 0 10 19 1 12 2 4 21 0 0 27 36 2 1 8 0 2 6 0 24 9 0 2 25 6 0 3 1 1 6 18 0 22 21 9 0 21 50 0 2 22 0 14 12 0 0 17 7 0 0 0 1 0 20 25 13 18 1 0 20 10 1 0 1 8 0 15 3 0 19 26 0 0 2 8 0 1 11 0 15 32 3 0 21 34 0 0 7 6 0 33 11 0 13 5 0 8 20 2 0 8 4 1 31 0 0 12 2 5 1 12 6 9 44 9 0 3 11 1 3 0 0 0 20 5 1 19 5 0 29 2 0 7 9 0 14 1 9 40 2 2 13 2 4 15 0 6 2 0 8 9 0 4 2 0 0 0 0 0 1 1 0 2 2 1 11 18 1 0 3 2 1 1 9 1 0 0 37 17 11 3 4 28 0 8 4 0 12 1 4 5 0 0 1 0 10 0 0 0 0 13 10 4 9 8 16 6 0 0 21 25 1 1 1 0 8 7 0 31 4 32 1 29 23 0 11 12 1 6 9 4 0 22 34 0 6 3 0 0 5 3 0 24 57 0 0 0 4 0 3 1 1 6 19 0 1 7 3 0 5 1 0 11 0 0 14 13 1 2 0 SPP102 Bacteria;Fusobacteria;Fusobacteria;Fusobacteriales;Fusobacteriaceae;Fusobacterium;multispecies_spp102_4 0 0 0 0 0 0 0 0 0 0 0 0 0 0 0 0 0 0 0 0 0 0 0 0 0 0 0 0 0 0 0 0 0 0 0 0 0 0 0 0 0 0 0 0 0 0 0 0 0 0 0 0 0 0 0 0 0 0 0 0 0 0 0 0 0 0 0 0 0 0 0 0 0 0 0 0 0 0 0 0 0 0 0 0 0 0 0 0 0 0 0 0 0 0 0 0 0 0 0 0 0 0 0 0 0 0 0 0 0 0 0 0 0 0 0 0 0 0 0 0 0 0 0 0 0 0 0 0 0 0 0 0 0 0 0 0 0 0 0 0 0 0 0 0 0 0 0 0 0 0 0 0 0 0 0 0 0 0 0 0 0 0 0 0 0 0 0 0 0 0 0 0 0 0 0 0 0 0 0 0 0 0 0 0 0 0 0 0 0 0 0 0 0 0 0 0 0 0 0 0 0 0 0 0 0 0 0 0 0 0 0 0 0 0 0 0 0 0 0 0 0 0 0 0 0 0 0 0 0 0 0 0 0 0 0 0 0 0 0 0 0 0 0 0 0 0 0 0 0 0 0 0 0 0 0 0 0 0 0 0 0 0 0 0 0 0 0 0 0 292 31 0 24 11 243 0 123 85 552 119 571 277 142 253 215 173 84 93 40 752 527 3 59 0 555 292 243 577 0 515 130 210 943 366 223 3 247 7 234 1 89 213 24 1 242 55 109 231 33 4 1 235 175 0 225 22 2 0 1 0 6 178 2 9 2 0 4 2 0 7 0 219 0 127 635 63 1 27 63 0 73 65 1 148 635 219 2 541 14 0 0 109 25 81 5 78 1 46 231 0 39 1 263 384 41 50 3 0 3 340 8 0 289 155 1 38 157 35 0 11 35 61 0 1013 43 124 257 0 35 452 291 0 402 151 148 5 0 114 17 6 42 708 24 966 74 63 392 0 504 0 32 10 200 60 0 345 73 2 74 8 1 157 190 548 1 193 105 0 32 1 54 116 1 8 3 265 0 0 176 243 90 33 365 45 0 39 2 73 0 246 141 754 3 42 0 58 1 426 4 45 65 157 3 1 118 2 193 57 306 169 184 16 24 349 305 297 389 470 1 143 134 66 6 1552 734 3 130 415 0 220 456 6 0 0 163 0 35 556 10 3 182 257 1 3 7 1 8 111 7 74 0 26 0 3 271 22 121 75 1 86 0 474 517 4 795 0 132 720 31 76 0 248 583 86 132 20 207 294 134 77 354 49 0 24 149 109 27 40 0 300 7 206 806 211 225 221 0 12 0 83 28 0 5 55 42 57 371 29 30 1 0 46 37 0 7 755 252 5 41 6 28 0 253 547 0 218 13 300 0 0 0 152 2 700 89 4 17 9 45 198 22 139 309 148 3 56 196 59 6 69 19 52 16 17 122 449 341 1 103 291 457 155 304 1071 269 526 217 0 59 15 4 347 282 417 111 0 1 280 147 5 34 89 7 138 41 32 225 6 122 94 192 4 105 200 98 81 58 0 122 36 1 292 484 136 73 14 252 0 50 7 0 119 240 0 0 204 158 123 174 106 46 0 5 189 61 247 0 32 0 30 144 30 95 50 16 6 79 1 0 268 35 8 230 121 0 102 44 304 133 48 1 31 133 87 110 82 243 391 141 27 272 92 55 43 103 47 50 94 339 67 3 117 556 15 91 0 8 117 183 136 262 232 341 0 359 563 91 269 0 496 221 467 267 96 156 0 648 517 22 556 148 6 426 271 0 21 222 0 339 518 110 138 0 134 17 21 294 27 14 0 13 187 40 69 22 244 269 1 23 11 81 245 13 83 2 30 230 88 639 0 163 0 1 2 75 93 0 9 53 179 35 13 4 12 0 0 5 51 88 0 9 236 4 0 19 17 82 806 199 31 761 43 327 48 38 126 0 40 220 2 3 110 38 15 317 14 318 116 6 0 48 17 65 148 14 80 42 121 188 138 37 256 56 763 445 2 745 4 344 0 21 131 248 152 501 32 100 39 498 309 322 2 0 298 519 1 23 0 218 11 258 10 112 47 82 0 87 273 575 241 202 406 0 523 210 104 0 66 315 79 4 108 38 619 76 17 0 412 58 636 363 1 121 733 20 224 47 362 314 158 366 2 559 233 0 90 460 10 368 481 121 136 826 640 1 276 165 17 114 3 10 221 0 624 3 67 1 149 244 90 208 445 0 133 649 83 1745 278 3 431 8 4 171 201 0 130 0 155 131 268 193 5 198 248 70 245 334 8 0 14 50 282 2 218 17 362 0 0 20 0 1 213 0 0 487 88 0 0 1 0 11 39 17 48 132 1 202 103 307 0 179 177 4 442 116 5 167 54 436 0 135 26 0 0 725 1 63 124 17 4 109 106 0 72 9 0 282 143 0 16 790 231 75 0 200 244 2 6 8 0 154 106 1 108 86 266 1159 0 228 0 5 806 49 0 50 89 58 0 91 71 7 67 92 25 0 1 2 252 0 33 35 0 681 9 1 29 33 0 19 36 97 16 81 144 0 128 42 0 9 328 164 3 369 18 468 0 245 125 0 183 46 0 94 135 60 0 143 75 1 75 5 0 0 76 328 0 0 842 18 1 478 38 1 49 160 1 20 199 147 4 6 21 44 13 92 10 57 12 5 431 0 51 528 34 166 86 1 32 10 0 1 691 47 86 393 127 6 291 3 235 80 1 236 836 63 4 97 523 0 233 105 3 163 89 10 25 4 264 85 3 188 61 0 64 12 5 1 91 180 3 0 183 119 0 65 223 1 80 50 778 1 170 235 7 805 202 0 46 132 20 2 109 361 1 21 0 6 250 372 0 0 93 15 114 263 0 41 135 0 371 302 0 4 253 420 2 163 275 1 81 65 0 36 133 88 0 296 534 0 144 17 1 31 94 121 0 288 30 0 1 289 187 0 143 11 0 159 77 0 457 117 47 1 240 6 8 613 53 1 615 864 16 0 111 119 5 3 199 35 0 128 84 0 106 0 158 61 61 1 599 17 1 930 90 645 384 210 1 812 325 288 5 1242 280 8 434 66 0 2 23 8 2 46 174 90 1 263 10 0 240 21 2 102 1 618 140 13 100 205 3 634 477 3 1 2650 248 78 277 448 19 20 48 0 45 910 51 2 0 148 355 0 182 241 0 1 120 89 122 16 13 105 3 0 300 29 2 11 2 0 1 0 26 362 4 978 144 6 128 74 0 210 90 37 85 129 0 1 41 210 1 2513 643 2 3 43 280 0 84 48 0 173 47 6 239 34 0 0 12 125 3 44 278 0 74 349 1 101 111 1059 36 5 356 898 105 2 71 61 0 23 160 0 387 37 151 0 73 45 5 3 44 0 55 45 12 0 402 82 18 11 1012 2 1 620 30 0 42 91 27 111 53 1 169 941 11 910 808 226 5 8 387 85 12 9 5 0 58 40 2 7 199 33 1 291 20 1 415 231 0 2 285 6 1 796 48 1 605 814 51 18 19 143 213 286 0 124 5 0 0 111 34 0 977 32 247 0 171 480 2 303 53 18 568 0 0 487 451 27 22 219 0 40 169 4 159 94 3 34 741 621 0 27 13 10 41 311 0 550 123 218 0 228 889 1 20 201 0 644 53 4 1 281 81 0 0 7 10 0 391 149 248 136 2 0 111 94 32 0 6 196 0 70 99 0 135 377 2 1 71 120 2 5 147 1 210 760 9 0 297 429 3 8 41 248 4 352 106 0 212 67 1 98 202 11 0 288 32 1 387 9 0 232 11 62 4 341 468 2 1003 329 2 29 416 1 2 0 2 0 364 38 17 330 45 2 185 13 0 79 218 21 91 12 155 320 3 109 168 3 38 151 2 125 65 4 216 125 30 85 13 0 0 93 14 5 21 54 7 201 3 37 909 296 56 0 34 86 0 107 162 94 3 0 436 240 244 7 164 852 3 387 18 13 61 54 43 124 0 1 6 3 175 0 15 16 1 490 353 33 431 74 227 152 0 0 686 569 7 56 6 0 233 180 1 259 25 336 0 230 257 0 151 260 2 100 116 99 1 403 274 3 128 76 0 4 127 69 6 164 555 0 0 0 56 0 63 30 6 164 174 1 8 35 6 0 19 54 0 124 2 0 156 64 18 18 2 SPP103 Bacteria;Fusobacteria;Fusobacteria;Fusobacteriales;Fusobacteriaceae;Fusobacterium;multispecies_spp103_3 0 0 0 0 0 0 0 0 0 0 0 0 0 0 0 0 0 0 0 0 0 0 0 0 0 0 0 0 0 0 0 0 0 0 0 0 0 0 0 0 0 0 0 0 0 0 0 0 0 0 0 0 0 0 0 0 0 0 0 0 0 0 0 0 0 0 0 0 0 0 0 0 0 0 0 0 0 0 0 0 0 0 0 0 0 0 0 0 0 0 0 0 0 0 0 0 0 0 0 0 0 0 0 0 0 0 0 0 0 0 0 0 0 0 0 0 0 0 0 0 0 0 0 0 0 0 0 0 0 0 0 0 0 0 0 0 0 0 0 0 0 0 0 0 0 0 0 0 0 0 0 0 0 0 0 0 0 0 0 0 0 0 0 0 0 0 0 0 0 0 0 0 0 0 0 0 0 0 0 0 0 0 0 0 0 0 0 0 0 0 0 0 0 0 0 0 0 0 0 0 0 0 0 0 0 0 0 0 0 0 0 0 0 0 0 0 0 0 0 0 0 0 0 0 0 0 0 0 0 0 0 0 0 0 0 0 0 0 0 0 0 0 0 0 0 0 0 0 0 0 0 0 0 0 0 0 0 0 0 0 0 0 0 0 0 0 0 0 0 2 12 0 0 25 7 0 38 2 41 0 50 16 0 74 3 5 0 0 1 12 0 0 9 0 101 2 8 0 0 33 1 1 203 5 1 0 171 0 43 0 3 14 0 0 1 5 0 319 0 0 0 33 1 0 0 0 0 0 0 0 1 2 0 0 0 0 1 4 0 0 0 0 0 2 21 0 0 26 107 0 0 0 0 2 0 0 0 16 0 0 0 0 0 0 0 0 0 0 0 0 16 1 0 5 0 1 7 0 0 34 0 0 50 42 0 0 85 154 3 0 0 0 0 1 8 2 58 0 0 5 0 0 0 2 27 0 0 15 2 0 6 128 0 0 2 0 36 0 41 0 3 0 5 7 0 20 0 0 0 0 0 0 133 1 0 0 9 0 0 0 0 1 0 0 0 4 0 0 11 39 0 3 24 0 6 2 0 13 0 19 0 0 0 61 0 4 0 6 0 38 2 56 0 0 0 0 4 0 0 118 42 1 1 1 26 5 24 0 0 28 35 0 0 14 31 0 0 103 0 20 39 0 0 0 36 0 2 2 5 0 9 0 0 1 0 0 1 30 0 0 0 3 0 0 0 0 0 8 0 12 0 8 2 0 1 0 50 133 0 3824 0 0 3 0 2 0 12 326 0 31 11 5 0 2 5 0 2 19 0 19 0 7 6 3 2 0 0 0 0 7 29 0 0 1 0 0 33 0 14 0 0 35 23 0 0 46 45 1 0 5 14 0 0 0 0 16 0 5 0 0 0 0 1 6 20 0 0 1 2 22 1 3 1 0 0 0 0 0 17 31 0 0 0 0 2 0 0 0 3 7 4 0 10 34 0 6 3 0 34 1 0 11 0 7 0 0 0 0 12 2 19 36 0 5 7 10 30 1 0 0 11 0 57 143 32 7 34 0 1 3 0 1 0 10 0 9 17 0 0 0 0 1 19 0 0 10 0 0 1 0 17 0 6 29 0 14 0 0 0 9 318 0 100 9 0 0 3 0 1 8 0 0 29 0 0 0 0 0 6 1 0 0 2 0 0 4 2 4 43 1 183 13 0 18 0 170 19 25 203 28 0 253 56 0 0 0 0 10 1 8 5 1 35 0 5 30 7 34 0 5 22 5 0 0 0 0 0 37 0 155 2 0 47 7 0 5 1 0 406 628 0 0 0 5 0 0 10 0 0 0 0 0 0 9 0 7 49 0 0 0 4 0 6 0 0 0 0 0 1 0 0 0 0 0 0 3 0 0 50 4 24 2 0 0 1 0 0 3 1 0 8 10 0 0 7 1 0 1 0 0 0 1 72 0 0 0 0 0 1 0 0 35 1 0 7 1 1 2 0 0 0 0 4 0 1 10 0 42 33 0 1 0 0 2 55 0 26 0 6 0 2 48 0 2 0 0 0 3 554 0 13 0 0 0 1 1 1 0 15 0 3 0 0 0 0 0 0 3 14 0 1 3 0 0 135 1 0 0 576 0 8 0 0 1 0 37 0 2 0 0 1 0 12 40 0 5 7 10 118 17 13 0 30 23 0 68 23 0 2 2 18 0 59 38 0 35 68 0 0 0 3 0 0 43 0 3 0 97 201 0 1 1 0 26 10 0 180 23 0 15 3 0 54 38 0 3 0 10 0 14 10 0 16 29 0 10 38 0 0 0 0 4 0 0 0 28 0 0 3 1 0 0 0 0 10 1 0 0 0 0 8 1 0 1 3 2 95 13 10 0 0 13 0 51 9 0 4 0 140 0 14 9 0 0 1 0 32 0 2 0 89 14 0 4 5 0 126 1 0 0 24 12 0 0 46 0 0 0 0 0 202 21 0 0 11 2 8 0 8 0 1 2 0 0 2 30 7 0 28 7 0 3 0 1 0 2 5 0 0 1 0 0 0 3 0 12 25 0 0 0 0 0 0 46 0 2 6 0 0 2 0 0 0 4 5 0 1 0 0 186 13 1 1 0 0 0 3 11 0 3 4 0 0 1 0 0 0 104 20 0 21 1 0 2 4 0 95 2 0 0 0 8 0 0 67 0 0 3 1 1 0 52 151 0 1 0 0 0 19 0 0 49 0 0 16 3 0 0 0 18 30 0 43 2 12 0 1 1 0 109 17 3 8 13 1 0 0 48 15 0 24 7 0 31 4 0 0 137 74 0 0 2 13 0 3 4 0 0 3 45 0 35 29 0 21 10 0 1 6 0 0 7 0 0 1 0 0 78 2 0 0 0 0 12 0 0 50 93 0 56 12 0 0 60 66 0 50 78 0 0 0 0 0 6 33 0 3 35 0 5 6 0 0 0 0 0 215 0 0 0 122 85 0 73 2 0 17 1 0 0 0 1 0 14 1 0 4 0 0 0 0 1 0 6 39 0 2 0 2 0 0 0 0 0 0 0 0 0 0 0 0 0 196 18 39 1847 0 1 429 67 14 0 10 2 0 1 2 0 0 3 2 0 20 1 3 0 45 18 0 43 2 0 2 0 161 167 0 0 13 0 2 2 1 0 920 15 1 19 51 0 0 1 0 0 380 0 0 0 29 6 0 23 69 0 0 26 0 10 1 0 52 0 0 370 0 0 0 7 0 0 0 0 21 0 102 14 0 11 13 0 0 13 3 69 29 0 0 2 1 1 206 7 0 1 27 6 0 30 1 0 41 45 0 1 61 0 0 4 109 0 213 248 0 60 54 0 16 0 142 0 0 8 2 54 0 12 30 0 5 2 0 148 14 6 0 10 0 0 1 31 0 10 2 0 0 207 0 0 7 21 0 0 2 1 0 3 1 1 13 28 0 66 0 0 0 45 6 0 0 69 12 0 2 0 0 15 93 0 0 116 18 0 58 3 0 15 8 1 0 63 0 0 4 1 0 11 0 0 5 0 61 2 28 0 0 2 0 0 4 10 0 55 0 8 0 41 34 0 2 0 15 28 0 0 307 41 1 0 16 0 2 0 0 129 5 0 3 70 49 0 8 3 0 75 2 0 7 18 1 0 40 155 0 26 38 0 9 10 0 0 92 9 0 0 0 0 0 7 0 0 62 0 0 39 28 0 0 4 3 0 29 21 0 9 47 0 0 60 10 0 0 0 0 101 5 0 0 0 0 0 0 0 5 0 14 53 0 0 13 1 1 0 0 0 1 0 0 6 0 0 17 0 0 1 28 15 0 103 136 1 5 8 0 75 0 0 0 18 2 0 75 9 0 85 0 1 6 26 6 9 0 4 6 0 0 0 0 42 0 0 126 1 1 126 1 0 7 0 0 0 130 8 1 4 0 0 215 0 0 1 37 0 0 0 18 0 5 1 22 0 0 23 75 0 1 1 7 1 569 4 0 17 1 59 0 0 0 0 0 5 0 121 2 0 543 2 0 55 4 1 31 0 0 48 39 0 11 9 0 14 21 0 36 2 172 0 34 2 0 39 13 0 14 6 0 0 40 1 0 293 39 0 1 0 1 0 16 60 0 0 0 2 0 23 0 0 2 0 0 0 0 0 0 5 21 0 16 0 0 6 1 0 0 0 SPP105 Bacteria;Proteobacteria;Epsilonproteobacteria;Campylobacterales;Campylobacteraceae;Campylobacter;multispecies_spp105_2 0 0 0 0 0 0 0 0 0 0 0 0 0 0 0 0 0 0 0 0 0 0 0 0 0 0 0 0 0 0 0 0 0 0 0 0 0 0 0 0 0 0 0 0 0 0 0 0 0 0 0 0 0 0 0 0 0 0 0 0 0 0 0 0 0 0 0 0 0 0 0 0 0 0 0 0 0 0 0 0 0 0 0 0 0 0 0 0 0 0 0 0 0 0 0 0 0 0 0 0 0 0 0 0 0 0 0 0 0 0 0 0 0 0 0 0 0 0 0 0 0 0 0 0 0 0 0 0 0 0 0 0 0 0 0 0 0 0 0 0 0 0 0 0 0 0 0 0 0 0 0 0 0 0 0 0 0 0 0 0 0 0 0 0 0 0 0 0 0 0 0 0 0 0 0 0 0 0 0 0 0 0 0 0 0 0 0 0 0 0 0 0 0 0 0 0 0 0 0 0 0 0 0 0 0 0 0 0 0 0 0 0 0 0 0 0 0 0 0 0 0 0 0 0 0 0 0 0 0 0 0 0 0 0 0 0 0 0 0 0 0 0 0 0 0 0 0 0 0 0 0 0 0 0 0 0 0 0 0 0 0 0 0 0 0 0 0 0 0 124 0 0 8 0 19 0 26 4 23 3 15 15 0 3 10 0 1 3 13 1 20 1 3 0 35 23 5 21 0 0 2 70 23 7 18 0 1 0 17 0 24 4 0 0 1 2 7 20 2 0 1 19 9 0 2 0 0 0 0 0 0 1 0 2 0 0 0 1 0 0 0 0 0 7 1 0 11 0 1 0 2 4 2 2 5 1 0 7 14 0 4 3 0 4 0 364 0 1 40 0 3 0 65 35 1 1 3 0 0 18 0 0 46 20 0 5 27 5 0 0 0 0 0 172 17 1 11 11 17 89 6 0 6 2 362 3 1 4 0 4 0 44 1 103 0 18 6 0 26 0 3 3 8 7 1 2 1 0 1 0 0 55 10 22 0 15 6 1 3 0 5 0 0 1 14 1 0 0 81 4 10 1 19 4 0 1 0 1 1 31 1 0 0 5 19 7 0 23 3 1 11 16 2 0 0 4 9 2 13 20 6 1 1 45 60 11 55 102 25 17 4 1 0 255 173 38 0 26 0 15 39 8 0 0 61 0 0 2 0 0 2 0 0 1 0 0 3 8 1 4 0 2 0 0 15 1 112 20 0 2 0 70 61 6 16 0 10 52 0 3 0 2 26 24 1 1 64 5 137 5 16 0 20 3 2 76 0 4 0 25 14 3 18 38 2 3 0 0 0 8 0 0 0 10 57 4 161 11 3 0 0 3 6 0 1 38 52 0 7 0 4 0 3 14 0 23 1 4 0 6 0 3 0 20 11 0 0 0 1 20 36 7 10 0 0 32 18 258 3 105 5 0 1 21 0 7 121 1 3 37 63 5 20 180 18 41 14 0 2 7 9 19 7 123 63 0 0 27 2 0 9 1 14 12 11 1 19 0 22 24 6 341 39 6 102 2 1 0 13 3 0 11 276 15 0 10 16 0 2 0 0 4 41 0 0 11 16 20 13 25 48 0 0 2 353 73 1 0 0 2 10 55 4 0 11 0 2 93 0 5 0 0 6 8 0 4 1 0 17 0 5 9 21 3 0 0 22 46 11 2 4 0 6 9 51 2 0 23 11 1 3 49 83 32 13 1 7 76 48 1 24 4 108 0 9 263 4 10 0 24 53 46 30 2 2 0 28 9 3 6 8 270 11 34 0 1 16 0 41 31 0 9 5 1 0 7 5 1 1 1 3 12 0 16 0 6 19 0 0 0 0 0 3 379 0 5 89 33 6 1 41 28 0 2 1 30 0 0 2 3 0 0 1 0 0 0 0 2 13 0 0 8 1 0 0 0 22 16 1 0 35 0 5 0 0 1 2 0 11 1 0 11 2 16 39 0 7 0 0 28 5 4 3 1 0 2 101 60 50 26 6 31 2 36 5 0 285 2 29 0 27 15 41 0 10 1 1 0 3 11 3 0 0 2 0 0 0 0 71 0 0 0 1 0 4 0 13 45 189 97 105 20 0 148 25 8 0 1 19 51 0 0 6 156 4 0 1 105 51 84 33 4 7 13 0 2 3 42 5 6 15 2 9 8 0 16 6 3 11 50 11 6 18 35 0 6 29 0 0 0 2 8 23 117 0 4 12 3 21 0 43 68 0 1 6 0 7 6 0 29 3 0 0 29 0 4 0 26 6 139 56 26 0 32 3 56 21 1 1 2 1 32 2 49 5 15 0 0 0 0 0 4 0 3 7 10 0 0 0 0 0 7 1 0 2 0 46 4 15 1 7 10 5 26 0 0 7 7 2 0 18 6 0 0 0 0 6 9 1 2 10 3 0 0 0 1 47 8 0 1 134 10 43 0 22 20 0 0 2 0 0 2 0 4 27 58 14 0 53 0 0 210 0 0 7 28 3 0 0 0 0 7 12 0 0 0 1 6 0 0 0 0 27 0 0 0 0 0 0 2 6 1 0 1 0 13 0 0 2 2 12 2 74 11 27 0 38 11 0 9 1 0 4 54 1 0 2 8 0 1 2 0 0 28 59 0 0 31 7 1 44 0 1 4 3 0 0 0 13 0 2 4 6 3 10 0 15 43 2 45 1 2 26 12 4 0 0 2 0 0 0 32 11 21 22 29 5 4 3 4 0 0 49 40 9 0 18 81 0 45 6 0 3 0 0 1 0 54 9 0 5 13 0 8 2 0 0 31 12 0 0 7 10 0 0 1 0 2 0 24 2 5 16 0 35 13 0 0 0 3 0 0 24 2 1 0 0 24 39 0 0 5 18 7 29 3 1 2 0 27 34 9 0 6 37 0 7 14 0 14 2 0 2 39 2 0 29 111 0 11 3 1 1 4 1 0 122 3 0 0 106 47 0 18 0 4 2 2 0 21 9 3 1 13 1 1 94 10 0 78 94 2 0 3 0 0 6 5 4 0 8 2 35 20 0 5 1 121 1 12 0 1 177 2 182 9 1 1 47 25 0 2 42 13 8 22 5 0 0 1 0 0 3 26 8 0 2 0 0 41 4 0 3 2 25 65 4 0 14 0 39 63 3 0 130 8 7 1 62 12 0 2 0 13 44 1 1 0 4 25 0 11 23 0 0 1 2 0 6 0 3 0 0 27 0 0 0 0 0 0 0 0 12 2 46 9 0 9 0 0 1 1 2 10 8 0 0 3 22 0 350 6 0 0 1 26 0 7 0 0 5 2 1 11 2 1 0 2 4 1 10 8 0 0 3 0 1 5 23 0 7 3 135 2 0 7 5 2 0 16 0 3 4 12 2 3 0 1 1 10 1 20 4 3 0 24 2 0 1 11 0 0 7 4 0 5 5 22 4 33 1 36 181 0 54 26 19 0 0 11 3 16 0 0 0 6 9 0 3 12 0 0 0 1 0 10 5 0 0 7 2 0 19 2 0 2 17 0 5 3 30 9 26 0 11 0 0 0 2 9 0 9 10 39 0 1 12 0 5 2 2 98 0 0 49 10 2 0 198 0 8 13 2 25 4 4 2 132 25 0 4 3 4 0 21 0 68 12 41 1 4 16 0 18 2 0 1 8 0 0 7 5 2 4 1 0 0 33 5 4 2 0 0 21 0 20 0 3 10 0 0 1 0 15 11 0 0 5 7 0 0 41 0 4 104 4 0 11 53 0 0 0 19 0 3 9 0 1 4 0 4 8 4 0 44 8 0 4 1 2 25 2 1 1 46 55 0 116 2 1 0 2 0 0 0 0 0 1 4 0 21 5 3 8 0 0 12 1 9 17 2 2 2 1 5 19 1 2 5 15 18 2 3 105 5 6 2 0 0 0 1 1 0 5 1 2 5 7 5 13 8 11 0 0 0 0 1 4 2 1 0 70 6 9 0 17 52 2 14 3 0 15 1 0 2 0 0 5 2 0 0 0 0 0 21 29 14 6 3 13 2 0 0 25 29 0 1 0 0 3 39 0 8 2 24 0 32 48 1 3 22 0 19 2 3 0 23 8 0 16 8 0 0 2 2 0 29 21 0 0 0 0 0 0 0 15 3 76 1 4 9 3 0 0 6 0 1 0 0 0 6 1 2 0 SPP106 Bacteria;Firmicutes;Clostridia;multiorder;multifamily;multigenus;multispecies_spp106_3 0 0 0 0 0 0 0 0 0 0 0 0 0 0 0 0 0 0 0 0 0 0 0 0 0 0 0 0 0 0 0 0 0 0 0 0 0 0 0 0 0 0 0 0 0 0 0 0 0 0 0 0 0 0 0 0 0 0 0 0 0 0 0 0 0 0 0 0 0 0 0 0 0 0 0 0 0 0 0 0 0 0 0 0 0 0 0 0 0 0 0 0 0 0 0 0 0 0 0 0 0 0 0 0 0 0 0 0 0 0 0 0 0 0 0 0 0 0 0 0 0 0 0 0 0 0 0 0 0 0 0 0 0 0 0 0 0 0 0 0 0 0 0 0 0 0 0 0 0 0 0 0 0 0 0 0 0 0 0 0 0 0 0 0 0 0 0 0 0 0 0 0 0 0 0 0 0 0 0 0 0 0 0 0 0 0 0 0 0 0 0 0 0 0 0 0 0 0 0 0 0 0 0 0 0 0 0 0 0 0 0 0 0 0 0 0 0 0 0 0 0 0 0 0 0 0 0 0 0 0 0 0 0 0 0 0 0 0 0 0 0 0 0 0 0 0 0 0 0 0 0 0 0 0 0 0 0 0 0 0 0 0 0 0 0 0 0 0 0 11 2 0 0 1 0 0 11 0 11 0 11 6 0 7 0 0 0 0 1 5 86 0 7 0 0 9 2 0 0 3 1 0 19 27 5 0 0 0 13 0 0 15 0 0 0 0 0 84 1 0 0 3 0 0 0 3 0 0 0 0 0 0 0 0 0 0 0 0 0 0 0 0 0 14 2 2 0 9 1 0 1 2 0 11 0 97 0 12 0 0 0 2 0 1 0 10 0 0 4 0 0 0 0 5 1 0 2 0 0 0 0 0 29 14 0 0 0 8 1 0 0 1 0 3 52 5 19 0 2 18 0 0 0 6 1 0 0 6 0 0 0 3 0 0 0 0 4 0 8 0 0 0 0 6 0 10 5 0 1 0 0 4 41 11 0 1 58 0 0 0 3 8 0 0 30 0 0 0 19 8 0 0 3 0 0 0 0 0 0 25 0 0 0 0 0 0 0 0 3 6 0 6 0 26 25 0 0 0 0 5 13 1 0 2 10 23 7 24 0 8 1 0 0 66 88 0 2 31 0 3 17 0 0 0 10 0 0 15 0 0 1 0 0 0 0 0 0 2 0 0 0 0 0 0 18 8 0 8 0 3 0 36 48 0 14 0 2 23 0 87 0 0 10 0 24 1 2 11 0 16 5 0 0 0 9 0 0 5 0 5 0 0 7 4 0 14 0 0 0 0 27 0 0 7 5 20 69 0 3 0 0 7 2 0 0 0 8 0 0 0 0 0 0 23 0 6 0 26 0 0 0 0 0 14 3 0 0 1 2 1 2 0 0 0 0 0 9 0 0 4 0 0 1 0 0 35 10 1 3 0 8 0 36 103 22 19 0 0 12 12 1 9 27 1 0 0 0 11 0 0 1 0 0 0 0 0 1 0 1 0 4 0 94 10 16 5 3 0 3 1 0 0 0 18 0 5 7 0 0 0 0 51 8 0 0 10 6 0 40 6 5 0 0 1 93 2 0 2 0 0 71 50 7 0 0 0 0 0 0 1 2 0 1 2 0 0 1 0 0 0 0 2 25 0 0 10 13 2 8 0 11 1 6 2 23 0 0 1 16 1 0 29 23 0 13 0 0 12 46 1 33 3 17 0 0 0 12 20 0 14 13 28 0 1 0 0 4 33 0 1 22 0 9 26 0 0 2 0 62 24 1 3 0 0 0 0 0 7 0 0 10 25 0 6 0 0 5 0 0 0 0 0 0 0 0 2 0 1 0 1 3 0 0 0 0 101 0 0 0 2 1 0 0 2 0 0 0 2 9 0 1 3 0 0 0 1 0 0 0 0 0 3 1 0 0 0 0 0 4 4 0 11 0 10 22 0 0 0 0 0 0 0 20 0 1 4 3 111 23 39 12 23 0 5 16 0 0 0 8 0 5 25 4 0 6 0 0 0 14 0 2 0 0 53 0 0 0 0 4 0 0 0 0 0 7 0 0 0 66 40 25 18 0 28 3 0 0 2 0 0 1 0 0 1 0 0 0 12 2 0 12 0 1 20 0 0 1 8 0 10 4 0 7 3 0 5 4 0 0 0 2 0 12 18 0 21 3 1 0 0 0 0 0 5 0 3 4 4 28 0 0 46 0 2 56 0 2 1 0 0 0 0 9 4 0 2 0 3 1 7 70 0 0 2 2 6 0 0 0 0 0 33 0 0 1 7 0 0 5 0 0 13 0 0 93 4 0 0 0 6 0 0 9 0 5 0 10 0 0 0 1 1 0 8 1 0 0 0 0 0 5 2 0 41 2 0 3 1 3 0 1 1 0 0 0 0 18 3 0 0 9 4 0 0 4 12 0 0 8 0 0 0 0 0 2 0 0 1 3 0 0 0 0 0 0 2 1 0 0 0 0 3 0 0 0 0 0 1 0 0 0 0 14 0 0 1 2 0 0 2 3 0 0 0 0 1 0 0 3 2 2 0 4 1 0 0 0 0 0 2 0 0 0 0 1 0 0 0 0 2 0 0 0 3 4 0 0 12 2 0 0 1 0 1 13 0 3 2 2 0 0 5 1 3 2 0 2 0 0 0 0 1 0 0 0 0 0 0 0 0 0 3 0 0 0 8 0 0 0 1 0 0 1 1 1 0 9 1 0 14 1 0 0 0 0 0 1 4 2 0 3 0 0 2 0 0 0 8 13 0 0 6 0 0 2 0 0 0 0 14 0 6 2 0 3 1 0 0 0 0 0 1 13 0 1 0 0 0 12 0 0 0 0 4 22 0 1 7 0 4 13 0 1 4 10 0 2 8 0 8 3 0 0 2 2 0 0 0 0 2 0 0 5 2 0 0 0 1 0 0 86 13 0 5 0 0 1 1 0 6 1 2 0 17 0 1 2 4 0 11 8 0 0 0 0 0 0 10 4 1 8 0 5 2 0 22 8 4 0 33 0 0 0 0 0 41 5 0 4 5 3 0 2 4 0 20 1 0 0 2 0 0 1 54 1 0 4 1 0 3 3 0 2 0 0 8 0 0 0 0 0 17 0 0 41 5 0 0 60 2 0 6 0 6 0 2 0 0 9 1 0 3 15 0 0 3 0 0 0 4 3 0 0 6 0 0 0 0 0 0 0 0 0 0 1 22 0 4 0 1 0 0 0 6 5 0 0 0 0 0 8 0 0 0 1 0 0 0 0 0 0 0 0 0 0 0 0 0 6 0 18 10 0 3 1 0 0 2 12 0 3 0 0 0 0 1 4 0 0 5 0 0 0 0 0 6 0 0 0 0 0 0 0 1 0 6 0 0 0 0 0 0 9 2 0 0 2 1 25 8 1 29 0 2 13 2 0 0 0 3 19 2 0 0 0 1 7 0 3 3 0 0 4 0 0 3 14 0 0 6 1 0 3 2 0 0 0 0 2 0 3 0 11 0 14 1 0 0 6 4 0 21 0 5 0 4 19 0 2 4 0 0 0 0 14 2 0 0 8 0 0 4 0 21 1 0 0 0 31 0 4 0 0 1 1 0 10 1 0 0 4 11 0 1 0 0 1 1 0 0 6 2 0 0 0 0 0 0 7 0 3 1 0 2 0 0 0 0 2 0 2 0 0 9 5 0 0 0 3 0 0 7 0 3 20 12 0 6 49 0 0 0 3 0 10 2 0 9 0 0 0 1 0 0 14 1 0 0 0 0 13 3 1 0 0 7 0 8 0 0 0 0 0 0 0 0 0 0 7 0 1 1 0 9 1 0 0 0 1 2 1 0 0 0 0 0 0 2 0 0 22 7 0 0 6 0 0 0 0 0 5 1 1 0 0 0 6 4 0 0 2 0 0 0 0 0 0 1 6 0 0 0 4 0 0 0 4 0 1 1 0 2 2 1 18 0 0 0 0 0 0 0 0 0 16 5 0 20 0 41 2 0 0 5 4 0 0 0 0 6 4 0 1 0 15 0 5 15 0 0 0 0 1 0 0 0 5 0 0 15 0 0 0 0 0 0 6 6 0 0 0 0 0 0 0 0 4 5 0 0 0 0 0 1 1 0 1 0 0 1 8 0 0 0 SPP108 Bacteria;Firmicutes;Negativicutes;Selenomonadales;Selenomonadaceae;Selenomonas;multispecies_spp108_2 0 0 0 0 0 0 0 0 0 0 0 0 0 0 0 0 0 0 0 0 0 0 0 0 0 0 0 0 0 0 0 0 0 0 0 0 0 0 0 0 0 0 0 0 0 0 0 0 0 0 0 0 0 0 0 0 0 0 0 0 0 0 0 0 0 0 0 0 0 0 0 0 0 0 0 0 0 0 0 0 0 0 0 0 0 0 0 0 0 0 0 0 0 0 0 0 0 0 0 0 0 0 0 0 0 0 0 0 0 0 0 0 0 0 0 0 0 0 0 0 0 0 0 0 0 0 0 0 0 0 0 0 0 0 0 0 0 0 0 0 0 0 0 0 0 0 0 0 0 0 0 0 0 0 0 0 0 0 0 0 0 0 0 0 0 0 0 0 0 0 0 0 0 0 0 0 0 0 0 0 0 0 0 0 0 0 0 0 0 0 0 0 0 0 0 0 0 0 0 0 0 0 0 0 0 0 0 0 0 0 0 0 0 0 0 0 0 0 0 0 0 0 0 0 0 0 0 0 0 0 0 0 0 0 0 0 0 0 0 0 0 0 0 0 0 0 0 0 0 0 0 0 0 0 0 0 0 0 0 0 0 0 0 0 0 0 0 0 0 0 0 0 1 5 180 0 52 10 36 0 11 21 0 28 1 0 1 0 54 13 37 1 2 0 37 0 6 67 0 42 0 0 80 30 2 0 4 0 24 0 0 0 3 0 4 11 0 4 2 0 0 30 25 0 32 0 0 0 0 0 0 2 0 0 0 0 0 0 0 0 0 3 0 23 4 51 0 2 1 0 0 0 0 1 50 3 0 0 0 0 0 19 0 12 0 0 0 0 0 0 16 0 47 34 0 0 2 0 0 50 0 0 8 0 0 2 10 47 0 0 0 0 0 19 3 47 29 0 1 47 3 0 0 9 0 0 0 48 2 0 0 156 0 77 50 0 6 0 119 0 21 9 26 126 0 240 0 0 0 0 0 4 18 17 0 9 18 0 0 0 89 0 0 0 60 6 0 1 1 29 103 24 24 0 22 9 0 53 0 109 23 0 0 5 5 7 0 70 0 0 10 5 0 12 1 0 11 0 17 17 0 5 0 19 74 80 2 3 0 5 0 0 15 43 35 0 7 3 0 21 24 0 0 0 36 0 0 0 1 0 7 1 0 0 0 0 0 1 0 0 0 4 0 0 0 23 0 77 0 0 0 7 58 0 18 0 4 56 0 77 0 12 24 2 0 0 14 57 0 1 19 0 0 0 15 5 0 3 0 36 0 35 0 13 13 51 0 1 0 7 12 0 0 0 0 5 137 0 0 0 0 7 0 0 1 35 18 0 0 0 61 0 96 1 0 40 0 11 0 0 0 586 0 1 2 0 0 0 2 12 0 8 13 0 0 7 67 0 11 9 12 0 1 0 13 64 0 0 0 6 34 10 51 14 0 7 94 0 63 9 0 31 7 32 32 0 0 33 2 5 10 0 0 27 16 30 53 2 0 7 0 0 5 38 14 0 16 0 15 0 0 103 0 0 0 1 8 0 8 0 0 7 57 0 0 26 90 0 3 13 0 0 1 13 0 109 0 0 0 1 36 1 1 27 0 1 11 0 14 130 4 0 56 9 0 2 1 0 0 28 0 1 18 1 0 112 8 1 24 2 66 27 7 2 1 4 0 7 1 6 0 92 27 0 2 0 0 6 14 0 3 0 66 0 145 32 2 0 0 59 9 16 0 0 1 0 4 22 0 229 3 0 80 7 0 0 12 0 75 20 23 0 0 3 0 0 21 0 0 0 0 2 0 15 0 12 11 0 0 0 0 0 0 1 0 1 0 0 117 0 7 0 1 0 0 8 0 0 3 0 1 11 0 3 0 0 1 8 2 0 1 4 0 0 0 0 0 44 0 0 138 47 46 18 0 1 0 0 21 0 0 18 0 0 37 1 0 238 1 0 0 0 14 171 0 0 1 46 38 0 26 34 0 36 217 0 109 0 6 0 2 94 0 0 132 0 20 0 90 30 29 0 0 0 0 0 2 0 12 0 47 0 2 0 4 0 0 1 0 0 11 1 0 0 0 1 0 86 137 1 0 1 0 7 10 0 0 53 7 0 17 0 2 92 0 24 1 170 25 40 14 0 5 5 0 0 21 0 7 391 15 0 20 41 0 7 4 0 1 0 0 3 0 39 0 2 0 8 13 0 6 12 0 57 72 0 19 0 81 5 0 0 11 3 0 11 0 16 62 29 12 0 1 35 18 61 26 0 23 0 0 0 0 0 0 17 0 0 0 0 0 10 0 0 29 0 0 0 0 7 0 3 1 18 18 0 3 0 19 0 0 2 0 2 2 0 3 3 1 0 12 1 0 21 6 0 0 1 0 0 0 0 0 1 0 0 3 1 0 1 30 3 0 0 1 238 0 0 0 0 6 15 0 7 0 0 3 0 29 0 0 5 0 0 1 20 0 0 2 0 0 2 0 0 0 0 0 1 0 1 4 0 8 0 0 2 0 0 0 0 0 0 2 5 0 0 0 0 0 1 0 0 15 0 3 0 2 24 0 3 0 0 17 3 0 0 0 6 0 0 0 0 0 0 0 0 0 0 0 0 6 0 0 4 0 0 8 0 2 0 0 0 0 0 3 0 0 0 0 3 0 10 6 0 0 0 1 0 0 0 0 16 0 0 11 0 0 21 0 5 16 0 1 42 2 0 0 15 0 7 0 0 4 22 0 0 1 2 4 0 1 1 0 0 0 0 0 3 2 0 0 5 1 0 1 0 0 0 1 11 0 0 4 0 16 0 0 0 1 2 0 0 8 0 0 1 0 5 0 0 0 0 0 2 7 0 1 0 0 1 1 0 0 5 2 0 0 8 0 3 0 0 0 13 4 0 8 12 0 3 0 0 1 0 1 0 25 0 0 0 3 7 0 1 0 0 7 0 0 8 0 7 0 13 0 1 2 1 0 28 0 1 0 1 0 0 0 1 0 0 0 3 0 3 0 10 0 0 0 0 0 0 72 3 11 26 0 0 98 9 0 0 8 1 0 0 2 0 0 0 0 0 0 0 2 0 0 0 0 15 0 0 17 0 3 7 0 0 0 0 11 8 0 0 5 0 1 0 0 0 0 1 0 0 29 1 0 0 0 0 0 0 8 0 0 50 2 12 0 0 0 0 0 12 0 0 0 0 0 0 0 0 16 0 98 17 1 0 0 0 16 4 0 0 2 0 0 2 1 0 35 6 0 0 1 11 0 2 1 0 14 2 0 0 0 0 0 0 0 0 2 77 0 9 8 0 1 1 19 0 1 1 0 0 0 1 6 0 0 2 0 31 1 0 0 0 0 0 0 3 0 7 3 0 0 3 5 0 0 167 1 0 45 0 0 0 0 0 0 2 0 5 48 1 0 125 4 0 0 1 3 0 0 0 0 3 0 0 1 2 2 0 27 4 0 19 5 0 0 1 0 0 21 1 0 13 7 0 0 0 8 1 11 0 3 0 0 0 0 0 0 4 3 7 0 11 0 0 4 0 0 5 0 0 9 1 0 0 97 0 0 0 0 1 0 0 1 92 8 0 4 1 0 1 38 0 2 0 34 0 0 14 0 0 2 0 2 1 0 0 1 1 0 0 0 0 0 0 0 0 16 0 0 2 0 0 0 0 2 0 2 0 0 0 2 0 0 3 0 0 0 0 0 23 24 0 0 25 17 0 0 1 68 0 1 0 0 0 1 0 0 0 0 0 2 0 0 4 0 0 1 3 0 0 1 20 0 0 2 0 0 3 0 2 0 0 0 28 0 0 2 0 0 9 0 0 0 0 0 2 0 1 3 0 12 2 0 5 6 0 1 0 0 45 4 1 0 0 0 0 6 0 0 0 0 0 0 0 0 2 37 0 0 0 4 0 6 0 2 0 0 21 1 5 0 101 9 0 0 1 0 1 3 2 2 0 0 0 0 0 0 2 0 0 2 29 0 4 0 3 93 0 0 2 1 0 1 1 0 3 0 0 0 0 29 0 0 2 0 1 4 0 0 0 0 0 11 0 0 1 3 0 0 0 0 0 3 0 0 0 0 0 0 1 0 0 0 0 0 0 17 0 0 0 2 0 8 0 0 0 3 0 1 0 SPP113 Bacteria;Proteobacteria;Betaproteobacteria;Neisseriales;Neisseriaceae;multigenus;multispecies_spp113_2 0 0 0 0 0 0 0 0 0 0 0 0 0 0 0 0 0 0 0 0 0 0 0 0 0 0 0 0 0 0 0 0 0 0 0 0 0 0 0 0 0 0 0 0 0 0 0 0 0 0 0 0 0 0 0 0 0 0 0 0 0 0 0 0 0 0 0 0 0 0 0 0 0 0 0 0 0 0 0 0 0 0 0 0 0 0 0 0 0 0 0 0 0 0 0 0 0 0 0 0 0 0 0 0 0 0 0 0 0 0 0 0 0 0 0 0 0 0 0 0 0 0 0 0 0 0 0 0 0 0 0 0 0 0 0 0 0 0 0 0 0 0 0 0 0 0 0 0 0 0 0 0 0 0 0 0 0 0 0 0 0 0 0 0 0 0 0 0 0 0 0 0 0 0 0 0 0 0 0 0 0 0 0 0 0 0 0 0 0 0 0 0 0 0 0 0 0 0 0 0 0 0 0 0 0 0 0 0 0 0 0 0 0 0 0 0 0 0 0 0 0 0 0 0 0 0 0 0 0 0 0 0 0 0 0 0 0 0 0 0 0 0 0 0 0 0 0 0 0 0 0 0 0 0 0 0 0 0 0 0 0 0 0 0 0 0 0 0 0 6 0 0 0 0 0 0 5 15 0 266 16 8 0 0 2 1 1 0 0 0 44 2 0 0 0 62 3 1 0 2 2 1 9 1 0 1 0 0 9 1 0 0 0 0 0 1 0 94 0 0 0 0 0 0 0 0 0 0 0 0 0 0 0 0 0 0 0 0 0 104 0 6 0 2 2 0 0 0 0 0 0 0 0 0 0 58 13 3 6 0 0 1 0 1 0 1 0 1 3 0 0 0 45 3 0 0 0 1 0 0 0 0 3 9 0 11 50 1 0 5 0 0 0 15 44 0 2 0 1 2 0 0 0 0 0 0 0 17 0 0 0 0 0 105 2 0 5 0 15 0 0 0 1 2 0 0 1 1 4 0 0 0 0 0 0 8 11 1 0 0 1 2 0 0 1 0 0 0 4 0 0 0 2 0 0 0 0 0 0 16 0 0 0 0 0 1 0 3 0 9 0 0 0 0 0 1 5 0 0 93 1 1 0 0 0 0 1 3 2 38 0 1 1 38 0 0 0 0 0 7 4 63 0 0 153 0 0 0 0 0 1 0 0 0 0 0 0 0 0 1 0 2 0 0 0 0 0 1 0 2 0 69 37 2 0 0 0 0 0 0 0 0 3 0 0 0 87 5 1 0 1 0 0 0 0 0 1 46 0 27 1 0 0 7 0 0 0 0 0 0 0 0 0 1 0 222 88 0 0 0 0 1 0 0 0 0 3 0 0 0 0 0 3 0 0 3 2 5 0 0 0 0 0 2 0 0 1 0 1 9 1 0 0 0 0 7 4 0 0 0 0 0 0 1 0 0 1 0 0 0 0 2 1 1214 51 29 10 0 0 6 4 0 36 16 13 0 0 20 3 2 0 0 1 69 1 0 0 0 0 2 0 0 49 4 0 6 2 0 0 0 0 12 0 14 1 1 3 0 0 0 0 8 35 0 0 1 0 0 0 0 211 0 0 0 0 0 0 0 0 1 0 0 0 0 0 0 0 0 0 0 1 0 24 0 0 0 50 0 0 1 1 0 1 0 0 0 20 16 0 0 62 0 25 32 0 1 0 0 51 7 0 1 28 0 4 0 0 8 0 0 0 9 38 0 0 0 8 0 0 0 87 1 0 29 63 153 0 1 1 0 12 0 0 109 2 0 1 0 0 0 1 7 2702 5 0 1 107 0 0 0 0 7 0 95 0 0 1 0 0 0 0 0 0 0 0 299 16 0 7 2 26 0 1 1 0 1 0 0 0 0 0 0 0 0 0 0 0 0 0 0 0 0 0 0 0 0 0 7 0 0 1 0 0 0 0 0 0 0 0 0 0 43 2 0 0 0 0 3 0 0 0 0 2 1 0 2 0 11 0 0 1 0 1 0 0 0 1 0 0 0 0 2 0 0 44 0 0 0 0 0 0 0 0 0 3 0 5 0 40 39 0 0 0 0 1 0 2 0 0 0 1 0 0 0 0 36 0 14 0 0 0 0 770 15 15 0 0 29 0 0 0 0 0 0 0 0 0 1 1 1 151 30 2 1 0 0 0 1 55 0 1 1 32 10 0 0 0 0 10 0 0 27 0 0 0 2 0 1 2 0 19 73 0 0 1 0 0 0 0 0 0 0 0 0 0 1 0 0 0 0 0 0 0 1 0 6 0 0 0 1 0 0 2 0 0 0 0 0 0 0 0 0 0 1 0 0 1 0 1 0 0 0 0 13 1 0 1 0 0 0 0 2 0 2 0 0 0 1 0 0 3 0 0 1 1 0 0 0 1 1 9 4 0 0 0 0 0 1 0 0 14 8 1 0 0 0 0 0 2 0 0 0 0 0 2 1 26 0 0 0 0 0 2 0 0 0 0 0 0 0 0 0 29 5 0 0 1 0 0 1 0 0 0 0 0 0 0 0 0 0 2 0 0 0 0 0 0 0 0 6 1 0 0 0 0 0 8 11 0 4 29 0 0 2 0 0 0 34 0 0 0 0 0 0 4 0 0 5 30 0 0 0 0 0 3 0 0 0 6 0 0 0 0 0 0 0 0 0 1 0 0 5 0 0 1 0 23 1 0 0 0 5 0 0 2 0 0 1 0 3 0 0 148 2 1 0 9 7 0 5 0 0 7 0 0 0 0 159 3 0 0 4 0 1 0 0 0 9 14 0 0 2 0 0 0 2 0 2 0 1 98 6 7 0 2 5 0 2 2 0 0 0 6 0 0 0 0 1 7 0 0 2 0 0 0 1 11 4 0 8 0 0 0 0 1 0 1 0 0 0 0 0 1 7 0 0 1 0 0 2 0 0 0 0 0 0 0 0 0 0 5 1 0 10 0 0 0 0 0 0 24 0 0 0 0 0 25 10 0 1 1 28 13 0 0 0 0 77 0 0 0 0 2 3 1 11 0 0 0 1 0 0 2 0 219 0 0 0 0 1 0 0 17 8 0 3 0 0 0 9 0 0 0 6 2 0 90 0 0 9 0 0 0 0 0 0 2 0 0 0 0 1 0 0 18 0 0 0 28 65 0 14 0 0 59 1 0 1 5 3 0 0 3 0 0 0 0 0 1 0 1 0 0 0 0 0 0 0 0 0 0 0 2 0 1 6 0 0 0 0 0 0 0 9 38 1 0 0 3 0 2 5 0 0 0 0 0 20 0 0 4 0 0 1 0 0 0 1 2 0 8 0 0 0 1 0 0 0 0 0 6 0 0 0 0 0 6 3 0 0 0 0 0 2 0 8 0 0 0 0 1 0 0 0 0 2 16 0 0 0 0 0 0 0 0 0 0 0 9 0 0 3 32 0 7 0 1 0 0 0 4 0 0 0 0 0 0 0 1 0 0 0 0 0 0 5 6 0 0 4 0 0 15 2 0 0 0 1 3 0 13 0 5 0 0 0 0 3 5 0 0 0 0 51 0 0 1 0 0 0 0 0 0 0 3 6 0 0 3 0 0 3 0 11 1 0 0 1 0 0 0 0 0 0 0 1 2 37 0 1 0 1 0 1 0 0 1 0 0 0 6 9 0 0 15 8 1 2 0 0 1 1 0 1 0 30 0 0 0 0 0 0 0 2 0 0 1 0 2 0 0 29 0 0 1 0 0 1 15 0 1 0 11 0 0 0 0 0 0 0 0 6 0 2 71 2 0 7 2 2 95 0 0 0 3 0 0 19 0 0 0 0 0 0 1 0 0 10 0 0 0 0 0 2 0 0 0 0 0 0 0 0 0 0 1 5 1 2 0 0 0 0 0 0 0 1 1 2 0 0 4 0 0 2 0 0 0 0 1 7 0 0 0 0 0 0 0 0 1 0 0 1 15 0 0 13 0 0 0 0 0 2 17 0 0 0 0 0 0 1 0 7 2 0 33 1 20 22 0 134 0 0 0 2 0 0 0 0 0 0 0 0 0 5 0 0 0 0 0 0 0 0 9 0 0 0 0 29 0 29 1 0 0 1 0 0 0 1 0 0 0 0 20 0 0 0 0 0 1 0 0 1 0 0 0 0 0 0 0 6 0 0 0 0 SPP114 Bacteria;Actinobacteria;Actinobacteria;Propionibacteriales;Propionibacteriaceae;Arachnia;multispecies_spp114_2 0 0 0 0 0 0 0 0 0 0 0 0 0 0 0 0 0 0 0 0 0 0 0 0 0 0 0 0 0 0 0 0 0 0 0 0 0 0 0 0 0 0 0 0 0 0 0 0 0 0 0 0 0 0 0 0 0 0 0 0 0 0 0 0 0 0 0 0 0 0 0 0 0 0 0 0 0 0 0 0 0 0 0 0 0 0 0 0 0 0 0 0 0 0 0 0 0 0 0 0 0 0 0 0 0 0 0 0 0 0 0 0 0 0 0 0 0 0 0 0 0 0 0 0 0 0 0 0 0 0 0 0 0 0 0 0 0 0 0 0 0 0 0 0 0 0 0 0 0 0 0 0 0 0 0 0 0 0 0 0 0 0 0 0 0 0 0 0 0 0 0 0 0 0 0 0 0 0 0 0 0 0 0 0 0 0 0 0 0 0 0 0 0 0 0 0 0 0 0 0 0 0 0 0 0 0 0 0 0 0 0 0 0 0 0 0 0 0 0 0 0 0 0 0 0 0 0 0 0 0 0 0 0 0 0 0 0 0 0 0 0 0 0 0 0 0 0 0 0 0 0 0 0 0 0 0 0 0 0 0 0 0 0 0 0 0 0 0 0 6 4 0 8 2 5 0 28 2 1 162 7 3 4 4 1 0 0 0 0 3 24 0 3 0 3 15 4 3 0 4 7 9 3 7 0 5 2 0 5 0 0 6 5 0 0 34 0 8 3 0 0 0 0 0 0 0 6 0 8 0 0 0 0 0 1 0 8 0 0 0 0 32 0 80 8 22 0 0 1 0 11 10 0 25 0 38 0 2 7 0 0 1 0 3 11 0 0 7 9 0 0 1 0 2 0 0 0 0 0 1 0 0 1 0 0 2 15 2 1 0 1 0 0 7 24 6 8 0 12 1 0 0 0 0 0 0 0 4 1 0 4 4 0 19 17 0 30 0 15 0 2 1 0 2 0 2 21 0 1 8 0 7 5 15 0 0 3 0 0 0 0 11 0 0 0 10 0 0 2 6 0 3 0 0 0 0 3 1 0 5 0 0 0 2 0 2 0 0 128 1 1 6 0 13 4 0 71 29 0 5 15 0 0 2 2 0 15 2 1 4 1 0 0 21 61 0 0 0 0 0 6 128 0 0 1 0 0 9 0 0 0 0 0 1 0 0 0 0 0 0 0 0 0 0 6 1 0 2 5 0 0 27 87 11 5 0 3 2 6 2 3 3 6 0 6 1 1 2 0 10 6 18 0 0 54 0 0 10 0 1 0 1 0 5 5 6 0 3 0 1 0 0 3 3 0 0 0 0 11 0 0 9 16 0 5 23 15 0 0 0 0 0 0 13 0 4 0 3 0 0 0 1 0 4 0 0 0 16 1 2 9 3 0 20 0 0 0 0 10 32 0 0 2 0 2 0 25 0 6 2 0 13 1 62 26 6 2 0 280 64 0 2 25 14 5 0 0 9 0 0 0 65 0 36 0 1 0 0 2 8 4 0 15 105 0 14 1 0 10 1 3 2 0 11 0 8 2 0 6 3 0 40 0 0 0 3 3 0 16 2 2 0 0 4 5 4 0 0 0 9 9 39 12 7 0 0 1 0 0 0 18 0 0 1 0 0 2 53 23 0 1 7 4 8 0 11 4 3 4 3 5 0 0 7 1 1 43 4 4 1 0 96 45 0 0 0 0 11 3 3 1 1 2 0 116 96 37 8 0 4 81 35 0 15 9 0 1 1 0 0 10 68 1 1 0 1 3 0 17 18 30 4 0 25 0 0 0 0 0 0 0 15 1 27 0 1 1 0 0 0 0 0 0 0 0 8 4 0 0 2 6 0 0 0 0 14 1 2 28 8 0 0 0 140 0 0 0 0 1 0 6 4 0 0 73 22 0 4 2 1 12 0 0 37 0 0 0 2 9 0 2 2 9 0 33 2 22 15 2 0 0 0 8 0 31 22 1 39 2 0 67 34 1 0 0 1 1 2 1 0 16 3 0 1 4 0 0 1 3 1 4 0 0 1 2 0 22 0 2 0 8 0 22 0 0 0 4 0 1 0 2 0 0 0 0 0 0 0 0 0 0 0 0 7 3 0 0 2 10 22 4 0 1 1 0 5 11 7 8 0 59 0 8 5 0 12 4 257 15 0 2 0 16 5 0 1 0 7 9 0 0 8 0 1 0 9 0 12 50 0 2 13 0 0 22 0 0 1 4 0 1 12 3 3 1 0 0 0 0 9 4 0 0 0 0 0 2 2 0 0 0 7 386 0 0 1 0 0 0 0 0 7 0 1 0 0 0 0 0 0 0 1 2 0 0 0 5 3 0 0 0 0 0 0 2 0 4 1 0 0 1 0 0 5 1 0 0 2 0 0 3 0 0 1 1 0 0 0 0 0 0 2 0 0 0 0 0 0 1 0 2 0 0 0 0 1 2 0 4 0 0 0 1 0 2 1 0 0 2 0 0 0 4 0 0 0 5 0 0 0 1 0 0 0 0 1 0 0 0 0 1 0 0 2 0 0 0 0 1 3 1 0 3 0 3 0 2 3 0 2 0 0 0 15 2 0 0 1 0 1 0 0 0 0 2 0 0 2 0 0 0 0 0 0 1 0 1 0 0 0 1 0 1 0 0 0 0 0 0 0 0 0 0 0 1 0 0 1 0 0 0 1 1 0 2 1 0 0 0 2 0 0 0 1 1 0 2 1 0 2 3 0 1 0 0 2 0 4 2 0 2 2 0 1 0 0 0 1 1 0 0 0 0 0 0 4 0 2 1 3 0 1 0 0 0 1 0 0 0 0 0 0 3 0 0 0 0 2 0 0 0 1 0 3 1 2 0 0 0 1 1 0 0 0 0 0 2 0 1 1 1 0 0 1 0 0 12 26 0 3 3 0 1 0 0 0 0 2 0 0 9 2 0 2 0 0 1 2 0 2 1 1 0 15 0 0 0 6 0 4 8 1 0 0 0 0 0 1 0 0 5 0 1 0 0 11 1 0 0 8 0 0 0 12 0 5 3 0 1 0 0 0 0 6 0 6 2 0 0 0 1 0 4 2 0 0 0 0 0 0 1 0 5 0 1 17 0 0 3 0 6 4 0 0 1 1 0 0 16 2 0 6 0 31 6 8 0 0 0 1 0 0 0 0 0 0 0 0 1 0 0 0 0 0 0 0 0 0 0 0 0 0 0 0 1 1 0 2 0 0 0 0 0 0 0 0 0 0 30 0 1 0 0 0 0 2 0 6 0 0 6 0 0 1 0 0 0 0 0 0 6 2 0 0 0 0 0 5 0 0 0 0 0 10 0 0 1 0 0 1 0 7 0 2 0 1 0 0 0 4 0 0 0 0 0 0 0 0 0 1 0 0 0 3 0 1 0 2 2 1 0 10 1 1 1 0 0 0 0 0 8 0 0 0 0 0 2 0 0 2 0 0 1 0 0 2 4 0 0 1 0 0 1 0 0 2 5 0 2 0 1 0 2 0 0 3 0 0 6 0 0 0 1 1 0 1 2 0 1 0 1 4 0 0 0 1 0 0 2 0 0 1 0 6 1 0 0 4 0 0 0 0 0 1 0 0 1 6 0 0 1 3 0 2 0 0 1 0 0 0 0 0 0 1 2 0 0 0 2 0 3 0 0 0 0 1 0 0 3 0 0 5 0 0 6 0 0 2 0 0 1 0 0 0 3 5 0 0 3 0 0 0 10 0 1 0 0 0 0 0 0 1 0 0 2 4 0 2 0 0 3 0 1 0 0 0 0 3 0 0 0 1 0 0 0 0 0 0 0 0 1 0 0 10 0 0 1 1 1 0 0 0 0 0 0 0 0 0 0 0 3 3 0 7 10 0 1 0 0 0 0 0 0 0 0 0 3 5 0 0 0 0 0 0 0 0 0 1 0 0 0 0 8 0 0 0 2 0 0 0 0 0 8 0 2 0 0 0 0 0 0 4 1 0 17 2 0 2 0 46 1 0 0 0 1 3 0 0 0 0 0 0 4 0 0 0 0 0 0 1 0 0 1 0 0 0 1 4 0 4 2 0 0 0 1 0 0 3 0 0 0 0 0 0 0 0 0 0 0 0 0 0 0 0 3 0 0 0 0 1 1 0 0 0 SPP115 Bacteria;Firmicutes;Clostridia;Clostridiales;Lachnospiraceae_[XIV];Oribacterium;multispecies_spp115_2 56 30 4 50 15 78 1 603 4 47 112 4 98 60 5 62 4 3 229 409 161 19 79 23 230 186 0 166 5 1 124 265 18 12 111 128 7 3 11 4 680 24 112 58 3 66 0 19 0 99 29 42 14 4 142 38 124 43 1 80 0 0 18 3 565 9 0 556 29 345 17 156 11 2 6 69 177 209 31 21 310 153 21 43 539 660 101 38 11 46 0 14 3 31 155 760 2 11 16 43 31 11 21 28 6 4 62 18 300 5 0 83 17 27 274 12 69 28 232 315 16 39 156 378 49 64 161 443 470 0 241 1023 26 11 45 182 879 85 57 188 3 2 6 6 6 134 147 175 439 37 179 186 66 78 186 160 313 34 38 493 165 8 76 20 40 20 19 847 34 26 4 4 16 86 46 79 78 59 3 4 22 17 162 504 269 167 708 119 500 197 25 120 282 817 174 24 225 400 108 48 0 225 154 134 77 209 8 0 12 0 267 16 315 20 19 84 8 322 0 133 16 172 54 25 263 110 373 48 6 354 123 3 62 3 99 430 125 93 366 27 13 117 923 17 15 287 208 45 570 33 397 29 55 57 2 0 185 16 2 10 22 35 29 58 50 48 91 157 0 0 0 0 0 0 0 0 0 0 0 0 0 0 0 0 0 0 0 0 0 0 0 0 0 0 0 0 0 0 0 0 0 0 0 0 0 0 0 0 0 0 0 0 0 0 0 0 0 0 0 0 0 0 0 0 0 0 0 0 0 0 0 0 0 0 0 0 0 0 0 0 0 0 0 0 0 0 0 0 0 0 0 0 0 0 0 0 0 0 0 0 0 0 0 0 0 0 0 0 0 0 0 0 0 0 0 0 0 0 0 0 0 0 0 0 0 0 0 0 0 0 0 0 0 0 0 0 0 0 0 0 0 0 0 0 0 0 0 0 0 0 0 0 0 0 0 0 0 0 0 0 0 0 0 0 0 0 0 0 0 0 0 0 0 0 0 0 0 0 0 0 0 0 0 0 0 0 0 0 0 0 0 0 0 0 0 0 0 0 0 0 0 0 0 0 0 0 0 0 0 0 0 0 0 0 0 0 0 0 0 0 0 0 0 0 0 0 0 0 0 0 0 0 0 0 0 0 0 0 0 0 0 0 0 0 0 0 0 0 0 0 0 0 0 0 0 0 0 0 0 0 0 0 0 0 0 0 0 0 0 0 0 0 0 0 0 0 0 0 0 0 0 0 0 0 0 0 0 0 0 0 0 0 0 0 0 0 0 0 0 0 0 0 0 0 0 0 0 0 0 0 0 0 0 0 0 0 0 0 0 0 0 0 0 0 0 0 0 0 0 0 0 0 0 0 0 0 0 0 0 0 0 0 0 0 0 0 0 0 0 0 0 0 0 0 0 0 0 0 0 0 0 0 0 0 0 0 0 0 0 0 0 0 0 0 0 0 0 0 0 0 0 0 0 0 0 0 0 0 0 0 0 0 0 0 0 0 0 0 0 0 0 0 0 0 0 0 0 0 0 0 0 0 0 0 0 0 0 0 0 0 0 0 0 0 0 0 0 0 0 0 0 0 0 0 0 0 0 0 0 0 0 0 0 0 0 0 0 0 0 0 0 0 0 0 0 0 0 0 0 0 0 0 0 0 0 0 0 0 0 0 0 0 0 0 0 0 0 0 0 0 0 0 0 0 0 0 0 0 0 0 0 0 0 0 0 0 0 0 0 0 0 0 0 0 0 0 0 0 0 0 0 0 0 0 0 0 0 0 0 0 0 0 0 0 0 0 0 0 0 0 0 0 0 0 0 0 0 0 0 0 0 0 0 0 0 0 0 0 0 0 0 0 0 0 0 0 0 0 0 0 0 0 0 0 0 0 0 0 0 0 0 0 0 0 0 0 0 0 0 0 0 0 0 0 0 0 0 0 0 0 0 0 0 0 0 0 0 0 0 0 0 0 0 0 0 0 0 0 0 0 0 0 0 0 0 0 0 0 0 0 0 0 0 0 0 0 0 0 0 0 0 0 0 0 0 0 0 0 0 0 0 0 0 0 0 0 0 0 0 0 0 0 0 0 0 0 0 0 0 0 0 0 0 0 0 0 0 0 0 0 0 0 0 0 0 0 0 0 0 0 0 0 0 0 0 0 0 0 0 0 0 0 0 0 0 0 0 0 0 0 0 0 0 0 0 0 0 0 0 0 0 0 0 0 0 0 0 0 0 0 0 0 0 0 0 0 0 0 0 0 0 0 0 0 0 0 0 0 0 0 0 0 0 0 0 0 0 0 0 0 0 0 0 0 0 0 0 0 0 0 0 0 0 0 0 0 0 0 0 0 0 0 0 0 0 0 0 0 0 0 0 0 0 0 0 0 0 0 0 0 0 0 0 0 0 0 0 0 0 0 0 0 0 0 0 0 0 0 0 0 0 0 0 0 0 0 0 0 0 0 0 0 0 0 0 0 0 0 0 0 0 0 0 0 0 0 0 0 0 0 0 0 0 0 0 0 0 0 0 0 0 0 0 0 0 0 0 0 0 0 0 0 0 0 0 0 0 0 0 0 0 0 0 0 0 0 0 0 0 0 0 0 0 0 0 0 0 0 0 0 0 0 0 0 0 0 0 0 0 0 0 0 0 0 0 0 0 0 0 0 0 0 0 0 0 0 0 0 0 0 0 0 0 0 0 0 0 0 0 0 0 0 0 0 0 0 0 0 0 0 0 0 0 0 0 0 0 0 0 0 0 0 0 0 0 0 0 0 0 0 0 0 0 0 0 0 0 0 0 0 0 0 0 0 0 0 0 0 0 0 0 0 0 0 0 0 0 0 0 0 0 0 0 0 0 0 0 0 0 0 0 0 0 0 0 0 0 0 0 0 0 0 0 0 0 0 0 0 0 0 0 0 0 0 0 0 0 0 0 0 0 0 0 0 0 0 0 0 0 0 0 0 0 0 0 0 0 0 0 0 0 0 0 0 0 0 0 0 0 0 0 0 0 0 0 0 0 0 0 0 0 0 0 0 0 0 0 0 0 0 0 0 0 0 0 0 0 0 0 0 0 0 0 0 0 0 0 0 0 0 0 0 0 0 0 0 0 0 0 0 0 0 0 0 0 0 0 0 0 0 0 0 0 0 0 0 0 0 0 0 0 0 0 0 0 0 0 0 0 0 0 0 0 0 0 0 0 0 0 0 0 0 0 0 0 0 0 0 0 0 0 0 0 0 0 0 0 0 0 0 0 0 0 0 0 0 0 0 0 0 0 0 0 0 0 0 0 0 0 0 0 0 0 0 0 0 0 0 0 0 0 0 0 0 0 0 0 0 0 0 0 0 0 0 0 0 0 0 0 0 0 0 0 0 0 0 0 0 0 0 0 0 0 0 0 0 0 0 0 0 0 0 0 0 0 0 0 0 0 0 0 0 0 0 0 0 0 0 0 0 0 0 0 0 0 0 0 0 0 0 0 0 0 0 0 0 0 0 0 0 0 0 0 0 0 0 0 0 0 0 0 0 0 0 0 0 0 0 0 0 0 0 0 0 0 0 0 0 0 0 0 0 0 0 0 0 0 0 0 0 0 0 0 0 0 0 0 0 0 0 0 0 0 0 0 0 0 0 0 0 0 0 0 0 0 0 0 0 0 0 0 0 0 0 0 0 0 0 0 0 0 0 0 0 0 0 0 0 0 0 0 0 0 0 0 0 0 0 0 0 0 0 0 0 0 0 0 0 0 0 0 0 0 0 0 0 0 0 0 0 0 0 0 0 0 0 0 0 0 0 0 0 0 0 0 0 0 0 0 0 0 0 0 0 0 0 0 0 0 0 0 0 0 0 0 0 0 0 0 0 0 0 0 0 0 0 0 0 0 0 0 0 0 0 0 0 0 0 0 0 0 0 0 0 0 0 0 0 0 0 0 0 0 0 0 0 0 0 0 0 0 0 0 0 0 0 0 0 0 0 0 0 0 0 0 0 0 0 0 0 0 0 0 0 0 0 0 0 0 0 0 0 0 0 0 0 0 0 0 0 0 0 0 0 0 0 0 0 0 0 0 0 0 0 0 0 0 0 0 0 0 0 0 0 0 0 0 0 0 0 0 0 0 0 0 0 0 0 0 0 0 0 0 0 SPP117 Bacteria;Firmicutes;Bacilli;Lactobacillales;Streptococcaceae;Streptococcus;multispecies_spp117_2 14678 14198 793 4898 12728 1288 5 3625 8649 4328 2242 3238 573 11411 1787 9699 9286 15267 3473 3523 1312 1983 9508 860 2693 2966 5487 13920 11220 5760 3301 2317 1704 3119 6675 9811 615 4450 19784 3862 1584 6445 4846 2595 21077 7679 4720 22368 778 12903 948 6943 464 36279 5764 29649 2635 9377 4443 6519 4540 19476 28944 59 5788 6627 7512 3881 49779 3936 14 3029 11263 241 993 4168 4634 6690 762 20193 3983 6622 8529 7332 844 6145 14372 6597 7773 1017 10063 148 1700 14699 1170 4379 1591 28073 17739 4174 3721 4277 10753 27987 350 13968 7192 2464 6229 19400 2996 28876 749 3436 4310 1511 3754 3312 1555 2390 8035 2598 3673 11333 4231 8003 2204 7490 2196 3945 3734 1091 19846 5848 2319 1304 3089 1210 1443 2173 3789 1522 572 18734 2877 6630 3391 5085 3407 14251 1909 8838 11549 7007 5025 5080 1205 12829 2589 5738 16312 6180 4668 320 4049 4856 7040 8634 3295 8126 20 7843 2239 3786 2918 10556 8853 8292 14000 6061 4704 19041 11207 4070 1871 11228 5262 9475 265 4548 2862 22287 6059 19099 5546 10268 5053 3429 2043 19296 9737 5701 1503 4846 2682 665 694 3927 13671 25 1489 9410 5577 13852 17569 3210 2375 5952 978 4468 760 12004 3453 6481 818 3689 3158 3392 1443 297 2691 2002 36638 7645 9710 2546 5039 8894 3584 4013 2643 4498 2562 49584 3986 6474 15916 2526 1212 11097 4762 24630 8109 1581 1029 15332 4512 14409 993 6619 11479 7359 21333 5384 2411 497 5949 1891 0 0 0 0 0 0 0 0 0 0 0 0 0 0 0 0 0 0 0 0 0 0 0 0 0 0 0 0 0 0 0 0 0 0 0 0 0 0 0 0 0 0 0 0 0 0 0 0 0 0 0 0 0 0 0 0 0 0 0 0 0 0 0 0 0 0 0 0 0 0 0 0 0 0 0 0 0 0 0 0 0 0 0 0 0 0 0 0 0 0 0 0 0 0 0 0 0 0 0 0 0 0 0 0 0 0 0 0 0 0 0 0 0 0 0 0 0 0 0 0 0 0 0 0 0 0 0 0 0 0 0 0 0 0 0 0 0 0 0 0 0 0 0 0 0 0 0 0 0 0 0 0 0 0 0 0 0 0 0 0 0 0 0 0 0 0 0 0 0 0 0 0 0 0 0 0 0 0 0 0 0 0 0 0 0 0 0 0 0 0 0 0 0 0 0 0 0 0 0 0 0 0 0 0 0 0 0 0 0 0 0 0 0 0 0 0 0 0 0 0 0 0 0 0 0 0 0 0 0 0 0 0 0 0 0 0 0 0 0 0 0 0 0 0 0 0 0 0 0 0 0 0 0 0 0 0 0 0 0 0 0 0 0 0 0 0 0 0 0 0 0 0 0 0 0 0 0 0 0 0 0 0 0 0 0 0 0 0 0 0 0 0 0 0 0 0 0 0 0 0 0 0 0 0 0 0 0 0 0 0 0 0 0 0 0 0 0 0 0 0 0 0 0 0 0 0 0 0 0 0 0 0 0 0 0 0 0 0 0 0 0 0 0 0 0 0 0 0 0 0 0 0 0 0 0 0 0 0 0 0 0 0 0 0 0 0 0 0 0 0 0 0 0 0 0 0 0 0 0 0 0 0 0 0 0 0 0 0 0 0 0 0 0 0 0 0 0 0 0 0 0 0 0 0 0 0 0 0 0 0 0 0 0 0 0 0 0 0 0 0 0 0 0 0 0 0 0 0 0 0 0 0 0 0 0 0 0 0 0 0 0 0 0 0 0 0 0 0 0 0 0 0 0 0 0 0 0 0 0 0 0 0 0 0 0 0 0 0 0 0 0 0 0 0 0 0 0 0 0 0 0 0 0 0 0 0 0 0 0 0 0 0 0 0 0 0 0 0 0 0 0 0 0 0 0 0 0 0 0 0 0 0 0 0 0 0 0 0 0 0 0 0 0 0 0 0 0 0 0 0 0 0 0 0 0 0 0 0 0 0 0 0 0 0 0 0 0 0 0 0 0 0 0 0 0 0 0 0 0 0 0 0 0 0 0 0 0 0 0 0 0 0 0 0 0 0 0 0 0 0 0 0 0 0 0 0 0 0 0 0 0 0 0 0 0 0 0 0 0 0 0 0 0 0 0 0 0 0 0 0 0 0 0 0 0 0 0 0 0 0 0 0 0 0 0 0 0 0 0 0 0 0 0 0 0 0 0 0 0 0 0 0 0 0 0 0 0 0 0 0 0 0 0 0 0 0 0 0 0 0 0 0 0 0 0 0 0 0 0 0 0 0 0 0 0 0 0 0 0 0 0 0 0 0 0 0 0 0 0 0 0 0 0 0 0 0 0 0 0 0 0 0 0 0 0 0 0 0 0 0 0 0 0 0 0 0 0 0 0 0 0 0 0 0 0 0 0 0 0 0 0 0 0 0 0 0 0 0 0 0 0 0 0 0 0 0 0 0 0 0 0 0 0 0 0 0 0 0 0 0 0 0 0 0 0 0 0 0 0 0 0 0 0 0 0 0 0 0 0 0 0 0 0 0 0 0 0 0 0 0 0 0 0 0 0 0 0 0 0 0 0 0 0 0 0 0 0 0 0 0 0 0 0 0 0 0 0 0 0 0 0 0 0 0 0 0 0 0 0 0 0 0 0 0 0 0 0 0 0 0 0 0 0 0 0 0 0 0 0 0 0 0 0 0 0 0 0 0 0 0 0 0 0 0 0 0 0 0 0 0 0 0 0 0 0 0 0 0 0 0 0 0 0 0 0 0 0 0 0 0 0 0 0 0 0 0 0 0 0 0 0 0 0 0 0 0 0 0 0 0 0 0 0 0 0 0 0 0 0 0 0 0 0 0 0 0 0 0 0 0 0 0 0 0 0 0 0 0 0 0 0 0 0 0 0 0 0 0 0 0 0 0 0 0 0 0 0 0 0 0 0 0 0 0 0 0 0 0 0 0 0 0 0 0 0 0 0 0 0 0 0 0 0 0 0 0 0 0 0 0 0 0 0 0 0 0 0 0 0 0 0 0 0 0 0 0 0 0 0 0 0 0 0 0 0 0 0 0 0 0 0 0 0 0 0 0 0 0 0 0 0 0 0 0 0 0 0 0 0 0 0 0 0 0 0 0 0 0 0 0 0 0 0 0 0 0 0 0 0 0 0 0 0 0 0 0 0 0 0 0 0 0 0 0 0 0 0 0 0 0 0 0 0 0 0 0 0 0 0 0 0 0 0 0 0 0 0 0 0 0 0 0 0 0 0 0 0 0 0 0 0 0 0 0 0 0 0 0 0 0 0 0 0 0 0 0 0 0 0 0 0 0 0 0 0 0 0 0 0 0 0 0 0 0 0 0 0 0 0 0 0 0 0 0 0 0 0 0 0 0 0 0 0 0 0 0 0 0 0 0 0 0 0 0 0 0 0 0 0 0 0 0 0 0 0 0 0 0 0 0 0 0 0 0 0 0 0 0 0 0 0 0 0 0 0 0 0 0 0 0 0 0 0 0 0 0 0 0 0 0 0 0 0 0 0 0 0 0 0 0 0 0 0 0 0 0 0 0 0 0 0 0 0 0 0 0 0 0 0 0 0 0 0 0 0 0 0 0 0 0 0 0 0 0 0 0 0 0 0 0 0 0 0 0 0 0 0 0 0 0 0 0 0 0 0 0 0 0 0 0 0 0 0 0 0 0 0 0 0 0 0 0 0 0 0 0 0 0 0 0 0 0 0 0 0 0 0 0 0 0 0 0 0 0 0 0 0 0 0 0 0 0 0 0 0 0 0 0 0 0 0 0 0 0 0 0 0 0 0 0 0 0 0 0 0 0 0 0 0 0 0 0 0 0 0 0 0 0 0 0 0 0 0 0 0 0 0 0 0 0 0 0 0 0 0 0 0 0 0 0 0 0 0 0 0 0 0 0 0 0 0 0 0 0 0 0 0 0 0 0 0 0 0 0 0 0 0 0 0 0 0 0 0 0 0 0 0 0 0 0 0 0 0 0 0 0 0 0 0 0 0 0 0 0 0 0 0 0 0 0 0 0 0 0 0 0 0 0 0 0 0 0 0 0 0 0 0 0 0 0 0 0 0 0 0 0 0 0 0 0 0 0 0 0 0 0 0 0 0 0 0 0 0 0 0 0 0 0 0 0 0 0 0 0 0 0 0 0 0 0 0 0 0 0 0 0 0 0 0 0 0 0 0 0 0 0 0 0 0 0 0 0 0 0 0 0 0 0 0 0 0 0 0 0 0 0 0 0 0 0 0 0 0 0 0 0 SPP118 Bacteria;Firmicutes;Bacilli;Lactobacillales;Streptococcaceae;Streptococcus;multispecies_spp118_3 4 42 1 0 0 51 0 0 9 10 0 1065 1 0 0 0 0 50 10 10 0 0 0 2 0 39 0 0 0 0 0 72 6 0 3 20 0 11 4 15 0 33 1 0 0 0 148 0 0 1 0 0 1 44 0 0 0 13 6 2 0 0 0 0 1 4 39 0 53 0 0 0 0 0 0 433 0 4 0 0 18 0 39 0 34 1 4 7 1 0 1 0 1 7 158 0 1 0 0 2 1 4 756 0 5 2 0 0 205 5 0 0 0 0 0 2 0 0 8 0 137 1 12 3 72 0 0 5 0 2 0 0 92 5 0 208 0 0 0 0 0 0 2 56 1 1430 1 0 2 0 1 0 0 25 39 6 10 1 0 6 0 0 1 1 0 1 1 0 0 7 0 0 0 0 0 0 247 245 0 4 1 3 26 0 0 11 15 1 0 0 8 0 0 0 4 0 0 3 0 0 0 0 0 0 27 0 0 6 5 19802 0 0 127 0 10 0 0 0 1 1 0 0 0 5 0 3 0 2 1 0 0 0 0 1 0 0 0 1 0 1 0 1 0 1 1 6 0 0 0 5 1 0 0 0 0 0 0 42 2 2 1 2 25 1 0 0 1 0 0 0 0 0 0 0 0 0 0 0 0 0 0 0 0 0 0 0 0 0 0 0 0 0 0 0 0 0 0 0 0 0 0 0 0 0 0 0 0 0 0 0 0 0 0 0 0 0 0 0 0 0 0 0 0 0 0 0 0 0 0 0 0 0 0 0 0 0 0 0 0 0 0 0 0 0 0 0 0 0 0 0 0 0 0 0 0 0 0 0 0 0 0 0 0 0 0 0 0 0 0 0 0 0 0 0 0 0 0 0 0 0 0 0 0 0 0 0 0 0 0 0 0 0 0 0 0 0 0 0 0 0 0 0 0 0 0 0 0 0 0 0 0 0 0 0 0 0 0 0 0 0 0 0 0 0 0 0 0 0 0 0 0 0 0 0 0 0 0 0 0 0 0 0 0 0 0 0 0 0 0 0 0 0 0 0 0 0 0 0 0 0 0 0 0 0 0 0 0 0 0 0 0 0 0 0 0 0 0 0 0 0 0 0 0 0 0 0 0 0 0 0 0 0 0 0 0 0 0 0 0 0 0 0 0 0 0 0 0 0 0 0 0 0 0 0 0 0 0 0 0 0 0 0 0 0 0 0 0 0 0 0 0 0 0 0 0 0 0 0 0 0 0 0 0 0 0 0 0 0 0 0 0 0 0 0 0 0 0 0 0 0 0 0 0 0 0 0 0 0 0 0 0 0 0 0 0 0 0 0 0 0 0 0 0 0 0 0 0 0 0 0 0 0 0 0 0 0 0 0 0 0 0 0 0 0 0 0 0 0 0 0 0 0 0 0 0 0 0 0 0 0 0 0 0 0 0 0 0 0 0 0 0 0 0 0 0 0 0 0 0 0 0 0 0 0 0 0 0 0 0 0 0 0 0 0 0 0 0 0 0 0 0 0 0 0 0 0 0 0 0 0 0 0 0 0 0 0 0 0 0 0 0 0 0 0 0 0 0 0 0 0 0 0 0 0 0 0 0 0 0 0 0 0 0 0 0 0 0 0 0 0 0 0 0 0 0 0 0 0 0 0 0 0 0 0 0 0 0 0 0 0 0 0 0 0 0 0 0 0 0 0 0 0 0 0 0 0 0 0 0 0 0 0 0 0 0 0 0 0 0 0 0 0 0 0 0 0 0 0 0 0 0 0 0 0 0 0 0 0 0 0 0 0 0 0 0 0 0 0 0 0 0 0 0 0 0 0 0 0 0 0 0 0 0 0 0 0 0 0 0 0 0 0 0 0 0 0 0 0 0 0 0 0 0 0 0 0 0 0 0 0 0 0 0 0 0 0 0 0 0 0 0 0 0 0 0 0 0 0 0 0 0 0 0 0 0 0 0 0 0 0 0 0 0 0 0 0 0 0 0 0 0 0 0 0 0 0 0 0 0 0 0 0 0 0 0 0 0 0 0 0 0 0 0 0 0 0 0 0 0 0 0 0 0 0 0 0 0 0 0 0 0 0 0 0 0 0 0 0 0 0 0 0 0 0 0 0 0 0 0 0 0 0 0 0 0 0 0 0 0 0 0 0 0 0 0 0 0 0 0 0 0 0 0 0 0 0 0 0 0 0 0 0 0 0 0 0 0 0 0 0 0 0 0 0 0 0 0 0 0 0 0 0 0 0 0 0 0 0 0 0 0 0 0 0 0 0 0 0 0 0 0 0 0 0 0 0 0 0 0 0 0 0 0 0 0 0 0 0 0 0 0 0 0 0 0 0 0 0 0 0 0 0 0 0 0 0 0 0 0 0 0 0 0 0 0 0 0 0 0 0 0 0 0 0 0 0 0 0 0 0 0 0 0 0 0 0 0 0 0 0 0 0 0 0 0 0 0 0 0 0 0 0 0 0 0 0 0 0 0 0 0 0 0 0 0 0 0 0 0 0 0 0 0 0 0 0 0 0 0 0 0 0 0 0 0 0 0 0 0 0 0 0 0 0 0 0 0 0 0 0 0 0 0 0 0 0 0 0 0 0 0 0 0 0 0 0 0 0 0 0 0 0 0 0 0 0 0 0 0 0 0 0 0 0 0 0 0 0 0 0 0 0 0 0 0 0 0 0 0 0 0 0 0 0 0 0 0 0 0 0 0 0 0 0 0 0 0 0 0 0 0 0 0 0 0 0 0 0 0 0 0 0 0 0 0 0 0 0 0 0 0 0 0 0 0 0 0 0 0 0 0 0 0 0 0 0 0 0 0 0 0 0 0 0 0 0 0 0 0 0 0 0 0 0 0 0 0 0 0 0 0 0 0 0 0 0 0 0 0 0 0 0 0 0 0 0 0 0 0 0 0 0 0 0 0 0 0 0 0 0 0 0 0 0 0 0 0 0 0 0 0 0 0 0 0 0 0 0 0 0 0 0 0 0 0 0 0 0 0 0 0 0 0 0 0 0 0 0 0 0 0 0 0 0 0 0 0 0 0 0 0 0 0 0 0 0 0 0 0 0 0 0 0 0 0 0 0 0 0 0 0 0 0 0 0 0 0 0 0 0 0 0 0 0 0 0 0 0 0 0 0 0 0 0 0 0 0 0 0 0 0 0 0 0 0 0 0 0 0 0 0 0 0 0 0 0 0 0 0 0 0 0 0 0 0 0 0 0 0 0 0 0 0 0 0 0 0 0 0 0 0 0 0 0 0 0 0 0 0 0 0 0 0 0 0 0 0 0 0 0 0 0 0 0 0 0 0 0 0 0 0 0 0 0 0 0 0 0 0 0 0 0 0 0 0 0 0 0 0 0 0 0 0 0 0 0 0 0 0 0 0 0 0 0 0 0 0 0 0 0 0 0 0 0 0 0 0 0 0 0 0 0 0 0 0 0 0 0 0 0 0 0 0 0 0 0 0 0 0 0 0 0 0 0 0 0 0 0 0 0 0 0 0 0 0 0 0 0 0 0 0 0 0 0 0 0 0 0 0 0 0 0 0 0 0 0 0 0 0 0 0 0 0 0 0 0 0 0 0 0 0 0 0 0 0 0 0 0 0 0 0 0 0 0 0 0 0 0 0 0 0 0 0 0 0 0 0 0 0 0 0 0 0 0 0 0 0 0 0 0 0 0 0 0 0 0 0 0 0 0 0 0 0 0 0 0 0 0 0 0 0 0 0 0 0 0 0 0 0 0 0 0 0 0 0 0 0 0 0 0 0 0 0 0 0 0 0 0 0 0 0 0 0 0 0 0 0 0 0 0 0 0 0 0 0 0 0 0 0 0 0 0 0 0 0 0 0 0 0 0 0 0 0 0 0 0 0 0 0 0 0 0 0 0 0 0 0 0 0 0 0 0 0 0 0 0 0 0 0 0 0 0 0 0 0 0 0 0 0 0 0 0 0 0 0 0 0 0 0 0 0 0 0 0 0 0 0 0 0 0 0 0 0 0 0 0 0 0 0 0 0 0 0 0 0 0 0 0 0 0 0 0 0 0 0 0 0 0 0 0 0 0 0 0 0 0 0 0 0 0 0 0 0 0 0 0 0 0 0 0 0 0 0 0 0 0 0 0 0 0 0 0 0 0 SPP123 Bacteria;Firmicutes;Bacilli;Lactobacillales;Streptococcaceae;Streptococcus;multispecies_spp123_2 80 89 36 7 0 4 0 0 1702 74 0 0 0 0 0 0 0 0 0 1 0 0 2 0 7 0 0 9 0 0 0 0 0 15 0 0 0 7 0 0 0 0 0 0 0 0 0 100 0 0 0 0 0 0 0 1 1 6 0 0 0 0 0 0 1 7 0 0 14 0 0 6 1 1 0 0 20 0 0 0 1 0 1 0 0 0 0 9 4 0 7 0 19 0 1 0 0 0 9 0 0 1 1 0 0 88 0 1 0 1 0 0 0 16 6 5 0 0 0 1 0 0 0 0 2 0 2 0 0 192 0 8 0 0 28 0 0 0 26 0 0 0 0 7 1 0 2 0 0 0 0 3 0 0 0 14 0 0 9 0 12 0 0 1 0 0 2 0 0 53 0 0 0 0 9 0 8 15 0 0 0 3 0 0 0 1 2 0 0 0 0 0 4 5 2 0 1 0 1 1 47 17 0 0 0 1 527 13 1 0 0 24 0 0 0 5 0 1 60 32 0 0 4 2 11 0 4 2 0 27 0 558 0 0 0 2 3 10 23 0 0 0 0 70 2220 0 0 0 0 1 0 5 5 1 0 1 553 8 4 0 71 0 0 2 0 0 0 0 0 0 0 0 0 0 0 0 0 0 0 0 0 0 0 0 0 0 0 0 0 0 0 0 0 0 0 0 0 0 0 0 0 0 0 0 0 0 0 0 0 0 0 0 0 0 0 0 0 0 0 0 0 0 0 0 0 0 0 0 0 0 0 0 0 0 0 0 0 0 0 0 0 0 0 0 0 0 0 0 0 0 0 0 0 0 0 0 0 0 0 0 0 0 0 0 0 0 0 0 0 0 0 0 0 0 0 0 0 0 0 0 0 0 0 0 0 0 0 0 0 0 0 0 0 0 0 0 0 0 0 0 0 0 0 0 0 0 0 0 0 0 0 0 0 0 0 0 0 0 0 0 0 0 0 0 0 0 0 0 0 0 0 0 0 0 0 0 0 0 0 0 0 0 0 0 0 0 0 0 0 0 0 0 0 0 0 0 0 0 0 0 0 0 0 0 0 0 0 0 0 0 0 0 0 0 0 0 0 0 0 0 0 0 0 0 0 0 0 0 0 0 0 0 0 0 0 0 0 0 0 0 0 0 0 0 0 0 0 0 0 0 0 0 0 0 0 0 0 0 0 0 0 0 0 0 0 0 0 0 0 0 0 0 0 0 0 0 0 0 0 0 0 0 0 0 0 0 0 0 0 0 0 0 0 0 0 0 0 0 0 0 0 0 0 0 0 0 0 0 0 0 0 0 0 0 0 0 0 0 0 0 0 0 0 0 0 0 0 0 0 0 0 0 0 0 0 0 0 0 0 0 0 0 0 0 0 0 0 0 0 0 0 0 0 0 0 0 0 0 0 0 0 0 0 0 0 0 0 0 0 0 0 0 0 0 0 0 0 0 0 0 0 0 0 0 0 0 0 0 0 0 0 0 0 0 0 0 0 0 0 0 0 0 0 0 0 0 0 0 0 0 0 0 0 0 0 0 0 0 0 0 0 0 0 0 0 0 0 0 0 0 0 0 0 0 0 0 0 0 0 0 0 0 0 0 0 0 0 0 0 0 0 0 0 0 0 0 0 0 0 0 0 0 0 0 0 0 0 0 0 0 0 0 0 0 0 0 0 0 0 0 0 0 0 0 0 0 0 0 0 0 0 0 0 0 0 0 0 0 0 0 0 0 0 0 0 0 0 0 0 0 0 0 0 0 0 0 0 0 0 0 0 0 0 0 0 0 0 0 0 0 0 0 0 0 0 0 0 0 0 0 0 0 0 0 0 0 0 0 0 0 0 0 0 0 0 0 0 0 0 0 0 0 0 0 0 0 0 0 0 0 0 0 0 0 0 0 0 0 0 0 0 0 0 0 0 0 0 0 0 0 0 0 0 0 0 0 0 0 0 0 0 0 0 0 0 0 0 0 0 0 0 0 0 0 0 0 0 0 0 0 0 0 0 0 0 0 0 0 0 0 0 0 0 0 0 0 0 0 0 0 0 0 0 0 0 0 0 0 0 0 0 0 0 0 0 0 0 0 0 0 0 0 0 0 0 0 0 0 0 0 0 0 0 0 0 0 0 0 0 0 0 0 0 0 0 0 0 0 0 0 0 0 0 0 0 0 0 0 0 0 0 0 0 0 0 0 0 0 0 0 0 0 0 0 0 0 0 0 0 0 0 0 0 0 0 0 0 0 0 0 0 0 0 0 0 0 0 0 0 0 0 0 0 0 0 0 0 0 0 0 0 0 0 0 0 0 0 0 0 0 0 0 0 0 0 0 0 0 0 0 0 0 0 0 0 0 0 0 0 0 0 0 0 0 0 0 0 0 0 0 0 0 0 0 0 0 0 0 0 0 0 0 0 0 0 0 0 0 0 0 0 0 0 0 0 0 0 0 0 0 0 0 0 0 0 0 0 0 0 0 0 0 0 0 0 0 0 0 0 0 0 0 0 0 0 0 0 0 0 0 0 0 0 0 0 0 0 0 0 0 0 0 0 0 0 0 0 0 0 0 0 0 0 0 0 0 0 0 0 0 0 0 0 0 0 0 0 0 0 0 0 0 0 0 0 0 0 0 0 0 0 0 0 0 0 0 0 0 0 0 0 0 0 0 0 0 0 0 0 0 0 0 0 0 0 0 0 0 0 0 0 0 0 0 0 0 0 0 0 0 0 0 0 0 0 0 0 0 0 0 0 0 0 0 0 0 0 0 0 0 0 0 0 0 0 0 0 0 0 0 0 0 0 0 0 0 0 0 0 0 0 0 0 0 0 0 0 0 0 0 0 0 0 0 0 0 0 0 0 0 0 0 0 0 0 0 0 0 0 0 0 0 0 0 0 0 0 0 0 0 0 0 0 0 0 0 0 0 0 0 0 0 0 0 0 0 0 0 0 0 0 0 0 0 0 0 0 0 0 0 0 0 0 0 0 0 0 0 0 0 0 0 0 0 0 0 0 0 0 0 0 0 0 0 0 0 0 0 0 0 0 0 0 0 0 0 0 0 0 0 0 0 0 0 0 0 0 0 0 0 0 0 0 0 0 0 0 0 0 0 0 0 0 0 0 0 0 0 0 0 0 0 0 0 0 0 0 0 0 0 0 0 0 0 0 0 0 0 0 0 0 0 0 0 0 0 0 0 0 0 0 0 0 0 0 0 0 0 0 0 0 0 0 0 0 0 0 0 0 0 0 0 0 0 0 0 0 0 0 0 0 0 0 0 0 0 0 0 0 0 0 0 0 0 0 0 0 0 0 0 0 0 0 0 0 0 0 0 0 0 0 0 0 0 0 0 0 0 0 0 0 0 0 0 0 0 0 0 0 0 0 0 0 0 0 0 0 0 0 0 0 0 0 0 0 0 0 0 0 0 0 0 0 0 0 0 0 0 0 0 0 0 0 0 0 0 0 0 0 0 0 0 0 0 0 0 0 0 0 0 0 0 0 0 0 0 0 0 0 0 0 0 0 0 0 0 0 0 0 0 0 0 0 0 0 0 0 0 0 0 0 0 0 0 0 0 0 0 0 0 0 0 0 0 0 0 0 0 0 0 0 0 0 0 0 0 0 0 0 0 0 0 0 0 0 0 0 0 0 0 0 0 0 0 0 0 0 0 0 0 0 0 0 0 0 0 0 0 0 0 0 0 0 0 0 0 0 0 0 0 0 0 0 0 0 0 0 0 0 0 0 0 0 0 0 0 0 0 0 0 0 0 0 0 0 0 0 0 0 0 0 0 0 0 0 0 0 0 0 0 0 0 0 0 0 0 0 0 0 0 0 0 0 0 0 0 0 0 0 0 0 0 0 0 0 0 0 0 0 0 0 0 0 0 0 0 0 0 0 0 0 0 0 0 0 0 0 0 0 0 0 0 0 0 0 0 0 0 0 0 0 0 0 0 0 0 0 0 0 0 0 0 0 0 0 0 0 0 0 0 0 0 0 0 0 0 0 0 0 0 0 0 0 0 0 0 0 0 0 0 0 0 0 0 0 0 0 0 0 0 0 0 0 0 0 0 0 0 0 0 0 0 0 0 0 0 0 0 0 0 0 0 0 0 0 0 0 0 0 0 0 0 0 0 SPP124 Bacteria;Fusobacteria;Fusobacteriia;Fusobacteriales;Leptotrichiaceae;Leptotrichia;multispecies_spp124_2 0 0 0 0 0 0 0 0 0 0 0 0 0 0 0 0 0 0 0 0 0 0 0 0 0 0 0 0 0 0 0 0 0 0 0 0 0 0 0 0 0 0 0 0 0 0 0 0 0 0 0 0 0 0 0 0 0 0 0 0 0 0 0 0 0 0 0 0 0 0 0 0 0 0 0 0 0 0 0 0 0 0 0 0 0 0 0 0 0 0 0 0 0 0 0 0 0 0 0 0 0 0 0 0 0 0 0 0 0 0 0 0 0 0 0 0 0 0 0 0 0 0 0 0 0 0 0 0 0 0 0 0 0 0 0 0 0 0 0 0 0 0 0 0 0 0 0 0 0 0 0 0 0 0 0 0 0 0 0 0 0 0 0 0 0 0 0 0 0 0 0 0 0 0 0 0 0 0 0 0 0 0 0 0 0 0 0 0 0 0 0 0 0 0 0 0 0 0 0 0 0 0 0 0 0 0 0 0 0 0 0 0 0 0 0 0 0 0 0 0 0 0 0 0 0 0 0 0 0 0 0 0 0 0 0 0 0 0 0 0 0 0 0 0 0 0 0 0 0 0 0 0 0 0 0 0 0 0 0 0 0 0 0 0 0 0 0 0 0 0 0 0 0 0 0 0 0 0 0 0 0 0 0 0 0 0 0 0 6 0 0 1 0 0 0 0 0 0 0 50 4 0 1 1 0 0 0 0 0 0 0 0 1 0 0 0 0 0 0 0 0 0 0 0 0 0 0 0 1 0 0 0 0 0 0 0 0 0 0 0 0 0 0 0 0 9 0 0 0 0 0 0 0 0 0 0 0 1 5 0 0 0 0 0 0 0 1 14 6 0 74 2 0 552 77 0 0 0 0 0 0 0 0 0 0 0 0 21 0 0 0 0 0 1 155 0 0 0 0 0 0 0 0 0 0 0 0 80 89 0 0 2 34 0 0 0 181 0 0 0 0 0 0 0 0 0 0 0 0 0 0 21 171 1 0 0 0 0 0 0 0 0 0 0 0 0 0 0 0 0 0 0 13 0 0 25 0 41 3 0 0 0 0 16 25 0 0 0 15 0 325 0 120 0 0 0 0 0 0 0 0 0 0 0 0 0 864 333 2 0 0 0 0 0 0 0 0 0 0 0 0 0 0 1 15 6 0 0 4 0 0 0 0 0 0 0 0 0 0 0 0 0 0 15 0 0 0 51 1 0 0 0 0 0 0 0 0 2428 0 0 0 0 0 0 0 0 0 0 0 2 0 0 0 0 0 0 0 0 0 0 0 0 157 0 0 0 0 0 0 0 0 0 0 0 0 0 0 0 0 0 0 1 0 0 0 0 0 0 0 0 0 0 0 0 0 0 0 80 0 0 0 0 0 0 1 0 368 15 15 0 0 0 0 0 0 0 96 0 0 0 0 0 0 0 0 0 36 9 0 0 0 2 1 0 632 0 0 0 1 0 0 0 331 313 13 152 0 0 1 0 0 1 0 1607 433 0 0 0 0 0 1 0 0 0 0 0 0 0 0 0 0 0 0 11 0 28 0 136 0 0 0 0 0 0 0 0 0 0 0 0 110 0 0 0 0 0 0 0 0 0 0 0 0 0 50 0 0 0 0 0 0 79 0 1 0 0 0 13 0 0 0 0 0 0 0 0 0 0 0 0 0 0 0 0 0 0 0 0 0 0 0 0 23 0 0 0 0 0 0 0 0 0 0 0 0 0 0 3 0 0 0 1 0 0 1 0 0 0 0 0 0 0 0 0 0 0 0 0 0 0 0 0 0 0 0 0 0 31 0 0 0 0 0 0 0 0 0 0 0 5 326 449 0 0 0 0 0 0 0 0 0 0 0 0 0 0 0 0 0 0 0 0 0 0 0 0 0 0 0 0 0 0 0 0 0 0 0 0 0 17 0 2 8 0 18 8 0 0 0 0 1 0 0 0 239 115 2032 0 0 0 0 1 0 0 38 34 9 0 0 0 0 0 0 0 0 0 0 0 0 0 15 0 0 40 0 0 0 0 0 0 0 0 0 0 0 0 0 0 0 0 0 0 0 0 0 0 0 111 249 75 51 143 0 966 101 0 0 0 0 0 0 0 0 0 205 0 0 0 0 0 0 0 0 0 1 0 3 606 0 0 226 0 1 0 0 1 1 0 0 0 0 0 0 0 0 1 0 0 0 0 0 0 0 0 0 0 0 0 0 0 0 0 0 0 0 0 0 0 0 0 0 0 0 0 0 0 0 0 38 0 0 0 1 0 0 0 0 0 0 0 0 0 0 0 0 0 0 0 0 0 0 0 0 0 15 14 54 0 0 1 0 0 6 0 0 0 0 0 0 0 14 0 0 0 1 0 0 0 0 0 0 0 0 0 0 0 0 0 0 0 0 0 0 0 0 0 0 0 0 0 0 0 0 0 0 0 0 0 0 0 0 0 0 0 0 0 0 0 0 0 0 0 0 0 17 8 0 4 0 6 5 0 0 0 0 9 0 0 0 0 0 0 38 101 0 0 0 0 0 0 0 0 0 0 0 0 0 0 0 0 0 0 0 0 7 0 0 0 0 29 0 0 0 0 0 0 1 0 1 0 31 0 0 0 79 0 1 13 0 0 166 0 0 0 0 0 0 0 6 0 0 12 183 7 24 5 75 4 0 0 1 0 0 0 1 0 0 22 0 0 0 0 0 0 0 0 0 0 0 0 0 0 0 0 0 0 0 0 0 0 0 0 0 0 0 52 0 0 0 0 0 0 0 0 0 0 0 0 20 0 0 0 0 0 0 0 0 0 0 0 0 0 0 0 0 0 0 0 0 0 1 0 0 0 0 0 0 0 0 0 0 0 1 387 306 1 0 0 0 1 4 0 0 0 0 0 0 0 0 0 0 0 0 0 0 0 0 0 0 0 0 0 2 0 0 0 0 0 0 0 0 0 0 0 0 0 0 152 0 0 1 0 0 101 1 0 0 3 1 0 0 0 0 0 0 0 0 0 0 0 0 1 0 0 0 0 0 0 0 70 0 0 214 51 0 65 1 0 0 110 0 0 1 0 0 0 0 0 0 0 0 0 0 0 0 0 8 0 0 0 1 0 61 0 0 0 0 0 0 0 0 0 0 4 0 0 0 0 1 0 11 0 0 0 0 11 0 0 1 17 0 0 0 0 0 0 0 24 0 0 0 0 0 111 14 0 0 0 0 0 0 0 0 0 0 0 0 53 6 0 0 0 0 0 0 0 0 8 252 39 0 0 0 5 0 0 0 101 559 0 0 0 0 0 0 0 0 1 0 0 0 0 0 19 1512 0 0 6 2 0 0 0 0 0 0 0 0 0 3 27 0 37 34 0 4 0 0 0 0 7 20 0 0 3 0 0 0 0 0 1 0 0 0 0 0 0 35 39 0 0 0 0 0 0 0 0 0 0 0 0 0 0 0 0 0 0 0 0 0 0 0 0 0 0 0 0 0 1 0 0 0 0 36 1 0 0 0 0 6 0 92 0 0 1 0 0 0 0 0 0 0 0 0 0 0 0 0 0 1 0 0 0 0 0 0 0 0 0 0 0 2 1 0 0 0 0 0 0 0 0 0 0 0 3 219 0 0 51 0 0 0 0 0 0 0 0 0 0 0 0 1 0 1 0 0 0 0 0 0 0 0 0 0 0 0 0 0 0 0 0 0 1 0 0 0 0 0 0 0 0 0 0 0 0 481 7 0 0 0 0 5 0 0 0 1 0 0 86 191 1 0 0 0 0 0 0 0 1 0 0 0 0 0 0 0 0 0 0 0 0 0 0 0 0 0 0 0 0 0 0 0 0 0 0 0 5 56 0 1 0 0 0 0 0 0 0 0 0 2 0 0 0 0 6 0 0 0 6 0 0 0 0 4 0 0 0 0 0 0 0 53 0 0 25 2 0 30 14 0 0 0 0 0 0 0 0 0 1 123 0 0 7 0 0 0 0 0 0 0 5 0 0 0 0 25 2 0 8 0 733 0 0 0 0 0 0 0 0 0 0 0 0 0 0 0 0 0 0 0 3 0 0 0 0 0 0 0 0 0 1 0 0 0 0 0 0 0 0 0 0 0 0 0 0 0 0 51 41 11 1 0 10 0 0 0 0 6 0 0 2 0 0 0 0 SPP131 Bacteria;Proteobacteria;Gammaproteobacteria;Pasteurellales;Pasteurellaceae;Aggregatibacter;multispecies_spp131_2 0 0 0 0 0 0 0 0 0 0 0 0 0 0 0 0 0 0 0 0 0 0 0 0 0 0 0 0 0 0 0 0 0 0 0 0 0 0 0 0 0 0 0 0 0 0 0 0 0 0 0 0 0 0 0 0 0 0 0 0 0 0 0 0 0 0 0 0 0 0 0 0 0 0 0 0 0 0 0 0 0 0 0 0 0 0 0 0 0 0 0 0 0 0 0 0 0 0 0 0 0 0 0 0 0 0 0 0 0 0 0 0 0 0 0 0 0 0 0 0 0 0 0 0 0 0 0 0 0 0 0 0 0 0 0 0 0 0 0 0 0 0 0 0 0 0 0 0 0 0 0 0 0 0 0 0 0 0 0 0 0 0 0 0 0 0 0 0 0 0 0 0 0 0 0 0 0 0 0 0 0 0 0 0 0 0 0 0 0 0 0 0 0 0 0 0 0 0 0 0 0 0 0 0 0 0 0 0 0 0 0 0 0 0 0 0 0 0 0 0 0 0 0 0 0 0 0 0 0 0 0 0 0 0 0 0 0 0 0 0 0 0 0 0 0 0 0 0 0 0 0 0 0 0 0 0 0 0 0 0 0 0 0 0 0 0 0 0 0 62 3 0 17 0 35 0 22 28 0 0 39 0 0 0 0 0 0 22 0 82 1 3 284 0 61 77 2 0 0 11 12 0 10 0 0 10 61 0 1 0 0 2 0 0 0 0 0 4 0 0 58 425 0 0 0 0 0 0 1 0 0 0 0 6 0 0 25 0 0 0 708 0 0 0 0 2 0 0 0 1 20 48 0 3 0 0 0 14 16 0 0 1 0 1 1 0 0 30 44 0 1 0 0 306 2 0 0 3 8 26 0 0 0 0 0 0 268 0 2 5 0 0 0 1 378 15 26 278 125 96 3047 0 0 0 0 0 1 0 17 5 20 1 0 12 3 0 69 0 2 0 3 0 0 0 0 1 7 0 78 65 19 0 42 1 0 1 1 0 2 0 0 0 0 0 0 0 0 0 51 0 0 3 7 0 0 0 0 0 0 40 1 0 0 0 0 1 0 0 144 520 0 0 0 0 40 0 10 0 0 4 0 0 0 0 14 2 560 201 0 11 3 0 0 142 902 0 0 1 0 211 0 1 0 0 17 0 0 252 1 0 0 0 0 0 0 0 1 0 0 0 0 1 1 2 0 0 0 23 23 0 0 505 43 82 28 0 710 0 0 0 0 200 8 2 376 1322 15 1 0 0 0 0 6 2 5 0 22 88 0 0 0 0 2 38 1 0 0 0 0 0 7 0 0 2 0 657 116 0 11 1 97 14 25 0 2 0 0 23 0 0 1 0 1 679 0 0 0 2 0 0 0 3 0 0 0 0 0 0 1 26 116 443 604 4572 0 1 0 0 1 48 1 0 0 0 22 0 194 0 1 106 0 0 51 0 0 130 0 0 1 35 5 0 5 0 44 0 0 0 1 1 0 28 363 1 0 0 0 13 536 2 4 0 1 1 0 4 0 0 39 1 0 0 0 1 0 3 375 220 0 0 0 42 1 50 0 260 8 184 0 0 2436 0 0 0 0 1 0 0 0 0 1 38 5 0 0 0 0 21 0 1 0 0 0 0 0 0 3 593 0 0 0 22 1 22 0 0 68 40 66 508 0 0 0 0 540 0 0 0 68 49 592 22 0 6 1544 1 0 88 0 0 0 1618 721 0 0 0 78 1 0 0 0 365 0 0 0 0 13 3 0 14 9 123 0 11 0 0 0 0 37 31 0 7 0 0 1 0 6 9 132 0 0 18 0 1 0 5 0 0 0 93 206 12 0 0 0 641 5 0 41 0 0 0 6 6 207 46 70 4 1 7 0 0 0 1 1 0 0 0 2 0 2 10 2 0 834 1 208 0 172 166 0 0 0 0 0 27 0 0 1 0 0 87 0 0 94 1 0 0 0 0 0 21 1 0 1 26 0 119 0 0 7 83 17 0 1 0 4 0 0 0 1 2 0 0 0 0 0 12 143 0 0 0 0 0 0 0 0 122 3 0 16 0 1 0 0 0 76 4 46 0 0 0 0 185 0 220 0 0 0 0 4 0 0 14 0 0 0 95 15 0 369 0 0 3 5 3 24 19 0 0 52 1 3 0 0 10 1 194 0 0 0 0 46 2 0 0 0 0 0 0 16 9 0 291 0 6 0 346 0 0 0 32 0 0 0 0 0 1 0 5 2 1 0 0 0 1 0 15 0 32 49 0 0 1 0 0 12 1 0 0 7 97 50 0 12 0 0 0 1 0 0 4 0 109 0 0 0 0 0 0 0 0 151 0 0 0 267 96 0 0 5 3 0 5 0 1 91 17 11 0 0 1 0 1 82 0 15 0 0 0 0 0 0 0 0 0 13 3 0 9 111 57 0 0 0 0 0 1 8 0 0 0 0 7 46 0 34 0 116 0 0 533 0 0 0 15 73 0 2 0 4 0 0 24 0 10 104 1 0 2 0 0 1 110 0 15 21 14 0 57 31 53 0 0 0 0 0 0 0 0 0 0 4 0 75 0 28 54 0 39 2 0 7 0 4 0 0 13 0 54 3 0 0 3 0 0 0 0 64 0 11 0 0 5 55 0 0 77 0 0 17 1 182 1 0 0 84 2 28 42 0 1 13 0 1 0 1 0 0 0 0 24 466 0 49 0 0 0 0 4 0 0 0 13 2 0 43 11 0 334 101 1 4 0 14 0 0 0 0 0 0 1 0 16 33 67 0 34 0 11 0 0 0 0 0 0 0 1 2 0 1 86 0 0 0 0 0 0 0 10 0 107 0 0 318 2 14 34 19 0 0 0 0 185 135 0 30 0 0 154 264 0 0 2 0 0 401 0 0 0 1 1 191 148 0 0 0 0 0 36 0 0 0 35 0 0 0 0 0 0 357 50 0 43 0 0 1 0 0 0 0 0 0 53 93 0 276 23 6 23 27 30 0 0 7 0 16 0 6 0 32 0 0 0 0 8 0 54 0 286 8 0 0 0 0 810 85 0 90 0 0 0 213 19 2 230 29 0 0 12 1 0 9 122 15 0 154 5 0 0 234 0 0 0 22 109 0 0 12 0 17 0 23 0 0 265 0 4 19 0 0 15 0 6 0 4 0 0 78 28 0 0 0 0 0 0 0 6 0 7 7 0 0 20 1 0 0 0 0 26 2 118 12 0 1 10 0 1 2 0 0 0 0 0 0 0 0 1 148 0 0 210 0 1 100 41 18 0 0 0 0 0 0 3 18 0 0 0 1 0 26 0 0 7 393 0 6 17 0 0 0 0 0 0 0 0 6 2 25 26 0 0 2 1 0 108 0 0 0 0 0 0 0 33 0 184 3 5 0 8 1 0 29 82 0 0 3 0 71 12 0 43 1 194 18 0 0 0 24 0 0 0 0 0 0 0 11 0 11 6 0 0 0 0 1 0 0 0 0 0 0 0 1 0 1 192 0 0 0 0 27 91 336 1 0 0 0 0 89 1 1 10 52 1 0 81 205 0 0 1 1 422 0 0 115 159 6 0 121 0 2 673 0 97 183 0 0 0 12 0 4 7 0 4 7 0 0 47 0 0 8 1 0 12 2 1 0 0 0 0 96 1 0 1 0 0 0 195 6 0 16 0 0 3 0 4 0 0 2 0 29 26 0 464 111 0 0 184 0 0 0 14 0 0 91 113 0 0 0 3 0 1 0 0 81 0 0 248 11 0 0 30 0 0 273 41 1 0 0 0 2 0 39 9 0 0 6 75 1 0 0 2 0 1 0 0 0 0 0 0 18 19 0 0 0 0 0 0 3 113 69 445 283 148 0 0 1 10 0 0 97 7 0 1 241 0 138 26 0 0 3 0 0 20 1 23 109 3 102 0 182 26 0 0 0 0 0 0 5 0 0 2 98 18 0 0 11 0 40 0 0 4 0 0 0 0 4 0 0 0 0 0 0 0 98 4 0 0 0 52 0 0 0 0 0 0 3 1 0 0 0 0 23 0 2 1 6 12 0 0 0 0 4 0 0 0 0 1 0 4 0 0 0 15 158 0 65 5 0 0 9 6 0 4 24 0 0 0 0 0 0 1 0 1 0 0 281 0 0 821 105 0 0 0 SPP132 Bacteria;Firmicutes;Clostridia;Negativicutes;Veillonellaceae;Veillonella;multispecies_spp132_3 0 0 0 0 0 0 0 0 0 0 0 0 0 0 0 0 0 0 0 0 0 0 0 0 0 0 0 0 0 0 0 0 0 0 0 0 0 0 0 0 0 0 0 0 0 0 0 0 0 0 0 0 0 0 0 0 0 0 0 0 0 0 0 0 0 0 0 0 0 0 0 0 0 0 0 0 0 0 0 0 0 0 0 0 0 0 0 0 0 0 0 0 0 0 0 0 0 0 0 0 0 0 0 0 0 0 0 0 0 0 0 0 0 0 0 0 0 0 0 0 0 0 0 0 0 0 0 0 0 0 0 0 0 0 0 0 0 0 0 0 0 0 0 0 0 0 0 0 0 0 0 0 0 0 0 0 0 0 0 0 0 0 0 0 0 0 0 0 0 0 0 0 0 0 0 0 0 0 0 0 0 0 0 0 0 0 0 0 0 0 0 0 0 0 0 0 0 0 0 0 0 0 0 0 0 0 0 0 0 0 0 0 0 0 0 0 0 0 0 0 0 0 0 0 0 0 0 0 0 0 0 0 0 0 0 0 0 0 0 0 0 0 0 0 0 0 0 0 0 0 0 0 0 0 0 0 0 0 0 0 0 0 0 0 0 0 0 0 1 17 107 7 5 643 271 0 58 2 115 11 267 356 2241 91 171 467 2139 810 762 720 149 489 2 32 14 63 247 25 0 109 329 5 413 379 36 18 1596 181 97 14 4 190 313 3 1040 398 1143 109 468 477 6 1 96 0 1947 6 19 0 11 0 55 656 9 4 0 0 5 17 833 39 22 1239 0 182 173 575 2 117 138 0 94 21 5 130 1401 73 316 118 2 5 2 155 0 206 14 139 0 30 0 0 52 7 269 595 22 97 14 2 95 332 682 0 42 4 2 51 90 1658 1 7 94 931 0 100 43 6 1 2 13 6 4 0 1709 8 10 30 0 3 0 8 81 229 49 356 384 51 109 0 408 0 51 357 693 656 0 162 1071 0 2 4 1 14 104 35 320 119 80 2 3 38 73 0 262 873 49 380 4 350 0 19 334 155 186 1 408 394 20 73 6 5 1 1 145 8 738 6 346 117 13 11 10 175 5 0 101 55 219 590 4 21 64 468 1180 605 307 506 69 13 0 15 588 275 927 43 491 0 222 367 6 576 582 75 1 74 23 3 947 8 59 546 1124 763 452 20 11 3 113 65 1 1 26 646 2 9 30 181 1 1 0 178 0 10 6 14 478 0 34 131 54 0 63 831 327 1852 1 1 2 172 0 12 13 50 6 0 4 1 6 69 17 7 1 139 259 330 141 63 2 641 0 106 384 0 2 91 5 5 6 1 32 0 6 9 4 0 294 24 4 1 66 9 2106 3595 890 1933 32 132 0 34 0 2 0 164 1 53 1 1 0 41 124 109 0 27 474 6 25 0 43 18 25 4 3 684 318 2 10 24 249 24 279 17 460 12 16 5 36 11 3 0 264 240 194 215 154 17 4 6 1 553 1007 10 191 501 49 2 0 319 77 326 0 126 2 5 16 37 6 20 474 2781 6 0 9 98 0 27 3 42 262 1 0 1 1 38 321 34 6 47 14 8 5 13 73 422 788 377 59 156 2 728 370 50 38 413 133 1230 15 16 300 159 2898 556 17 4 53 312 0 46 0 2 55 329 8 37 44 12 0 4 59 85 72 318 283 833 40 188 19 149 29 15 167 299 0 40 88 12 9 0 3 100 51 7 126 22 26 732 42 77 20 129 7 13 5 115 5 6 46 0 4 124 8 341 5 2 138 8 69 248 169 164 58 388 15 0 0 33 127 16 1259 32 86 0 25 21 26 55 0 175 496 0 1497 34 787 2 3 0 6 1 0 0 244 2 6 58 0 3 28 26 2 1 64 43 78 1103 1591 290 3 79 274 22 6 1 136 39 32 2 5 0 1 238 857 295 8 31 69 2 970 368 11 17 195 0 780 2 13 1 58 924 93 87 61 0 3087 4 267 407 41 43 990 51 19 1 64 32 50 122 99 14 103 108 259 42 24 73 72 4 155 0 1507 20 6 3 260 278 1 1 1 0 403 23 58 13 944 70 469 636 10 1 0 58 62 182 6 129 0 229 405 2 0 234 14 625 49 24 49 74 4 315 3 1 2 1 88 9 185 111 175 589 440 165 72 1480 189 28 21 90 7 88 368 4 75 379 697 0 426 115 0 461 100 39 141 2 155 3 62 142 4 15 0 241 113 227 175 10 446 1077 231 648 717 300 1051 164 1767 76 460 517 6 479 0 315 314 213 79 47 74 115 100 13 335 16 37 2 49 45 4 439 516 605 0 0 13 0 3 60 0 0 114 14 2 0 704 33 155 222 0 565 233 6 83 633 18 4 9 107 13 183 173 19 83 183 683 44 107 26 140 0 519 9 35 473 33 54 18 27 10 1037 409 8 172 139 0 23 41 75 204 4 81 126 3 111 8 1 226 129 6 45 22 142 14 33 127 1 75 301 622 11 36 404 14 47 209 224 240 427 13 272 18 294 0 18 140 4 66 1 9 93 0 9 11 4 783 17 7 39 160 201 0 24 23 0 2 303 20 0 2 2 11 68 60 38 15 171 24 0 143 8 30 1 86 18 1 247 317 0 3 33 82 2 3 119 1 216 63 10 234 99 34 27 4 73 183 1 64 88 187 393 390 6 37 883 24 15 4 90 6 48 12 25 10 13 41 66 93 241 114 375 86 83 236 11 69 108 522 3 213 52 25 13 26 87 122 85 667 74 85 519 64 48 2 201 36 15 11 7 2 183 76 7 2 70 101 136 7 54 63 558 29 338 32 5 27 56 1 141 191 64 476 55 3 90 1565 182 9 91 95 57 2 98 42 21 22 64 1 306 51 318 89 14 149 542 7 254 818 1 401 16 103 0 163 267 41 14 77 11 25 13 16 54 102 38 1 137 44 138 12 32 120 6 477 88 73 48 171 28 28 223 10 35 34 26 16 37 36 97 60 28 111 114 40 50 1 136 30 4 0 34 39 8 38 105 14 132 175 1312 17 38 3 131 66 334 57 217 92 47 3 14 76 266 127 6 49 3 59 1200 106 69 361 99 199 0 1 350 109 93 250 168 216 179 213 10 1 45 17 482 32 13 312 41 158 171 233 1 117 285 208 5 416 51 70 3 1 904 10 156 12 330 5 95 8 20 2 109 25 795 265 1 0 101 236 435 105 9 8 14 49 55 100 92 253 243 189 10 3 163 112 264 841 118 3 61 13 53 434 72 6 35 67 16 22 57 141 127 58 270 7 275 366 219 96 183 0 407 229 26 1 51 13 126 3 12 22 4 63 377 365 211 92 396 176 275 118 130 204 644 130 99 52 22 7 50 13 80 20 169 17 16 183 73 9 131 31 46 231 2 27 137 101 297 3 13 8 743 716 0 1625 70 3407 31 13 149 606 6 563 266 130 49 82 214 116 311 34 984 53 94 1221 474 74 70 142 28 1231 259 15 35 276 169 2 83 56 13 1 122 14 0 233 45 0 371 167 1004 288 87 51 31 79 121 7 1 4 11 266 27 72 278 8 57 52 266 219 437 85 53 1340 200 0 4 88 8 2 34 34 53 192 91 214 127 146 108 165 3 62 124 31 498 132 83 100 0 605 10 124 29 29 219 6 125 221 9 113 259 67 748 353 13 150 26 26 74 9 29 21 8 40 29 14 59 109 6 21 30 123 2 35 96 705 90 176 33 6 29 22 3 24 1 2 168 342 317 171 270 50 83 34 73 257 4 239 304 76 1288 448 63 25 27 6 21 19 17 49 135 921 2 87 424 21 571 170 34 71 78 380 238 108 80 52 4 88 32 1 75 40 4 396 59 227 53 77 3 69 453 40 50 134 331 132 372 67 3 418 120 2 9 6 0 118 26 65 1 332 114 295 0 18 6 26 69 13 20 22 23 37 57 382 268 0 28 24 290 638 75 165 343 0 60 207 36 114 84 408 183 253 135 2 13 140 58 428 2 789 14 58 53 23 5101 25 27 292 360 71 89 55 32 22 0 0 98 84 88 192 446 5 195 101 3 339 13 104 8 68 35 0 75 98 22 49 217 85 12 789 330 1 85 329 9 53 370 38 26 127 383 0 1 135 101 2 131 113 110 151 33 10 4 138 3 1 175 5 2 43 33 693 50 351 26 16 13 SPP134 Bacteria;Firmicutes;Clostridia;Negativicutes;Veillonellaceae;Veillonella;multispecies_spp134_2 0 0 0 0 16 68 0 0 0 110 0 13 0 0 8 1 0 15 41 88 0 32 50 18 32 20 0 0 0 0 1 349 0 111 27 2 44 9 19 7 10 167 0 226 73 4 0 2 32 0 27 27 29 190 73 0 77 31 0 0 2 0 29 13 2 0 9 2 0 1 47 0 1 0 17 3 0 11 0 0 0 0 9 21 3 0 0 21 13 1 0 77 1 26 2 0 0 0 0 11 92 0 0 0 1 0 15 0 2 0 313 0 7 0 1 29 1 358 16 0 0 2 24 0 1 42 88 71 2 9 340 0 0 57 218 0 0 0 2 7 12 0 0 0 0 2 7 1 18 0 31 0 25 17 1 1 6 0 17 4 2 0 0 0 0 4 2 0 0 0 0 12 0 69 9 3 0 0 0 47 167 0 289 3 70 10 1 0 0 67 174 0 3 43 34 61 440 521 13 0 0 0 56 2 2 36 0 1 7 0 1 0 0 2 0 1 15 0 1 121 13 100 18 0 291 47 7 11 20 9 0 0 0 0 0 6 2 0 1 0 0 2 424 0 0 0 2 0 1 21 1 0 0 2 0 0 0 0 0 12 0 1 0 25 1 33 0 254 0 0 0 0 0 0 0 0 0 0 0 0 0 0 0 0 0 0 0 0 0 0 0 0 0 0 0 0 0 0 0 0 0 0 0 0 0 0 0 0 0 0 0 0 0 0 0 0 0 0 0 0 0 0 0 0 0 0 0 0 0 0 0 0 0 0 0 0 0 0 0 0 0 0 0 0 0 0 0 0 0 0 0 0 0 0 0 0 0 0 0 0 0 0 0 0 0 0 0 0 0 0 0 0 0 0 0 0 0 0 0 0 0 0 0 0 0 0 0 0 0 0 0 0 0 0 0 0 0 0 0 0 0 0 0 0 0 0 0 0 0 0 0 0 0 0 0 0 0 0 0 0 0 0 0 0 0 0 0 0 0 0 0 0 0 0 0 0 0 0 0 0 0 0 0 0 0 0 0 0 0 0 0 0 0 0 0 0 0 0 0 0 0 0 0 0 0 0 0 0 0 0 0 0 0 0 0 0 0 0 0 0 0 0 0 0 0 0 0 0 0 0 0 0 0 0 0 0 0 0 0 0 0 0 0 0 0 0 0 0 0 0 0 0 0 0 0 0 0 0 0 0 0 0 0 0 0 0 0 0 0 0 0 0 0 0 0 0 0 0 0 0 0 0 0 0 0 0 0 0 0 0 0 0 0 0 0 0 0 0 0 0 0 0 0 0 0 0 0 0 0 0 0 0 0 0 0 0 0 0 0 0 0 0 0 0 0 0 0 0 0 0 0 0 0 0 0 0 0 0 0 0 0 0 0 0 0 0 0 0 0 0 0 0 0 0 0 0 0 0 0 0 0 0 0 0 0 0 0 0 0 0 0 0 0 0 0 0 0 0 0 0 0 0 0 0 0 0 0 0 0 0 0 0 0 0 0 0 0 0 0 0 0 0 0 0 0 0 0 0 0 0 0 0 0 0 0 0 0 0 0 0 0 0 0 0 0 0 0 0 0 0 0 0 0 0 0 0 0 0 0 0 0 0 0 0 0 0 0 0 0 0 0 0 0 0 0 0 0 0 0 0 0 0 0 0 0 0 0 0 0 0 0 0 0 0 0 0 0 0 0 0 0 0 0 0 0 0 0 0 0 0 0 0 0 0 0 0 0 0 0 0 0 0 0 0 0 0 0 0 0 0 0 0 0 0 0 0 0 0 0 0 0 0 0 0 0 0 0 0 0 0 0 0 0 0 0 0 0 0 0 0 0 0 0 0 0 0 0 0 0 0 0 0 0 0 0 0 0 0 0 0 0 0 0 0 0 0 0 0 0 0 0 0 0 0 0 0 0 0 0 0 0 0 0 0 0 0 0 0 0 0 0 0 0 0 0 0 0 0 0 0 0 0 0 0 0 0 0 0 0 0 0 0 0 0 0 0 0 0 0 0 0 0 0 0 0 0 0 0 0 0 0 0 0 0 0 0 0 0 0 0 0 0 0 0 0 0 0 0 0 0 0 0 0 0 0 0 0 0 0 0 0 0 0 0 0 0 0 0 0 0 0 0 0 0 0 0 0 0 0 0 0 0 0 0 0 0 0 0 0 0 0 0 0 0 0 0 0 0 0 0 0 0 0 0 0 0 0 0 0 0 0 0 0 0 0 0 0 0 0 0 0 0 0 0 0 0 0 0 0 0 0 0 0 0 0 0 0 0 0 0 0 0 0 0 0 0 0 0 0 0 0 0 0 0 0 0 0 0 0 0 0 0 0 0 0 0 0 0 0 0 0 0 0 0 0 0 0 0 0 0 0 0 0 0 0 0 0 0 0 0 0 0 0 0 0 0 0 0 0 0 0 0 0 0 0 0 0 0 0 0 0 0 0 0 0 0 0 0 0 0 0 0 0 0 0 0 0 0 0 0 0 0 0 0 0 0 0 0 0 0 0 0 0 0 0 0 0 0 0 0 0 0 0 0 0 0 0 0 0 0 0 0 0 0 0 0 0 0 0 0 0 0 0 0 0 0 0 0 0 0 0 0 0 0 0 0 0 0 0 0 0 0 0 0 0 0 0 0 0 0 0 0 0 0 0 0 0 0 0 0 0 0 0 0 0 0 0 0 0 0 0 0 0 0 0 0 0 0 0 0 0 0 0 0 0 0 0 0 0 0 0 0 0 0 0 0 0 0 0 0 0 0 0 0 0 0 0 0 0 0 0 0 0 0 0 0 0 0 0 0 0 0 0 0 0 0 0 0 0 0 0 0 0 0 0 0 0 0 0 0 0 0 0 0 0 0 0 0 0 0 0 0 0 0 0 0 0 0 0 0 0 0 0 0 0 0 0 0 0 0 0 0 0 0 0 0 0 0 0 0 0 0 0 0 0 0 0 0 0 0 0 0 0 0 0 0 0 0 0 0 0 0 0 0 0 0 0 0 0 0 0 0 0 0 0 0 0 0 0 0 0 0 0 0 0 0 0 0 0 0 0 0 0 0 0 0 0 0 0 0 0 0 0 0 0 0 0 0 0 0 0 0 0 0 0 0 0 0 0 0 0 0 0 0 0 0 0 0 0 0 0 0 0 0 0 0 0 0 0 0 0 0 0 0 0 0 0 0 0 0 0 0 0 0 0 0 0 0 0 0 0 0 0 0 0 0 0 0 0 0 0 0 0 0 0 0 0 0 0 0 0 0 0 0 0 0 0 0 0 0 0 0 0 0 0 0 0 0 0 0 0 0 0 0 0 0 0 0 0 0 0 0 0 0 0 0 0 0 0 0 0 0 0 0 0 0 0 0 0 0 0 0 0 0 0 0 0 0 0 0 0 0 0 0 0 0 0 0 0 0 0 0 0 0 0 0 0 0 0 0 0 0 0 0 0 0 0 0 0 0 0 0 0 0 0 0 0 0 0 0 0 0 0 0 0 0 0 0 0 0 0 0 0 0 0 0 0 0 0 0 0 0 0 0 0 0 0 0 0 0 0 0 0 0 0 0 0 0 0 0 0 0 0 0 0 0 0 0 0 0 0 0 0 0 0 0 0 0 0 0 0 0 0 0 0 0 0 0 0 0 0 0 0 0 0 0 0 0 0 0 0 0 0 0 0 0 0 0 0 0 0 0 0 0 0 0 0 0 0 0 0 0 0 0 0 0 0 0 0 0 0 0 0 0 0 0 0 0 0 0 0 0 0 0 0 0 0 0 0 0 0 0 0 0 0 0 0 0 0 0 0 0 0 0 0 0 0 0 0 0 0 0 0 0 0 0 0 0 0 0 0 0 0 0 0 0 0 0 0 0 0 0 0 0 0 0 0 0 0 0 0 0 0 0 0 0 0 0 0 0 0 0 0 0 0 0 0 0 0 0 0 0 0 0 0 0 0 0 0 0 0 0 0 0 0 0 0 0 0 0 0 0 0 0 0 0 0 0 0 0 0 0 0 0 0 0 0 0 0 0 0 0 0 0 0 0 0 0 0 0 0 0 0 0 0 0 0 0 0 0 0 0 0 0 0 0 0 0 0 0 0 0 0 0 0 0 0 0 0 0 0 0 0 0 0 0 0 0 0 0 0 0 0 0 SPP141 Bacteria;Proteobacteria;Gammaproteobacteria;Pasteurellales;Pasteurellaceae;Aggregatibacter;multispecies_spp141_2 0 0 0 0 0 0 0 0 0 0 0 0 0 0 0 0 0 0 0 0 0 0 0 0 0 0 0 0 0 0 0 0 0 0 0 0 0 0 0 0 0 0 0 0 0 0 0 0 0 0 0 0 0 0 0 0 0 0 0 0 0 0 0 0 0 0 0 0 0 0 0 0 0 0 0 0 0 0 0 0 0 0 0 0 0 0 0 0 0 0 0 0 0 0 0 0 0 0 0 0 0 0 0 0 0 0 0 0 0 0 0 0 0 0 0 0 0 0 0 0 0 0 0 0 0 0 0 0 0 0 0 0 0 0 0 0 0 0 0 0 0 0 0 0 0 0 0 0 0 0 0 0 0 0 0 0 0 0 0 0 0 0 0 0 0 0 0 0 0 0 0 0 0 0 0 0 0 0 0 0 0 0 0 0 0 0 0 0 0 0 0 0 0 0 0 0 0 0 0 0 0 0 0 0 0 0 0 0 0 0 0 0 0 0 0 0 0 0 0 0 0 0 0 0 0 0 0 0 0 0 0 0 0 0 0 0 0 0 0 0 0 0 0 0 0 0 0 0 0 0 0 0 0 0 0 0 0 0 0 0 0 0 0 0 0 0 0 0 0 41 3 0 110 0 62 0 51 39 0 4 16 15 0 0 0 0 0 0 0 45 6 0 50 1 21 2 0 1 0 198 21 168 102 0 0 0 1 0 464 1 122 1 0 0 0 36 0 0 0 0 11 9 1 0 152 0 0 0 7 0 0 49 271 0 0 0 0 0 0 0 1 0 0 11 0 1 4 0 0 0 1 100 0 0 0 4 0 6 0 0 0 0 0 0 3 0 0 0 265 0 16 0 0 169 228 0 0 0 0 0 0 0 217 0 0 0 2 6 0 0 0 0 0 201 3 0 49 0 146 661 4 0 0 0 0 0 0 8 6 0 74 73 0 0 1 0 3 0 0 0 75 3 0 0 0 0 0 0 73 0 0 191 5 78 0 61 0 0 0 1 3 0 0 4 0 0 0 0 230 252 1 0 164 0 0 5 0 0 0 37 57 173 0 0 0 1 1 55 3 2 26 43 1 0 1 0 68 1 0 28 1 0 0 0 738 162 224 496 69 432 4 0 0 447 487 0 0 1 0 207 242 1 0 0 12 0 0 10 0 0 0 0 0 0 1 0 0 0 0 0 4 9 2 3 0 5 0 208 0 7 0 64 0 2 8 0 171 1 0 2 0 0 7 8 6 71 30 0 31 1 8 0 0 0 2 0 7 13 0 24 0 57 149 30 0 24 0 0 0 35 0 0 4 0 0 3 14 345 3 0 1 20 77 0 0 16 4 1 84 0 1 0 0 21 0 29 0 23 0 0 0 0 0 11 132 0 0 0 10 160 97 23 130 263 0 18 92 0 0 0 0 5 15 0 87 48 3 0 5 21 0 0 30 57 67 139 1 0 2 9 2 0 0 41 0 0 0 31 0 0 0 4 1 250 0 0 0 0 3 0 0 0 10 2 11 0 0 0 10 8 0 0 0 338 0 10 204 0 1 0 0 36 74 26 0 86 28 1 30 3 10 0 4 74 62 0 0 0 0 2 10 1 0 0 0 0 0 0 0 0 0 0 34 3 0 0 0 0 6 0 0 15 0 2412 0 0 51 247 0 3 1 0 0 13 55 0 54 29 31 45 5 11 506 0 25 0 0 75 57 291 85 60 263 0 0 0 477 71 0 177 800 11 0 1 0 0 21 6 0 13 85 2307 34 8 0 0 45 0 114 63 3 247 0 0 0 0 0 0 32 58 15 1352 0 11 0 344 85 0 0 4 8 0 0 0 0 214 128 0 6 0 54 0 0 2 14 100 0 0 1 27 0 0 0 0 0 0 0 12 47 0 0 26 14 0 1 4 0 7 1 6 22 7 122 0 0 0 0 0 0 0 1 1263 25 0 7 7 4 0 1 0 0 7 0 0 15 122 1 204 53 1109 0 47 0 15 7 0 2 1 600 0 0 7 0 12 14 0 6 0 638 0 12 0 0 0 1 0 0 0 0 0 0 0 0 0 0 0 2 0 1 0 0 0 0 0 355 39 0 0 41 0 5 0 0 563 0 0 0 136 14 0 398 0 0 14 0 0 39 1 0 0 249 0 61 0 0 14 25 1114 0 0 0 0 125 593 0 64 152 0 1 0 0 0 0 92 0 6 0 187 43 0 0 1 0 0 0 0 15 2 0 0 0 0 0 1 0 0 0 4 0 58 14 0 3 139 21 47 143 7 0 1 0 51 334 0 0 6 0 0 0 0 0 105 0 57 0 0 0 0 0 0 0 0 26 0 201 0 3 6 0 0 136 5 12 118 0 0 6 3 0 0 845 6 1 1 2 0 96 1 0 0 7 0 0 0 0 0 117 124 0 3 215 0 0 0 1 1 0 5 18 0 8 5 0 0 4 4 4 0 348 1 0 46 0 0 2 22 41 0 5 1 0 0 0 3 0 1 1 0 0 0 0 0 1 12 0 3 9 0 1 35 151 1 0 0 0 1 0 0 41 0 0 0 0 0 302 0 0 1 0 40 2 0 50 161 22 0 0 11 0 2 0 0 0 0 273 0 0 39 92 0 105 14 0 41 4 0 0 87 138 0 2 0 16 0 0 0 18 38 4 134 0 0 476 0 87 0 0 0 0 0 0 472 10 0 179 17 0 0 0 0 0 0 79 557 1 0 54 78 0 11 4 0 1 0 6 7 0 92 1 0 150 105 0 107 29 30 0 3 218 3 1 52 102 0 0 0 0 0 1 0 0 27 14 0 2 0 0 1 0 1 0 20 7 0 52 0 1 215 4 0 0 4 1 78 147 1 699 10 0 115 90 0 0 23 7 0 702 142 2 47 30 0 13 64 20 0 1 7 0 336 15 0 9 3 0 0 96 20 0 0 426 16 0 95 0 3 119 0 0 0 18 5 0 97 7 27 59 4 2 253 1008 6 0 6 5 0 3 1 8 0 2 0 0 1 0 1 1 1 0 0 7 0 25 0 0 122 117 0 26 1 9 0 9 8 7 39 98 0 0 2 3 24 14 328 2 0 17 21 0 154 54 2 36 0 0 3 0 4 14 1 133 138 4 0 123 58 0 1 14 61 2 6 0 7 0 13 0 0 39 4 0 4 1 0 0 0 0 128 159 0 43 5 0 2 4 0 0 0 0 4 0 1 0 0 15 2 0 7 17 17 0 0 0 10 0 0 0 11 3 1 157 1 0 0 35 65 0 771 0 0 0 0 0 0 1 1 0 0 58 2 2 0 0 0 27 0 2 10 3 0 0 0 232 0 0 110 22 1 17 136 0 2 0 1 0 25 6 2 0 4 0 0 34 5 0 18 0 0 0 6 0 0 0 11 0 2 189 2 161 45 1 79 17 18 2 142 31 2 4 9 93 56 0 0 0 20 36 0 0 0 1 0 0 0 0 0 0 0 0 10 1 0 0 0 0 8 0 0 87 0 146 63 396 6 38 2 0 0 20 11 0 30 78 570 0 52 223 0 17 4 1 915 0 0 53 60 0 0 368 0 0 102 0 26 144 0 0 0 48 0 0 2 0 20 3 0 5 287 0 0 103 1 0 1 1 2 0 1 0 0 56 226 0 25 2 0 0 37 24 1 47 25 0 197 1 5 0 0 122 0 76 89 0 192 101 2 0 19 64 0 0 4 0 0 186 56 0 434 1115 0 0 0 1 0 252 38 0 71 105 0 0 13 0 0 55 16 0 0 4 0 68 4 15 1 2 4 0 145 1 0 0 26 0 10 0 0 0 6 12 0 26 24 3 504 0 0 0 1 35 101 13 49 141 10 1 81 5 5 0 4 29 2 0 3 17 1 26 9 0 0 14 1 2 87 18 7 7 1 2 0 198 19 0 265 8 0 1 0 22 0 0 2 133 0 2 49 1165 0 6 14 1 36 5 18 0 0 0 0 0 3 0 0 1 0 12 9 0 1 33 3 0 0 0 5 2 1 0 4 0 0 5 0 14 2 38 0 193 11 0 5 311 20 3 6 311 0 0 690 0 0 0 0 0 7 285 0 21 95 0 0 0 10 0 0 8 3 1 0 0 0 0 10 0 0 0 0 556 0 0 342 88 0 26 0 SPP142 Bacteria;Proteobacteria;Gammaproteobacteria;Pasteurellales;Pasteurellaceae;multigenus;multispecies_spp142_3 0 0 0 0 0 0 0 0 0 0 0 0 0 0 0 0 0 0 0 0 0 0 0 0 0 0 0 0 0 0 0 0 0 0 0 0 0 0 0 0 0 0 0 0 0 0 0 0 0 0 0 0 0 0 0 0 0 0 0 0 0 0 0 0 0 0 0 0 0 0 0 0 0 0 0 0 0 0 0 0 0 0 0 0 0 0 0 0 0 0 0 0 0 0 0 0 0 0 0 0 0 0 0 0 0 0 0 0 0 0 0 0 0 0 0 0 0 0 0 0 0 0 0 0 0 0 0 0 0 0 0 0 0 0 0 0 0 0 0 0 0 0 0 0 0 0 0 0 0 0 0 0 0 0 0 0 0 0 0 0 0 0 0 0 0 0 0 0 0 0 0 0 0 0 0 0 0 0 0 0 0 0 0 0 0 0 0 0 0 0 0 0 0 0 0 0 0 0 0 0 0 0 0 0 0 0 0 0 0 0 0 0 0 0 0 0 0 0 0 0 0 0 0 0 0 0 0 0 0 0 0 0 0 0 0 0 0 0 0 0 0 0 0 0 0 0 0 0 0 0 0 0 0 0 0 0 0 0 0 0 0 0 0 0 0 0 0 0 0 28 21 0 0 0 0 0 22 9 0 563 16 8 0 0 1 0 0 0 0 18 43 0 1 0 29 141 82 0 0 50 11 0 8 5 0 0 0 0 82 0 0 6 0 0 0 0 0 16 0 0 0 3 0 0 0 0 0 0 0 0 3 2 43 0 0 0 0 0 0 0 0 10 0 204 23 33 0 0 0 0 166 51 0 149 0 0 0 1 0 0 0 3 0 15 2 0 0 0 12 0 0 1 0 1 76 0 0 0 0 5 0 0 2 18 0 2 0 0 0 0 0 0 0 3 88 2 0 0 0 0 0 0 0 0 0 0 0 0 0 0 0 0 0 351 14 0 22 0 4 0 0 0 0 0 0 0 1 0 0 0 0 29 5 367 0 0 1 0 0 0 0 2 0 0 0 0 0 0 41 6 0 0 0 0 0 0 2 0 0 24 13 0 0 0 0 0 0 0 15 0 2 7 0 0 0 0 0 19 0 1 11 0 0 0 2 3 80 30 35 0 0 0 0 155 344 0 0 0 0 60 177 408 0 0 34 0 0 0 0 0 0 0 0 12 2 0 0 0 0 0 0 0 0 2 0 0 0 0 0 0 0 180 101 72 0 0 61 50 4 0 0 0 21 0 36 0 6 0 0 0 3 4 0 2 830 0 0 0 0 16 0 0 59 94 0 2 0 0 0 0 0 0 5 1 0 8 59 0 0 0 0 0 1 0 0 202 25 1 0 1 0 0 0 8 0 0 0 0 0 0 0 18 0 1 0 0 0 6 2 0 0 0 9 69 0 0 0 0 8 45 0 0 2 0 0 0 98 0 0 0 0 0 0 0 119 15 9 0 0 0 0 2 79 13 15 0 0 13 0 0 0 29 0 0 0 0 0 0 18 0 0 0 0 2 0 0 0 0 13 2 0 0 0 25 0 7 10 1 1 0 0 0 29 0 0 0 0 0 11 15 10 0 0 0 0 11 0 0 0 1 0 356 0 0 0 0 0 0 0 2 1 0 0 0 0 0 0 0 20 1 0 0 5 2 0 0 0 1 1 0 17 0 0 12 1 0 193 0 0 2 0 0 90 0 10 0 0 137 4 136 37 116 41 0 69 55 1 153 0 7 0 296 0 346 38 0 42 0 0 0 6 3 0 6 0 0 29 0 0 0 0 0 0 0 0 0 1 6 117 243 0 2 0 219 0 0 0 0 0 0 0 0 0 0 0 103 96 0 2 5 27 0 0 0 22 315 0 0 0 55 0 0 0 43 0 0 0 0 1 0 0 0 0 0 15 0 0 4 0 0 0 0 0 0 0 0 0 3 0 0 0 7 28 0 394 0 26 71 5 0 0 0 0 0 0 6 0 1 0 0 0 8 3 0 0 0 0 0 1 0 0 0 0 0 4 0 0 0 0 0 0 0 0 0 0 0 0 0 15 0 0 0 0 0 0 0 0 1 14 0 70 1 0 0 0 1 0 0 0 0 1 0 0 0 0 0 0 26 19 0 10 0 0 0 0 0 16 0 0 0 0 0 41 17 0 20 2 0 110 0 5 0 0 5 0 5 0 0 0 0 0 55 0 0 0 17 0 18 5 0 0 148 0 0 62 0 0 0 0 0 3 134 0 0 1 0 0 0 0 0 0 0 0 0 0 0 0 1 0 0 0 0 0 0 0 0 0 0 0 1 0 0 0 0 0 0 0 0 0 0 0 0 12 0 0 0 0 0 0 0 50 7 0 10 6 0 0 7 0 0 50 24 0 0 0 0 0 91 0 0 0 6 0 3 0 0 10 2 0 0 77 107 0 0 0 0 0 0 22 0 285 1 0 0 0 11 0 0 0 0 1 0 0 0 27 20 0 0 0 0 3 0 11 0 0 0 9 0 0 0 0 0 0 25 0 8 0 0 0 0 1 0 0 0 0 7 4 0 22 0 0 0 9 0 1 0 61 3 0 124 27 0 0 0 0 0 16 54 0 0 0 0 0 0 46 0 0 21 130 0 24 23 0 0 111 0 12 0 24 0 0 0 64 0 7 0 0 0 0 0 0 0 1 0 42 0 0 1 0 0 0 2 6 0 14 104 0 0 0 4 0 0 56 0 0 0 0 0 0 0 0 0 0 0 0 5 0 74 1 0 82 0 0 0 0 0 0 7 51 0 0 5 0 0 0 0 0 4 0 0 2 5 1 0 0 28 0 0 0 0 0 4 34 0 0 0 0 196 66 0 0 93 0 36 64 0 0 0 0 8 90 0 0 5 1 0 178 30 1 38 7 0 98 28 0 0 332 338 0 1 43 0 1 26 0 0 101 8 0 0 0 105 0 17 0 0 1 44 0 0 16 0 0 0 0 0 65 27 0 2 0 14 0 3 1 0 29 0 11 0 61 0 0 32 0 41 1 0 0 15 0 0 13 67 0 1 0 0 159 1 0 0 0 225 0 40 0 0 0 6 16 1 1 0 1 0 94 0 0 151 26 0 4 0 59 37 0 0 100 0 0 0 0 0 71 0 0 11 1 0 11 57 0 30 186 110 0 0 13 0 0 0 0 0 0 10 0 0 113 0 8 0 0 22 0 0 3 5 0 0 0 2 1 1 0 0 0 1 2 7 0 0 0 54 14 0 0 0 17 0 17 4 0 3 3 0 0 1 0 0 0 2 0 0 0 0 0 1 13 0 0 0 0 0 0 0 0 0 54 0 0 0 1 0 0 20 20 0 1 0 0 26 0 0 0 10 8 0 0 0 0 4 14 0 0 0 0 0 0 2 0 0 0 61 0 10 7 187 0 0 0 11 0 23 0 1 42 3 8 1 54 0 4 3 0 1 15 0 41 2 0 0 0 4 0 9 10 0 0 0 0 0 0 1 0 1 1 0 8 0 96 3 46 0 6 0 0 0 110 8 0 0 0 218 0 2 0 0 31 1 0 0 0 0 14 19 0 0 0 0 0 35 0 145 59 0 0 0 0 0 0 0 0 8 0 0 0 0 0 0 42 34 0 18 1 0 33 0 0 0 0 0 0 0 141 9 0 104 0 0 2 9 0 0 0 10 0 0 21 0 0 0 0 0 33 0 0 9 14 0 0 89 0 0 24 20 4 2 1 0 0 0 69 0 1 0 0 1 5 0 0 5 0 0 85 152 0 65 4 0 49 0 0 0 58 49 0 236 0 0 0 14 0 0 0 0 0 0 3 0 0 0 0 0 0 0 33 27 1 0 1 0 10 3 0 4 1 2 3 0 65 2 2 282 393 0 0 0 0 0 1 0 1 40 0 10 63 10 0 35 0 1 0 0 0 0 0 0 1 0 0 0 0 0 0 0 125 0 2 0 0 12 25 0 0 0 0 0 0 0 0 6 10 0 0 0 0 83 0 125 5 0 0 0 9 0 0 0 2 0 0 0 0 0 0 0 0 0 0 0 0 0 10 1 0 0 0 0 0 27 0 0 0 0 3 0 0 103 0 0 0 5 0 0 0 0 31 0 0 0 0 0 0 0 0 0 15 0 0 31 99 0 0 0 SPP147 Bacteria;Proteobacteria;Betaproteobacteria;Neisseriales;Neisseriaceae;multigenus;multispecies_spp147_5 0 0 0 0 0 0 0 0 0 0 0 0 0 0 0 0 0 0 0 0 0 0 0 0 0 0 0 0 0 0 0 0 0 0 0 0 0 0 0 0 0 0 0 0 0 0 0 0 0 0 0 0 0 0 0 0 0 0 0 0 0 0 0 0 0 0 0 0 0 0 0 0 0 0 0 0 0 0 0 0 0 0 0 0 0 0 0 0 0 0 0 0 0 0 0 0 0 0 0 0 0 0 0 0 0 0 0 0 0 0 0 0 0 0 0 0 0 0 0 0 0 0 0 0 0 0 0 0 0 0 0 0 0 0 0 0 0 0 0 0 0 0 0 0 0 0 0 0 0 0 0 0 0 0 0 0 0 0 0 0 0 0 0 0 0 0 0 0 0 0 0 0 0 0 0 0 0 0 0 0 0 0 0 0 0 0 0 0 0 0 0 0 0 0 0 0 0 0 0 0 0 0 0 0 0 0 0 0 0 0 0 0 0 0 0 0 0 0 0 0 0 0 0 0 0 0 0 0 0 0 0 0 0 0 0 0 0 0 0 0 0 0 0 0 0 0 0 0 0 0 0 0 0 0 0 0 0 0 0 0 0 0 0 0 0 0 0 0 3174 1806 491 1 265 51 2326 1 306 976 331 5688 1565 1248 659 65 5242 2217 101 3966 978 2889 1426 2585 6845 29 2149 247 1845 1010 6 848 3976 789 380 359 1042 760 420 673 1424 11712 375 1455 720 4193 1292 1166 450 1911 837 645 5634 2496 2403 2 1417 207 6 2 1453 7 243 2368 5799 4360 104 14 114 174 2214 1156 1839 297 2 3644 399 941 2140 1093 1995 825 690 4962 3347 3701 135 814 5380 1431 1962 15 7321 5858 7512 598 2195 1290 6041 3465 1618 1 626 3383 178 1273 1640 2013 417 10104 2488 2687 3992 0 1692 3739 2001 2609 1877 2573 1 3571 1650 1219 1 1257 400 298 707 5523 5434 1738 156 2979 1381 1678 968 617 15 2777 2167 4556 5234 857 5210 104 851 1951 3119 1 557 3701 2664 1148 1590 154 1 255 1058 8220 1923 6832 1921 1826 7588 1484 5487 2824 2161 6914 594 111 205 2871 2670 887 694 494 25 39 1126 2226 310 665 573 9279 3 4050 3151 1050 11975 775 588 1248 195 3066 1078 6119 97 1010 1245 473 3370 1242 6293 15 1820 4228 2199 2566 1322 1960 2121 4911 342 556 681 504 448 494 1600 1160 920 4500 72 591 1046 8333 393 1256 0 1563 1360 6778 11 955 2769 3749 3547 763 216 12 275 781 2756 1776 242 6914 199 1814 43 1378 828 3097 2980 3598 1008 628 3800 568 3347 1441 7359 1285 431 1726 1145 1 829 516 1844 2012 231 2050 51 3249 283 1324 1419 810 6594 905 1211 228 4946 5458 1832 1869 143 197 5 1207 1243 1009 3273 808 484 86 36 4580 2709 3486 390 12 1670 6453 2065 6922 961 5176 145 8 4693 2263 3490 2094 3020 1573 2619 189 3949 79 114 4921 773 649 8276 1617 7080 1999 4 14776 1 231 9558 434 2566 681 5290 3330 3054 4342 2849 5241 3250 2798 6057 2567 965 3461 3847 3703 3827 1972 1541 1594 3186 859 1208 7792 2946 2039 157 2963 758 289 199 822 2193 5046 462 630 1887 2534 632 491 3690 7330 1 253 8 472 2083 1267 1582 1242 2266 248 780 4456 5405 119 1404 589 106 22 2394 1403 429 4 2546 6545 5443 1398 14393 1001 3685 3442 1920 1080 1705 85 28 2022 200 3913 4224 1033 134 1105 949 815 3412 4 8675 1535 2060 535 309 10136 1 1709 251 669 694 1332 3877 3869 2510 2147 802 1925 522 4217 481 435 49 2754 3115 5818 358 260 3040 1484 474 99 277 66 532 1935 2179 4255 322 938 1580 617 5548 438 690 1409 356 1903 459 135 1038 747 5418 10692 1681 4624 2030 7350 2903 8149 3568 11154 567 1297 1465 4026 8210 1049 2534 1126 4476 5282 4262 6145 276 3605 4839 602 1340 684 536 238 6456 6170 498 1651 2731 2096 368 673 10090 307 41 2090 794 256 2363 1898 557 1174 520 1216 6347 4523 1832 15 31 4743 2862 3407 10544 690 7250 1945 1361 2222 1038 690 2684 243 5265 3816 215 4181 6290 17 57 1559 1407 1015 238 2588 453 6272 1491 4324 7246 6434 138 42 8614 7 4427 3983 2266 3698 1879 3141 595 805 217 1069 3881 862 487 3677 517 783 937 3131 3867 5997 4328 4527 15 823 1792 6678 2241 3512 2074 321 469 315 2019 2593 2130 1415 1774 144 54 3157 230 95 1498 2422 1648 4100 1808 162 1195 5539 409 7445 179 5104 956 2183 2524 0 6 4 1353 140 416 6993 1108 5213 1599 93 375 2598 6412 1034 3050 1621 410 1874 1575 493 4 3124 1172 714 0 678 1226 3570 2916 1599 1353 312 1059 8 8757 3294 5015 2199 756 1974 262 115 760 1394 2124 3981 883 844 1798 2504 1065 1309 26 3899 2232 1710 1621 2684 1760 7037 3505 1177 7328 2652 708 698 1270 2201 1304 2084 9493 953 8271 183 2638 3060 3413 2984 546 1552 2649 1581 1009 1565 924 82 263 3697 824 3715 2701 2266 5363 254 1 518 169 2349 1898 2782 2 876 6708 386 1123 84 5 552 257 3517 233 417 1930 23 4 5266 89 2 10 3247 25180 6945 25 1568 12866 1 1746 195 344 37 4571 3027 1436 565 3387 1110 1631 109 515 2162 256 654 747 21 593 745 204 144 290 412 66 35 2107 1532 553 682 39 1434 950 1142 3 211 1864 8 654 442 0 246 476 1101 1004 0 610 42 0 179 414 0 536 2257 112 1073 454 1217 101 117 1712 0 63 104 819 123 719 1624 70 155 371 1049 67 293 926 416 7 36 106 74 6 1803 297 3 228 759 4 18 296 135 56 102 320 16 357 1409 138 1114 325 10 511 1501 420 104 318 418 1856 38 391 1782 15 466 362 22 4654 2184 574 2 320 1757 1 240 699 248 0 1919 1336 63 61 922 256 8 2594 55 992 248 598 25 133 471 479 402 248 130 1180 64 455 270 696 371 1222 259 19 1455 493 955 143 746 143 476 107 232 21 466 2567 293 555 860 232 200 59 583 830 48 1361 30 1284 859 469 2409 623 4139 1295 57 457 788 1116 193 69 1245 1376 975 540 2471 19 2648 1617 431 211 503 807 104 6 779 759 7 27 426 26 1475 109 196 689 1222 1039 268 168 1351 2 1641 213 798 93 300 302 1619 1444 31 53 1086 363 69 21 1694 5 509 583 200 653 933 161 603 661 403 425 282 597 4 1107 652 75 1278 816 48 1536 1771 764 791 632 1644 1 806 2227 49 436 616 69 0 54 855 22 11 1088 1909 13 879 747 1 1482 579 0 288 790 1630 39 460 515 54 1108 1907 58 744 559 491 75 703 98 119 854 195 419 75 705 94 2774 2682 8 347 2957 3450 49 928 700 21 1373 1385 973 860 2535 3 131 272 792 78 660 708 1548 916 536 6 61 885 210 425 476 2273 2782 64 452 248 57 1338 2404 291 4123 138 473 3982 670 543 296 1510 1232 2005 199 1061 1179 844 73 103 125 1179 21 90 7 1153 141 1395 22 76 207 2446 203 1059 1483 195 911 441 355 2516 1447 234 311 660 15 541 2426 0 289 52 57 163 310 1059 1066 14 128 636 201 119 67 109 676 1265 260 430 2165 22 1 354 1279 5092 132 24 167 140 230 550 130 552 5732 5 879 2864 122 151 694 1 3 18 263 39 1466 622 1 1112 2811 13 522 78 148 1413 138 208 396 688 0 352 1621 452 857 932 54 168 1042 12 81 1061 394 18 58 1054 184 845 477 20 23 169 413 78 81 285 1763 450 1292 883 256 1970 575 905 515 1888 7 720 220 290 355 112 331 70 132 1717 1409 1255 172 475 0 197 902 392 244 162 436 88 440 2241 140 826 2268 28 17 403 593 1469 780 1939 359 730 1120 2881 662 229 1067 426 843 120 118 67 3 96 1210 54 3 513 110 364 45 42 338 17 1117 458 477 2800 24 0 803 625 133 481 595 0 176 3585 1107 1412 532 1294 97 150 300 110 326 975 4 613 2055 9 483 1116 932 204 1040 730 2 2373 680 49 1533 2018 223 2 870 616 580 62 2984 1579 74 789 1745 794 549 216 114 574 773 157 93 2007 364 404 565 1242 263 871 1150 1040 329 385 1776 57 252 962 33 310 1037 834 62 380 1904 14 136 47 1262 156 2125 316 15 527 1364 26 1045 131 1540 703 2244 714 26 2684 494 41 4116 74 769 35 1136 369 690 878 566 37 423 1079 278 656 329 258 6 519 1209 158 1557 148 25 923 1260 60 1450 616 505 519 301 1212 615 287 1035 2890 590 1464 513 481 783 146 530 718 4219 781 1178 313 59 4 585 124 72 340 863 418 808 421 961 438 360 89 5 131 52 42 334 251 342 57 23 1176 595 2703 306 215 608 157 641 65 111 2110 4316 625 0 4 15 0 11 483 91 62 2303 7 801 263 2230 486 134 614 64 2 2 228 280 608 2346 153 122 1035 2069 53 769 765 485 207 1054 799 85 28 574 31 726 816 637 52 195 1578 59 1706 325 82 198 1077 521 19 143 464 5 20 175 1204 193 1320 791 352 741 3685 269 1487 2468 121 148 460 458 1 3602 1130 60 381 1827 151 455 180 SPP15 Bacteria;Proteobacteria;Betaproteobacteria;Neisseriales;Neisseriaceae;Neisseria;multispecies_spp15_4 0 0 0 0 0 0 0 0 0 0 0 0 0 0 0 0 0 0 0 0 0 0 0 0 0 0 0 0 0 0 0 0 0 0 0 0 0 0 0 0 0 0 0 0 0 0 0 0 0 0 0 0 0 0 0 0 0 0 0 0 0 0 0 0 0 0 0 0 0 0 0 0 0 0 0 0 0 0 0 0 0 0 0 0 0 0 0 0 0 0 0 0 0 0 0 0 0 0 0 0 0 0 0 0 0 0 0 0 0 0 0 0 0 0 0 0 0 0 0 0 0 0 0 0 0 0 0 0 0 0 0 0 0 0 0 0 0 0 0 0 0 0 0 0 0 0 0 0 0 0 0 0 0 0 0 0 0 0 0 0 0 0 0 0 0 0 0 0 0 0 0 0 0 0 0 0 0 0 0 0 0 0 0 0 0 0 0 0 0 0 0 0 0 0 0 0 0 0 0 0 0 0 0 0 0 0 0 0 0 0 0 0 0 0 0 0 0 0 0 0 0 0 0 0 0 0 0 0 0 0 0 0 0 0 0 0 0 0 0 0 0 0 0 0 0 0 0 0 0 0 0 0 0 0 0 0 0 0 0 0 0 0 0 0 0 0 0 0 4 54 27 548 292 0 12 197 239 594 558 98 320 120 11 3 149 512 3 48 14 44 57 17 14 1 32 20 14 9 0 250 60 106 112 49 36 27 12 22 493 67 250 16 6 9 63 26 24 48 7 13 33 11 92 2 196 5 12 0 3 0 2 332 29 850 75 29 9 10 3 8 6 6 0 9 10 12 43 27 26 9 44 190 106 38 6 41 12 20 46 12 23 207 72 800 6 23 24 277 151 0 3006 81 267 38 462 93 15 5 90 292 13 0 607 52 22 158 61 1 0 210 447 9 0 148 9 19 46 22 39 237 12 1 42 356 1 6 0 2279 176 6 36 102 9 0 18 40 62 1 19 1 937 109 30 7 11 974 19 30 52 10 495 480 50 71 13 1578 640 119 15 7 32 4 27 7 31 24 0 0 410 273 6 360 513 39 0 229 12 911 1 283 10 9 2079 34 34 525 0 107 12 24 463 24 71 4 82 30 216 30 14 397 127 142 6 18 327 434 234 267 40 610 28 40 5 124 15 971 5 11 297 463 441 31 214 7 500 48 34 67 4 0 15 5 31 149 42 23 4 14 7 11 115 437 41 25 8 14 11 724 29 1289 13 194 30 28 7 0 19 2 16 165 24 116 49 164 66 51 933 548 10 21 114 8 11 478 26 13 57 159 12 1680 37 71 19 209 20 68 6 7 19 272 19 0 53 59 14 10 972 18 11 0 166 24 23 8 14 25 51 262 28 9 5 4 246 6 41 703 38 31 1 22 0 4 74 97 8 186 51 6 747 1302 29 76 29 14 113 798 320 0 5 125 37 47 387 6 83 824 14 13 36 23 49 10 51 20 93 66 418 0 3 23 38 1994 105 1180 2068 29 1 69 52 37 180 23 48 19 46 3 469 50 35 0 36 3 65 78 721 65 11 1 42 32 25 872 7 2052 19 12 21 59 4 2 2 155 947 70 34 7 2 101 10 767 29 2018 16 152 43 4 11 6 2 227 192 34 7 23 2 225 32 9 7 4056 144 6 1401 950 30 157 24 3 3 0 19 10 4 11 0 27 291 157 15 36 53 7 14 191 13 3 31 74 61 122 45 148 1207 20 24 36 20 19 107 22 130 31 68 27 6 180 483 78 162 683 34 26 50 87 168 4 248 46 45 195 287 35 245 6 30 12 53 12 11 9 363 684 39 7 2 7 417 5 15 26 86 31 4 76 10 109 2225 0 0 11 21 24 159 22 54 175 123 33 512 2490 1509 20 52 27 21 70 18 2 6 427 44 93 7 24 2 20 11 433 138 459 37 26 23 0 27 21 19 1399 4 15 54 18 24 8 23 26 5 103 1180 6 32 292 11 10 593 54 27 189 34 1 5 6 78 42 131 135 61 144 2048 354 11 79 26 123 24 7 23 27 43 194 51 135 37 166 97 31 11 54 591 766 232 12 782 0 7 3 16 7 2466 23 185 5 19 44 285 4 824 168 1575 205 305 88 0 337 112 507 1 1059 55 15 7 7 15 2211 899 0 39 862 445 18 91 16 9 113 11 13 70 1566 56 9 189 5 135 31 1 18 13 11 14 20 16 78 31 200 5 18 141 26 8 46 66 76 42 1160 31 14 31 10 75 513 20 29 7 76 54 168 3 1 4 492 18 8 13 252 3 2 0 5 8 317 48 7 3 22 22 650 100 235 0 37 37 10 17 1902 9 4 1 9 87 9 6 576 11 28 173 54 31 1 16 35 4 23 21 2017 12 2 356 587 48 1737 1908 115 1637 713 127 531 76 1830 5 185 448 80 1955 8 388 257 465 165 15 210 289 1163 5613 6 154 0 401 614 2 282 365 132 321 215 449 403 328 228 474 2 75 850 2719 2072 125 132 296 5159 227 1 1521 22 510 995 186 310 460 3429 5 7 7 117 1960 577 3436 259 42 213 893 4125 189 83 62 391 2327 225 112 2145 2271 139 447 994 150 94 194 409 496 501 743 301 11 18 1852 4 450 188 17 136 123 1302 1364 3 1043 681 2053 3631 1131 70 566 1673 664 1692 85 4276 814 5015 2047 29 509 2861 198 101 611 438 575 2565 2038 166 972 10 1703 261 618 1288 228 31 360 1246 114 1142 3585 782 15 17 75 23 596 859 1 3685 459 656 425 962 199 749 1036 1861 12 29 32 1081 1064 234 126 489 1081 493 3757 403 625 4 29 28 358 131 1342 1018 148 580 379 543 1359 248 156 1071 549 271 243 1295 725 165 70 1264 268 10 578 622 3520 118 178 372 274 662 36 319 341 479 92 211 236 69 26 8 323 1 1419 124 135 2502 3898 502 3143 345 376 1120 2127 57 20 729 79 2421 875 99 113 124 618 204 545 454 184 75 69 238 149 170 257 103 240 801 437 4495 2103 233 18 9 1347 1337 2486 109 229 728 4 122 158 321 111 31 1 511 138 189 180 381 634 1571 2071 654 1219 601 557 433 750 1052 111 313 1391 125 1067 7914 653 420 284 602 1296 1695 549 518 170 1774 1366 6196 588 1358 71 39 406 2502 140 2348 1025 1377 155 99 1685 3000 5031 1537 3 3492 1160 1755 965 879 123 6793 802 2743 108 245 184 3067 128 744 106 616 3712 671 186 1085 81 706 3961 1280 195 736 3577 18 390 470 288 21 2179 1139 57 798 282 2018 15 344 40 343 91 1820 54 565 206 231 488 1018 932 363 173 200 420 35 660 152 1289 256 262 369 318 1202 34 38 585 57 193 1904 92 940 249 1368 364 1095 434 2755 291 931 17 38 779 842 1599 125 2707 1106 502 2387 42 1327 3435 17 1671 3 46 4232 329 85 738 6 361 3151 938 1754 603 911 376 300 1107 57 11 501 4 450 332 2538 428 760 2576 21 1541 3 1 2113 431 1376 153 314 1105 178 122 562 99 1671 83 166 2608 26 11 789 278 161 3672 316 447 3631 1231 2092 1849 3119 633 3556 872 596 110 2502 779 254 796 3560 2359 1320 329 527 196 74 2407 224 112 6 94 254 395 120 431 1 131 495 82 341 83 1948 2235 168 31 63 1593 1808 283 49 616 1583 170 15 21 873 1454 614 1385 936 793 717 458 179 94 2864 395 228 61 20 4222 302 590 143 247 49 956 884 218 662 1391 483 108 177 246 2452 458 7 458 250 3760 155 1993 3747 9 195 60 544 47 79 2 27 12 636 369 167 273 802 11 513 1866 299 696 392 152 2537 97 1270 498 1040 478 273 42 15 39 109 45 6 38 320 1045 889 92 1153 623 293 207 3009 25 192 0 336 645 928 2150 1085 433 406 73 1 30 1287 400 122 0 634 580 1478 1250 81 2 1417 256 430 1359 2357 2001 549 1299 1003 542 2717 201 34 121 274 1397 1259 314 571 1692 20 0 4 745 249 88 5495 454 505 2251 142 683 1212 371 97 2169 581 2073 1430 1367 2373 3912 1427 4754 1883 129 1219 646 3691 733 1453 746 1472 3210 900 491 2912 520 143 1458 339 782 2139 323 163 220 23 120 588 29 44 64 387 85 102 582 4535 1014 997 914 366 795 146 170 1973 2473 2892 3275 592 108 354 3 3402 1278 261 390 279 1407 1 1425 2 101 936 476 1847 24 704 42 1370 1384 4 2 76 467 16 0 60 129 1092 66 80 44 362 60 89 54 9 287 37 158 40 197 624 114 54 521 185 2 31 2677 1256 358 2856 88 148 9 3 182 442 1904 1078 373 2179 549 66 2190 1235 192 24 681 442 317 109 785 722 1514 405 982 183 223 0 SPP153 Bacteria;Proteobacteria;Gammaproteobacteria;Pasteurellales;Pasteurellaceae;multigenus;multispecies_spp153_6 0 0 0 0 0 0 0 0 0 0 0 0 0 0 0 0 0 0 0 0 0 0 0 0 0 0 0 0 0 0 0 0 0 0 0 0 0 0 0 0 0 0 0 0 0 0 0 0 0 0 0 0 0 0 0 0 0 0 0 0 0 0 0 0 0 0 0 0 0 0 0 0 0 0 0 0 0 0 0 0 0 0 0 0 0 0 0 0 0 0 0 0 0 0 0 0 0 0 0 0 0 0 0 0 0 0 0 0 0 0 0 0 0 0 0 0 0 0 0 0 0 0 0 0 0 0 0 0 0 0 0 0 0 0 0 0 0 0 0 0 0 0 0 0 0 0 0 0 0 0 0 0 0 0 0 0 0 0 0 0 0 0 0 0 0 0 0 0 0 0 0 0 0 0 0 0 0 0 0 0 0 0 0 0 0 0 0 0 0 0 0 0 0 0 0 0 0 0 0 0 0 0 0 0 0 0 0 0 0 0 0 0 0 0 0 0 0 0 0 0 0 0 0 0 0 0 0 0 0 0 0 0 0 0 0 0 0 0 0 0 0 0 0 0 0 0 0 0 0 0 0 0 0 0 0 0 0 0 0 0 0 0 0 0 0 0 0 0 0 0 0 0 1 0 0 0 1 0 0 0 1 0 0 31 6 0 6 0 0 18 0 0 0 0 0 3 0 0 0 0 0 42 0 1 0 0 0 0 4 0 0 0 0 0 1 0 0 0 0 0 0 0 5 0 1 0 0 0 0 0 0 0 0 0 0 0 0 0 0 0 0 0 0 0 0 0 0 0 0 0 0 0 0 1 0 0 0 0 0 0 0 0 0 0 0 0 0 0 0 0 0 0 87 0 0 0 0 0 0 0 0 0 3 0 0 0 0 0 0 0 0 0 0 0 0 0 0 0 4 1 0 0 0 5 2 0 0 2 0 0 0 0 0 0 0 0 0 0 0 0 1 5 0 0 0 2 0 0 0 0 0 0 0 0 0 507 63 0 0 0 0 0 0 0 0 0 0 0 39 4 0 0 6 0 0 0 0 0 0 19 0 0 0 1 0 0 0 0 0 0 0 9 0 0 0 0 0 0 0 0 0 0 0 4 13 52 7 21 0 33 13 0 0 50 0 0 0 0 0 1 25 0 0 0 2 0 0 0 0 0 0 0 0 0 0 0 0 32 0 0 0 3 0 0 1 0 0 0 0 49 0 0 0 0 0 0 0 1 0 0 0 9 0 2 0 0 56 10 0 0 0 0 0 0 0 0 0 0 0 9 0 79 0 2 0 0 0 0 0 3 1 0 0 0 0 0 0 0 0 0 0 0 0 0 0 0 0 0 0 0 0 0 0 0 0 7 0 0 0 0 0 9 0 22 0 0 0 0 0 3 0 0 0 0 0 0 2 0 0 0 0 0 0 0 0 0 0 0 0 0 3 0 0 0 0 0 2 0 0 0 2 0 1 20 6 0 0 16 1 8 0 0 0 0 12 0 62 0 43 48 8 0 0 7 36 0 0 0 0 0 0 56 0 66 0 0 2 0 0 0 0 0 0 0 0 1 0 0 3 1 0 0 0 0 0 0 0 0 0 0 0 0 1 0 0 0 0 0 0 0 0 0 6 23 0 0 0 0 0 0 0 2 0 0 0 0 4 0 0 2 1 0 0 0 0 0 0 0 1 0 0 6 17 0 0 0 0 0 5 0 6 1 1 0 0 53 1 0 0 0 0 0 0 0 0 0 24 4 0 9 2 0 10 1 0 0 0 0 0 0 6 0 0 0 0 0 36 0 0 0 0 0 0 0 0 3 3 0 0 0 0 0 0 0 0 0 0 0 22 0 0 0 0 0 0 3 0 0 0 17 0 0 0 0 0 0 0 2 10 0 0 0 0 0 0 0 0 0 0 0 0 0 0 0 0 0 0 0 0 0 0 0 0 0 0 0 0 0 0 0 0 0 0 0 0 0 0 0 1 0 0 0 0 27 0 0 46 0 1 0 0 1 0 0 2 0 0 1 0 0 1 0 1 0 0 0 0 0 1 4 0 0 0 0 0 0 0 0 0 0 0 0 0 0 17 1 0 0 6 0 0 0 0 43 0 0 0 2 1 0 0 0 2 122 0 0 0 5 4 0 0 0 0 0 0 0 0 0 0 0 2 2 13 39 0 0 2 1 4 0 0 0 0 0 0 3 0 0 0 0 3 4 0 1 1 0 13 3 0 0 0 0 0 1 0 6 0 0 0 0 0 0 0 0 0 0 0 0 0 0 0 4 0 0 0 0 0 0 0 0 0 0 0 0 18 0 0 0 0 0 0 3 0 1 2 0 12 0 0 0 2 0 0 0 2 0 0 7 21 0 87 0 0 0 0 0 0 0 0 0 16 7 0 0 0 0 11 13 0 0 2 0 1 0 2 40 0 0 0 0 1 0 0 0 0 115 0 0 0 0 0 1 0 0 2 4 0 0 0 0 0 7 0 0 0 1 0 0 0 0 0 0 0 0 0 1 0 0 0 0 2 0 0 0 0 27 0 0 0 0 2 0 31 0 0 0 1 0 0 1 0 0 0 22 0 0 0 0 0 7 0 0 0 0 0 0 0 44 0 0 0 0 0 18 3 0 2 0 34 0 0 0 0 0 0 0 1 8 0 25 0 0 40 0 5 0 0 0 0 0 0 219 0 0 136 0 0 3 0 7 0 0 0 0 0 0 12 11 0 6 0 0 3 0 0 0 0 0 0 0 0 0 0 0 0 0 0 0 2 0 0 5 0 0 1 9 0 0 15 0 0 1 14 0 90 8 0 0 1 0 0 0 0 8 0 0 0 0 8 0 0 0 0 7 2 0 1 6 0 5 0 0 0 0 0 0 5 3 0 7 1 0 0 3 0 0 0 43 0 0 0 0 0 0 0 0 36 0 0 0 1 3 0 11 0 0 22 8 0 0 9 0 0 0 0 0 0 0 0 112 0 1 0 0 0 0 0 0 0 0 16 0 0 0 0 0 0 0 0 0 0 0 41 2 0 0 0 0 3 14 0 0 109 0 0 5 0 0 0 0 0 0 0 0 0 0 2 0 0 0 0 0 4 0 0 0 0 0 0 0 21 0 0 0 1 2 3 0 0 0 0 0 0 1 0 0 0 0 15 8 0 0 0 0 10 0 0 0 0 0 5 0 0 0 0 0 0 0 0 0 0 0 0 0 0 0 0 0 0 0 0 0 0 0 0 0 0 2 3 0 9 142 0 0 0 1 0 0 1 0 10 2 1 41 0 0 0 0 28 0 0 0 0 0 0 0 0 0 2 0 0 5 0 0 0 16 0 0 1 1 0 0 0 0 0 3 0 0 0 1 0 0 2 0 0 2 0 0 0 0 0 0 0 0 0 0 40 0 0 21 0 1 0 1 1 368 0 0 0 0 0 0 0 0 0 18 0 0 0 13 0 0 0 0 0 0 0 0 0 2 1 0 0 1 0 35 11 0 3 0 17 1 3 0 0 0 0 0 0 0 0 0 2 0 0 6 2 0 23 0 1 0 0 0 0 1 0 0 0 0 0 0 0 0 0 0 0 219 82 0 0 0 0 0 11 0 0 21 0 0 0 0 0 0 1 0 1 5 0 0 2 13 0 0 0 0 0 25 5 0 1 0 0 1 0 0 0 0 0 0 0 0 0 0 1 0 0 0 0 0 3 8 0 3 40 1 0 6 21 0 0 0 0 0 0 0 0 0 0 0 4 6 0 0 0 0 0 12 0 0 2 0 2 0 11 10 0 16 8 0 0 30 0 0 0 0 0 137 0 0 0 0 0 1 0 0 0 0 2 0 0 0 0 0 38 0 0 10 7 0 0 0 0 0 0 0 0 0 0 0 1 13 0 1 7 0 5 0 0 0 1 0 0 0 2 0 0 0 0 0 0 158 1 0 0 0 151 0 8 0 0 0 0 0 0 0 0 0 0 0 0 0 0 0 6 0 1 0 3 0 0 0 0 18 10 0 0 0 0 0 2 0 46 1 0 0 0 0 0 0 0 0 0 4 4 0 40 1 0 1 5 0 0 0 0 0 0 0 0 0 0 4 0 0 0 0 8 0 0 0 1 0 0 0 0 0 26 0 0 1 1 0 3 0 SPP155 Bacteria;Proteobacteria;Gammaproteobacteria;Pseudomonadales;Moraxellaceae;Moraxella;multispecies_spp155_4 0 0 0 0 0 0 0 0 0 0 0 0 0 0 0 0 0 0 0 0 0 0 0 0 0 0 0 0 0 0 0 0 0 0 0 0 0 0 0 0 0 0 0 0 0 0 0 0 0 0 0 0 0 0 0 0 0 0 0 0 0 0 0 0 0 0 0 0 0 0 0 0 0 0 0 0 0 0 0 0 0 0 0 0 0 0 0 0 0 0 0 0 0 0 0 0 0 0 0 0 0 0 0 0 0 0 0 0 0 0 0 0 0 0 0 0 0 0 0 0 0 0 0 0 0 0 0 0 0 0 0 0 0 0 0 0 0 0 0 0 0 0 0 0 0 0 0 0 0 0 0 0 0 0 0 0 0 0 0 0 0 0 0 0 0 0 0 0 0 0 0 0 0 0 0 0 0 0 0 0 0 0 0 0 0 0 0 0 0 0 0 0 0 0 0 0 0 0 0 0 0 0 0 0 0 0 0 0 0 0 0 0 0 0 0 0 0 0 0 0 0 0 0 0 0 0 0 0 0 0 0 0 0 0 0 0 0 0 0 0 0 0 0 0 0 0 0 0 0 0 0 0 0 0 0 0 0 0 0 0 0 0 0 0 0 0 0 0 0 25 0 0 4 0 0 0 0 0 0 0 10 21 5 0 0 0 0 0 0 0 0 0 19 0 0 61 0 0 0 1 0 0 0 0 0 0 0 0 0 0 0 0 0 0 0 0 0 0 0 0 10 1519 0 0 0 0 0 0 0 0 0 0 420 0 0 0 2 0 0 0 0 0 0 0 0 0 0 0 0 0 0 0 132 0 0 0 0 0 0 0 0 0 0 0 0 778 0 0 252 0 0 0 0 0 3 0 0 0 0 0 0 0 0 0 0 0 0 0 0 0 0 0 0 0 0 0 3 0 0 0 0 0 5 0 0 0 0 0 0 0 0 0 0 0 0 0 1 0 0 0 0 0 0 0 0 0 0 0 342 0 0 304 0 0 0 1 2 0 0 0 0 0 0 0 0 0 0 0 1247 0 0 0 0 0 0 0 0 0 0 0 0 0 0 0 0 0 0 0 0 0 0 0 0 0 0 0 0 0 0 0 25 0 0 0 0 0 153 636 142 0 0 0 0 0 0 0 0 0 0 0 0 0 0 0 0 0 0 40 0 0 0 0 0 0 0 0 0 0 0 0 0 0 0 0 0 0 0 0 0 135 0 0 42 0 0 0 39 0 0 0 0 2 0 25 0 15 10 0 0 0 1 0 0 0 0 0 0 0 0 0 0 0 372 0 0 2 0 0 0 0 0 0 4 0 0 0 0 0 4 0 6 0 2 0 0 0 0 0 0 0 0 0 0 0 0 0 0 0 0 0 0 0 0 0 0 0 0 0 0 31 0 6 0 24 0 1 0 0 0 0 0 0 0 0 0 0 173 0 0 0 0 0 0 0 1563 386 26 0 0 0 0 0 0 0 111 0 0 0 0 0 0 1 559 0 0 0 0 0 725 0 1 0 0 0 11 0 0 0 0 0 0 0 0 0 0 0 27 0 0 0 0 0 49 0 0 0 0 0 4 0 0 0 0 0 0 0 1 0 0 0 0 410 0 0 54 0 0 0 0 0 0 0 0 0 0 0 0 0 1 0 0 0 0 0 0 0 0 20 10 0 0 0 0 0 1296 0 0 0 10 0 0 0 15 0 1 17 0 0 0 0 0 0 1301 0 0 0 1 35 0 35 0 30 0 0 0 0 0 0 0 0 3 95 0 9 0 0 0 0 0 0 0 47 0 0 0 250 0 0 0 15 0 20 0 0 0 0 0 0 0 0 0 0 0 0 0 0 174 0 0 0 71 0 0 0 0 0 0 0 0 0 0 0 0 1 0 0 0 0 0 0 0 0 191 0 0 0 0 0 0 48 0 0 0 0 0 0 0 0 0 0 0 0 0 195 0 0 0 0 0 0 0 104 0 0 0 6 2 0 293 0 0 0 0 5 0 0 0 0 0 0 0 1 61 0 0 0 0 0 0 0 0 0 0 0 0 0 0 0 59 0 0 0 0 0 0 0 0 0 0 0 0 0 0 0 0 256 0 0 0 180 0 0 0 36 0 0 0 0 0 0 0 0 0 0 0 0 0 0 0 0 0 0 0 0 0 0 0 0 0 0 0 0 0 1 0 0 0 0 0 0 0 0 0 13 0 0 56 0 0 0 0 0 0 0 0 0 0 0 0 0 0 0 0 0 0 0 0 0 0 0 107 0 0 0 0 0 0 0 0 1 0 0 0 0 0 0 0 0 0 0 0 0 0 58 0 0 0 0 0 0 0 0 0 0 0 0 34 0 0 0 13 0 0 0 0 0 0 0 0 0 0 0 0 0 0 0 0 0 0 0 0 5 0 0 0 0 0 0 0 0 110 31 0 0 0 0 0 0 0 0 1 0 20 0 5 0 0 0 0 0 0 0 0 0 0 0 0 0 0 0 1 0 0 0 0 0 19 0 0 0 0 0 0 0 0 0 0 0 9 0 0 0 0 0 0 0 0 0 14 0 0 0 0 0 0 2 0 0 0 0 0 0 0 0 40 0 0 50 0 0 0 0 0 1 609 0 0 0 0 0 0 0 0 0 0 0 0 0 0 0 0 0 0 0 0 0 0 0 6 13 0 0 0 21 0 0 0 0 0 0 0 0 0 0 0 0 0 0 2 0 0 0 0 0 0 0 0 19 0 34 0 2 0 0 18 0 0 0 0 0 0 0 0 9 0 0 0 0 9 0 0 0 0 0 0 0 0 0 0 0 0 4 2 6 0 0 0 0 0 0 0 0 0 0 0 0 0 0 16 0 0 0 0 6 396 6 0 0 0 0 0 0 0 0 0 0 0 0 0 0 0 0 3 331 0 0 0 0 0 0 5 0 4 6 0 0 2 12 0 0 0 0 0 0 0 0 0 0 0 0 14 120 0 0 0 5 7 3 0 1 47 0 0 0 0 27 0 0 0 15 0 0 0 0 0 0 0 600 0 0 0 0 0 0 0 0 0 0 0 0 0 0 5 0 31 0 7 0 0 0 0 0 4 0 0 1 0 0 0 7 0 0 0 0 0 0 0 0 0 0 0 0 56 0 0 0 0 0 0 0 4 3 0 1 0 0 0 0 0 0 0 0 0 0 0 1 0 0 0 0 0 0 5 0 0 0 0 0 0 17 0 0 0 0 0 0 0 0 1 0 0 0 0 0 0 0 0 0 1 0 0 0 0 0 3 0 13 0 0 0 0 0 42 0 0 0 0 0 0 2 0 0 0 0 0 0 0 0 0 0 0 0 0 0 0 14 4 23 0 0 0 0 0 0 0 0 0 0 0 21 0 0 0 0 0 0 0 0 0 0 0 0 0 0 0 0 0 21 0 27 0 0 0 0 0 1 0 9 0 0 1 0 0 0 0 0 2 0 53 0 0 0 0 0 0 0 0 0 0 0 0 0 0 15 0 0 0 0 0 0 0 0 5 0 0 0 0 0 28 0 0 0 11 70 0 0 0 0 7 0 0 0 0 0 0 0 0 0 244 0 0 3 0 0 0 0 0 0 0 0 0 0 0 0 0 0 0 0 0 0 0 0 0 0 0 0 0 0 0 0 0 0 0 2 0 0 0 0 0 0 0 0 0 0 0 34 0 0 0 0 0 0 0 8 1 0 4 0 0 0 0 0 0 0 0 6 1 2 211 0 0 0 0 0 0 0 0 0 0 0 0 0 0 0 0 3 0 0 8 0 1 0 0 1 0 0 0 0 0 0 0 0 1 0 0 0 0 0 0 0 0 0 0 0 0 0 0 0 0 4 0 0 0 13 0 0 3 0 0 0 0 0 1 0 0 0 0 0 0 0 1 0 5 0 0 4 0 0 0 0 4 0 0 0 0 0 0 0 0 0 0 0 0 0 0 0 0 0 2 0 5 0 0 0 0 0 0 0 0 0 0 0 132 0 0 0 0 0 0 0 0 0 0 0 0 0 0 0 0 0 0 0 0 0 0 0 0 264 0 0 0 0 0 0 0 0 0 0 0 0 0 0 0 0 0 0 0 0 0 0 0 0 0 0 0 80 0 0 0 0 0 0 0 0 0 0 0 0 0 0 0 0 1 0 SPP16 Bacteria;Proteobacteria;Betaproteobacteria;Neisseriales;Neisseriaceae;multigenus;multispecies_spp16_12 0 0 0 0 0 0 0 0 0 0 0 0 0 0 0 0 0 0 0 0 0 0 0 0 0 0 0 0 0 0 0 0 0 0 0 0 0 0 0 0 0 0 0 0 0 0 0 0 0 0 0 0 0 0 0 0 0 0 0 0 0 0 0 0 0 0 0 0 0 0 0 0 0 0 0 0 0 0 0 0 0 0 0 0 0 0 0 0 0 0 0 0 0 0 0 0 0 0 0 0 0 0 0 0 0 0 0 0 0 0 0 0 0 0 0 0 0 0 0 0 0 0 0 0 0 0 0 0 0 0 0 0 0 0 0 0 0 0 0 0 0 0 0 0 0 0 0 0 0 0 0 0 0 0 0 0 0 0 0 0 0 0 0 0 0 0 0 0 0 0 0 0 0 0 0 0 0 0 0 0 0 0 0 0 0 0 0 0 0 0 0 0 0 0 0 0 0 0 0 0 0 0 0 0 0 0 0 0 0 0 0 0 0 0 0 0 0 0 0 0 0 0 0 0 0 0 0 0 0 0 0 0 0 0 0 0 0 0 0 0 0 0 0 0 0 0 0 0 0 0 0 0 0 0 0 0 0 0 0 0 0 0 0 0 0 0 0 0 119 66 16 0 75 5 67 0 9 66 32 449 168 101 59 6 123 52 12 19 139 69 106 150 85 0 161 15 42 26 0 69 70 62 18 26 28 8 52 73 57 24 30 76 6 27 40 37 53 225 89 113 13 29 66 0 11 0 0 0 7 0 1 151 26 89 19 0 0 0 35 40 2 2 0 8 46 3 19 76 109 73 53 64 71 118 10 102 12 94 74 0 41 257 589 34 20 32 337 37 69 0 55 6 33 57 63 22 15 26 2 48 18 0 67 24 15 31 54 41 0 6 97 60 1 80 7 7 41 55 74 60 4 29 4 16 12 33 0 203 171 196 91 62 66 20 159 151 48 0 72 1 157 113 175 18 1 45 38 130 11 58 15 141 304 53 52 187 115 227 50 0 21 31 103 12 145 112 0 0 56 30 19 33 30 376 0 30 46 20 6 29 20 32 1 27 126 208 0 116 1 14 338 48 218 0 59 275 30 60 83 137 155 96 13 34 43 34 43 31 108 61 34 292 14 27 49 18 16 54 0 91 91 210 0 37 148 0 57 83 0 2 41 50 188 44 1 31 24 126 3 104 2 78 48 82 53 78 92 126 14 118 75 130 111 194 45 0 25 22 59 13 5 9 0 55 7 61 95 46 300 127 83 17 120 261 81 90 0 14 0 106 31 31 33 20 17 0 0 74 176 82 6 0 25 99 83 50 99 92 0 0 1 36 23 3 69 93 32 0 123 0 4 66 15 20 62 87 333 41 0 461 0 10 9 43 166 19 407 7 72 141 195 20 23 1 100 55 57 60 128 277 148 107 119 169 49 38 64 60 39 247 23 55 20 40 33 60 107 1 3 0 145 84 17 94 140 224 0 18 11 48 263 15 246 36 247 13 103 56 183 13 113 0 5 17 193 162 63 0 4 19 244 203 3 57 47 58 79 204 36 0 0 71 39 0 0 18 6 54 9 13 103 0 6 60 37 45 1 19 0 7 1 88 24 66 68 30 58 140 58 149 4 47 29 46 0 21 57 18 6 5 140 69 35 13 18 2 50 75 40 102 22 60 106 10 145 14 16 32 32 95 21 23 106 3 167 16 75 101 71 29 69 194 115 226 21 26 32 88 417 93 108 54 116 95 220 166 23 86 159 40 59 50 112 11 403 41 44 3 119 90 31 51 476 50 6 115 101 8 106 32 1 77 22 91 99 136 454 1 10 71 134 100 24 156 14 251 212 238 44 131 215 59 323 198 2 367 169 0 2 38 16 136 19 76 0 9 77 281 154 23 0 7 75 0 8 11 110 97 4 18 43 13 3 79 148 56 14 135 69 1 11 72 108 0 69 161 0 30 70 35 64 6 43 38 5 2 71 12 125 15 12 2 1 96 5 1 17 2 88 11 19 15 69 104 45 405 18 105 75 86 268 0 0 0 29 11 73 7 123 140 15 2 45 383 55 10 137 123 54 125 65 32 0 178 29 25 0 127 54 207 33 161 128 77 128 2 245 65 71 131 72 57 34 45 96 67 19 146 140 52 115 39 33 93 0 172 96 136 96 189 73 591 201 100 2 95 64 6 37 4 123 125 431 30 303 4 121 57 68 10 102 175 110 33 54 118 44 4 11 132 39 39 46 182 78 24 0 44 17 43 44 124 1 57 97 126 140 6 2 61 1 140 0 276 37 6 0 21 0 0 0 287 18 50 1 36 21 0 10 76 16 3 238 165 87 0 105 71 53 1 33 36 8 16 20 2 7 11 12 4 2 9 1 3 68 19 9 19 5 77 33 91 2 12 145 0 15 15 0 6 34 12 65 0 35 5 0 0 3 0 11 32 3 24 42 186 21 11 61 0 2 11 80 0 87 92 11 9 19 30 1 13 61 3 0 0 1 9 0 18 12 0 4 6 0 0 4 8 8 1 7 10 12 57 7 44 2 0 33 32 31 1 11 3 70 0 32 48 0 6 13 0 7 351 8 1 2 48 0 2 5 12 0 43 23 9 0 22 19 1 283 1 16 8 9 1 1 5 4 26 9 0 84 3 1 8 23 1 18 39 1 49 40 41 13 133 9 48 6 6 1 5 36 43 8 17 39 11 0 19 50 4 94 15 68 3 17 76 16 143 81 0 19 49 15 6 5 84 76 2 9 162 1 12 25 6 1 35 66 11 0 24 22 0 6 56 0 28 5 17 32 46 78 13 16 35 0 16 18 10 0 5 20 55 3 0 1 42 13 8 1 62 2 6 20 12 36 21 4 28 13 0 7 15 25 0 33 32 0 46 31 0 31 68 21 60 42 84 0 26 13 11 9 37 1 0 18 11 2 0 87 101 0 63 14 1 10 2 0 5 37 13 0 4 4 0 21 127 5 109 48 21 5 5 4 1 18 50 4 3 23 35 92 186 0 30 9 98 1 19 8 2 88 40 270 24 105 0 2 16 9 2 36 30 76 17 30 0 0 10 0 4 3 26 57 5 68 4 0 52 65 8 46 4 30 286 24 27 52 77 41 268 5 10 92 53 55 1 44 21 0 8 0 4 25 14 1 5 5 114 0 96 143 19 9 11 5 91 35 4 2 11 0 28 23 0 1 0 0 4 5 11 25 3 8 13 8 8 0 0 19 15 3 18 71 1 1 13 106 237 11 3 4 2 4 38 19 130 234 1 44 26 1 8 12 0 0 3 26 0 70 13 0 33 39 0 4 5 11 142 53 15 8 32 0 14 20 6 17 12 4 9 72 0 1 35 16 2 0 16 17 56 26 1 0 8 32 0 2 11 45 4 42 21 9 59 28 144 23 19 3 31 30 11 29 8 48 1 5 61 25 11 3 2 0 3 4 3 59 6 5 0 19 71 7 12 65 0 0 8 2 19 51 15 21 18 111 214 39 2 45 16 35 31 2 0 0 7 79 2 0 13 46 48 0 5 28 1 36 29 10 245 3 0 30 21 22 2 59 0 6 166 49 38 14 24 2 61 57 11 3 10 10 2 57 1 52 52 54 2 39 70 0 93 35 1 36 41 11 2 41 38 6 2 32 28 1 56 47 26 20 11 1 35 73 11 1 15 24 0 8 83 22 36 15 3 6 4 23 1 21 117 0 16 43 22 1 36 67 0 5 3 22 10 59 22 0 11 19 2 86 13 65 50 113 49 4 44 21 16 72 4 24 1 94 40 11 50 54 0 12 38 7 46 30 17 0 38 22 6 21 10 6 50 46 3 68 8 15 13 25 5 14 5 42 170 7 71 10 51 44 6 3 93 143 127 30 7 0 4 34 3 2 0 15 33 7 25 75 5 6 1 0 6 7 2 21 12 7 0 1 48 43 153 3 36 12 2 43 7 10 23 185 10 0 1 0 0 0 24 25 27 83 0 107 17 63 67 2 35 3 0 0 8 7 21 41 17 0 29 85 1 44 32 23 8 23 22 0 7 13 0 20 83 2 0 6 104 1 138 55 1 4 3 26 5 5 25 0 0 45 31 6 41 26 12 18 239 5 11 34 19 0 12 57 0 144 68 4 17 102 1 15 7 SPP162 Bacteria;Proteobacteria;Alphaproteobacteria;Sphingomonadales;Sphingomonadaceae;Sphingomonas;multispecies_spp162_3 0 0 0 0 0 0 0 0 0 0 0 0 0 0 0 0 0 0 0 0 0 0 0 0 0 0 0 0 0 0 0 0 0 0 0 0 0 0 0 0 0 0 0 0 0 0 0 0 0 0 0 0 0 0 0 0 0 0 0 0 0 0 0 0 0 0 0 0 0 0 0 0 0 0 0 0 0 0 0 0 0 0 0 0 0 0 0 0 0 0 0 0 0 0 0 0 0 0 0 0 0 0 0 0 0 0 0 0 0 0 0 0 0 0 0 0 0 0 0 0 0 0 0 0 0 0 0 0 0 0 0 0 0 0 0 0 0 0 0 0 0 0 0 0 0 0 0 0 0 0 0 0 0 0 0 0 0 0 0 0 0 0 0 0 0 0 0 0 0 0 0 0 0 0 0 0 0 0 0 0 0 0 0 0 0 0 0 0 0 0 0 0 0 0 0 0 0 0 0 0 0 0 0 0 0 0 0 0 0 0 0 0 0 0 0 0 0 0 0 0 0 0 0 0 0 0 0 0 0 0 0 0 0 0 0 0 0 0 0 0 0 0 0 0 0 0 0 0 0 0 0 0 0 0 0 0 0 0 0 0 0 0 0 0 0 0 0 0 2 0 2 7 3 0 0 95 3 1 1 6 1 0 3 5 1 1 2 43 2 1 1 4 0 73 0 2 1 2 0 2 4 1 0 1 7 4 0 4 8 0 1 1 0 24 2 5 3 4 3 2 44 2 2 72 0 1131 118 0 105 1002 107 5 85 4 2 224 160 263 1 2 2 6 0 0 14 1 0 0 0 0 0 0 0 0 0 28 0 0 0 0 0 0 0 0 0 0 25 0 0 0 0 0 0 0 0 0 0 0 0 0 28 0 0 0 0 0 0 0 0 0 0 1 0 0 0 0 0 0 0 0 0 0 221 0 0 0 1 0 0 5 0 0 2 1 2 0 0 0 0 20 0 0 0 0 18 0 0 11 87 3 1 0 0 3 2 2 0 42 2 30 1 10 2 29 0 0 139 3 0 1 1 0 0 0 7 6 0 0 10 0 0 0 19 5 0 0 57 0 49 0 2 2 3 2 1 0 4 2 1 0 1 2 3 1 5 0 0 0 5 1 1 2 1 0 0 10 7 4 79 0 1 9 54 13 19 549 38 2 108 3 1 1 4 6 148 66 4 0 53 29 147 1 4 10 10 4 17 7 18 5 15 1 1 4 0 0 0 4 9 0 0 0 0 0 0 0 0 0 0 2 0 0 0 0 0 0 0 0 0 0 63 0 0 0 0 0 0 0 0 0 1 0 0 16 0 0 0 0 1 0 0 0 0 0 6 1 0 0 0 0 0 0 0 0 0 0 19 0 0 6 27 0 79 0 3 2 16 106 0 0 0 0 0 0 0 0 5 0 0 0 0 0 0 0 0 0 0 232 0 0 0 0 0 0 0 0 0 0 0 0 0 0 0 0 0 0 3 0 0 1 0 0 0 3 2 0 0 2 0 6 0 56 7 3 0 0 1 0 0 2 2 0 14 1 3 3 0 2 1 56 1 2 0 75 11 0 2 1 0 0 0 132 0 0 1 1 64 27 1 1 46 1 0 0 0 2 1 0 5 0 8 1 0 0 4 2 1 1 7 0 1 0 0 9 0 0 1 0 0 0 0 0 0 11 14 1 3 2 0 0 2 3 0 12 6 253 5 5 0 28 0 0 1 9 3 0 1 1 10 0 35 0 14 3 2 2 1 5 4 0 2 13 0 1 38 0 0 0 2 1 1 0 2 4 4 4 2 41 5 219 642 4 11 9 8 0 0 11 3 14 0 6 127 3 523 10 1 41 0 19 2 4 8 104 340 10 11 588 99 82 11 0 27 50 523 11 2 1 4 503 879 5 141 22 0 0 0 0 0 26 0 0 0 0 0 0 0 0 0 1 14 0 1 0 1 0 0 0 0 0 0 255 0 0 0 1 0 0 0 0 0 0 0 0 0 155 0 0 0 0 0 0 0 0 0 0 39 0 0 0 0 0 0 0 0 0 0 454 0 0 0 427 1 0 3 3 2 2 1 0 7 0 0 1 0 0 0 0 2 1 1 0 0 1 0 1 0 0 0 0 0 3 3 2 4 2 4 1 18 4 2 7 2 2 2 7 0 6 0 1 2 4 0 1 7 1 2 4 3 187 15 0 17 1 13 0 7 4 3 261 0 1 3 1 6 4 1 1 1 1 1 12 1 1 2 0 0 1 0 3 4 8 0 0 0 3 4 23 2 52 319 17 25 6 4 3 54 43 733 71 85 4 18 8 123 74 420 0 104 18 29 9 39 0 6 166 0 0 0 0 0 0 0 0 0 0 0 1 0 0 0 0 0 0 0 0 0 0 4 0 0 0 0 0 0 0 0 0 0 0 4 0 0 2 17 7 1 13 13 10 35 9 1 8 1 4 1 1 15 0 1 2 15 4 5 8 0 0 17 18 6 0 0 0 0 0 0 2 1 0 0 0 0 0 0 0 0 0 0 0 0 0 0 0 0 0 0 0 0 4 0 0 0 0 0 0 0 1 0 0 0 0 0 0 1 0 0 0 0 0 0 0 0 0 0 0 0 0 0 0 0 0 0 0 0 0 0 1 0 0 0 0 0 0 1 0 0 14 0 1 4 19 0 1 2 0 4 1 16 1 5 0 1 0 0 2 0 1 0 0 0 0 0 0 1 0 0 0 0 0 0 0 0 0 0 4 0 0 0 0 0 0 0 0 0 0 2 0 0 0 0 0 0 0 0 0 0 0 4 0 0 0 0 0 0 0 0 0 0 0 0 0 0 0 0 0 0 0 0 0 1 0 6 0 0 0 0 0 0 0 0 0 0 6 0 0 9 1 2 6 2 2 8 0 6 1 4 3 5 7 2 2 11 3 3 3 4 140 5 0 3 1 2 5 7 1 3 6 4 7 4 3 5 22 14 15 2 1 3 6 1 1 1 5 14 2 0 3 0 0 0 0 0 0 0 0 0 0 3 0 0 0 0 0 0 0 0 0 0 5 0 0 0 0 0 0 0 0 0 0 0 0 0 0 0 0 0 0 0 0 0 0 3 0 0 0 0 0 0 0 0 0 0 20 0 0 0 0 0 0 0 0 0 0 5 0 0 0 0 0 0 0 0 0 0 0 0 1 0 0 0 0 0 0 0 0 0 0 0 4 0 0 0 0 0 0 0 0 0 0 6 0 0 0 0 0 0 0 0 0 0 0 0 0 0 2 0 0 0 0 0 0 0 0 0 0 3 0 0 0 0 0 0 0 0 0 0 0 1 0 0 0 0 6 1 0 0 2 70 0 1 1 0 15 0 1 2 0 1 2 0 0 0 0 1 1 0 2 0 0 0 1 0 0 0 0 0 0 0 0 0 0 1 0 0 0 2 0 0 0 0 0 0 0 0 0 0 3 0 0 0 0 0 0 0 0 0 0 1 0 0 0 0 0 0 0 0 0 6 19 0 1 0 0 5 3 1 1 1 1 1 0 0 1 1 2 1 0 0 2 12 1 0 5 0 1 1 4 2 0 0 0 0 0 0 0 0 0 0 0 0 0 0 0 0 0 0 0 2 0 0 0 0 0 0 0 0 0 0 2 0 0 2 17 7 2 7 3 9 0 3 2 2 3 1 3 1 15 0 1 2 0 0 4 9 1 1 10 5 0 4 4 0 3 2 3 2 7 0 6 2 0 2 3 5 1 9 6 41 3 7 3 1 2 4 2 7 14 2 2 9 46 4 3 6 3 3 9 2 0 3 12 5 8 2 2 4 0 0 3 2 6 2 0 2 1 4 2 0 0 0 0 0 0 1 0 0 0 0 0 0 0 1 0 0 0 0 0 0 1 0 0 0 0 0 0 0 0 0 0 4 0 0 0 0 0 0 0 0 0 0 0 0 0 0 3 0 0 0 0 0 0 0 0 0 0 2 16 1 0 0 0 0 0 0 0 0 0 2 0 3 1 1 1 1 183 4 2 3 4 15 3 25 1 4 1 6 1 4 2 4 1 2 5 8 0 7 29 3 3 0 1 0 51 2 3 2 7 81 10 1 0 12 7 1 4 6 5 3 6 0 6 4 12 6 4 6 6 0 9 1 0 3 2 SPP164 Bacteria;Firmicutes;Negativicutes;Selenomonadales;Selenomonadaceae;Selenomonas;multispecies_spp164_2 0 0 0 0 0 0 0 0 0 0 0 0 0 0 0 0 0 0 0 0 0 0 0 0 0 0 0 0 0 0 0 0 0 0 0 0 0 0 0 0 0 0 0 0 0 0 0 0 0 0 0 0 0 0 0 0 0 0 0 0 0 0 0 0 0 0 0 0 0 0 0 0 0 0 0 0 0 0 0 0 0 0 0 0 0 0 0 0 0 0 0 0 0 0 0 0 0 0 0 0 0 0 0 0 0 0 0 0 0 0 0 0 0 0 0 0 0 0 0 0 0 0 0 0 0 0 0 0 0 0 0 0 0 0 0 0 0 0 0 0 0 0 0 0 0 0 0 0 0 0 0 0 0 0 0 0 0 0 0 0 0 0 0 0 0 0 0 0 0 0 0 0 0 0 0 0 0 0 0 0 0 0 0 0 0 0 0 0 0 0 0 0 0 0 0 0 0 0 0 0 0 0 0 0 0 0 0 0 0 0 0 0 0 0 0 0 0 0 0 0 0 0 0 0 0 0 0 0 0 0 0 0 0 0 0 0 0 0 0 0 0 0 0 0 0 0 0 0 0 0 0 0 0 0 0 0 0 0 0 0 0 0 0 0 0 0 0 0 0 0 0 0 0 0 41 0 6 1 62 0 23 9 7 66 2 8 30 0 4 7 5 0 0 0 3 0 0 43 0 5 2 0 124 38 1 0 5 0 0 0 0 0 0 0 3 3 0 0 0 0 0 4 14 0 0 0 0 0 0 0 3 0 0 0 0 0 0 0 0 0 0 0 0 0 2 0 0 0 0 0 0 0 0 16 2 0 0 0 0 0 0 3 0 0 0 0 0 0 0 0 6 0 61 1 0 0 0 0 0 13 0 0 0 0 0 0 0 4 0 0 0 0 0 0 0 0 3 0 0 9 0 0 0 6 0 0 0 0 0 1 0 50 0 0 2 0 0 0 15 0 0 18 81 54 0 95 3 0 0 0 0 3 10 42 0 0 30 0 0 0 125 0 0 1 0 0 0 0 11 3 83 0 0 0 153 1 0 1 0 22 31 0 0 0 1 0 0 20 0 0 2 1 0 1 0 0 2 0 0 0 0 4 7 0 14 34 0 1 0 3 89 0 3 37 2 0 0 0 0 2 30 0 0 0 0 0 0 0 0 0 14 4 0 0 0 0 0 0 0 0 0 7 0 0 0 2 0 3 0 0 0 3 0 0 0 0 1 19 0 1 0 0 396 0 0 0 16 273 0 0 89 0 0 1 1 0 0 1 0 53 0 86 0 215 155 22 1 0 0 0 0 0 0 1 1 0 0 0 0 0 0 0 0 0 0 0 9 0 0 0 40 0 6 0 0 38 0 1 0 0 0 3 0 46 0 0 0 1 0 0 0 0 0 0 0 0 2 0 6 0 0 0 0 0 0 19 0 0 0 1 9 0 1 18 0 1 349 0 4 2 2 1 0 19 5 0 0 2 27 4 44 0 0 0 0 89 150 0 0 7 0 0 34 138 1 0 42 0 4 0 0 0 0 4 0 0 2 0 1 0 0 15 22 0 0 0 1 0 0 2 0 0 0 1 0 139 0 0 0 0 1 1 3 5 0 1 3 0 18 3 0 0 55 64 0 0 1 0 0 28 0 0 3 0 0 50 1 10 0 0 26 30 0 1 0 6 3 3 52 2 0 13 44 0 0 0 0 0 3 0 3 0 1 0 151 18 0 0 0 14 0 14 0 0 0 0 0 4 0 269 0 0 29 5 0 0 1 0 0 0 3 0 0 5 1 0 9 0 0 0 0 0 0 0 0 0 13 0 0 0 0 0 0 12 0 0 1 0 0 0 0 0 0 0 0 0 0 0 0 0 3 15 0 0 0 0 1 1 8 0 0 0 0 0 1 0 0 0 0 0 9 0 0 0 1 0 0 0 0 0 0 10 0 0 14 0 0 0 0 0 0 0 0 86 0 0 0 1 4 0 3 0 0 0 809 0 0 0 0 0 1 154 0 51 1 0 0 0 2 0 3 0 0 0 0 0 2 0 52 0 7 0 18 0 0 0 0 0 0 0 0 2 0 0 0 0 0 128 0 0 0 0 0 0 0 1 0 6 6 0 0 0 25 36 0 0 0 112 2 32 5 0 2 0 0 0 22 0 0 0 1 0 44 21 0 1 2 0 0 0 0 0 0 76 0 10 0 0 11 0 71 18 0 48 39 0 24 38 16 3 0 0 3 1 0 0 0 8 22 0 1 0 4 13 0 1 0 0 16 0 0 0 0 4 1 99 0 0 0 0 0 0 0 0 8 0 0 0 0 0 0 1 0 0 11 0 1 0 39 0 0 1 0 7 0 0 0 0 0 0 1 0 0 6 0 0 0 1 1 0 2 0 0 46 0 0 1 0 0 0 0 0 3 0 1 274 0 0 0 0 0 0 0 0 0 1 0 0 4 0 0 0 1 0 0 0 0 0 0 1 0 33 0 0 0 0 0 0 2 0 0 0 0 0 0 0 0 0 0 0 0 0 0 0 0 0 0 0 0 4 0 2 83 0 0 0 0 0 0 0 0 0 15 1 0 0 1 1 0 2 0 0 0 0 7 0 0 36 0 0 21 0 0 0 13 0 0 0 0 0 0 0 0 0 0 0 0 1 0 0 0 11 0 0 0 0 0 0 2 0 0 12 1 0 2 0 0 0 0 0 6 0 9 0 4 0 0 2 0 3 0 0 0 8 0 0 0 8 2 0 1 0 0 5 0 0 0 0 0 0 0 8 0 0 50 0 3 0 0 25 0 13 3 0 21 13 0 2 30 0 1 0 1 0 0 0 0 0 0 0 0 0 0 0 0 0 1 0 0 1 5 0 0 0 0 0 4 16 0 0 0 0 0 0 1 0 37 1 0 1 0 0 1 0 5 0 65 0 0 0 0 10 0 57 0 0 11 0 0 0 0 1 0 0 0 0 1 0 0 0 0 0 0 0 0 0 0 0 0 0 1 0 0 0 0 2 1 0 0 0 0 0 5 0 6 1 0 1 10 1 0 1 0 2 0 0 0 0 0 0 0 0 0 0 0 0 0 0 0 2 0 0 56 0 25 3 0 0 0 0 0 1 0 0 4 0 2 0 0 0 0 0 0 0 56 0 0 0 1 0 0 0 0 0 0 169 2 0 0 0 18 0 0 2 0 0 0 0 0 0 0 0 12 0 43 4 0 0 0 0 10 0 0 0 0 0 0 12 0 0 26 0 0 5 0 0 0 0 0 0 83 1 0 0 1 0 0 1 27 0 0 165 0 0 0 0 0 0 29 0 0 0 9 0 1 12 3 0 0 0 0 16 0 5 0 0 0 0 0 0 0 0 1 0 0 0 0 0 0 93 0 0 15 0 0 0 0 0 0 5 0 3 0 0 0 18 1 0 0 0 0 0 0 0 0 5 0 0 0 0 0 0 2 8 0 8 0 0 0 4 0 0 1 2 0 14 5 0 0 0 0 0 1 0 0 0 0 0 0 0 0 148 0 0 0 1 1 0 0 0 0 0 0 0 10 0 0 0 701 0 0 0 0 1 0 0 0 16 0 0 1 0 0 1 12 0 4 0 0 0 0 0 0 0 1 0 3 0 0 0 0 4 0 0 0 0 0 0 0 0 10 0 0 0 0 1 0 0 4 0 0 0 0 1 0 0 0 0 0 0 1 1 0 28 0 0 0 1 1 0 0 1 26 0 1 0 0 0 0 0 1 0 4 0 0 0 0 0 0 0 0 0 0 0 0 0 0 2 0 0 0 1 0 6 0 0 0 20 0 0 0 0 0 0 0 0 0 0 0 0 0 0 0 0 11 0 0 27 0 0 0 0 0 15 0 0 13 0 0 0 0 0 0 0 0 0 0 0 0 0 23 0 0 0 0 0 16 0 6 2 0 20 0 0 0 0 4 0 28 2 0 33 0 0 0 0 0 0 0 0 0 2 1 0 1 63 0 0 1 0 33 0 0 44 45 2 1 0 0 2 4 0 1 0 42 0 10 1 0 2 3 0 0 0 0 0 1 0 0 0 0 0 4 1 0 0 1 3 0 0 0 0 0 0 0 0 1 0 0 0 0 0 6 0 0 0 4 0 0 0 0 0 1 0 SPP171 Bacteria;Firmicutes;Bacilli;Lactobacillales;Streptococcaceae;Streptococcus;multispecies_spp171_4 0 0 0 0 0 0 0 0 0 0 0 0 0 0 0 0 0 0 0 0 0 0 0 0 0 0 0 0 0 0 0 0 0 0 0 0 0 0 0 0 0 0 0 0 0 0 0 0 0 0 0 0 0 0 0 0 0 0 0 0 0 0 0 0 0 0 0 0 0 0 0 0 0 0 0 0 0 0 0 0 0 0 0 0 0 0 0 0 0 0 0 0 0 0 0 0 0 0 0 0 0 0 0 0 0 0 0 0 0 0 0 0 0 0 0 0 0 0 0 0 0 0 0 0 0 0 0 0 0 0 0 0 0 0 0 0 0 0 0 0 0 0 0 0 0 0 0 0 0 0 0 0 0 0 0 0 0 0 0 0 0 0 0 0 0 0 0 0 0 0 0 0 0 0 0 0 0 0 0 0 0 0 0 0 0 0 0 0 0 0 0 0 0 0 0 0 0 0 0 0 0 0 0 0 0 0 0 0 0 0 0 0 0 0 0 0 0 0 0 0 0 0 0 0 0 0 0 0 0 0 0 0 0 0 0 0 0 0 0 0 0 0 0 0 0 0 0 0 0 0 0 0 0 0 0 0 0 0 0 0 0 0 0 0 0 0 0 0 18 50 12 41 60 228 76 0 33 96 223 67 335 427 88 467 309 874 396 52 135 186 190 116 362 97 208 607 360 240 0 116 172 71 139 94 45 366 492 284 365 40 76 119 70 20 432 47 28 62 142 71 39 37 35 0 183 26 15 0 14 0 8 207 7 42 43 0 1 0 31 63 30 33 0 39 512 20 62 49 66 13 42 38 34 72 24 36 73 234 128 0 87 103 93 557 35 44 3 463 256 0 197 19 77 110 36 443 43 0 81 228 11 0 148 98 4 13 103 74 0 13 23 9 0 106 67 104 137 2 48 250 10 5 37 272 175 328 0 116 58 68 104 223 122 603 236 18 75 1 50 4 146 156 412 478 12 22 147 38 9 62 45 22 63 441 98 197 52 5 18 20 49 13 26 78 77 80 4 27 75 134 372 65 178 11 5 100 53 86 57 74 52 3 10 38 6 495 108 150 7 11 135 188 136 100 63 55 231 188 345 307 130 237 199 37 320 250 105 110 129 258 194 65 42 299 155 17 129 88 34 199 195 109 58 35 32 1 231 81 20 21 70 78 62 16 5 35 314 91 7 15 33 474 124 110 362 119 52 214 58 400 20 129 142 261 58 0 190 48 33 27 82 228 280 4 20 37 153 121 2 198 128 247 35 89 38 59 0 78 56 133 38 285 17 180 50 57 1 172 23 103 93 0 57 111 75 34 307 77 4 0 4 54 109 6 56 219 59 4 191 0 114 84 516 34 11 42 131 160 0 9 0 16 26 197 581 201 40 23 69 206 65 21 114 40 85 60 44 3 149 93 55 82 345 289 169 18 75 39 65 33 31 127 200 78 313 156 201 21 23 20 54 125 55 261 42 57 0 380 23 131 241 130 16 120 74 435 245 136 48 350 929 52 82 745 232 29 241 39 46 72 135 332 41 116 21 39 169 22 71 8 160 143 48 3 48 36 17 10 41 202 43 1 83 227 112 152 2 302 106 267 14 187 199 157 78 62 279 41 140 867 35 51 151 43 634 159 22 2 39 66 24 131 145 14 35 58 217 182 207 157 440 365 36 192 136 60 474 184 195 300 16 441 279 76 69 21 23 81 243 54 139 116 176 63 150 112 55 130 75 302 167 213 72 143 147 18 80 169 139 177 243 18 120 183 54 89 187 7 169 185 141 42 19 470 87 42 111 2 52 13 5 40 129 265 18 109 271 0 77 19 92 86 42 5 2 50 30 21 335 12 88 100 85 47 8 85 266 1 18 1425 160 97 90 25 0 9 201 209 62 10 0 27 26 1 2 34 8 104 71 56 50 55 60 33 124 44 267 85 283 1 79 342 29 58 84 229 117 170 208 10 128 30 77 420 72 13 82 18 432 81 15 14 59 216 189 9 9 143 148 50 13 35 95 301 1420 115 117 62 1035 882 356 69 11 51 101 10 59 9 423 99 101 8 294 130 169 71 83 195 135 169 207 239 1 241 171 134 0 225 161 292 418 24 196 92 36 291 15 92 40 69 288 14 171 874 151 299 609 193 1391 416 274 29 489 101 17 325 677 48 1259 13 466 54 470 187 129 342 234 635 280 0 29 249 34 314 6 6 64 95 116 9 406 249 319 225 388 65 284 145 77 147 21 175 300 423 352 389 0 334 52 138 60 89 218 247 50 112 151 35 49 213 15 396 14 131 76 363 1 20 2 0 0 71 7 176 73 92 0 0 101 138 161 38 64 131 350 0 205 96 172 69 50 53 34 87 129 49 97 142 144 27 126 35 54 191 147 66 103 103 25 106 256 71 22 119 60 10 125 43 20 26 119 23 75 3 245 85 8 27 21 4 107 149 92 109 139 1069 192 17 188 0 10 470 226 102 37 249 10 6 117 93 74 65 94 62 115 46 56 25 38 82 29 38 133 42 49 18 43 13 193 13 12 2 180 35 15 45 178 32 82 191 248 32 579 82 104 135 360 60 9 90 93 7 57 319 24 50 55 314 83 76 325 29 1 99 53 230 20 132 11 5 58 5 153 224 96 24 58 36 65 63 200 27 65 66 70 13 23 69 10 29 47 139 87 173 93 117 84 24 98 93 37 136 89 89 48 42 88 55 24 123 216 9 148 24 161 4 74 133 112 246 102 26 104 204 19 50 7 180 173 8 136 292 2 177 85 11 6 205 143 37 37 79 73 65 241 160 32 131 92 89 21 62 162 40 356 36 11 121 52 86 9 26 75 73 49 38 20 52 97 23 18 202 29 47 94 13 94 92 6 123 77 50 124 17 35 18 48 94 24 117 36 41 17 52 156 35 89 93 10 117 94 30 47 33 44 144 127 54 33 8 189 90 211 426 53 46 172 34 15 118 339 82 112 40 28 31 197 78 87 112 82 15 18 144 97 111 33 117 11 17 169 44 98 57 26 74 59 288 10 171 137 8 120 185 99 74 59 15 185 28 156 126 225 147 60 85 116 31 23 29 45 62 32 40 106 30 126 32 71 140 83 113 177 609 121 145 90 192 298 85 148 77 38 72 227 34 198 70 226 107 9 286 125 79 341 52 27 46 66 142 1 139 71 60 181 18 228 122 54 77 53 84 79 10 184 3 73 35 13 21 2 63 164 4 241 98 63 163 12 30 428 121 65 98 94 86 19 83 127 118 66 141 112 111 120 99 4 86 71 71 129 130 15 248 123 8 33 73 187 19 77 131 208 37 70 81 57 59 203 110 51 146 36 81 177 55 89 93 114 79 8 112 36 128 38 80 31 27 6 53 43 73 92 25 52 124 73 23 62 801 127 11 1892 71 8 36 38 70 44 44 47 119 158 86 57 278 171 23 48 119 111 205 232 166 634 228 74 57 202 222 23 41 186 168 50 173 114 259 15 72 31 81 254 165 43 148 232 131 172 77 47 11 64 27 67 22 66 86 68 17 78 118 28 30 65 165 77 33 123 234 270 271 58 9 36 61 122 105 50 65 155 83 57 102 192 60 89 67 264 317 48 76 22 41 87 67 271 142 99 31 191 114 29 59 231 53 339 192 17 46 109 66 31 15 57 27 103 67 105 17 128 31 3 144 60 38 21 39 85 2 52 108 54 105 92 49 48 27 107 4 27 86 66 123 187 139 41 394 83 44 17 97 135 25 195 91 15 160 121 84 123 47 122 45 211 82 2 71 74 38 109 41 101 26 1409 246 80 470 181 99 184 142 271 20 19 123 65 260 31 28 116 17 24 559 45 4 145 52 39 73 36 62 152 83 270 203 90 358 92 46 55 12 37 113 136 44 68 37 175 81 36 203 17 110 146 16 60 44 36 66 316 48 2 97 29 60 121 447 165 32 112 53 242 776 102 20 250 95 186 67 42 128 185 39 38 79 23 48 2 129 166 93 47 110 257 252 175 36 140 60 41 26 49 107 63 49 68 25 17 103 171 33 307 85 264 21 77 26 2 132 66 36 34 153 175 85 108 101 99 44 74 43 45 133 72 8 80 122 7 4 238 153 138 124 61 68 130 144 145 22 193 35 59 97 281 18 182 60 208 38 98 48 23 328 SPP179 Bacteria;Firmicutes;Clostridia;Negativicutes;Veillonellaceae;Veillonella;multispecies_spp179_3 46 696 8 629 31 821 12 653 25 431 128 13 33 3 80 120 6 12 175 323 281 91 149 444 20 113 10 147 72 43 0 134 3 946 216 397 447 204 94 38 200 11 29 595 350 5 151 53 6 19 1220 74 1062 54 311 4 730 231 8 371 100 10 92 49 441 2 23 1003 0 67 172 116 196 740 308 0 467 213 250 84 244 268 166 7 1146 8 291 814 2 1400 203 394 11 96 219 6 0 0 0 438 611 305 27 0 2 68 529 15 3 56 267 56 588 25 281 39 11 1571 784 0 99 102 838 127 1176 99 676 858 5046 35 98 1 70 245 660 18 0 98 181 0 266 1 403 144 0 164 300 214 97 0 1729 0 340 39 110 52 11 330 91 142 12 0 233 64 78 73 0 395 18 585 311 67 0 236 301 6 5 8 6 89 133 35 1 786 4436 1 48 25 119 2207 2111 0 398 87 683 1 499 330 75 24 3 0 1175 0 43 934 0 2 37 10 175 46 166 168 103 662 57 100 0 25 391 296 15 33 1671 623 0 49 112 1648 58 0 5 286 117 0 212 159 193 75 0 0 2659 17 7 190 404 2 572 61 251 0 0 119 0 35 0 19 216 509 535 742 56 50 256 162 441 1241 0 0 0 0 0 0 0 0 0 0 0 0 0 0 0 0 0 0 0 0 0 0 0 0 0 0 0 0 0 0 0 0 0 0 0 0 0 0 0 0 0 0 0 0 0 0 0 0 0 0 0 0 0 0 0 0 0 0 0 0 0 0 0 0 0 0 0 0 0 0 0 0 0 0 0 0 0 0 0 0 0 0 0 0 0 0 0 0 0 0 0 0 0 0 0 0 0 0 0 0 0 0 0 0 0 0 0 0 0 0 0 0 0 0 0 0 0 0 0 0 0 0 0 0 0 0 0 0 0 0 0 0 0 0 0 0 0 0 0 0 0 0 0 0 0 0 0 0 0 0 0 0 0 0 0 0 0 0 0 0 0 0 0 0 0 0 0 0 0 0 0 0 0 0 0 0 0 0 0 0 0 0 0 0 0 0 0 0 0 0 0 0 0 0 0 0 0 0 0 0 0 0 0 0 0 0 0 0 0 0 0 0 0 0 0 0 0 0 0 0 0 0 0 0 0 0 0 0 0 0 0 0 0 0 0 0 0 0 0 0 0 0 0 0 0 0 0 0 0 0 0 0 0 0 0 0 0 0 0 0 0 0 0 0 0 0 0 0 0 0 0 0 0 0 0 0 0 0 0 0 0 0 0 0 0 0 0 0 0 0 0 0 0 0 0 0 0 0 0 0 0 0 0 0 0 0 0 0 0 0 0 0 0 0 0 0 0 0 0 0 0 0 0 0 0 0 0 0 0 0 0 0 0 0 0 0 0 0 0 0 0 0 0 0 0 0 0 0 0 0 0 0 0 0 0 0 0 0 0 0 0 0 0 0 0 0 0 0 0 0 0 0 0 0 0 0 0 0 0 0 0 0 0 0 0 0 0 0 0 0 0 0 0 0 0 0 0 0 0 0 0 0 0 0 0 0 0 0 0 0 0 0 0 0 0 0 0 0 0 0 0 0 0 0 0 0 0 0 0 0 0 0 0 0 0 0 0 0 0 0 0 0 0 0 0 0 0 0 0 0 0 0 0 0 0 0 0 0 0 0 0 0 0 0 0 0 0 0 0 0 0 0 0 0 0 0 0 0 0 0 0 0 0 0 0 0 0 0 0 0 0 0 0 0 0 0 0 0 0 0 0 0 0 0 0 0 0 0 0 0 0 0 0 0 0 0 0 0 0 0 0 0 0 0 0 0 0 0 0 0 0 0 0 0 0 0 0 0 0 0 0 0 0 0 0 0 0 0 0 0 0 0 0 0 0 0 0 0 0 0 0 0 0 0 0 0 0 0 0 0 0 0 0 0 0 0 0 0 0 0 0 0 0 0 0 0 0 0 0 0 0 0 0 0 0 0 0 0 0 0 0 0 0 0 0 0 0 0 0 0 0 0 0 0 0 0 0 0 0 0 0 0 0 0 0 0 0 0 0 0 0 0 0 0 0 0 0 0 0 0 0 0 0 0 0 0 0 0 0 0 0 0 0 0 0 0 0 0 0 0 0 0 0 0 0 0 0 0 0 0 0 0 0 0 0 0 0 0 0 0 0 0 0 0 0 0 0 0 0 0 0 0 0 0 0 0 0 0 0 0 0 0 0 0 0 0 0 0 0 0 0 0 0 0 0 0 0 0 0 0 0 0 0 0 0 0 0 0 0 0 0 0 0 0 0 0 0 0 0 0 0 0 0 0 0 0 0 0 0 0 0 0 0 0 0 0 0 0 0 0 0 0 0 0 0 0 0 0 0 0 0 0 0 0 0 0 0 0 0 0 0 0 0 0 0 0 0 0 0 0 0 0 0 0 0 0 0 0 0 0 0 0 0 0 0 0 0 0 0 0 0 0 0 0 0 0 0 0 0 0 0 0 0 0 0 0 0 0 0 0 0 0 0 0 0 0 0 0 0 0 0 0 0 0 0 0 0 0 0 0 0 0 0 0 0 0 0 0 0 0 0 0 0 0 0 0 0 0 0 0 0 0 0 0 0 0 0 0 0 0 0 0 0 0 0 0 0 0 0 0 0 0 0 0 0 0 0 0 0 0 0 0 0 0 0 0 0 0 0 0 0 0 0 0 0 0 0 0 0 0 0 0 0 0 0 0 0 0 0 0 0 0 0 0 0 0 0 0 0 0 0 0 0 0 0 0 0 0 0 0 0 0 0 0 0 0 0 0 0 0 0 0 0 0 0 0 0 0 0 0 0 0 0 0 0 0 0 0 0 0 0 0 0 0 0 0 0 0 0 0 0 0 0 0 0 0 0 0 0 0 0 0 0 0 0 0 0 0 0 0 0 0 0 0 0 0 0 0 0 0 0 0 0 0 0 0 0 0 0 0 0 0 0 0 0 0 0 0 0 0 0 0 0 0 0 0 0 0 0 0 0 0 0 0 0 0 0 0 0 0 0 0 0 0 0 0 0 0 0 0 0 0 0 0 0 0 0 0 0 0 0 0 0 0 0 0 0 0 0 0 0 0 0 0 0 0 0 0 0 0 0 0 0 0 0 0 0 0 0 0 0 0 0 0 0 0 0 0 0 0 0 0 0 0 0 0 0 0 0 0 0 0 0 0 0 0 0 0 0 0 0 0 0 0 0 0 0 0 0 0 0 0 0 0 0 0 0 0 0 0 0 0 0 0 0 0 0 0 0 0 0 0 0 0 0 0 0 0 0 0 0 0 0 0 0 0 0 0 0 0 0 0 0 0 0 0 0 0 0 0 0 0 0 0 0 0 0 0 0 0 0 0 0 0 0 0 0 0 0 0 0 0 0 0 0 0 0 0 0 0 0 0 0 0 0 0 0 0 0 0 0 0 0 0 0 0 0 0 0 0 0 0 0 0 0 0 0 0 0 0 0 0 0 0 0 0 0 0 0 0 0 0 0 0 0 0 0 0 0 0 0 0 0 0 0 0 0 0 0 0 0 0 0 0 0 0 0 0 0 0 0 0 0 0 0 0 0 0 0 0 0 0 0 0 0 0 0 0 0 0 0 0 0 0 0 0 0 0 0 0 0 0 0 0 0 0 0 0 0 0 0 0 0 0 0 0 0 0 0 0 0 0 0 0 0 0 0 0 0 0 0 0 0 0 0 0 0 0 0 0 0 0 0 0 0 0 0 0 0 0 0 0 0 0 0 0 0 0 0 0 0 0 0 0 0 0 0 0 0 0 0 0 0 0 0 0 0 0 0 0 0 0 0 0 0 0 0 0 0 0 0 0 0 0 0 0 0 0 0 0 0 0 0 0 0 0 0 0 0 0 0 0 0 0 0 0 0 0 0 0 0 0 0 0 0 0 0 0 0 0 0 0 0 0 0 0 0 0 0 0 0 0 0 0 0 0 0 0 0 0 0 0 0 0 0 0 0 0 0 0 0 0 0 0 0 0 0 0 0 0 0 0 0 0 0 0 0 0 0 0 0 0 0 0 0 0 0 0 0 0 0 0 0 0 0 0 0 0 0 0 0 0 0 0 0 0 0 0 0 0 0 0 0 0 0 0 0 0 0 0 0 0 0 0 0 0 SPP182 Bacteria;Firmicutes;Clostridia;Clostridiales;Lachnospiraceae_[XIV];Lachnoanaerobaculum;multispecies_spp182_2 1 25 2 0 0 0 0 3 0 0 0 2 0 0 0 20 0 0 110 34 0 0 0 2 16 0 0 1 0 2 19 2 13 0 16 0 0 44 0 0 0 0 24 0 0 1 1 0 0 9 0 0 6 0 0 0 21 18 0 46 0 1 0 0 0 0 2 0 11 0 14 0 0 0 2 18 0 0 10 6 0 14 1 27 0 0 22 0 0 0 0 0 7 9 1 2 1 3 14 0 1 9 0 0 0 0 0 0 2 1 0 0 0 0 0 0 0 1 0 4 0 0 29 0 43 1 0 0 7 10 49 3 2 2 0 3 0 16 0 0 0 0 6 2 1 76 0 15 9 0 1 0 6 0 0 30 32 3 4 0 15 7 3 0 0 0 2 40 3 0 0 0 1 18 0 0 1 0 5 37 0 0 7 100 9 12 0 0 0 0 41 0 55 1 0 1 0 1 24 2 0 108 2 0 0 0 1 4 0 0 1 2 5 0 0 84 0 0 1 15 0 0 0 17 0 1 1 0 0 7 169 1 0 0 4 1 4 4 1 0 4 10 4 0 3 29 16 0 6 0 53 0 0 2 0 0 0 12 0 0 4 2 0 0 0 3 4 0 0 45 5 4 2 0 17 2 19 10 33 0 207 98 109 45 68 11 0 36 12 113 167 18 22 2 66 110 43 39 0 39 27 37 249 48 8 0 48 1 194 1 157 41 12 0 20 13 0 65 0 0 0 0 11 0 28 0 0 0 0 2 3 7 10 1 2 0 0 1 1 0 1 0 0 6 1 1 0 3 13 0 13 6 0 16 151 0 4 12 0 1 135 7 0 4 0 6 1 13 99 0 64 0 3 77 21 15 0 0 1 2 1 0 98 38 0 8 74 41 0 1 6 99 0 212 2 18 21 0 1 73 1 0 26 57 33 1 0 37 0 0 3 70 0 516 43 1 4 0 0 33 1 0 43 4 0 67 3 11 0 0 0 20 22 69 5 62 39 1 29 0 26 4 3 1 44 0 0 64 87 36 86 0 29 0 0 8 0 4 0 44 71 2 2 30 1 1 0 67 3 0 131 125 1 223 0 1 4 3 3 99 8 0 0 4 157 17 168 95 0 184 12 51 9 125 239 46 22 10 6 194 74 3 0 0 94 0 1 4 1 0 18 170 2 1 1 3 12 67 1 128 1 10 0 0 3 6 0 44 1 9 0 9 75 28 23 0 21 21 1 8 4 5 14 61 0 1 49 1 1 122 76 7 24 2 18 1 2 2 98 194 15 33 50 36 20 15 0 0 6 39 12 0 0 26 47 0 15 0 2 1 0 6 4 0 27 13 38 3 33 1 3 0 0 15 4 68 0 28 0 10 0 61 2 42 71 0 0 0 14 62 18 31 13 3 3 1 24 0 40 4 40 15 0 43 54 138 70 1 3 55 33 9 0 6 58 20 1 0 2 1 2 116 45 169 43 8 0 8 1 2 0 2 0 23 9 1 0 0 0 68 10 0 25 32 71 36 11 6 19 0 0 149 19 26 0 1 28 3 7 1 0 12 47 0 0 22 28 57 18 37 3 17 0 15 1 176 0 15 0 1 66 55 9 0 5 2 2 136 5 79 15 7 37 2 0 0 3 0 3 0 1 17 49 18 0 3 46 41 0 14 79 19 0 1 21 0 9 10 163 26 0 31 137 0 2 0 1 26 56 4 35 5 23 4 58 6 26 48 8 177 13 61 168 2 20 0 124 14 7 54 45 0 313 73 0 6 39 0 29 48 7 49 0 54 1 4 219 14 3 1 5 19 7 0 1 6 101 0 161 1 23 35 6 0 7 1 0 55 6 0 17 0 0 0 9 21 2 0 10 46 9 1 2 2 0 0 24 14 37 8 6 54 3 0 2 8 46 227 8 19 235 12 23 67 4 11 0 3 3 0 0 84 0 2 52 10 150 2 13 0 24 9 8 64 14 0 21 105 47 31 7 44 63 135 3 1 92 3 158 18 5 46 2 25 6 27 53 6 52 142 63 17 3 0 8 63 0 6 21 4 12 1 18 3 17 0 45 60 505 50 73 66 0 65 59 30 0 0 1 0 2 2 5 12 15 0 0 47 7 30 71 5 7 0 0 37 2 98 17 12 32 0 159 36 0 13 62 3 8 0 87 0 164 31 0 33 42 0 0 0 2 117 0 193 0 4 2 4 5 4 2 63 0 17 33 0 424 38 4 87 1 1 46 82 0 250 0 38 143 85 39 2 105 135 65 185 743 6 4 3 13 82 3 88 36 321 0 1 0 0 0 13 0 3 80 2 7 0 0 13 2 0 5 141 21 0 1 40 25 0 10 57 2 87 20 27 0 11 22 0 77 15 36 106 15 0 23 24 0 2 15 3 0 6 0 2 71 50 0 3 14 4 11 1 17 55 0 5 4 12 11 7 12 7 8 30 18 5 40 0 12 19 11 3 1 28 1 5 4 0 0 10 17 8 0 10 0 4 24 7 23 6 49 3 2 6 5 0 22 2 5 14 5 5 39 11 12 13 3 46 36 0 74 8 27 1 151 18 2 40 9 5 1 2 4 14 6 3 4 13 13 7 0 26 9 18 4 28 1 5 43 4 3 26 26 15 6 3 5 2 20 6 20 11 12 1 5 98 2 5 44 3 0 0 33 0 0 2 0 8 6 241 3 32 81 10 18 17 2 5 23 0 28 38 3 20 13 49 15 2 56 2 5 12 4 9 1 22 6 14 33 24 6 12 6 1 1 32 14 7 4 14 14 23 2 0 3 34 8 14 0 22 34 1 57 35 0 5 4 9 1 3 66 12 3 9 16 50 31 30 0 10 82 42 40 5 25 3 0 39 95 34 11 8 45 0 54 17 6 35 10 0 2 5 10 5 18 3 66 29 4 12 10 9 10 0 65 8 25 8 58 21 0 24 1 8 24 12 0 3 18 7 12 34 2 16 40 6 12 47 50 1 0 18 12 0 8 0 9 22 46 79 432 3 0 3 1 28 31 48 14 11 91 53 1 20 2 4 131 2 17 22 16 59 41 5 18 0 0 15 12 9 17 5 9 28 57 3 0 13 7 73 15 21 129 13 63 9 17 2 131 47 5 18 114 3 13 6 32 108 2 14 19 3 35 4 1 9 7 0 38 16 14 10 0 5 3 17 9 14 23 6 21 47 10 0 10 12 14 2 0 3 1 9 34 26 19 60 1 7 17 9 4 11 9 14 7 53 12 140 17 7 1 54 11 12 6 14 7 64 3 1 28 9 2 9 0 19 4 5 16 10 6 15 4 30 12 18 123 3 11 10 0 8 30 9 8 18 0 6 2 5 8 0 25 12 5 7 2 7 11 3 1 12 0 21 10 0 77 58 0 0 0 2 134 5 7 12 96 13 25 67 43 2 48 94 33 8 1 15 9 33 5 6 0 37 8 0 25 23 3 1 68 1 4 53 36 0 0 26 0 0 8 14 2 53 56 18 28 15 12 4 18 14 28 3 0 9 16 6 10 20 1 6 10 10 47 16 32 7 0 17 18 0 12 5 23 1 8 0 12 18 8 21 16 3 12 4 0 0 1 5 6 3 22 104 29 34 0 0 45 16 0 6 20 17 3 46 13 128 62 17 7 0 7 7 0 17 11 6 8 2 0 27 2 6 0 6 33 0 18 17 1 45 26 8 2 12 14 1 0 3 0 16 98 1 19 37 47 5 1 2 11 0 15 11 0 28 25 8 50 24 0 22 2 0 0 49 12 0 11 32 2 43 57 6 3 50 93 32 20 6 22 0 0 6 0 3 2 50 27 25 14 125 14 2 1 7 9 16 20 24 17 19 14 24 28 6 20 1 0 0 0 59 13 0 30 4 7 16 28 6 20 30 18 20 18 37 16 49 52 124 3 3 5 9 3 9 29 89 2 89 16 79 75 8 137 65 60 57 7 35 4 12 84 11 194 14 0 1 5 0 2 0 8 32 1 78 9 9 2 0 0 54 15 1 0 0 0 39 22 10 91 1 20 5 76 15 0 15 39 4 8 16 2 2 24 43 42 23 0 0 60 41 12 5 5 35 0 0 9 8 56 10 13 33 31 15 135 1 19 0 1 5 0 0 14 2 7 7 40 2 5 0 SPP186 Bacteria;Bacteroidetes;Bacteroidia;Bacteroidales;Prevotellaceae;Prevotella;multispecies_spp186_3 0 0 0 0 0 0 0 0 0 0 0 0 0 0 0 0 0 0 0 0 0 0 0 0 0 0 0 0 0 0 0 0 0 0 0 0 0 0 0 0 0 0 0 0 0 0 0 0 0 0 0 0 0 0 0 0 0 0 0 0 0 0 0 0 0 0 0 0 0 0 0 0 0 0 0 0 0 0 0 0 0 0 0 0 0 0 0 0 0 0 0 0 0 0 0 0 0 0 0 0 0 0 0 0 0 0 0 0 0 0 0 0 0 0 0 0 0 0 0 0 0 0 0 0 0 0 0 0 0 0 0 0 0 0 0 0 0 0 0 0 0 0 0 0 0 0 0 0 0 0 0 0 0 0 0 0 0 0 0 0 0 0 0 0 0 0 0 0 0 0 0 0 0 0 0 0 0 0 0 0 0 0 0 0 0 0 0 0 0 0 0 0 0 0 0 0 0 0 0 0 0 0 0 0 0 0 0 0 0 0 0 0 0 0 0 0 0 0 0 0 0 0 0 0 0 0 0 0 0 0 0 0 0 0 0 0 0 0 0 0 0 0 0 0 0 0 0 0 0 0 0 0 0 0 0 0 0 0 0 0 0 0 0 0 0 0 0 0 0 57 30 0 4 8 79 0 4 19 160 0 87 54 2140 66 6 122 40 451 20 233 143 0 3 0 0 72 1 69 0 248 53 0 1171 664 42 3 514 3 17 0 0 0 114 0 186 0 0 0 3 375 0 4 2 0 368 0 0 0 1 0 0 105 0 0 0 0 0 0 1 0 0 70 0 0 0 0 0 4 0 0 83 2 0 4 6 0 0 15 0 0 0 3 0 2 0 1 0 0 5 0 4 0 61 10 0 0 1 0 0 2 1 0 2 0 0 6 1 368 0 0 0 47 0 8 0 6 4 0 1 1 1 0 89 67 0 0 0 14 18 0 0 0 8 31 0 0 0 0 43 0 2 441 50 208 1 121 3 0 0 0 0 7 4 83 0 119 17 0 15 0 66 0 30 2 0 116 0 0 14 14 364 1 161 11 0 5 1 0 0 177 100 78 0 0 0 3 2 72 0 0 130 12 0 1 0 1 95 230 0 21 0 16 301 190 390 186 18 36 0 37 93 235 456 576 324 1 0 7 36 148 731 3 0 20 4 0 3 1 28 175 49 1021 0 0 0 0 0 15 0 0 0 5 0 1 0 7 0 0 0 0 0 0 1 4 0 0 1 1 0 1 0 29 215 46 0 0 45 313 0 947 213 27 1 10 1 0 0 0 0 65 0 366 165 340 265 350 0 5 0 10 0 0 0 14 3 4 0 0 0 0 0 0 0 0 20 57 0 0 0 0 2334 0 436 0 0 39 13 5 0 0 0 117 0 9 0 1 0 3 2 12 0 0 0 0 0 0 21 0 1 0 0 0 38 0 0 49 128 0 1 8 2 0 0 0 2 15 400 0 1 6 12 5 32 73 28 0 0 65 353 95 1 10 180 6 0 1487 352 1 0 226 112 1 61 41 16 0 15 0 2 0 0 67 0 3 0 0 0 0 2 0 0 8 147 0 1 9 181 0 0 5 0 0 0 27 0 96 0 7 9 0 0 1 9 53 1 4 106 81 76 138 0 1 33 11 0 0 0 0 0 45 0 1 25 1 0 47 0 12 1 3 300 553 131 6 3 20 2 1 46 195 0 54 194 0 2 0 0 2 39 0 264 15 24 2 21 9 1 7 1 3 4 98 26 0 0 0 29 15 4 958 2 0 1 22 0 0 4 0 17 379 173 0 0 94 0 0 3173 0 0 0 0 0 17 46 0 9 11 0 254 1 0 0 0 16 0 0 0 0 310 0 1 1073 0 0 0 15 0 0 4 11 7 262 217 0 0 21 294 2 0 0 15 22 0 0 0 253 4 134 10 0 38 73 0 1 71 1 80 29 14 0 0 285 0 0 0 0 353 120 101 0 4 0 8 564 4 0 225 70 5 1 0 26 1 16 345 0 130 11 34 6 4 10 0 102 78 0 1 2 43 0 12 0 1 1 0 0 8 0 95 26 23 0 4 297 1 2 0 9 14 12 14 14 0 86 12 1 0 4 5 14 0 4 7 8 12 9 0 2 1 0 1 0 41 101 774 5 59 444 0 36 26 0 1 19 0 9 309 10 6 43 347 2 457 38 0 35 92 0 26 0 4 31 0 361 0 8 0 0 8 2 93 1 0 138 64 2 319 137 298 596 7 8 1396 136 0 163 0 150 7 129 63 0 233 8 0 1 514 19 33 3 0 2 0 1 4 400 0 0 2 0 0 4 0 0 0 2 0 0 6 18 0 1 0 20 85 0 2 123 158 1 40 177 0 88 306 21 168 2 346 7 356 0 13 41 4 2 98 115 6 11 16 1 46 329 16 45 26 30 0 38 40 1 4 0 5 1200 16 8 2 1 45 43 3 0 0 19 27 1 237 0 76 0 114 0 4 46 0 0 6 57 5 287 59 7 0 52 1 4 61 3 1 30 10 0 1 9 0 0 21 0 3 0 0 48 0 30 40 2 0 38 29 4 644 2 0 12 37 0 0 1 13 28 27 50 2 0 173 26 47 35 147 2 0 129 56 8 0 80 1 1 46 8 0 439 132 3 10 5 4 78 3 0 3 8 3 2 3 70 0 21 10 107 24 31 70 3 15 2 11 5 0 237 3 0 98 0 0 9 9 6 337 9 21 92 9 19 17 18 4 2 112 12 7 338 0 42 13 22 18 15 87 6 2 6 30 7 0 121 64 0 30 60 346 7 89 50 71 38 146 223 5 61 52 94 170 63 8 71 30 28 2 12 28 0 9 0 1 2 0 36 0 14 6 16 35 2 14 14 10 28 505 192 2 21 30 25 55 51 8 9 38 2 1 70 20 2 4 9 0 438 2 0 1 5 394 33 39 7 22 0 9 15 10 804 18 17 52 0 5 77 2 77 3 1 0 1 17 6 59 106 0 3 0 55 114 85 12 1 0 0 9 163 0 4 0 130 0 2 0 53 21 0 9 92 0 0 0 0 113 10 115 3 69 242 104 9 2 0 0 1 0 1 1 0 11 1 14 0 0 79 2 0 84 37 308 31 109 10 127 1 0 16 10 15 108 7 4 1 2 4 0 99 4 1 0 0 5 8 28 407 4 21 4 1 94 55 2 14 0 1 316 9 1 14 3 0 6 2 3 1 14 0 5 3 474 62 15 217 0 0 225 12 7 2 8 0 286 68 103 0 2427 13 7 128 2 790 1 9 0 12 1003 54 0 441 59 1 0 131 526 1 4 133 2 11 3 2 1 9 92 0 3 294 1081 771 84 20 1 146 19 36 3 59 0 2 30 26 10 1 0 0 0 3 18 1 8 0 0 0 55 2754 5 14 411 2 0 4 21 26 5 6 0 27 542 25 1 2776 49 3 19 3 19 2 66 24 9 83 7 4 42 163 1 5 254 79 0 71 28 49 2 27 5 0 81 52 0 92 26 111 49 21 110 1 7 2 10 22 273 1 8 0 2 534 2 54 14 141 12 3 21 2 19 207 6 0 25 8 7 11 257 5 0 18 0 1 13 1 6 101 79 146 3 16 2 23 236 43 9 97 75 11 1 286 1 2 257 33 136 87 7 118 100 3 6 0 0 0 0 13 11 47 37 1 4 159 1 27 7 1 60 0 63 193 12 69 19 8 6 2 6 8 11 2 2 186 319 2 3 148 14 4 8 171 512 13 7 180 129 9 53 1 202 83 18 12 0 0 0 1094 1 47 3 693 2 6 90 172 0 75 133 1 127 32 91 3 1663 30 13 1041 2 8 10 13 0 14 3 0 556 14 9 38 1 4 0 0 2 4 79 110 220 7 6 0 3 275 2 0 50 5 0 0 6 8 3 7 40 4 9 1 4 234 778 191 0 34 3 1 22 259 61 108 2 1534 31 0 1986 312 355 19 229 227 1 270 1 3 17 12 1 4 3 2 3 7 31 3 12 2359 3 72 383 3 10 14 0 405 133 61 135 1 0 934 31 0 70 1 1058 1 245 34 1 166 107 4 2 86 135 9 47 3 0 4 14 26 359 24 28 0 38 106 0 0 0 74 0 8 63 1 10 13 18 11 3 1 176 23 40 0 17 4 1 1 8 1 11 6 SPP188 Bacteria;Bacteroidetes;Bacteroidia;Bacteroidales;Prevotellaceae;Prevotella;multispecies_spp188_2 0 0 0 0 0 0 0 0 0 0 0 0 0 0 0 0 0 0 0 0 0 0 0 0 0 0 0 0 0 0 0 0 0 0 0 0 0 0 0 0 0 0 0 0 0 0 0 0 0 0 0 0 0 0 0 0 0 0 0 0 0 0 0 0 0 0 0 0 0 0 0 0 0 0 0 0 0 0 0 0 0 0 0 0 0 0 0 0 0 0 0 0 0 0 0 0 0 0 0 0 0 0 0 0 0 0 0 0 0 0 0 0 0 0 0 0 0 0 0 0 0 0 0 0 0 0 0 0 0 0 0 0 0 0 0 0 0 0 0 0 0 0 0 0 0 0 0 0 0 0 0 0 0 0 0 0 0 0 0 0 0 0 0 0 0 0 0 0 0 0 0 0 0 0 0 0 0 0 0 0 0 0 0 0 0 0 0 0 0 0 0 0 0 0 0 0 0 0 0 0 0 0 0 0 0 0 0 0 0 0 0 0 0 0 0 0 0 0 0 0 0 0 0 0 0 0 0 0 0 0 0 0 0 0 0 0 0 0 0 0 0 0 0 0 0 0 0 0 0 0 0 0 0 0 0 0 0 0 0 0 0 0 0 0 0 0 0 0 0 0 4 0 0 1 0 0 0 1 3 0 2 2 88 28 0 0 0 0 0 0 1 0 0 0 0 0 0 0 0 0 0 0 150 10 1 0 14 0 0 0 0 2 0 0 3 0 0 0 0 1 0 0 13 0 1 0 0 0 0 0 0 0 0 0 0 0 0 0 0 0 0 1 0 0 0 0 0 0 0 0 0 0 0 0 1 0 1 0 0 0 0 0 0 0 0 0 0 0 0 0 0 0 0 0 0 0 0 0 0 0 0 0 0 0 0 0 0 2 0 0 0 0 0 0 0 0 0 0 0 0 0 0 0 0 0 0 0 0 1 0 2 0 0 0 0 0 0 0 0 0 0 1 0 0 0 0 0 0 0 0 0 0 0 0 0 1 2 1 0 0 0 0 0 0 0 1 0 0 0 0 6 0 1 0 0 0 0 0 0 0 0 0 0 0 0 0 0 0 0 0 1 0 0 0 0 0 12 49 0 0 0 0 1 3 153 4 0 1 0 1 3 0 2 4 1 0 0 0 0 0 4 0 0 0 0 0 0 0 0 0 2 8 0 0 2 0 0 0 0 0 0 0 0 0 0 0 0 0 0 0 0 0 0 0 0 0 0 0 0 0 0 0 0 0 0 0 1 56 0 2 2 0 0 0 0 0 0 0 0 0 0 2 0 5 4 3 0 0 0 0 1 0 0 0 0 0 0 0 0 0 0 0 0 0 6 0 0 0 0 0 5 0 0 1 0 0 0 0 0 0 0 2 2 1 0 0 0 0 0 0 0 0 0 0 0 0 0 0 0 0 0 0 0 0 0 0 5 0 0 0 0 0 0 0 0 0 1 0 0 0 0 0 1 0 0 0 0 0 1 1 0 0 1 10 1 47 7 0 0 0 1 0 0 8 0 0 7 0 0 0 0 0 0 0 0 0 0 0 0 0 0 0 3 1 5 0 0 0 0 0 0 0 0 0 0 0 0 0 0 0 0 0 0 1 0 0 0 0 1 1 7 0 64 0 0 0 0 0 0 0 0 0 0 1 0 0 0 0 0 0 7 54 0 0 0 0 7 0 0 0 0 1 1 0 0 0 0 0 0 0 1 0 0 0 0 0 0 1 0 0 5 0 3 0 0 0 0 1 0 11 1 0 0 0 0 0 0 0 0 2 2 0 0 0 0 0 0 0 0 0 0 0 0 0 0 0 0 0 2 0 0 0 0 0 0 0 0 0 0 0 0 0 0 0 0 6 0 0 0 1 0 0 0 0 0 1 2 0 0 0 0 0 0 0 0 0 0 0 0 0 0 0 0 0 0 0 0 0 0 0 0 0 0 0 0 0 2 0 0 0 0 0 0 85 0 0 3 0 0 0 0 0 0 0 1 0 0 0 0 15 0 1 0 2 0 0 0 0 1 0 0 0 0 0 0 1 0 0 1 5 0 0 0 0 0 0 1 8 13 2 28 10 0 6 0 0 0 0 0 0 0 0 0 3 0 0 0 0 0 0 0 0 1 0 0 0 3 188 0 1 0 0 0 0 0 0 4 8 0 0 1 0 20 0 0 0 2 0 0 0 1 0 0 3 0 0 0 0 0 0 5 0 0 1 7 0 4 28 2009 11 0 0 2 0 0 0 0 15 2 0 1 0 2 0 0 0 0 0 1 0 0 0 0 0 0 5 0 0 0 0 0 1 0 0 0 0 1 0 0 1 0 0 0 0 0 0 0 0 2 3 0 2 0 9 23 2 1 0 0 0 1 0 0 2 0 2 99 129 0 1 0 0 0 3 0 6 20 0 0 0 0 0 1 0 0 37 0 19 0 0 3 0 1 1 0 1 3 0 50 0 126 0 2 0 0 6 0 0 0 1 0 13 0 0 0 0 0 0 0 0 0 1 0 0 0 0 0 0 0 0 1 0 0 0 0 4 66 0 0 1 0 0 3 0 1 0 9 17 0 0 0 8 0 1 1 0 0 0 9 0 13 0 0 0 0 2 3 2 0 0 2 0 0 10 120 26 0 0 0 0 3 0 0 1 0 1 7 2 1 3 20 0 0 4 0 0 0 2 0 0 0 0 0 0 1 0 0 0 0 0 99 0 2 23 0 16 0 2 4 0 0 0 0 115 4 1 0 1 0 22 56 1 6 6 5 12 0 2 4 0 1 1 0 2 1 0 14 0 17 8 0 1 1 4 143 30 0 0 0 1 1 2 1 0 1 0 0 0 0 4 0 0 0 0 7 1 12 0 1 0 0 2 0 0 0 0 0 0 0 2 0 0 0 1 6 0 0 0 0 0 0 0 2 7 1 6 9 18 12 0 1 2 0 10 0 1 1 1 0 3 0 2 0 0 2 0 0 0 16 0 1 0 1 5 0 2 0 0 0 0 7 452 0 1 0 0 4 5 0 46 8 1 0 5 0 0 0 0 1 0 12 1 0 2 1 0 1 0 0 0 0 0 0 0 0 1 1 0 0 0 1 4 0 192 3 0 39 0 0 0 0 0 1 17 0 0 0 0 0 0 0 19 5 1 0 0 0 7 0 4 0 1 2 12 0 3 0 0 0 1 24 1 0 0 0 0 0 0 0 0 2 0 0 0 211 3 3 0 0 0 3 0 0 0 1 0 0 5 0 0 9 0 1 16 0 7 0 31 1 3 40 3 2 8 8 0 0 9 9 0 0 91 0 0 6 39 6 1 12 0 0 5 6 0 18 1 1 3 1 1 0 1 0 7 0 0 0 2 0 0 0 0 0 0 1 0 0 0 1 29 0 0 0 0 0 0 0 3 0 1 0 3 2 0 1 14 0 107 2 1 13 2 0 0 1 0 4 0 1 1 0 1 2 0 0 6 34 1 0 14 0 0 0 1 0 3 0 0 0 0 1 0 0 1 0 0 13 5 1 1 0 18 0 2 47 0 0 0 3 4 0 0 5 0 1 2 3 0 0 0 0 0 0 1 17 0 14 1 0 13 1 1 0 17 242 2 2 0 1 0 3 0 0 0 0 58 2 0 0 31 7 4 8 0 0 0 0 1 2 0 0 2 2 14 0 0 8 0 0 1 10 11 2 4 0 0 0 0 0 0 0 0 0 4 19 0 15 134 16 0 0 1 3 1 4 1 5 27 20 0 1 0 0 1 0 0 0 19 0 0 6 22 0 0 21 1 0 9 4 4 1 0 1 0 314 1 0 33 0 2 0 0 4 0 0 0 9 1 0 2 11 0 0 0 2 30 30 2 0 0 1 0 0 63 0 0 7 1 1 0 16 2 0 0 5 0 0 0 0 0 5 4 0 0 0 0 1 1 1 22 0 35 1 0 68 6 2 3 20 30 0 9 0 0 0 0 0 0 0 0 19 0 9 1 1 14 0 2 3 1 5 0 0 14 40 98 2 0 0 1 0 0 3 0 100 0 0 0 0 2 1 0 3 1 0 1 1 0 0 0 0 0 127 9 3 0 6 4 0 0 0 5 0 0 40 1 0 0 3 1 0 0 88 0 1 0 2 3 3 2 11 0 0 0 SPP194 Bacteria;Firmicutes;Clostridia;Negativicutes;Veillonellaceae;Veillonella;multispecies_spp194_2 11 248 15 249 19 142 473 389 17 829 570 104 260 2 57 61 34 183 7 17 73 200 129 970 472 192 49 31 198 284 38 523 377 615 159 262 1013 685 266 48 483 133 75 564 260 4 334 252 458 26 541 258 337 103 543 11 627 189 33 338 37 50 31 2691 488 10 19 675 103 334 2236 88 17 128 381 58 335 183 195 141 52 2 137 17 1131 60 190 552 22 555 223 1218 82 172 121 9 37 26 69 181 488 623 40 356 24 106 307 15 23 81 2255 98 375 154 250 5 5 236 299 0 288 164 588 73 887 39 717 977 1825 57 112 15 16 545 78 77 0 98 131 0 251 1 1108 25 18 9 43 64 467 20 409 17 667 83 8 10 0 195 115 53 33 28 41 31 18 131 53 6 784 31 1295 82 3 58 164 40 29 18 2 255 692 38 171 67 1614 18 1 26 207 1678 314 41 311 175 525 202 527 193 17 54 161 98 412 33 68 484 2 135 77 1517 253 30 174 74 53 449 212 52 45 35 948 139 146 201 611 94 13 34 823 1950 1481 4 88 107 134 9 28 230 25 899 114 46 526 53 38 121 16 13 300 266 614 37 52 11 0 8 58 3 120 282 470 610 54 76 385 184 1070 525 0 0 0 0 0 0 0 0 0 0 0 0 0 0 0 0 0 0 0 0 0 0 0 0 0 0 0 0 0 0 0 0 0 0 0 0 0 0 0 0 0 0 0 0 0 0 0 0 0 0 0 0 0 0 0 0 0 0 0 0 0 0 0 0 0 0 0 0 0 0 0 0 0 0 0 0 0 0 0 0 0 0 0 0 0 0 0 0 0 0 0 0 0 0 0 0 0 0 0 0 0 0 0 0 0 0 0 0 0 0 0 0 0 0 0 0 0 0 0 0 0 0 0 0 0 0 0 0 0 0 0 0 0 0 0 0 0 0 0 0 0 0 0 0 0 0 0 0 0 0 0 0 0 0 0 0 0 0 0 0 0 0 0 0 0 0 0 0 0 0 0 0 0 0 0 0 0 0 0 0 0 0 0 0 0 0 0 0 0 0 0 0 0 0 0 0 0 0 0 0 0 0 0 0 0 0 0 0 0 0 0 0 0 0 0 0 0 0 0 0 0 0 0 0 0 0 0 0 0 0 0 0 0 0 0 0 0 0 0 0 0 0 0 0 0 0 0 0 0 0 0 0 0 0 0 0 0 0 0 0 0 0 0 0 0 0 0 0 0 0 0 0 0 0 0 0 0 0 0 0 0 0 0 0 0 0 0 0 0 0 0 0 0 0 0 0 0 0 0 0 0 0 0 0 0 0 0 0 0 0 0 0 0 0 0 0 0 0 0 0 0 0 0 0 0 0 0 0 0 0 0 0 0 0 0 0 0 0 0 0 0 0 0 0 0 0 0 0 0 0 0 0 0 0 0 0 0 0 0 0 0 0 0 0 0 0 0 0 0 0 0 0 0 0 0 0 0 0 0 0 0 0 0 0 0 0 0 0 0 0 0 0 0 0 0 0 0 0 0 0 0 0 0 0 0 0 0 0 0 0 0 0 0 0 0 0 0 0 0 0 0 0 0 0 0 0 0 0 0 0 0 0 0 0 0 0 0 0 0 0 0 0 0 0 0 0 0 0 0 0 0 0 0 0 0 0 0 0 0 0 0 0 0 0 0 0 0 0 0 0 0 0 0 0 0 0 0 0 0 0 0 0 0 0 0 0 0 0 0 0 0 0 0 0 0 0 0 0 0 0 0 0 0 0 0 0 0 0 0 0 0 0 0 0 0 0 0 0 0 0 0 0 0 0 0 0 0 0 0 0 0 0 0 0 0 0 0 0 0 0 0 0 0 0 0 0 0 0 0 0 0 0 0 0 0 0 0 0 0 0 0 0 0 0 0 0 0 0 0 0 0 0 0 0 0 0 0 0 0 0 0 0 0 0 0 0 0 0 0 0 0 0 0 0 0 0 0 0 0 0 0 0 0 0 0 0 0 0 0 0 0 0 0 0 0 0 0 0 0 0 0 0 0 0 0 0 0 0 0 0 0 0 0 0 0 0 0 0 0 0 0 0 0 0 0 0 0 0 0 0 0 0 0 0 0 0 0 0 0 0 0 0 0 0 0 0 0 0 0 0 0 0 0 0 0 0 0 0 0 0 0 0 0 0 0 0 0 0 0 0 0 0 0 0 0 0 0 0 0 0 0 0 0 0 0 0 0 0 0 0 0 0 0 0 0 0 0 0 0 0 0 0 0 0 0 0 0 0 0 0 0 0 0 0 0 0 0 0 0 0 0 0 0 0 0 0 0 0 0 0 0 0 0 0 0 0 0 0 0 0 0 0 0 0 0 0 0 0 0 0 0 0 0 0 0 0 0 0 0 0 0 0 0 0 0 0 0 0 0 0 0 0 0 0 0 0 0 0 0 0 0 0 0 0 0 0 0 0 0 0 0 0 0 0 0 0 0 0 0 0 0 0 0 0 0 0 0 0 0 0 0 0 0 0 0 0 0 0 0 0 0 0 0 0 0 0 0 0 0 0 0 0 0 0 0 0 0 0 0 0 0 0 0 0 0 0 0 0 0 0 0 0 0 0 0 0 0 0 0 0 0 0 0 0 0 0 0 0 0 0 0 0 0 0 0 0 0 0 0 0 0 0 0 0 0 0 0 0 0 0 0 0 0 0 0 0 0 0 0 0 0 0 0 0 0 0 0 0 0 0 0 0 0 0 0 0 0 0 0 0 0 0 0 0 0 0 0 0 0 0 0 0 0 0 0 0 0 0 0 0 0 0 0 0 0 0 0 0 0 0 0 0 0 0 0 0 0 0 0 0 0 0 0 0 0 0 0 0 0 0 0 0 0 0 0 0 0 0 0 0 0 0 0 0 0 0 0 0 0 0 0 0 0 0 0 0 0 0 0 0 0 0 0 0 0 0 0 0 0 0 0 0 0 0 0 0 0 0 0 0 0 0 0 0 0 0 0 0 0 0 0 0 0 0 0 0 0 0 0 0 0 0 0 0 0 0 0 0 0 0 0 0 0 0 0 0 0 0 0 0 0 0 0 0 0 0 0 0 0 0 0 0 0 0 0 0 0 0 0 0 0 0 0 0 0 0 0 0 0 0 0 0 0 0 0 0 0 0 0 0 0 0 0 0 0 0 0 0 0 0 0 0 0 0 0 0 0 0 0 0 0 0 0 0 0 0 0 0 0 0 0 0 0 0 0 0 0 0 0 0 0 0 0 0 0 0 0 0 0 0 0 0 0 0 0 0 0 0 0 0 0 0 0 0 0 0 0 0 0 0 0 0 0 0 0 0 0 0 0 0 0 0 0 0 0 0 0 0 0 0 0 0 0 0 0 0 0 0 0 0 0 0 0 0 0 0 0 0 0 0 0 0 0 0 0 0 0 0 0 0 0 0 0 0 0 0 0 0 0 0 0 0 0 0 0 0 0 0 0 0 0 0 0 0 0 0 0 0 0 0 0 0 0 0 0 0 0 0 0 0 0 0 0 0 0 0 0 0 0 0 0 0 0 0 0 0 0 0 0 0 0 0 0 0 0 0 0 0 0 0 0 0 0 0 0 0 0 0 0 0 0 0 0 0 0 0 0 0 0 0 0 0 0 0 0 0 0 0 0 0 0 0 0 0 0 0 0 0 0 0 0 0 0 0 0 0 0 0 0 0 0 0 0 0 0 0 0 0 0 0 0 0 0 0 0 0 0 0 0 0 0 0 0 0 0 0 0 0 0 0 0 0 0 0 0 0 0 0 0 0 0 0 0 0 0 0 0 0 0 0 0 0 0 0 0 0 0 0 0 0 0 0 0 0 0 0 0 0 0 0 0 0 0 0 0 0 0 0 0 0 0 0 0 0 0 0 0 0 0 0 0 0 0 0 0 0 0 0 0 0 0 0 0 0 0 0 0 0 0 0 0 0 0 0 0 0 0 0 0 0 0 0 0 0 0 0 0 0 0 0 0 0 0 0 0 0 0 0 0 0 0 0 0 0 0 0 0 0 0 0 0 0 0 0 0 0 0 0 0 0 0 0 0 0 0 0 0 0 0 0 0 0 0 0 0 0 0 0 0 0 0 0 0 0 0 0 0 0 0 0 0 0 0 0 0 0 SPP198 Bacteria;Bacteroidetes;Bacteroidia;Bacteroidales;Prevotellaceae;Prevotella;multispecies_spp198_2 0 1 0 0 0 4 5 0 1 7 0 2 0 0 0 0 0 0 0 0 0 0 0 0 0 0 0 0 0 0 0 0 0 0 0 0 0 0 0 0 0 0 0 0 0 0 0 0 0 0 0 0 0 0 0 0 0 0 0 0 0 0 0 0 0 0 0 0 0 0 0 0 0 0 0 0 1 0 0 0 0 0 0 1 0 0 0 0 0 0 1 0 0 0 0 0 0 0 0 0 0 8 0 0 0 9 0 0 0 0 0 0 0 0 0 0 0 0 0 0 0 0 0 0 0 0 0 0 0 0 0 0 0 0 0 0 0 0 0 0 0 0 0 5 0 0 0 0 0 0 0 0 0 0 0 0 0 0 0 0 0 0 0 0 0 0 0 0 0 0 0 0 0 0 0 0 0 0 0 0 0 0 0 0 0 0 0 0 0 0 0 0 0 0 0 0 0 0 0 0 0 0 18 0 0 0 0 0 2 0 1 0 0 0 0 0 0 0 0 0 0 0 0 0 0 4 0 0 0 6 0 0 0 0 0 0 0 0 0 0 0 0 0 0 0 0 0 0 0 0 0 0 0 0 0 0 0 0 0 0 0 0 0 20 0 0 0 0 0 6 17 0 0 8 23 0 70 31 5 0 46 20 1 2 3 0 0 23 29 57 13 14 0 0 64 41 33 0 0 32 16 0 96 16 4 0 17 0 4 0 24 16 0 1 0 0 0 14 0 0 0 0 1 0 244 0 0 0 0 0 0 8 0 0 1 0 0 0 0 0 10 0 0 12 1 93 0 17 0 0 0 0 0 5 0 0 0 3 0 0 0 0 0 0 0 0 0 2 0 0 0 0 0 29 0 0 0 0 0 298 0 0 0 1 0 2 0 31 0 0 23 0 0 34 0 1 149 0 5 88 0 0 0 23 0 0 0 6 3 0 0 0 0 10 182 0 113 0 312 0 1 1 6 2 0 0 27 0 1 0 1 0 0 1 0 2 39 0 1 0 0 3 1 1 266 0 0 0 24 18 104 0 33 0 0 0 2 1 0 33 0 0 0 39 0 0 0 10 0 1 16 93 0 29 25 1 101 0 0 54 26 1 0 1 68 71 77 9 0 0 18 0 0 447 803 0 0 21 0 58 10 12 0 0 15 0 0 0 1 0 0 4 0 0 0 0 1 22 0 0 0 8 0 0 5 21 0 2 0 0 0 60 135 12 58 0 6 121 0 480 0 5 74 0 5 0 6 0 0 72 17 1 0 15 62 7 0 66 0 0 0 0 6 128 8 55 0 2 0 5 0 0 0 0 0 0 109 0 1 0 0 4 1 0 0 42 17 0 0 0 0 0 3 3 0 66 0 142 0 0 0 685 0 0 4 1 0 0 0 62 0 16 108 2 0 6 0 0 0 9 24 0 0 2 0 0 1 0 38 35 0 0 0 252 95 128 2 0 52 34 4 72 48 230 110 0 0 0 0 0 0 17 0 0 0 0 8 0 0 0 3 0 59 16 44 1 42 0 0 0 0 0 0 78 0 0 3 0 2 0 0 35 94 0 0 7 9 0 42 12 37 0 1 6 2 0 0 8 0 0 225 63 1 15 0 2 4 0 0 32 9 0 73 6 0 4 2 0 0 0 1 20 106 0 0 0 36 6 18 35 0 13 0 22 5 26 34 23 115 33 2 373 21 23 1 0 0 57 491 0 42 0 0 0 1 0 42 102 0 105 4 282 564 0 0 0 3 198 0 48 78 1 12 87 0 4 3 54 233 195 0 0 0 0 0 0 0 1 0 0 5 4 0 5 0 3 1 0 0 0 0 0 0 0 0 1 6 5 127 0 0 0 0 0 3 0 0 0 10 2 0 1 0 17 0 0 0 10 41 0 1 15 0 0 6 9 0 0 8 2 361 2 26 44 6 0 0 0 129 0 0 11 0 1 219 1 35 0 5 0 1 3 0 157 1 9 0 192 143 28 2 34 3 250 0 0 222 0 15 0 7 0 0 0 0 0 0 4 382 50 0 38 0 62 54 191 1 0 5 0 23 2 4 0 0 0 4 22 341 1 85 8 0 0 0 5 0 0 94 0 2 192 0 9 0 0 0 258 35 0 0 3 0 0 0 0 0 28 50 140 15 9 0 60 0 5 80 16 0 48 140 0 40 9 0 47 0 0 0 0 2 0 0 591 0 25 1 55 64 21 0 60 0 147 112 1 181 6 1 32 26 0 23 66 0 31 0 7 207 188 43 0 2 24 0 8 158 9 0 3 0 15 0 0 3 280 0 1 0 0 0 0 0 0 0 0 0 0 2 0 0 0 1 0 5 0 29 137 0 0 7 0 0 12 1 0 1 8 6 0 2 4 0 45 138 0 27 2 0 0 6 8 0 0 0 0 46 9 0 0 108 1 0 0 7 0 0 0 0 0 8 6 0 0 0 1 15 0 25 0 1 998 0 0 1 9 3 0 5 1 3 0 0 0 0 1 1 0 0 0 8 0 10 0 0 0 7 0 0 2 4 0 0 36 0 4 0 0 2 0 0 0 3 0 0 0 0 27 0 29 1 0 1 1 0 0 4 0 0 1 10 0 0 20 0 0 0 2 4 0 0 0 0 7 34 0 0 4 0 0 1 22 4 0 3 0 0 0 0 20 0 5 50 0 1 18 0 0 0 0 0 23 7 0 0 8 0 0 0 0 2 0 23 209 15 0 1 1 0 27 172 0 0 3 0 14 0 17 28 0 75 4 0 2 3 2 0 72 41 0 0 5 0 0 0 3 0 0 1 1 0 10 4 0 22 10 0 0 0 5 2 0 0 3 0 0 0 129 28 0 0 2 0 40 5 0 0 9 0 64 203 0 0 12 26 0 17 2 0 19 5 0 0 0 10 0 0 0 0 24 2 0 19 12 1 0 5 0 0 0 35 48 0 0 1 0 8 3 0 6 1 2 0 2 1 1 28 6 0 0 0 0 0 0 0 0 0 0 2 0 13 0 1 12 0 0 0 0 0 40 0 0 0 6 0 129 20 0 15 29 3 0 28 7 0 11 8 0 0 0 0 0 8 16 10 0 33 5 0 37 9 0 0 0 2 8 2 0 0 1 0 0 0 0 196 23 0 0 0 0 1 10 0 2 0 14 0 0 11 0 0 4 73 0 0 0 0 1 0 0 0 0 0 0 0 0 0 0 0 0 0 0 38 0 10 2 0 39 8 0 0 0 1 0 26 0 0 10 127 0 1 1 0 0 0 0 0 0 0 0 7 3 0 0 10 0 0 0 6 1 57 58 0 34 83 0 0 0 42 3 41 0 103 247 0 1 3 2 0 6 0 11 3 0 0 0 2 0 2 14 0 0 1 0 0 9 21 0 0 3 0 0 67 2 0 5 21 0 6 56 0 15 0 0 20 76 26 3 6 28 28 2 0 0 0 0 16 0 5 31 2 0 105 1 0 13 159 0 0 26 1 0 24 2 0 45 24 0 1 0 4 9 0 0 5 0 0 0 0 2 0 10 1 32 0 7 6 0 11 0 0 10 0 0 5 24 0 0 0 0 166 0 0 32 0 0 0 0 0 0 0 33 0 1 3 0 314 7 4 0 0 88 0 8 11 0 0 48 0 0 47 3 0 0 0 0 0 2 21 1 10 0 0 0 5 9 0 1 3 0 14 7 0 41 58 0 0 2 4 0 0 7 0 43 26 2 0 104 12 0 0 0 21 0 7 11 0 0 0 0 0 19 0 0 1 10 0 5 0 0 0 0 0 0 29 51 0 12 32 0 0 7 0 0 0 0 0 2 14 0 16 2 0 451 0 0 0 14 0 19 0 11 30 0 17 2 1 0 0 0 32 2 1 82 51 8 17 1 0 0 1 0 0 0 3 0 16 0 0 0 1 2 0 0 0 0 2 0 1 0 0 3 8 24 0 3 34 0 36 0 0 0 0 8 592 0 0 0 0 49 23 1 0 0 71 40 1 49 0 9 1 0 0 6 4 1 5 0 0 1 9 0 18 0 17 3 83 4 0 7 0 0 8 14 25 0 0 0 0 2 0 0 0 0 0 0 15 285 0 0 32 9 0 0 0 0 0 0 0 0 0 4 0 2 0 0 6 0 0 3 0 0 2 0 SPP20 Bacteria;Firmicutes;Bacilli;Lactobacillales;Streptococcaceae;Streptococcus;multispecies_spp20_3 0 0 0 0 0 0 0 0 0 0 0 0 0 0 0 0 0 0 0 0 0 0 0 0 0 0 0 0 0 0 0 0 0 0 0 0 0 0 0 0 0 0 0 0 0 0 0 0 0 0 0 0 0 0 0 0 0 0 0 0 0 0 0 0 0 0 0 0 0 0 0 0 0 0 0 0 0 0 0 0 0 0 0 0 0 0 0 0 0 0 0 0 0 0 0 0 0 0 0 0 0 0 0 0 0 0 0 0 0 0 0 0 0 0 0 0 0 0 0 0 0 0 0 0 0 0 0 0 0 0 0 0 0 0 0 0 0 0 0 0 0 0 0 0 0 0 0 0 0 0 0 0 0 0 0 0 0 0 0 0 0 0 0 0 0 0 0 0 0 0 0 0 0 0 0 0 0 0 0 0 0 0 0 0 0 0 0 0 0 0 0 0 0 0 0 0 0 0 0 0 0 0 0 0 0 0 0 0 0 0 0 0 0 0 0 0 0 0 0 0 0 0 0 0 0 0 0 0 0 0 0 0 0 0 0 0 0 0 0 0 0 0 0 0 0 0 0 0 0 0 0 0 0 0 0 0 0 0 0 0 0 0 0 0 0 0 0 0 0 0 0 0 1 0 0 0 0 0 0 0 0 0 0 0 0 0 0 0 0 0 0 0 0 0 0 0 0 0 0 0 0 0 0 0 0 0 0 0 0 1 0 0 0 0 0 0 0 0 0 0 0 0 0 0 0 0 0 0 0 0 0 0 0 0 0 0 0 0 0 0 0 0 0 0 0 0 0 0 0 0 0 0 0 0 0 1 0 0 0 0 0 0 0 0 0 0 0 0 0 0 0 0 0 0 0 0 0 0 0 0 0 0 0 0 0 0 0 0 0 0 0 0 0 0 0 0 0 0 0 0 0 0 0 0 172 0 0 0 0 0 0 0 0 0 0 0 0 0 0 0 0 0 0 0 0 0 0 0 0 0 0 0 0 0 0 0 0 0 0 0 0 0 0 0 0 0 0 0 0 0 0 0 0 0 4065 0 0 0 0 0 0 0 0 0 0 0 0 0 0 0 0 0 0 0 0 0 0 0 0 0 0 0 0 1163 0 0 0 0 0 0 0 0 3193 0 0 0 0 0 0 0 0 0 0 0 0 0 0 0 0 0 0 0 0 0 0 0 0 0 0 0 0 0 0 0 0 0 0 0 0 0 0 0 0 0 0 0 0 0 0 0 0 0 0 0 0 0 0 0 0 0 0 0 0 0 0 0 0 0 0 0 0 0 0 0 0 0 0 0 0 0 0 0 0 0 0 0 0 0 0 0 0 0 0 0 0 0 0 0 0 0 0 0 0 0 0 0 0 0 0 0 0 0 0 0 0 0 0 0 0 0 0 0 0 0 0 0 0 0 0 0 0 0 0 0 0 0 0 0 0 0 0 0 0 0 0 0 0 0 0 0 0 0 0 0 0 0 0 0 0 0 0 0 0 0 0 0 0 0 0 0 0 0 0 442 0 0 0 0 0 0 0 0 0 0 0 0 0 0 0 0 0 0 0 0 0 0 0 0 0 0 0 0 0 0 0 0 0 0 0 0 0 0 0 0 0 0 0 0 0 0 0 0 0 0 0 0 0 0 0 0 0 0 0 0 0 0 0 0 0 0 0 0 0 0 1 0 0 0 0 0 0 0 0 0 0 0 0 0 0 0 0 0 0 0 0 0 0 0 0 0 0 0 0 0 0 0 0 0 0 0 0 0 0 0 0 0 0 0 0 0 0 0 0 0 0 0 0 0 0 0 0 0 0 0 0 0 0 0 0 0 0 0 0 0 0 0 0 0 0 0 0 0 0 0 0 0 0 0 0 0 0 0 0 0 0 0 0 0 0 0 0 0 0 0 0 0 0 0 0 0 0 0 0 0 0 0 0 0 0 0 0 0 0 0 0 0 0 0 0 0 0 0 0 0 0 0 0 0 0 0 0 0 0 0 0 0 0 0 0 0 0 0 0 0 0 0 0 0 0 0 0 0 0 0 0 0 0 0 0 0 0 0 0 0 0 0 0 0 0 0 0 0 0 0 0 0 0 0 0 0 0 0 0 1 0 0 0 0 0 0 0 0 0 0 0 0 0 0 0 0 0 0 0 0 0 0 0 0 0 0 0 0 0 738 0 0 0 0 0 0 0 2 0 0 0 0 0 0 0 0 0 0 0 0 0 0 0 0 0 0 0 0 0 0 0 0 0 0 0 0 0 0 0 0 0 0 0 0 0 0 0 0 0 0 0 0 0 0 0 0 0 0 0 0 0 0 0 0 0 0 0 0 0 0 0 0 0 0 0 0 0 0 0 0 0 0 0 0 0 0 0 0 0 0 0 0 0 0 2 0 0 0 0 0 4 0 0 0 0 10 0 0 0 0 0 0 0 0 0 0 0 0 0 0 0 0 0 0 0 0 0 0 0 0 0 0 0 0 0 0 0 0 0 0 0 1 0 0 1 1 0 0 0 0 0 0 0 0 0 0 0 0 0 0 0 0 0 0 0 0 0 0 0 15 0 0 0 0 0 0 0 0 0 0 0 0 0 0 0 0 0 0 0 0 0 0 0 0 0 0 0 0 0 0 0 0 0 0 0 0 0 0 0 0 0 0 0 0 0 0 0 0 0 0 0 0 0 0 0 0 0 0 0 0 0 0 0 0 0 0 0 0 0 0 0 0 0 0 0 0 0 0 0 0 0 0 0 0 0 0 0 0 0 0 0 0 0 0 0 0 0 0 0 0 0 0 0 0 0 0 0 0 0 0 0 0 0 0 0 0 0 0 0 0 0 0 0 0 0 0 0 0 0 0 0 0 0 0 0 0 0 0 0 0 0 0 0 0 0 0 0 0 0 0 0 0 0 0 0 0 0 0 0 0 0 0 0 0 0 0 0 0 0 0 0 0 0 0 0 0 0 0 0 0 0 0 0 0 0 0 0 0 0 0 0 0 0 0 0 0 0 0 0 0 0 0 0 0 0 0 0 0 0 0 0 0 0 0 0 0 0 0 0 0 0 0 0 0 0 0 0 0 0 0 0 0 0 0 0 0 0 0 0 0 0 0 0 0 0 0 0 0 0 0 0 0 0 0 0 0 0 0 0 0 0 0 0 0 0 0 0 0 0 0 0 0 0 0 0 0 0 0 0 0 1 0 0 0 0 0 1 1 0 0 0 0 0 1 0 0 0 0 0 0 0 0 0 0 0 0 0 0 0 0 0 0 0 0 0 0 0 0 0 0 0 0 0 0 0 0 0 0 0 0 0 0 0 0 0 0 0 0 0 0 0 0 0 0 0 0 0 0 0 19 0 0 0 0 0 0 0 0 0 0 0 0 0 0 0 0 0 0 0 0 0 0 0 0 0 0 0 0 0 0 0 0 0 0 0 0 0 0 0 0 0 6 0 0 0 0 0 0 0 0 0 0 0 0 0 0 0 0 0 0 0 0 0 0 0 0 0 0 0 0 0 0 0 0 0 0 0 0 0 0 0 0 0 0 0 0 0 0 0 0 0 0 0 0 0 0 0 0 0 0 0 0 0 0 0 0 0 0 0 0 0 0 0 0 0 0 0 0 0 0 0 0 0 0 0 0 0 0 0 0 0 0 0 0 0 0 0 0 0 0 0 0 0 0 0 0 0 0 0 0 0 0 0 0 0 0 0 0 0 0 0 0 0 0 0 0 0 0 0 0 0 0 0 0 0 0 0 0 0 0 0 0 0 0 0 0 0 0 0 0 0 0 0 0 0 0 0 0 0 0 0 0 0 0 0 0 0 0 0 0 0 0 0 0 0 0 0 0 0 0 0 0 0 0 0 0 0 0 0 0 0 0 0 0 0 0 0 0 0 0 0 0 0 0 0 0 0 0 0 0 0 0 0 0 0 0 0 0 0 0 0 0 0 0 0 0 0 0 0 0 0 0 0 0 0 0 0 0 0 0 0 0 0 0 0 0 0 0 0 0 0 0 0 0 0 0 0 0 0 0 0 0 0 0 0 0 0 0 0 0 0 0 0 0 0 0 0 0 0 0 0 0 0 0 0 0 0 0 0 0 0 0 0 0 0 0 0 0 0 0 0 0 0 0 0 0 0 0 0 0 SPP211 Bacteria;Firmicutes;Bacilli;Lactobacillales;Enterococcaceae;Enterococcus;multispecies_spp211_2 0 0 0 0 0 0 0 0 0 0 0 0 0 0 0 0 0 0 0 0 0 0 0 0 0 0 0 0 0 0 0 0 0 0 0 0 0 0 0 0 0 0 0 0 0 0 0 0 0 0 0 0 0 0 0 0 0 0 0 0 0 0 0 0 0 0 0 0 0 0 0 0 0 0 0 0 0 0 0 0 0 0 0 0 0 0 0 0 0 0 0 0 0 0 0 0 0 0 0 0 0 0 0 0 0 0 0 0 0 0 0 0 0 0 0 0 0 0 0 0 0 0 0 0 0 0 0 0 0 0 0 0 0 0 0 0 0 0 0 0 0 0 0 0 0 0 0 0 0 0 0 0 0 0 0 0 0 0 0 0 0 0 0 0 0 0 0 0 0 0 0 0 0 0 0 0 0 0 0 0 0 0 0 0 0 0 0 0 0 0 0 0 0 0 0 0 0 0 0 0 0 0 0 0 0 0 0 0 0 0 0 0 0 0 0 0 0 0 0 0 0 0 0 0 0 0 0 0 0 0 0 0 0 0 0 0 0 0 0 0 0 0 0 0 0 0 0 0 0 0 0 0 0 0 0 0 0 0 0 0 0 0 0 0 0 0 0 0 1 6 6 12 6 15 7 0 0 8 9 4 5 6 1 9 20 58 11 10 34 26 1 53 25 0 2 14 34 12 0 19 53 3 11 9 0 32 57 51 8 49 2 4 0 18 37 5 0 10 11 5 2 5 29 0 17 0 0 0 0 0 0 20 0 43 2 0 0 0 23 0 0 5 0 1 15 1 12 13 7 1 2 18 19 9 10 26 0 6 0 0 86 55 2 17 9 9 0 16 3 0 22 9 1 13 12 9 2 3 12 23 4 0 4 4 0 4 5 24 0 13 11 0 0 5 2 11 44 0 9 11 4 0 3 12 5 12 0 9 13 22 25 12 27 0 10 2 24 0 2 1 30 13 12 6 1 7 22 0 5 5 11 20 10 6 31 26 13 0 21 0 3 0 2 50 8 34 0 0 7 10 2 14 20 1 5 41 21 13 0 6 13 3 2 2 0 52 11 6 0 0 12 8 3 0 26 17 26 61 10 26 4 26 3 5 10 15 3 9 0 7 11 6 1 7 8 0 33 13 6 27 12 0 5 13 2 0 4 18 0 1 7 17 1 1 1 1 5 10 1 0 6 38 7 42 13 6 1 9 7 27 0 1 2 6 22 0 10 29 12 10 15 1 4 1 0 34 2 29 0 9 11 2 14 16 0 1 0 29 57 12 24 12 0 2 2 1 0 22 1 8 10 0 6 20 7 2 3 2 0 0 2 11 3 0 24 3 14 0 19 0 18 0 17 13 0 9 11 29 0 0 0 2 2 10 5 34 0 29 34 21 0 9 2 0 28 7 17 13 13 1 6 44 72 1 7 4 1 3 23 21 3 1 36 1 19 7 4 0 2 0 13 28 26 1 9 8 0 17 0 3 21 25 9 3 1 8 16 27 2 4 11 35 1 9 16 3 25 50 10 26 0 3 145 2 0 2 6 10 10 0 7 2 7 1 1 4 3 3 2 3 12 4 63 2 23 1 0 8 6 77 0 9 25 60 16 21 13 9 18 21 4 11 15 2 2 49 1 1 2 2 4 29 8 0 3 20 15 11 5 23 15 35 6 1 13 2 12 8 23 31 0 2 12 11 16 0 0 19 11 10 8 18 3 0 23 2 4 11 0 11 5 7 0 7 22 4 12 26 6 20 20 0 13 9 0 28 5 0 1 9 23 19 0 8 3 4 25 1 19 22 0 3 82 21 7 8 21 0 9 4 9 7 2 2 0 2 11 0 30 2 29 23 1 6 0 11 6 0 0 16 26 31 15 3 0 0 2 48 71 7 1 0 7 0 0 13 0 12 14 31 3 8 6 47 37 8 1 16 31 0 101 30 9 3 5 51 22 12 70 1 39 0 17 9 1 0 4 4 11 2 2 4 0 19 5 2 1 11 14 8 2 5 4 19 12 2 14 21 33 8 32 38 1 16 45 6 11 0 7 14 11 1 1 0 13 0 35 20 2 7 5 19 0 1 7 7 0 22 11 4 10 0 13 2 10 16 2 15 4 0 6 1 2 2 17 14 41 12 7 34 14 9 25 29 1 8 34 1 7 1 40 3 22 6 17 16 9 19 4 0 25 10 1 8 8 0 25 6 2 0 12 9 9 86 5 24 2 12 10 4 5 16 36 13 23 19 0 5 4 3 4 3 13 5 28 6 3 3 25 24 0 2 0 0 17 13 0 3 0 0 0 5 0 8 0 9 0 0 64 73 10 3 0 27 17 0 11 6 4 4 16 18 3 5 21 19 9 8 14 11 10 2 20 23 15 9 35 41 0 13 42 2 25 4 8 7 36 7 0 1 3 5 13 4 5 10 6 10 1 2 8 16 23 11 4 15 2 23 8 0 11 3 26 67 4 16 5 4 7 2 6 3 4 18 14 14 0 0 5 6 4 17 0 6 8 1 10 0 43 4 2 2 3 2 9 17 36 10 9 41 2 18 10 2 4 45 2 4 3 20 28 0 11 12 7 19 31 9 63 16 51 5 0 6 14 69 4 12 0 6 5 1 20 19 4 2 10 11 16 15 26 9 6 54 8 2 5 11 6 3 15 14 2 30 12 5 10 4 7 37 25 17 3 3 2 10 8 7 4 10 52 3 6 4 12 5 17 6 32 22 11 4 13 46 4 21 10 6 13 7 8 18 0 53 13 0 4 24 10 17 13 8 4 26 11 2 1 34 4 1 2 16 3 8 20 7 11 5 2 7 1 6 5 5 2 5 11 0 5 8 3 22 20 11 23 5 4 11 5 13 3 10 18 2 8 1 14 8 10 22 2 16 4 6 7 0 26 5 13 13 12 10 3 1 2 3 15 3 30 1 13 9 7 27 8 5 4 7 15 6 11 5 12 5 3 8 2 6 18 22 7 2 2 7 15 49 3 11 1 49 64 29 34 7 93 18 14 18 2 27 29 3 3 20 5 21 7 11 3 1 7 37 7 20 39 27 57 4 8 0 12 15 12 6 39 27 38 10 11 13 6 55 14 250 17 13 49 20 31 27 2 5 18 16 30 8 54 11 26 40 1 40 22 11 0 7 7 9 0 7 167 12 12 17 0 2 10 16 6 17 17 7 4 2 18 4 36 24 21 3 19 4 3 6 3 0 35 3 0 4 5 15 8 5 7 18 50 26 13 43 0 4 15 22 58 14 8 14 1 44 13 39 7 36 45 172 45 50 38 7 3 13 66 30 11 39 5 9 5 0 8 17 4 6 28 3 8 33 33 28 8 7 10 5 10 11 1 3 2 11 17 6 0 8 16 10 1 15 45 31 19 38 35 8 19 4 5 41 29 2 16 72 10 4 14 21 8 6 1 14 18 55 130 76 15 32 22 23 42 32 37 45 24 30 34 19 12 69 33 13 0 24 44 12 17 23 6 11 30 26 11 2 10 28 3 6 12 22 16 1 46 10 7 2 16 11 12 7 13 40 16 10 24 3 13 0 42 6 2 23 33 6 7 12 4 5 7 2 10 22 8 24 4 1 5 6 52 19 1 21 9 8 8 2 11 9 20 25 8 22 19 18 5 4 13 6 26 7 10 4 16 3 5 9 3 5 6 3 13 10 13 12 24 14 14 20 14 4 5 8 2 17 9 10 37 53 21 11 3 8 8 24 13 16 26 18 50 38 30 34 22 9 17 16 3 8 4 25 14 43 12 17 4 22 26 11 0 18 48 37 31 15 82 12 0 34 45 9 17 39 32 5 15 4 10 4 43 5 23 12 18 16 4 25 57 103 65 83 3 17 8 0 17 6 35 2 34 6 64 41 13 6 3 10 14 18 2 3 3 0 8 7 0 2 0 17 3 3 52 16 30 21 19 5 46 3 26 32 42 48 85 14 12 16 18 57 47 34 2 62 28 29 6 86 34 31 9 5 6 6 0 15 11 3 9 6 2 2 9 3 2 19 29 8 2 3 16 5 2 14 5 14 7 12 14 13 7 1 16 21 8 10 8 30 7 2 5 15 0 0 29 25 71 13 4 16 11 2 93 8 9 0 7 18 42 5 4 11 29 3 29 4 2 19 SPP28 Bacteria;Bacteroidetes;Bacteroidia;Bacteroidales;Porphyromonadaceae;Porphyromonas;multispecies_spp28_4 0 0 0 0 0 0 0 0 0 0 0 0 0 0 0 0 0 0 0 0 0 0 0 0 0 0 0 0 0 0 0 0 0 0 0 0 0 0 0 0 0 0 0 0 0 0 0 0 0 0 0 0 0 0 0 0 0 0 0 0 0 0 0 0 0 0 0 0 0 0 0 0 0 0 0 0 0 0 0 0 0 0 0 0 0 0 0 0 0 0 0 0 0 0 0 0 0 0 0 0 0 0 0 0 0 0 0 0 0 0 0 0 0 0 0 0 0 0 0 0 0 0 0 0 0 0 0 0 0 0 0 0 0 0 0 0 0 0 0 0 0 0 0 0 0 0 0 0 0 0 0 0 0 0 0 0 0 0 0 0 0 0 0 0 0 0 0 0 0 0 0 0 0 0 0 0 0 0 0 0 0 0 0 0 0 0 0 0 0 0 0 0 0 0 0 0 0 0 0 0 0 0 0 0 0 0 0 0 0 0 0 0 0 0 0 0 0 0 0 0 0 0 0 0 0 0 0 0 0 0 0 0 0 0 0 0 0 0 0 0 0 0 0 0 0 0 0 0 0 0 0 0 0 0 0 0 0 0 0 0 0 0 0 0 0 0 0 0 0 2 0 0 16 0 10 0 23 30 21 0 52 9 2 23 16 0 2 0 0 18 164 6 55 0 15 5 11 11 0 3 4 68 2 0 0 0 12 0 31 0 6 8 1 0 1 1 0 196 0 0 0 0 0 0 2 0 0 0 0 0 0 1 0 0 0 0 0 1 9 0 0 37 0 10 40 1 0 2 110 0 69 9 0 0 250 366 0 0 1 0 28 4 0 5 5 0 0 7 97 0 136 0 0 14 63 20 6 0 1 144 0 0 3 15 0 52 192 34 1 13 0 2 0 87 313 1 5 0 0 75 0 0 22 14 19 0 0 25 18 0 1 6 0 0 4 4 26 0 152 0 0 0 2 0 0 1 7 0 1 1 0 14 8 23 0 5 25 0 0 0 3 1 19 0 0 25 0 0 55 3 5 0 51 0 0 5 0 0 0 33 0 0 0 1 0 22 0 19 4 4 73 1 0 43 4 15 12 0 24 5 36 0 0 1 92 13 104 280 1 0 13 9 41 339 210 0 30 45 0 1 155 0 0 0 73 0 0 35 0 0 0 0 0 0 0 0 3 2 3 0 0 5 0 3 8 27 0 23 1 0 0 110 367 0 72 0 24 142 9 11 0 0 0 0 7 18 3 0 167 2 2 1 14 2 88 0 0 11 0 22 0 7 26 1 21 25 0 0 0 0 0 0 0 4 0 59 651 0 3 0 0 12 8 0 0 119 14 0 0 0 0 0 0 11 0 0 0 2 0 0 0 4 0 0 25 1 0 2 6 33 3 2 79 3 1 40 8 0 39 94 0 107 0 2 53 1 198 0 2 5 168 17 0 1206 71 247 3 0 3 1 14 6 16 362 180 0 0 102 6 1 5 61 0 144 214 0 0 0 29 1 75 0 5 36 4 67 15 0 8 2 0 9 0 66 0 3 9 0 1 0 0 48 63 1 0 12 6 0 29 9 24 0 0 1 21 2 0 0 0 1 3 27 0 2 67 1 0 0 0 1 0 0 14 0 1 23 49 0 0 0 0 12 45 301 0 0 67 121 30 1 59 0 59 6 211 1 3 2 58 38 0 10 27 1 1 0 52 8 162 11 0 57 138 0 100 156 49 159 0 64 245 50 194 1 82 0 50 24 0 8 29 90 22 99 0 1 18 0 3 321 0 11 0 308 0 24 13 2 22 0 5 188 0 47 0 0 86 0 0 5 1 0 1 0 0 4 24 0 1 6 158 0 3 0 0 237 0 0 3 37 0 0 3 7 0 0 0 24 0 0 0 34 4 0 2 0 96 6 1 0 240 0 2 8 0 0 0 2 17 0 0 1 1 101 94 2 341 1 1 0 0 0 16 10 0 1 6 39 23 51 4 50 45 0 0 0 40 0 76 0 17 1 0 5 61 0 0 0 147 6 3 0 0 0 1 0 0 0 72 15 0 0 0 0 0 0 0 27 149 23 33 5 0 151 99 12 0 0 0 66 2 0 67 777 34 0 0 35 19 211 10 407 12 50 0 2 1 18 1 12 2 6 5 12 0 21 10 0 45 68 0 0 21 48 0 12 9 0 2 0 3 64 0 13 0 1 32 35 54 395 26 176 0 47 100 2 0 0 0 1 0 0 22 41 0 1 0 24 0 13 56 1 0 2 0 34 117 1 1 2 3 42 25 0 0 1 0 28 0 0 0 2 0 4 137 12 0 0 0 0 5 0 11 8 0 0 42 20 1 0 9 8 0 6 0 0 0 1 25 0 21 5 0 20 6 2 27 40 12 4 20 19 0 0 1 0 21 7 0 1 0 0 0 0 4 0 0 1 35 0 53 6 0 0 4 18 161 0 22 0 0 3 22 0 0 20 0 0 5 0 1 6 26 3 0 1 16 18 0 13 3 0 66 12 0 11 1 0 3 0 5 0 0 17 0 1 0 0 4 11 1 0 77 3 14 0 0 34 0 55 12 0 10 180 0 0 1 12 0 1 0 0 0 5 27 0 0 19 32 0 11 3 0 1 20 0 0 37 32 0 0 2 20 2 7 1 18 8 1 108 0 0 0 3 39 0 0 9 0 0 0 31 8 18 20 50 0 7 0 3 0 0 15 57 9 0 32 17 0 42 12 1 2 0 3 8 2 24 9 0 18 4 0 11 2 0 0 19 46 0 0 10 5 0 0 1 0 15 6 62 0 21 8 1 122 20 0 2 2 0 0 29 53 0 1 2 0 33 18 0 0 6 0 32 97 0 1 8 0 95 63 0 3 37 26 0 41 31 1 31 0 0 15 37 22 0 173 277 0 26 11 0 7 5 0 0 17 1 0 4 224 23 0 35 0 2 2 13 0 28 2 11 0 104 1 1 15 46 2 51 92 28 0 6 28 0 6 160 1 0 0 34 95 76 0 68 36 1 1 91 0 0 109 6 2 178 24 2 57 36 22 0 31 41 0 23 17 0 0 1 5 0 5 146 21 0 56 0 0 43 8 0 0 0 57 120 1 48 0 0 38 6 2 0 69 43 14 9 4 18 5 80 0 7 29 26 0 0 1 14 0 3 159 0 0 19 0 12 55 0 1 1 0 49 4 0 0 4 0 0 0 10 105 0 0 19 0 0 4 0 0 16 13 4 23 0 0 18 364 0 35 309 0 0 0 0 0 246 6 0 0 1 1 21 51 0 0 0 13 4 30 5 0 46 91 0 0 0 5 186 0 15 59 20 0 13 8 2 2 52 0 5 2 0 0 19 18 0 0 4 0 4 23 0 0 84 70 0 0 29 0 0 1 11 0 1 0 5 118 86 0 12 78 8 52 1 7 0 0 5 8 0 1 1 0 0 3 0 1 15 16 1 12 1 0 6 0 0 0 56 2 0 136 1 0 0 16 0 38 0 7 17 6 0 24 1 0 1 1 0 0 64 22 170 0 9 17 0 18 1 1 80 0 0 108 62 0 0 37 0 23 2 15 80 35 21 1 0 176 0 9 8 1 2 2 0 18 6 2 0 14 66 0 38 10 0 8 0 0 0 67 3 0 4 0 8 0 184 22 0 41 0 1 5 5 15 0 2 5 0 11 86 0 62 7 0 1 4 34 0 4 90 0 7 90 8 0 17 75 0 0 0 3 0 19 37 0 130 1 0 7 4 0 0 47 22 0 45 3 0 113 0 5 0 47 95 0 36 5 0 1 9 1 2 0 0 0 3 1 0 134 78 0 123 0 0 76 115 6 24 0 9 151 0 18 98 0 4 9 16 2 2 4 153 31 0 0 0 0 0 5 1 0 2 11 2 16 0 38 52 35 7 0 0 0 0 26 1 6 0 0 0 2 11 0 1 34 0 65 0 0 27 4 3 8 0 0 0 1 3 0 6 1 0 158 3 2 20 0 28 34 0 1 31 24 0 0 3 0 7 46 0 100 8 7 0 2 7 0 3 0 0 33 8 0 4 6 5 0 73 2 0 0 6 32 0 63 34 0 0 173 3 0 0 0 0 29 85 0 0 3 2 0 16 2 0 31 0 0 42 28 1 0 0 SPP29 Bacteria;Bacteroidetes;Bacteroidia;Bacteroidales;Porphyromonadaceae;Porphyromonas;multispecies_spp29_2 0 0 0 0 0 0 0 0 0 0 0 0 0 0 0 0 0 0 0 0 0 0 0 0 0 0 0 0 0 0 0 0 0 0 0 0 0 0 0 0 0 0 0 0 0 0 0 0 0 0 0 0 0 0 0 0 0 0 0 0 0 0 0 0 0 0 0 0 0 0 0 0 0 0 0 0 0 0 0 0 0 0 0 0 0 0 0 0 0 0 0 0 0 0 0 0 0 0 0 0 0 0 0 0 0 0 0 0 0 0 0 0 0 0 0 0 0 0 0 0 0 0 0 0 0 0 0 0 0 0 0 0 0 0 0 0 0 0 0 0 0 0 0 0 0 0 0 0 0 0 0 0 0 0 0 0 0 0 0 0 0 0 0 0 0 0 0 0 0 0 0 0 0 0 0 0 0 0 0 0 0 0 0 0 0 0 0 0 0 0 0 0 0 0 0 0 0 0 0 0 0 0 0 0 0 0 0 0 0 0 0 0 0 0 0 0 0 0 0 0 0 0 0 0 0 0 0 0 0 0 0 0 0 0 0 0 0 0 0 0 0 0 0 0 0 0 0 0 0 0 0 0 0 0 0 0 0 0 0 0 0 0 0 0 0 0 0 0 0 222 6 5 41 0 40 17 35 426 395 3 631 258 0 22 1945 920 241 364 0 729 203 262 763 134 593 990 323 110 0 1110 41 7 928 272 70 2 242 0 443 22 104 56 1 1 481 39 6 206 1 0 4 6 396 0 296 4 9 0 8 0 0 887 6 169 1 0 1 8 1 1 0 18 0 6 11 0 9 2 1 2 44 400 16 11 0 1 0 111 6 52 746 696 0 916 2 0 0 6 334 0 729 181 308 477 37 11 2 0 35 331 0 0 346 78 1 1 23 38 0 6 72 5 0 388 40 133 568 1 86 325 251 0 3 969 30 4 0 803 1 1 539 818 1 828 263 4 246 0 183 0 567 52 649 15 1 119 18 0 2 19 16 90 191 552 0 335 89 9 8 0 8 0 106 8 6 175 0 22 312 371 86 166 1222 0 1 298 0 108 0 299 63 1 61 36 4 69 0 672 2 0 409 76 14 2108 399 0 335 78 54 240 57 322 4 15 1229 145 462 423 0 631 30 0 14 453 251 0 0 0 48 656 874 67 185 129 274 0 86 19 10 0 41 522 0 0 3 3 8 276 2 0 8 618 70 108 7 51 0 768 138 290 1 139 562 0 310 0 180 1 4 13 14 69 560 152 11 1 310 31 0 2 24 19 19 152 40 0 2 76 174 827 0 251 665 190 43 74 3 1 2 297 7 1 5 239 1 16 63 0 6 0 2 74 103 0 10 1723 39 1 178 0 3 0 229 4 13 548 0 200 1 0 0 355 24 119 525 189 1 2 443 249 480 32 349 3 168 89 162 0 96 54 7 378 197 5 126 91 173 2 119 203 356 1 2 1 165 277 60 0 1 11 8 1546 471 387 339 47 0 167 35 1 92 224 1 17 2 140 241 263 102 167 16 15 16 9 84 15 19 33 179 791 3 215 5 44 3 107 1238 2 5 6 0 145 380 41 8 70 121 7 27 328 103 198 5 496 29 140 2 0 0 87 12 45 14 42 243 37 189 0 5 1160 43 0 660 180 2 391 58 0 1 2 0 50 205 547 0 3 1070 912 62 95 189 50 0 12 169 0 153 27 450 421 16 22 689 1 28 0 1 79 164 12 264 8 211 8 47 73 76 223 15 1626 424 406 60 193 398 2 122 199 0 530 120 4 940 394 1 420 636 10 120 4 44 647 0 68 0 12 422 6 88 5 6 177 45 252 0 360 2060 0 0 0 299 0 11 0 2 3 105 4 1085 221 273 1 223 2 13 106 3 1 1 733 14 30 25 7 0 0 0 468 62 40 63 167 183 0 12 65 1 2012 406 67 189 17 297 2 29 0 17 594 899 1 4 1004 15 2 174 12 2 409 173 0 53 2 108 407 75 32 76 111 1527 292 2 34 3 536 120 5 94 22 427 75 6 30 14 355 1787 0 11 1 519 339 412 338 1 1 121 22 5 1 1067 5 776 0 134 0 61 7 63 1132 1019 208 535 1176 0 574 62 285 0 294 830 1 13 3 5 980 125 0 0 425 216 0 199 2 67 148 0 82 36 472 121 3 405 0 515 89 0 85 764 1 4 15 37 0 1067 521 0 399 235 1001 56 1 20 974 3 658 7 6 0 130 115 39 24 184 0 99 7 0 342 89 67 231 0 0 122 86 0 436 0 198 176 119 107 0 406 386 1240 170 83 8 94 0 18 52 10 1951 0 1186 0 59 52 2 3 365 0 1 63 22 6 0 13 6 0 5 7 570 929 0 190 233 95 19 446 216 45 406 194 72 87 304 403 0 415 21 202 1816 1134 3 774 158 22 7 139 124 0 12 12 2 709 276 0 82 254 103 38 0 242 56 1 252 19 11 95 255 298 277 206 359 95 135 781 1 94 253 471 98 176 291 15 78 80 193 2 43 51 80 33 285 8 55 156 24 118 0 71 63 289 33 13 4 189 25 49 75 69 297 114 61 23 131 44 370 24 9 1050 8 324 29 198 253 38 269 353 10 207 379 23 39 180 145 1 43 261 31 0 135 120 521 38 166 31 158 991 108 65 75 39 107 47 261 402 12 402 106 533 311 216 33 177 477 146 191 841 391 885 7 377 479 91 192 1 21 251 1189 309 129 638 281 279 200 0 36 74 1 106 102 23 36 268 254 766 218 292 2 24 63 222 89 4 97 24 30 652 194 19 802 122 45 8 53 298 139 2 258 108 269 215 70 13 943 147 171 17 228 146 0 134 371 1 210 42 226 21 90 56 35 137 558 50 374 205 52 6 425 847 271 244 72 677 58 0 357 217 11 27 186 87 12 451 513 198 137 131 0 34 172 354 16 186 147 24 235 108 378 105 86 33 0 100 179 344 62 506 293 0 389 51 2 243 42 1 119 238 26 5 259 412 120 251 156 49 546 510 35 31 407 104 6 95 14 70 633 209 589 237 243 3 89 29 118 166 193 470 16 213 995 306 38 172 29 499 97 661 279 643 473 145 846 728 118 2 12 250 340 305 215 142 403 485 124 1 499 83 510 65 0 1306 358 772 193 597 64 270 408 718 213 310 267 514 5 163 861 42 66 60 289 18 120 212 114 35 432 781 92 25 227 86 82 173 72 157 104 217 28 21 132 37 1 262 144 135 114 0 95 192 116 44 57 339 94 17 63 758 61 46 143 89 90 19 836 255 306 33 269 11 48 340 171 206 289 11 743 1036 210 201 95 57 357 121 124 228 63 37 38 333 763 54 196 155 173 128 74 299 516 421 141 291 233 170 101 33 234 46 71 135 56 6 167 42 79 27 140 174 25 58 174 0 49 280 0 130 70 3 17 1010 76 845 458 52 895 599 176 237 456 562 31 327 1106 294 256 13 13 272 879 217 154 1 243 114 17 444 299 26 10 683 145 41 461 433 1 0 240 32 7 143 185 43 2039 845 0 262 400 536 61 405 238 101 23 2 256 663 98 17 578 187 393 94 259 544 305 131 363 13 414 229 28 335 71 366 9 143 152 97 478 113 54 209 85 56 87 90 0 14 19 65 95 855 0 156 131 104 2 213 548 1 40 469 96 1081 31 24 13 419 213 179 39 95 123 86 168 142 7 81 59 4 460 46 318 1 29 471 5 411 269 122 427 124 7 15 29 64 26 5 73 1 52 1512 180 623 1716 911 63 0 77 174 5 359 275 0 1120 402 216 372 233 3 186 205 70 84 758 735 37 387 594 29 735 480 142 82 401 167 411 286 988 527 20 0 1 0 922 257 213 335 159 299 199 355 43 206 145 151 180 430 303 311 760 626 1229 831 399 148 21 36 4 370 245 411 11 689 99 469 281 247 46 194 130 229 238 150 194 27 477 626 240 12 102 32 135 28 12 234 264 9 371 252 639 265 233 1363 218 328 1003 808 216 189 266 2082 4 64 59 100 121 478 0 53 2 23 430 31 476 227 178 22 1 0 102 225 15 30 5 0 85 89 39 652 89 190 16 459 51 0 84 407 28 154 585 371 196 166 89 193 82 0 0 27 1246 130 55 86 552 2 3 560 884 2486 286 160 321 129 166 363 120 627 66 2 157 21 1 421 283 903 172 428 69 31 1 SPP30 Bacteria;Bacteroidetes;Bacteroidia;Bacteroidales;Porphyromonadaceae;Porphyromonas;multispecies_spp30_3 0 0 0 0 0 0 0 0 0 0 0 0 0 0 0 0 0 0 0 0 0 0 0 0 0 0 0 0 0 0 0 0 0 0 0 0 0 0 0 0 0 0 0 0 0 0 0 0 0 0 0 0 0 0 0 0 0 0 0 0 0 0 0 0 0 0 0 0 0 0 0 0 0 0 0 0 0 0 0 0 0 0 0 0 0 0 0 0 0 0 0 0 0 0 0 0 0 0 0 0 0 0 0 0 0 0 0 0 0 0 0 0 0 0 0 0 0 0 0 0 0 0 0 0 0 0 0 0 0 0 0 0 0 0 0 0 0 0 0 0 0 0 0 0 0 0 0 0 0 0 0 0 0 0 0 0 0 0 0 0 0 0 0 0 0 0 0 0 0 0 0 0 0 0 0 0 0 0 0 0 0 0 0 0 0 0 0 0 0 0 0 0 0 0 0 0 0 0 0 0 0 0 0 0 0 0 0 0 0 0 0 0 0 0 0 0 0 0 0 0 0 0 0 0 0 0 0 0 0 0 0 0 0 0 0 0 0 0 0 0 0 0 0 0 0 0 0 0 0 0 0 0 0 0 0 0 0 0 0 0 0 0 0 0 0 0 0 0 0 245 21 10 49 0 82 17 30 75 268 0 225 248 0 29 256 19 10 33 3 273 180 1 12 2 56 58 65 181 0 149 150 15 136 184 25 0 43 0 205 0 184 31 0 8 16 37 0 164 8 0 15 35 0 0 28 0 3 0 3 0 0 4 68 28 0 0 0 3 16 0 38 13 0 16 478 5 15 1 1 1 4 102 0 14 0 16 6 3 7 0 9 34 0 3 2 3 2 55 141 0 62 16 5 189 57 4 4 4 6 139 0 0 233 2 6 32 85 44 0 45 20 5 0 132 13 22 19 2 23 199 11 0 0 82 525 0 0 82 30 2 33 206 0 1 1 48 27 0 10 0 13 0 40 12 0 17 13 6 16 21 48 158 32 220 0 21 10 19 9 1 12 0 2 0 35 55 0 12 130 230 1 2 59 2 0 76 0 89 0 119 175 0 4 28 2 319 0 294 7 0 70 54 0 172 184 1 62 26 6 175 55 18 0 130 190 108 332 397 13 233 25 2 2 229 217 3 5 7 14 171 26 0 12 1 407 8 0 245 1 0 0 13 1 0 92 0 0 6 4 0 15 139 3 21 121 51 0 18 6 29 0 301 79 2 464 0 52 28 21 20 0 71 1 0 57 24 265 38 2 1 134 6 14 5 31 0 1 11 14 172 0 17 8 44 25 66 1 1 0 32 0 1 16 23 87 1 36 5 6 2 8 25 10 0 8 30 60 387 34 0 1 0 1 151 2 286 66 60 0 0 0 93 37 17 46 12 0 3 68 104 97 42 6 1 0 15 182 0 81 31 13 15 80 99 266 183 76 15 10 189 198 140 147 27 161 76 14 0 36 7 2 148 104 40 31 0 0 53 0 37 1 73 0 102 72 11 145 11 5 16 40 0 327 88 273 4 5 0 160 48 0 243 0 434 1 10 51 0 31 8 13 18 85 0 89 288 109 1 44 25 15 666 18 553 30 0 7 22 1 28 238 104 32 51 21 7 1 0 1 120 69 0 73 58 4 5 4 1 0 4 0 14 211 14 0 22 538 891 142 16 42 31 0 27 80 10 122 44 266 124 25 22 647 11 69 2 10 35 7 4 85 2 178 0 22 329 123 102 44 193 185 191 25 0 12 0 452 152 12 191 159 90 257 78 0 47 428 0 283 30 20 45 0 77 2 2 13 0 14 68 6 68 0 15 0 31 58 1 0 4 18 118 2 4 107 3 29 17 122 17 85 0 10 9 1 187 0 1 1 52 2 13 12 2 1 18 16 31 468 0 0 12 2 0 0 11 0 150 3 1 10 12 167 4 0 0 4 25 77 4 0 415 4 7 283 4 2 18 2 0 0 1 0 2 115 44 7 133 59 46 4 44 48 33 93 1 5 1 247 17 4 3 16 34 14 0 9 6 852 58 89 0 29 194 3 5 1 0 101 3 1 4 162 3 59 0 19 9 232 333 13 28 0 58 177 133 0 0 55 18 7 0 2 229 90 0 12 88 195 0 427 28 8 100 0 206 22 123 1064 44 108 1 337 66 4 138 62 17 470 187 35 1 244 246 0 63 136 2 64 22 4 54 1 258 0 15 0 50 71 180 2 128 0 61 131 22 282 71 3 218 14 0 20 56 0 230 0 71 5 147 330 4 59 45 184 422 932 388 3 0 0 334 7 11 3 377 0 46 8 0 0 66 0 2 11 37 4 0 11 0 0 236 38 129 153 0 93 149 81 249 114 200 208 70 874 181 57 98 282 3 126 306 17 113 119 47 37 49 9 33 224 177 1 0 19 13 211 223 11 137 636 85 0 1 220 46 120 247 47 6 22 304 111 353 40 117 333 53 263 0 927 1066 80 376 284 103 49 319 21 19 1 130 9 26 6 66 18 283 25 14 88 3 174 17 378 117 25 128 69 27 22 346 38 5 8 64 2 90 136 298 106 4 103 87 178 3 3 43 359 53 40 141 14 78 338 0 46 71 0 58 2 325 0 120 323 70 553 18 157 1355 123 667 2 28 147 179 706 77 199 5 72 17 17 119 10 18 401 35 121 489 202 20 343 51 127 4 5 35 1 192 17 27 8 7 13 89 3 73 3 21 29 67 56 116 186 105 131 818 21 80 166 5 23 23 850 4 101 41 167 112 389 165 94 195 256 536 47 189 446 221 3 1187 48 56 15 65 209 85 942 274 96 86 76 17 81 175 1 894 40 171 579 95 139 146 58 5 0 12 278 36 33 16 2 422 288 77 918 63 101 72 263 18 2 194 22 57 142 63 43 4 269 1 4 252 870 9 57 308 5 20 45 401 42 308 148 3 11 217 35 98 319 125 10 81 19 31 100 276 10 1162 56 45 1 190 124 600 423 157 163 605 454 171 145 2603 90 21 9 84 540 18 30 36 20 585 9 7 60 258 331 187 44 56 1463 46 34 175 34 588 119 1727 235 3 305 100 8 133 76 130 3 2 1 5 14 231 182 159 296 480 8 1302 219 81 42 0 149 149 34 15 256 148 650 1185 505 761 521 1090 61 24 385 11 11 81 181 17 199 696 458 54 128 180 159 150 85 157 12 116 15 209 122 29 30 12 96 34 13 1 4 2 10 490 2 8 199 186 123 3 4 76 59 44 27 9 178 212 41 72 10 27 77 6 65 49 340 11 98 103 242 187 111 36 169 43 112 45 8 3 12 5 322 1735 21 70 496 20 70 792 28 27 121 127 353 31 91 34 421 255 337 85 15 77 3 51 82 138 33 171 81 0 30 21 56 207 345 53 0 4 255 12 2 188 22 226 25 38 125 55 64 215 65 173 0 66 590 3 91 53 127 9 47 46 378 162 0 27 269 21 49 121 57 106 1279 741 77 13 60 398 168 0 3 128 106 53 81 18 164 19 500 0 94 18 65 81 88 28 57 9 58 43 231 91 21 72 125 369 893 26 243 41 86 44 7 188 388 22 124 503 1044 22 111 156 3 185 91 22 234 353 44 754 208 1 11 22 1124 28 315 0 399 135 272 17 618 266 18 20 84 334 174 45 52 120 88 98 57 505 0 158 5 361 197 367 72 730 184 110 53 64 0 7 639 11 120 112 0 486 98 42 16 27 51 135 0 110 0 51 117 29 952 36 434 118 60 11 26 114 34 63 1 155 148 111 62 77 17 176 104 34 567 100 202 133 433 100 42 219 236 72 295 315 81 133 208 453 129 1 17 50 5 288 177 0 176 685 19 396 68 54 18 263 24 228 467 17 32 53 8 56 32 51 193 197 110 71 432 189 79 114 61 399 228 15 23 34 7 17 17 16 64 100 4 157 106 75 32 28 509 51 2 9 32 2 44 168 218 64 2 199 144 109 138 15 243 105 21 44 3 48 12 1 1 2 117 1 189 28 24 3 122 546 17 118 49 5 3 133 234 107 162 119 0 24 9 15 119 392 48 195 97 281 11 45 633 102 410 487 76 175 63 624 22 165 19 6 0 3 844 544 1159 239 0 49 65 57 4 196 97 321 221 24 15 327 37 291 0 31 116 94 680 37 249 369 136 1272 59 6 SPP31 Bacteria;Actinobacteria;Actinomycetia;Actinomycetales;Actinomycetaceae;Actinomyces;multispecies_spp31_4 0 0 0 0 0 0 0 0 0 0 0 0 0 0 0 0 0 0 0 0 0 0 0 0 0 0 0 0 0 0 0 0 0 0 0 0 0 0 0 0 0 0 0 0 0 0 0 0 0 0 0 0 0 0 0 0 0 0 0 0 0 0 0 0 0 0 0 0 0 0 0 0 0 0 0 0 0 0 0 0 0 0 0 0 0 0 0 0 0 0 0 0 0 0 0 0 0 0 0 0 0 0 0 0 0 0 0 0 0 0 0 0 0 0 0 0 0 0 0 0 0 0 0 0 0 0 0 0 0 0 0 0 0 0 0 0 0 0 0 0 0 0 0 0 0 0 0 0 0 0 0 0 0 0 0 0 0 0 0 0 0 0 0 0 0 0 0 0 0 0 0 0 0 0 0 0 0 0 0 0 0 0 0 0 0 0 0 0 0 0 0 0 0 0 0 0 0 0 0 0 0 0 0 0 0 0 0 0 0 0 0 0 0 0 0 0 0 0 0 0 0 0 0 0 0 0 0 0 0 0 0 0 0 0 0 0 0 0 0 0 0 0 0 0 0 0 0 0 0 0 0 0 0 0 0 0 0 0 0 0 0 0 0 0 0 0 0 0 0 5 78 0 5 25 18 0 15 7 19 0 24 46 0 66 9 6 15 0 3 4 8 0 19 1 10 6 6 45 0 25 8 13 7 18 1 8 12 4 14 3 16 1 5 1 3 18 0 13 11 12 3 0 11 0 15 0 0 0 28 0 14 13 0 6 5 0 6 0 1 0 0 14 0 72 8 97 0 14 5 5 10 8 0 1 0 1 0 3 3 0 0 18 0 22 4 4 0 12 12 0 2 0 5 10 8 19 0 0 0 11 1 0 7 0 0 1 2 10 0 0 0 0 0 8 5 10 7 0 0 3 0 0 0 24 9 6 0 10 8 8 11 29 0 37 24 0 7 0 9 0 40 23 29 6 0 27 50 0 2 8 3 15 8 6 0 3 12 0 0 0 23 2 1 0 6 7 0 2 2 12 15 25 31 0 2 5 8 11 0 17 1 2 0 11 31 19 0 15 1 10 7 36 0 23 7 5 8 5 8 10 3 8 18 14 12 16 1 13 0 9 2 3 3 5 1 0 21 8 0 14 3 0 0 2 1 0 0 0 7 8 4 6 0 6 6 0 1 12 0 0 0 9 3 1 6 27 0 8 10 3 0 4 17 0 15 0 5 1 1 1 0 1 0 1 5 0 8 8 3 21 14 20 0 2 4 3 0 5 0 13 0 3 0 3 9 38 0 0 0 4 3 0 5 12 3 1 6 0 2 0 0 0 8 0 32 4 5 0 1 0 5 0 15 5 0 4 3 18 0 0 0 10 0 28 0 2 0 1 0 5 2 6 5 0 14 9 13 0 7 0 1 28 13 9 0 6 15 0 9 6 16 10 3 2 8 5 7 0 15 13 21 6 10 14 10 0 0 10 1 3 78 0 0 9 8 40 20 5 12 23 159 0 41 58 18 32 21 0 4 2 0 19 0 15 0 10 7 0 11 11 0 12 1 0 0 2 3 4 5 4 0 0 0 11 6 12 0 0 0 5 5 0 42 7 0 4 22 0 18 8 9 0 2 6 0 26 14 0 7 11 0 2 16 16 0 23 9 15 2 0 4 27 1 21 1 65 8 20 6 6 3 78 15 3 6 0 10 9 20 0 1 0 2 0 22 13 35 4 0 9 13 10 28 2 3 1 4 8 0 4 23 0 7 5 0 4 4 0 15 11 37 18 0 15 42 0 22 37 3 0 2 0 8 13 0 1 15 0 5 2 0 0 0 1 0 13 18 2 12 28 20 1 2 2 0 27 0 4 27 4 27 24 7 4 0 0 21 2 6 0 0 35 0 0 0 7 0 13 7 0 1 16 6 0 2 3 3 23 15 0 5 4 1 1 3 6 0 14 9 0 0 1 13 18 18 6 5 8 13 5 27 2 0 1 2 19 1 7 15 0 29 23 2 5 44 1 14 3 8 27 22 0 0 0 13 0 13 0 10 6 34 0 50 0 17 0 21 8 7 16 14 1 0 25 25 23 0 11 15 8 14 1 1 2 5 0 0 14 17 0 15 10 5 20 0 1 42 4 28 12 19 0 1 9 0 4 9 1 14 37 14 3 16 9 0 5 17 15 8 0 8 17 0 2 2 0 1 10 4 0 22 4 0 0 8 0 5 13 9 0 6 3 4 17 1 27 0 23 21 14 9 0 2 9 0 43 21 35 63 10 0 27 29 41 1 26 0 0 0 0 0 8 0 1 68 13 0 0 0 52 8 18 2 13 15 0 1 0 6 0 0 1 0 0 1 0 1 0 1 0 0 0 0 10 1 0 0 0 0 4 0 0 0 0 5 0 5 0 0 0 0 0 1 0 2 4 0 0 4 0 2 2 0 1 0 6 3 0 2 0 0 14 2 0 0 8 1 0 2 1 0 0 1 0 0 0 19 0 0 0 0 0 0 0 0 0 1 0 0 0 0 0 13 1 0 0 0 0 0 3 1 0 1 0 2 0 4 8 0 2 0 0 0 10 0 0 0 2 0 1 0 0 0 0 0 0 0 6 0 0 3 0 0 0 1 0 0 1 0 0 0 0 1 0 0 0 0 1 1 0 0 0 3 0 1 0 0 0 0 0 0 2 0 0 1 1 0 1 0 1 10 0 2 5 19 0 0 1 0 6 1 0 1 15 0 0 0 4 18 0 0 10 0 0 0 0 0 6 1 0 0 1 0 0 2 13 0 0 0 5 0 0 5 0 8 1 0 0 0 0 0 0 2 0 0 0 0 0 0 0 0 0 0 0 1 0 0 0 0 0 0 0 0 0 1 0 0 0 0 1 0 0 0 0 3 0 2 0 0 1 0 0 1 0 3 0 4 17 0 0 7 3 0 1 0 0 0 1 0 0 1 0 0 11 0 0 0 0 0 5 2 0 0 0 6 0 0 1 0 0 1 1 0 0 0 3 0 0 0 2 0 0 4 3 2 1 4 0 0 0 1 0 1 8 0 6 0 0 0 0 0 0 0 2 0 0 0 0 0 0 3 0 3 0 4 0 0 0 2 0 2 7 0 0 2 2 0 1 4 1 0 0 0 4 7 15 0 0 2 3 0 7 11 0 0 2 0 10 0 0 0 0 0 1 0 0 0 0 0 0 0 1 3 0 0 0 0 6 0 0 0 3 0 2 1 0 0 0 7 0 1 6 0 0 0 0 0 0 0 0 4 0 0 0 5 0 0 0 4 0 5 4 0 0 0 0 1 3 2 0 0 0 0 3 0 1 0 0 0 0 0 9 0 1 0 0 1 0 0 6 0 1 0 0 0 3 5 0 0 4 0 0 8 2 0 0 0 0 1 0 0 2 7 3 5 3 0 0 0 4 1 0 0 0 0 0 0 0 0 1 0 0 1 12 0 4 1 0 0 0 0 0 2 0 0 1 11 0 0 0 0 0 2 0 0 0 0 0 1 0 0 1 1 0 0 0 3 0 4 1 1 4 0 0 0 0 0 0 2 0 0 3 0 3 3 0 1 3 2 0 0 0 0 1 0 0 1 0 6 0 3 7 0 0 1 0 0 3 0 0 1 3 0 0 0 1 0 1 1 0 2 0 0 1 0 2 0 1 0 0 0 0 0 0 0 0 0 0 0 0 0 0 0 2 0 0 0 7 5 0 0 0 10 0 2 0 0 0 0 0 1 1 2 0 6 9 0 2 0 0 12 0 1 0 16 48 0 19 3 0 0 1 0 0 0 0 0 1 0 0 2 0 0 6 5 0 0 0 0 1 0 0 1 0 2 0 0 1 1 0 2 0 0 1 0 0 0 0 0 0 0 0 0 0 0 0 1 7 0 2 2 2 0 1 0 0 1 1 0 0 0 3 5 1 0 4 0 0 0 0 0 0 4 0 0 0 0 0 0 0 0 1 0 0 3 5 0 0 0 3 1 0 0 0 0 0 0 0 0 2 6 0 3 0 4 0 0 3 0 0 0 0 0 1 1 0 0 3 0 1 4 0 0 0 2 0 0 1 0 0 0 1 0 1 0 0 0 2 0 0 0 1 0 0 0 0 0 0 0 0 4 0 0 0 SPP32 Bacteria;Actinobacteria;Actinomycetia;Actinomycetales;Actinomycetaceae;Actinomyces;multispecies_spp32_6 0 0 0 0 0 0 0 0 0 0 0 0 0 0 0 0 0 0 0 0 0 0 0 0 0 0 0 0 0 0 0 0 0 0 0 0 0 0 0 0 0 0 0 0 0 0 0 0 0 0 0 0 0 0 0 0 0 0 0 0 0 0 0 0 0 0 0 0 0 0 0 0 0 0 0 0 0 0 0 0 0 0 0 0 0 0 0 0 0 0 0 0 0 0 0 0 0 0 0 0 0 0 0 0 0 0 0 0 0 0 0 0 0 0 0 0 0 0 0 0 0 0 0 0 0 0 0 0 0 0 0 0 0 0 0 0 0 0 0 0 0 0 0 0 0 0 0 0 0 0 0 0 0 0 0 0 0 0 0 0 0 0 0 0 0 0 0 0 0 0 0 0 0 0 0 0 0 0 0 0 0 0 0 0 0 0 0 0 0 0 0 0 0 0 0 0 0 0 0 0 0 0 0 0 0 0 0 0 0 0 0 0 0 0 0 0 0 0 0 0 0 0 0 0 0 0 0 0 0 0 0 0 0 0 0 0 0 0 0 0 0 0 0 0 0 0 0 0 0 0 0 0 0 0 0 0 0 0 0 0 0 0 0 0 0 0 0 0 417 446 1592 0 558 2791 1366 1 1734 302 1236 497 870 1373 786 1920 813 659 956 270 2059 383 742 936 1756 216 371 600 973 1554 0 1238 1032 3318 938 944 549 4657 1099 943 2153 977 891 557 673 455 952 1405 599 550 2393 1133 1423 24 405 35 1143 3 519 1 1933 474 5968 954 494 743 2423 1 7666 470 201 380 428 3908 2 2979 829 2063 3338 1992 1034 1408 1733 657 293 243 5593 1986 188 1232 1523 5 1 1071 6 1815 1623 2692 24 1974 867 0 355 775 719 785 1419 1752 1052 1 359 1769 2085 0 565 309 1215 658 522 739 2 100 2597 2511 0 1121 417 2005 1595 4 442 366 887 1531 2994 1829 709 1206 0 721 1182 5010 937 865 1428 2919 7678 7605 1459 0 1367 57 3831 4251 3759 867 1 652 2317 1381 1701 1565 592 1252 1049 655 2167 638 601 0 4310 799 899 877 3228 1438 5069 2081 1233 6110 393 1084 937 1935 888 1583 1471 2256 2929 2497 7 1062 650 449 66 1756 2489 734 1447 513 988 1823 3319 1100 1896 445 631 931 2677 1675 740 1244 343 655 3754 816 995 941 220 483 864 930 490 586 1358 382 931 279 3164 3757 0 1212 427 99 4 2497 383 395 1320 289 7673 1237 993 799 2366 1134 2985 1146 734 1509 138 1457 72 1071 768 785 630 2444 865 1670 1443 426 77 556 1030 396 422 1 1137 411 516 1000 2926 406 267 1231 616 253 330 541 2353 3337 818 2073 2207 420 1636 1044 636 1655 0 997 2109 547 575 537 1173 1831 103 645 2519 740 1021 0 948 2030 684 251 827 263 2473 5 895 277 1074 204 2452 724 397 295 241 502 1719 393 1770 1627 904 656 2298 1280 0 1 0 618 1 2001 867 826 332 509 154 511 345 729 381 36 2242 1353 802 507 658 347 1126 3000 3169 1329 91 911 741 280 1680 287 730 671 584 389 817 487 545 0 2228 5373 4824 513 1047 659 772 347 0 2100 1165 1281 2450 1177 608 2674 1843 3250 2022 1641 2355 1470 2738 1 3261 2205 1149 2192 5856 582 1611 788 429 733 30 439 371 2516 462 3 3790 5679 2970 1232 628 109 0 625 567 1192 911 518 101 0 398 975 2297 1769 2319 2337 2841 1810 1291 666 1558 537 296 1689 1596 4682 1308 1037 2337 6 194 316 1 2449 3535 14 2900 2174 497 682 894 3655 3549 1738 752 621 1165 1372 452 1299 1201 2580 233 1611 887 1364 532 218 1850 1566 480 272 814 105 2169 659 1815 1196 316 337 410 101 2030 2122 1358 2140 1698 1141 4741 677 3575 280 848 253 350 976 478 430 1961 34 400 576 1608 460 339 57 1652 1675 2332 946 1 616 1763 143 942 5502 750 693 2543 589 1190 1372 439 556 524 3 2943 3423 94 1166 117 589 3 1328 1085 3902 817 2632 3016 1830 691 940 99 1221 476 4816 5483 394 5507 1694 4170 3820 185 115 2466 278 683 42 493 3804 1195 4 833 3077 2954 595 1172 1896 885 2856 1254 2573 1854 1864 874 613 916 149 797 816 788 149 1167 1368 575 951 1092 0 1109 1506 2910 2861 3892 1562 2400 1239 1306 620 2797 1820 476 396 455 5765 743 1923 780 576 3795 1470 824 382 3063 2994 5207 1713 1206 1520 1470 10381 4 12508 3051 4281 1039 0 789 1426 2092 3904 3723 3965 2265 1518 2350 1677 310 2818 2053 591 1 4825 1153 459 0 660 3254 2423 2477 403 784 474 961 483 799 987 2616 1688 891 2598 1243 774 3759 1269 2986 743 1805 1393 1920 467 924 1501 135 732 775 627 883 3846 1856 1714 770 648 1 850 1295 2375 826 19 2172 801 0 610 345 58 342 3220 726 7338 1423 907 442 583 1337 820 756 1293 1223 303 1386 872 958 1368 683 1339 0 853 755 1323 724 803 551 513 101 1175 3021 5827 3466 6510 984 2115 5386 1490 2358 2424 1 0 30 1 8 1266 0 679 6950 2028 499 0 1020 4992 2908 3670 685 1453 1436 11 223 189 154 1 12 91 10 60 92 1 165 18 113 16 133 32 0 143 232 12 16 134 37 717 112 50 0 232 263 0 328 30 0 13 55 29 39 0 129 161 1 18 108 1 345 64 0 48 27 228 86 0 46 2 0 767 698 0 113 588 23 1 115 102 34 70 85 48 0 2 739 123 0 40 115 0 12 60 0 16 68 0 4 5 5 2 940 262 13 21 3 1 10 239 29 6 30 79 88 2 620 3031 7 169 25 0 103 226 419 1 37 129 0 155 11 0 0 164 35 0 0 195 42 0 90 7 120 12 41 0 22 43 20 236 29 9 51 8 35 2 44 18 43 15 0 37 296 66 17 19 28 6 32 0 0 67 113 33 54 66 15 30 1 77 495 2 232 167 771 11 80 182 18 249 199 0 62 528 8 58 3 219 953 5 86 740 1 10 13 16 2 167 98 0 0 63 200 0 91 797 1 69 11 155 2 24 276 13 312 106 0 10 220 53 8 24 74 79 26 32 0 96 240 0 0 56 0 26 70 37 68 74 0 51 63 0 166 58 201 0 36 70 0 399 45 0 64 37 143 3 185 192 0 104 38 1 19 11 97 0 129 465 0 2 134 86 21 74 79 0 58 223 1 13 287 60 0 366 5 4 29 83 1 137 261 12 0 90 50 5 99 471 18 0 144 207 25 79 0 400 41 949 0 371 12 0 396 155 226 383 325 0 61 32 67 2 89 216 51 235 10 0 15 16 17 6 60 91 40 0 33 8 0 17 318 6 74 3 145 50 27 259 420 300 143 219 1 9 149 68 65 31 369 54 9 25 1 415 80 193 2 2 234 237 5 517 157 13 32 54 43 416 31 7 25 3 0 91 98 0 8 20 1 1 0 20 120 1 120 132 20 325 18 2 248 179 4 47 56 3 1 6 544 11 70 253 3 6 17 25 1 95 313 1 249 38 1 107 76 0 0 1 77 0 122 114 11 14 18 3 51 55 101 301 187 71 27 306 8 26 91 25 81 61 0 1232 134 89 1 37 119 1 73 458 20 16 39 33 2 207 376 0 7 280 50 5 431 105 0 19 35 73 76 74 0 50 258 316 134 93 60 1 7 468 89 24 9 37 0 42 212 19 21 153 44 0 217 507 3 237 110 0 4 57 16 2 632 36 8 74 310 181 38 0 35 7 50 0 184 210 2 3 56 22 0 45 9 48 0 26 234 0 162 101 227 227 0 0 71 53 37 67 109 0 125 248 30 349 214 87 64 45 197 25 37 121 0 38 84 0 88 139 329 6 118 444 0 55 390 2 148 230 6 0 198 70 75 2 13 104 0 38 176 5 124 8 0 47 119 63 3 51 58 0 36 7 0 47 84 24 1 426 86 8 39 91 0 174 111 140 0 199 152 0 4 21 741 3 165 73 6 67 72 1 53 26 239 0 153 97 3 104 18 8 91 10 104 0 104 523 6 278 81 0 6 106 12 11 34 11 0 60 14 4 202 76 2 109 395 2 78 71 18 66 3 77 140 3 126 57 1 86 16 30 163 59 20 113 52 133 38 20 0 0 89 39 0 11 13 6 45 131 182 77 222 36 1 53 119 1 54 116 16 2 5 192 295 236 1 76 54 6 52 1 4 39 475 52 1049 0 0 1 13 75 132 44 11 0 385 271 151 47 21 687 72 0 0 27 73 138 69 108 2 132 201 0 224 88 176 5 81 96 2 98 35 3 36 380 173 0 112 550 1 59 439 5 4 16 83 1 112 159 0 0 4 83 0 110 42 12 324 259 1 7 66 73 6 16 171 0 76 4 1 11 104 39 21 7 SPP33 Bacteria;Firmicutes;Bacilli;Bacillales;Gemellaceae;Gemella;multispecies_spp33_4 0 0 0 0 0 0 0 0 0 0 0 0 0 0 0 0 0 0 0 0 0 0 0 0 0 0 0 0 0 0 0 0 0 0 0 0 0 0 0 0 0 0 0 0 0 0 0 0 0 0 0 0 0 0 0 0 0 0 0 0 0 0 0 0 0 0 0 0 0 0 0 0 0 0 0 0 0 0 0 0 0 0 0 0 0 0 0 0 0 0 0 0 0 0 0 0 0 0 0 0 0 0 0 0 0 0 0 0 0 0 0 0 0 0 0 0 0 0 0 0 0 0 0 0 0 0 0 0 0 0 0 0 0 0 0 0 0 0 0 0 0 0 0 0 0 0 0 0 0 0 0 0 0 0 0 0 0 0 0 0 0 0 0 0 0 0 0 0 0 0 0 0 0 0 0 0 0 0 0 0 0 0 0 0 0 0 0 0 0 0 0 0 0 0 0 0 0 0 0 0 0 0 0 0 0 0 0 0 0 0 0 0 0 0 0 0 0 0 0 0 0 0 0 0 0 0 0 0 0 0 0 0 0 0 0 0 0 0 0 0 0 0 0 0 0 0 0 0 0 0 0 0 0 0 0 0 0 0 0 0 0 0 0 0 0 0 0 0 1 36 52 657 137 15 65 137 77 85 223 105 244 143 7 56 223 40 161 205 13 288 297 32 951 134 309 597 217 67 0 393 261 54 342 115 96 1071 194 239 296 142 37 202 11 51 229 32 22 320 53 42 50 125 197 0 25 17 149 0 80 8 11 125 62 44 46 22 8 26 1 4 37 21 0 16 294 27 118 58 217 25 52 20 21 38 31 93 130 76 32 14 8 27 132 40 13 36 5 53 83 0 101 547 26 344 194 39 177 45 35 124 7 0 129 57 14 116 294 41 2 307 311 2 0 181 80 81 117 6 141 265 209 99 12 264 79 92 2 40 86 65 80 150 21 30 101 203 197 0 37 37 19 30 65 23 759 96 26 14 376 34 697 84 125 320 118 45 5 85 16 178 18 8 34 11 61 102 362 682 63 271 23 8 111 316 0 266 1 366 126 112 114 14 414 134 39 117 7 140 21 23 174 188 86 8 27 81 564 197 22 94 173 34 142 94 604 202 336 313 62 227 26 79 11 253 164 382 8 77 2223 220 320 24 2 57 101 25 156 158 54 0 27 41 41 15 565 14 80 105 25 36 1105 115 262 324 79 22 24 355 149 132 6 67 544 6 287 0 277 26 42 273 72 150 243 102 74 254 189 326 3 47 135 17 22 103 69 4 55 72 16 148 102 123 45 78 25 453 10 85 5 76 42 7 114 83 210 7 275 122 60 5 612 32 34 193 44 279 73 1166 25 8 21 51 47 203 71 158 137 135 0 3 0 16 408 84 295 346 13 13 151 123 55 106 62 22 53 101 11 13 48 35 17 0 147 49 422 100 9 79 82 39 133 2 123 93 79 350 79 264 112 195 255 268 136 31 51 35 0 96 140 109 34 322 29 64 81 40 160 150 45 15 35 8 107 26 188 20 53 0 40 79 51 8 41 59 79 7 98 4 42 404 55 154 249 52 628 67 10 75 65 75 7 756 95 104 128 41 38 66 28 449 699 12 182 76 288 51 71 102 11 128 411 59 133 38 123 157 13 77 0 117 36 26 122 103 3 247 656 389 107 83 65 15 14 182 48 42 145 34 249 162 90 66 473 40 54 44 44 40 85 54 172 47 277 35 78 67 26 156 111 749 181 161 119 141 86 7 307 342 191 247 127 161 116 162 102 10 178 8 247 121 112 154 3 89 11 7 72 4 10 99 88 34 148 257 88 37 147 8 12 7 12 20 97 23 239 95 62 67 314 62 508 35 30 56 64 53 5 33 29 635 56 54 41 14 119 11 23 51 252 58 223 42 9 4 37 105 11 138 10 37 30 28 147 14 35 41 115 108 225 39 27 213 193 81 67 9 279 207 210 32 53 13 7 91 352 236 47 146 156 394 18 74 62 209 137 18 61 521 237 158 15 41 79 121 697 26 18 27 300 14 219 5 1490 11 65 71 7 89 75 38 117 58 94 23 19 10 63 146 443 69 132 269 0 157 45 116 2 60 250 42 221 7 27 193 84 22 74 190 92 19 259 121 97 36 15 55 342 277 35 27 254 42 589 63 145 153 178 120 116 31 52 151 236 583 208 149 54 300 227 196 344 156 15 224 17 8 110 63 89 341 211 186 90 94 150 152 246 166 9 252 68 41 182 70 31 159 1 81 7 93 312 170 86 229 56 43 15 1663 6 107 22 56 27 6 28 62 0 2 179 1 16 73 5 14 489 489 87 0 549 65 19 204 96 116 237 59 483 567 449 1237 1426 1618 1008 360 637 924 2112 130 1101 528 520 670 574 473 458 789 884 520 1091 646 1314 1083 249 247 993 650 940 847 825 418 508 347 366 416 421 229 650 1208 1953 2671 996 1009 962 1498 825 201 527 623 673 2 377 439 424 160 924 481 1222 972 988 1256 1959 696 420 950 282 169 98 162 454 161 1061 581 678 371 240 224 339 254 722 336 210 148 414 135 245 445 219 205 462 739 353 1746 409 1401 71 492 510 200 745 496 523 797 338 348 500 833 666 1365 616 662 717 1346 13 672 1257 320 516 767 1304 535 411 1490 1694 786 215 504 817 631 946 596 542 2108 318 800 547 723 575 712 2642 989 837 936 301 458 631 214 295 1571 510 1058 514 238 69 829 156 250 361 378 309 194 281 859 212 143 709 834 1281 1828 2087 543 656 303 120 276 708 2508 1068 220 856 912 596 367 113 705 1127 1715 678 851 1204 770 356 585 241 855 1085 1260 514 726 743 447 631 578 358 629 284 582 2145 1243 312 220 341 2182 496 595 1646 900 801 980 1114 3137 377 705 776 1177 1452 1559 1230 657 789 405 256 387 118 770 560 1036 733 451 515 238 380 813 1004 557 1151 996 676 349 832 326 478 473 1588 655 146 672 200 1454 688 713 583 769 534 427 718 370 1136 1442 503 777 1031 670 2167 1773 1732 945 567 561 1019 503 535 660 1127 941 1321 368 408 1379 571 542 589 335 638 657 422 2353 2193 630 2111 305 713 233 176 1436 662 1455 1064 1058 385 645 939 2055 324 609 435 701 1094 1323 410 111 337 330 1164 413 733 938 663 359 764 532 365 943 64 844 1138 298 341 837 1113 412 337 630 882 3382 563 1151 1385 1879 405 645 1408 1174 544 965 96 438 1288 706 1292 563 103 905 2347 907 364 1162 152 469 816 351 142 378 281 179 62 102 330 258 623 1541 58 185 185 206 109 105 269 182 152 517 1345 441 636 184 265 176 281 274 138 535 203 55 1512 141 572 379 580 603 671 444 209 293 1049 290 982 31 1082 221 492 927 673 572 948 297 611 1158 887 215 662 377 576 347 233 1255 1477 1392 1054 254 438 321 753 126 480 659 271 431 680 158 662 860 460 281 1016 730 684 370 559 992 751 219 1371 493 406 600 379 499 1089 525 303 765 1659 102 410 310 173 237 294 342 595 261 524 624 368 464 587 1239 1439 819 591 1239 1388 1370 257 592 842 692 869 237 202 786 341 521 80 996 601 437 455 530 189 968 69 188 127 381 531 2439 234 616 193 417 292 484 342 480 1078 396 284 467 396 737 1757 251 446 739 276 801 611 862 257 717 335 1322 1813 658 2535 1296 1629 268 753 522 1109 447 490 1009 672 620 189 1691 896 1014 2448 608 1535 1096 1841 1669 976 321 678 892 234 772 521 1980 942 1217 312 902 1436 315 478 723 601 777 786 903 312 1477 428 316 1275 1026 233 749 1030 2281 650 2711 1245 206 1406 669 1382 196 267 440 453 878 537 625 483 784 503 1307 451 399 95 347 1551 865 527 742 1148 760 295 1483 1451 626 621 199 278 1395 720 885 191 121 626 885 589 1182 900 1030 215 5359 3 684 368 679 745 642 684 1431 573 561 724 1335 160 558 327 512 576 1245 1401 1247 1534 432 223 773 364 589 447 718 1900 262 715 504 317 584 875 221 132 290 183 257 269 500 411 183 329 169 467 188 405 120 1113 414 105 35 620 104 845 130 390 48 139 578 584 270 166 126 795 2085 349 1545 9 366 901 2217 207 92 2033 363 599 599 246 489 1055 424 584 491 337 286 267 676 714 2208 816 799 891 207 975 596 759 1081 272 302 538 407 916 436 894 803 1098 497 2547 373 455 564 423 1139 1062 880 307 693 662 650 1380 1011 2 461 80 967 27 1292 298 1475 418 433 229 1686 196 2401 292 1840 1163 794 1778 786 821 1128 374 967 1546 593 SPP35 Bacteria;Proteobacteria;Gammaproteobacteria;Pasteurellales;Pasteurellaceae;Aggregatibacter;multispecies_spp35_3 0 0 0 0 0 0 0 0 0 0 0 0 0 0 0 0 0 0 0 0 0 0 0 0 0 0 0 0 0 0 0 0 0 0 0 0 0 0 0 0 0 0 0 0 0 0 0 0 0 0 0 0 0 0 0 0 0 0 0 0 0 0 0 0 0 0 0 0 0 0 0 0 0 0 0 0 0 0 0 0 0 0 0 0 0 0 0 0 0 0 0 0 0 0 0 0 0 0 0 0 0 0 0 0 0 0 0 0 0 0 0 0 0 0 0 0 0 0 0 0 0 0 0 0 0 0 0 0 0 0 0 0 0 0 0 0 0 0 0 0 0 0 0 0 0 0 0 0 0 0 0 0 0 0 0 0 0 0 0 0 0 0 0 0 0 0 0 0 0 0 0 0 0 0 0 0 0 0 0 0 0 0 0 0 0 0 0 0 0 0 0 0 0 0 0 0 0 0 0 0 0 0 0 0 0 0 0 0 0 0 0 0 0 0 0 0 0 0 0 0 0 0 0 0 0 0 0 0 0 0 0 0 0 0 0 0 0 0 0 0 0 0 0 0 0 0 0 0 0 0 0 0 0 0 0 0 0 0 0 0 0 0 0 0 0 0 0 0 0 80 1 0 3 4 65 0 11 115 340 20 78 72 0 51 576 167 89 31 0 61 25 5 116 0 55 221 77 15 0 184 3 7 100 28 8 24 77 0 39 0 9 23 0 1 39 16 0 31 3 0 5 57 59 0 5 17 1 0 0 0 4 94 0 5 0 0 2 1 0 0 9 0 0 8 388 0 0 0 1 0 17 27 0 28 0 0 0 2 27 0 0 46 0 71 0 1 0 64 37 0 9 0 37 216 9 80 0 0 1 165 0 1 78 45 0 7 126 0 0 0 0 0 0 171 23 23 25 0 4 14 57 0 0 173 0 9 2 114 0 1 32 229 0 217 9 0 11 0 279 0 25 15 175 6 0 222 3 0 0 3 1 257 19 225 0 24 3 0 0 0 20 0 0 1 0 13 1 0 63 207 262 3 43 0 1 2 0 0 0 80 96 66 0 33 0 124 0 73 0 4 1 52 0 31 11 0 282 32 0 140 19 34 0 23 98 144 74 37 1 128 148 0 0 95 112 0 0 1 0 101 48 37 0 0 40 0 6 26 0 0 2 0 0 229 0 0 8 99 0 0 1 302 1 1 139 24 0 78 6 25 0 3 1 0 990 0 196 0 3 2 0 257 110 0 2 9 214 6 20 4 42 8 0 2 16 0 0 2 0 117 1 82 4 56 3 45 0 0 0 174 9 0 7 1 29 31 254 179 8 0 0 9 10 0 2 49 67 0 2 0 0 0 15 7 0 225 0 3 0 0 0 18 0 166 36 0 0 7 12 358 697 115 198 1 18 1 9 0 23 8 0 3 142 4 6 1 3 0 2 998 152 18 9 2 19 28 29 0 13 145 0 874 201 218 389 0 1 57 2 0 1 5 1 14 12 7 111 4 2 59 51 0 111 29 10 0 1 0 33 15 100 44 0 150 0 16 48 3 2 8 0 27 185 1 0 267 119 412 9 109 72 0 0 2 46 509 0 0 0 60 0 21 9 5 0 6 25 0 0 668 19 0 85 28 0 119 0 3 69 35 0 4 71 6 0 21 19 69 9 82 19 9 0 14 1 9 29 71 55 68 38 100 269 1 13 0 0 45 32 15 56 115 190 0 14 97 44 49 0 189 56 115 0 27 0 0 257 101 0 131 25 12 391 25 0 70 197 0 96 87 1 7 0 1 0 0 1 2 11 0 0 93 0 40 1 68 347 0 0 7 24 3 8 0 0 7 0 0 183 84 19 0 2 0 0 23 9 0 14 379 1 0 41 0 0 0 0 15 71 0 1 2 8 0 3 1 7 160 14 5 4 3 109 0 6 1 3 21 52 0 3 615 2 21 36 2 217 6 0 0 0 0 16 24 19 3 0 531 141 904 1 296 0 341 88 14 42 10 111 0 4 2 2 32 278 0 14 3 840 792 25 0 0 0 0 0 1 0 157 0 56 0 7 0 14 0 5 523 1365 66 160 111 0 80 23 307 0 53 40 0 69 1 0 220 42 0 0 124 26 2 70 0 18 107 0 13 119 87 5 4 46 1 81 61 0 189 140 2 992 0 9 0 150 268 0 88 270 168 34 0 22 107 0 117 1 13 0 23 9 0 34 38 1 83 323 1 431 43 0 247 7 2 23 4 0 113 0 44 147 554 154 0 88 257 3 28 209 10 2 1 12 10 4 15 1 12 0 0 0 1 0 4 0 22 53 1 0 0 7 0 1 18 2 7 276 0 221 46 116 0 85 50 0 145 44 0 415 416 250 1 447 30 5 22 62 0 311 153 37 1 391 163 0 0 4 0 201 51 0 33 232 25 4 0 241 24 0 1 0 0 289 33 0 156 370 1117 1067 1 450 0 2 65 2 0 174 104 7 0 325 31 4 23 56 11 0 2 0 0 0 0 6 0 207 13 0 19 0 0 63 14 15 1 0 0 0 82 10 1 55 0 129 4 359 2 121 0 563 124 1 36 20 1 15 358 1 1 40 156 1 128 5 1 0 162 171 0 0 389 8 0 350 52 1 19 16 0 107 48 123 1 6 17 135 24 24 44 96 11 22 80 0 189 372 0 385 2 0 204 6 0 0 911 193 11 345 97 10 15 25 42 14 0 107 76 173 1 320 218 1 239 52 31 43 16 2 58 0 97 195 1 302 171 0 626 37 41 1 394 209 0 1 132 253 0 11 49 0 51 101 410 0 50 135 0 259 82 0 110 28 78 0 33 68 15 80 1 0 177 150 0 1 419 44 76 123 0 262 125 0 143 70 0 1 248 3 0 192 65 0 35 20 0 53 174 83 0 192 256 0 89 30 0 127 83 4 0 365 8 0 4 462 277 2 298 104 0 347 5 0 302 31 126 0 51 17 1 121 5 1 53 34 11 0 35 16 1 11 0 1 1 112 0 0 86 0 100 7 5 0 157 8 0 1481 307 329 212 50 0 359 14 66 0 960 196 3 111 34 0 1 89 31 86 9 23 19 1 737 6 0 320 45 36 107 1 925 196 6 94 139 2 27 11 37 0 51 2034 87 31 177 9 24 10 0 14 804 7 1 0 43 570 1 30 0 0 5 18 122 54 80 0 193 8 0 212 55 0 5 3 0 14 0 20 144 8 281 153 56 130 2 8 206 93 2 54 87 0 0 194 274 0 270 149 0 1 17 287 6 94 1 0 284 44 0 209 41 0 1 9 605 1 45 9 0 96 32 20 90 51 414 0 0 218 1095 102 1 275 42 18 14 28 0 104 0 7 5 130 72 10 0 101 0 29 64 9 1 120 1 0 12 2 0 0 71 14 3 61 102 25 138 70 6 63 565 96 160 703 75 0 3 36 29 35 26 11 0 760 27 1 8 662 9 2 281 59 0 214 194 0 0 19 0 0 14 58 0 368 284 0 128 3 319 64 159 4 35 24 0 0 131 12 0 169 34 223 0 240 313 4 98 98 80 558 0 0 62 66 0 1 119 0 2 172 3 55 105 3 17 430 167 0 11 33 1 12 233 0 63 350 58 1 136 251 0 97 162 0 1077 13 0 0 87 182 0 3 48 0 0 551 197 0 94 9 1 745 97 117 0 7 421 1 235 35 0 156 88 0 0 58 54 0 5 137 0 184 926 125 19 76 43 0 0 83 34 0 125 44 0 204 116 0 392 425 0 0 477 40 9 239 6 0 224 7 47 26 1397 80 3 960 377 2 21 399 0 19 0 0 0 304 22 0 227 4 3 74 0 0 107 13 35 283 69 110 254 40 1340 330 27 38 307 2 91 0 0 85 85 0 82 7 0 0 13 15 0 121 50 9 207 81 9 314 410 12 1 71 48 12 57 169 51 39 2 1654 429 605 24 290 519 0 290 21 27 133 59 53 0 0 24 0 1 1 15 2 18 0 53 665 0 395 213 62 228 0 0 498 361 7 117 1 0 63 2 0 529 97 141 8 738 76 0 57 402 2 49 56 33 1 87 87 0 72 7 1 0 34 116 6 296 181 0 0 39 32 0 88 27 3 308 9 0 71 33 53 0 47 44 0 100 4 52 64 80 75 64 0 SPP36 Bacteria;Actinobacteria;Actinobacteria;Actinomycetales;Actinomycetaceae;Schaalia;multispecies_spp36_3 0 0 0 0 0 0 0 0 0 0 0 0 0 0 0 0 0 0 0 0 0 0 0 0 0 0 0 0 0 0 0 0 0 0 0 0 0 0 0 0 0 0 0 0 0 0 0 0 0 0 0 0 0 0 0 0 0 0 0 0 0 0 0 0 0 0 0 0 0 0 0 0 0 0 0 0 0 0 0 0 0 0 0 0 0 0 0 0 0 0 0 0 0 0 0 0 0 0 0 0 0 0 0 0 0 0 0 0 0 0 0 0 0 0 0 0 0 0 0 0 0 0 0 0 0 0 0 0 0 0 0 0 0 0 0 0 0 0 0 0 0 0 0 0 0 0 0 0 0 0 0 0 0 0 0 0 0 0 0 0 0 0 0 0 0 0 0 0 0 0 0 0 0 0 0 0 0 0 0 0 0 0 0 0 0 0 0 0 0 0 0 0 0 0 0 0 0 0 0 0 0 0 0 0 0 0 0 0 0 0 0 0 0 0 0 0 0 0 0 0 0 0 0 0 0 0 0 0 0 0 0 0 0 0 0 0 0 0 0 0 0 0 0 0 0 0 0 0 0 0 0 0 0 0 0 0 0 0 0 0 0 0 0 0 0 0 0 0 0 59 2 0 4 6 23 0 122 124 125 0 110 71 0 91 44 10 0 0 0 13 30 1 6 0 91 14 5 68 0 36 32 0 86 13 1 9 88 0 25 1 13 1 1 0 2 51 0 19 17 0 0 6 0 0 1 0 3 0 1 0 1 13 0 1 1 0 0 1 1 0 0 1 0 32 19 2 1 8 1 0 2 2 0 17 0 0 0 21 2 0 0 18 0 51 2 0 0 3 9 0 11 0 3 11 0 4 0 0 0 17 0 0 33 3 0 0 2 29 0 0 0 0 0 33 0 44 2 0 0 10 0 0 0 60 16 0 0 0 0 0 4 125 0 42 175 0 11 0 231 0 43 71 44 23 0 191 0 0 8 0 0 0 94 16 0 6 106 0 0 1 266 1 0 0 0 39 1 1 9 80 132 1 82 0 11 5 0 65 0 93 11 0 0 1 4 21 0 117 0 0 4 36 0 40 2 0 21 41 1 27 2 29 5 166 38 107 15 5 0 23 2 0 11 50 30 0 5 98 0 33 80 0 0 0 7 0 1 0 5 0 15 11 0 1 0 0 0 8 0 0 0 25 0 0 4 36 0 2 2 5 0 13 3 8 10 0 2 34 0 5 0 3 2 0 7 0 45 114 0 2 137 36 0 0 8 2 0 0 0 48 0 89 0 73 127 262 0 0 0 1 1 0 0 16 0 0 5 0 1 0 0 6 7 0 51 25 9 0 0 1 43 0 0 0 0 68 0 4 0 0 0 258 0 89 0 0 0 1 0 8 12 2 4 0 17 49 4 0 5 16 0 0 3 0 0 137 52 0 2 35 9 0 4 0 6 1 73 0 44 16 3 55 16 213 11 0 0 30 10 13 41 0 0 7 1 86 217 0 0 26 2 0 77 145 21 8 43 0 6 23 0 0 0 51 0 1 9 0 8 0 0 120 182 0 0 38 77 0 26 63 2 0 0 2 0 3 0 0 0 20 60 0 33 186 0 5 70 1 36 1 21 0 96 138 0 11 0 0 1 148 0 0 30 3 0 12 26 1 30 2 167 142 0 13 0 13 6 35 40 7 0 166 162 0 6 0 0 2 70 2 52 0 55 0 50 68 11 36 0 10 2 1 0 1 0 0 32 49 0 114 31 0 105 72 0 7 5 0 93 70 231 0 0 0 40 0 19 2 0 0 3 1 1 67 0 0 12 0 0 0 0 0 0 1 0 0 24 0 203 0 7 0 1 0 0 14 0 0 30 10 15 2 3 1 0 0 0 1 22 0 0 5 0 0 2 59 0 12 0 2 24 13 3 0 0 0 0 4 20 0 0 1 1 0 10 1 17 43 6 0 0 0 11 1 0 0 5 18 2 0 45 54 1 6 19 9 108 6 21 0 17 45 0 48 0 0 333 1 146 50 70 0 0 0 3 0 2 0 4 0 78 0 414 0 0 0 0 0 0 84 61 26 0 6 47 0 0 202 231 0 2 0 0 13 0 0 0 66 89 0 5 0 10 194 0 12 0 41 31 59 18 1 9 3 0 1 18 0 13 0 36 0 212 74 0 11 73 95 40 0 0 2 0 25 0 1 0 0 7 0 70 1 0 18 80 0 20 12 89 90 12 0 23 16 0 34 0 73 0 79 112 0 4 23 0 36 0 19 77 0 6 14 4 0 2 254 0 0 0 0 0 3 0 0 178 37 0 0 7 0 4 20 0 9 2 0 6 1 0 0 1 1 0 2 1 0 1 0 7 0 2 0 0 5 0 0 0 3 5 0 0 0 0 0 0 0 5 5 0 0 1 2 0 0 4 8 0 0 0 0 3 0 0 6 1 2 10 0 0 0 0 0 0 0 0 18 0 0 2 1 0 3 0 0 0 0 1 0 0 0 0 0 8 0 0 0 0 0 0 0 0 0 4 0 0 0 0 0 0 13 0 0 6 2 1 0 1 11 0 0 0 0 0 6 1 0 0 1 0 1 0 0 0 0 0 0 0 19 1 0 2 0 0 0 0 0 0 0 1 0 0 0 0 1 0 0 0 1 0 1 0 8 27 0 0 0 0 0 0 0 0 4 0 0 0 4 0 0 0 2 21 0 1 13 2 0 0 0 0 5 1 0 2 18 0 4 0 0 1 0 3 8 0 0 0 0 0 1 2 0 0 1 1 0 8 18 0 0 0 15 0 0 6 0 9 2 0 0 0 0 0 1 1 0 0 0 0 4 1 0 0 0 0 2 0 0 2 2 0 0 0 0 1 2 3 0 1 0 0 3 2 0 0 4 17 0 14 2 0 0 0 0 0 0 2 0 1 0 0 0 4 3 0 2 2 0 1 0 0 0 2 2 0 2 0 0 10 0 0 2 4 0 0 0 4 0 0 0 1 0 3 0 0 0 0 10 3 0 0 13 0 0 3 1 5 11 1 0 2 1 0 0 4 1 0 5 0 0 0 0 0 0 1 3 1 0 2 0 0 0 0 0 2 0 3 2 0 0 15 0 1 5 0 0 2 0 1 2 4 0 0 0 0 0 54 1 0 0 8 1 0 1 1 0 0 1 2 3 0 0 4 0 0 3 0 0 0 0 0 0 0 0 2 0 4 4 0 3 0 0 1 34 0 1 2 0 0 3 2 0 3 15 0 0 0 4 0 0 0 0 29 0 0 6 0 0 0 0 9 0 4 21 0 0 0 0 1 5 1 0 0 1 6 8 0 0 4 0 0 4 0 3 0 0 0 1 1 0 0 1 0 2 2 0 0 0 1 0 0 0 0 0 0 0 0 0 2 0 0 0 0 1 69 2 0 0 0 0 0 7 3 0 0 0 0 0 0 0 0 4 1 0 14 10 0 3 3 0 0 0 0 0 5 0 0 1 36 0 0 0 0 0 0 0 0 2 0 0 0 0 0 9 0 2 0 1 7 0 5 0 3 6 0 0 1 7 0 1 52 0 0 2 0 1 0 0 0 13 16 0 0 4 0 0 2 0 2 0 0 0 0 10 0 0 1 0 1 1 0 0 1 2 0 0 0 0 0 0 5 0 7 0 0 1 2 0 0 0 2 0 4 0 0 0 0 0 0 0 1 0 0 0 0 3 13 0 0 16 1 0 0 0 53 0 0 0 0 0 0 0 2 1 0 0 3 0 0 2 0 0 0 0 0 0 5 4 0 7 7 0 0 2 0 0 0 0 0 2 0 0 0 0 0 5 1 0 4 4 0 5 0 0 1 0 1 1 0 6 0 0 1 0 0 27 1 0 0 0 0 0 2 0 0 0 0 0 1 0 0 0 19 0 0 2 2 0 0 0 1 0 0 3 18 1 0 12 10 0 10 0 0 2 0 0 0 0 0 0 0 0 0 6 0 0 2 8 0 2 0 0 6 0 0 0 3 0 4 0 0 4 3 0 0 0 20 0 0 9 0 1 0 0 0 0 0 0 0 3 0 0 13 0 0 0 0 0 0 1 0 0 0 1 0 1 0 0 6 5 0 0 1 6 0 0 1 0 0 0 0 0 0 0 0 0 SPP38 Bacteria;Fusobacteria;Fusobacteria;Fusobacteriales;Fusobacteriaceae;Fusobacterium;multispecies_spp38_2 0 0 0 0 0 0 0 0 0 0 0 0 0 0 0 0 0 0 0 0 0 0 0 0 0 0 0 0 0 0 0 0 0 0 0 0 0 0 0 0 0 0 0 0 0 0 0 0 0 0 0 0 0 0 0 0 0 0 0 0 0 0 0 0 0 0 0 0 0 0 0 0 0 0 0 0 0 0 0 0 0 0 0 0 0 0 0 0 0 0 0 0 0 0 0 0 0 0 0 0 0 0 0 0 0 0 0 0 0 0 0 0 0 0 0 0 0 0 0 0 0 0 0 0 0 0 0 0 0 0 0 0 0 0 0 0 0 0 0 0 0 0 0 0 0 0 0 0 0 0 0 0 0 0 0 0 0 0 0 0 0 0 0 0 0 0 0 0 0 0 0 0 0 0 0 0 0 0 0 0 0 0 0 0 0 0 0 0 0 0 0 0 0 0 0 0 0 0 0 0 0 0 0 0 0 0 0 0 0 0 0 0 0 0 0 0 0 0 0 0 0 0 0 0 0 0 0 0 0 0 0 0 0 0 0 0 0 0 0 0 0 0 0 0 0 0 0 0 0 0 0 0 0 0 0 0 0 0 0 0 0 0 0 0 0 0 0 0 0 112 4 0 8 4 34 0 9 22 39 1 125 197 23 148 62 3 10 2 0 14 171 15 98 0 193 25 77 27 0 63 0 28 483 56 9 0 19 0 163 0 103 6 0 0 20 38 0 2 0 3 2 0 1 0 0 0 2 0 5 0 0 5 204 0 0 0 0 3 0 0 15 3 0 11 2 0 0 3 0 0 2 12 49 0 1 0 13 3 0 0 0 8 0 0 0 0 8 8 124 0 14 1 0 24 34 0 0 0 0 36 0 0 12 4 1 3 15 2 0 0 0 2 0 85 314 4 179 0 43 163 11 0 0 13 171 0 3 29 5 33 3 20 0 0 0 1 8 0 14 0 6 0 11 67 0 25 1 0 5 0 1 1 89 6 0 5 0 0 0 2 2 16 0 0 6 24 0 0 473 24 0 0 33 15 0 13 0 11 0 55 18 1 5 122 0 10 1 89 13 0 76 35 22 0 1 6 19 2 26 17 20 1 2 2 344 184 1208 140 47 127 6 38 4 230 694 969 0 2 0 181 281 663 0 0 106 0 0 2 4 0 45 0 76 6 4 4 12 4 0 36 0 15 1 1 0 5 0 39 2 1 56 197 3 4 36 0 16 0 4 0 0 28 34 109 0 0 57 24 0 13 186 4 78 1 2 0 0 0 0 442 0 29 129 151 8 100 0 0 0 0 0 0 2 6 0 5 33 0 18 0 4 8 5 0 0 185 173 28 97 0 9 0 0 2 0 54 0 19 0 0 0 12 0 178 2 0 0 1 2 61 581 10 13 280 0 0 1 0 0 0 0 1 1 0 4 3 1866 0 3 202 0 25 8 7 0 52 4 0 21 3 0 181 48 144 32 0 0 1 2 3 10 13 0 29 1 16 29 4 52 1 1 0 34 32 10 0 6 0 4 2 2 0 9 4 0 4 87 0 4 0 1 6 6 1 0 0 0 2 4 17 842 0 0 12 0 15 0 10 0 4 10 24 1 6 189 1 12 364 1 9 14 0 159 2 0 0 2 0 5 1 67 23 20 0 0 5 482 429 67 149 99 45 16 6 767 0 20 24 296 63 39 37 238 0 18 12 15 10 19 2 15 9 149 2 29 0 9 25 0 836 28 356 515 1 4 0 109 24 0 204 32 263 310 14 0 9 2 0 64 28 2 0 0 3 1 11 14 20 142 14 11 205 16 35 0 11 47 0 0 0 0 1 1 78 0 0 1 0 10 1 62 0 0 25 8 32 104 0 2 32 2 2 0 1 0 0 1 0 43 0 2 67 0 0 36 6 171 2 2 4 3 16 2 0 0 2 0 0 2 0 0 13 5 0 156 15 37 1 2 0 1 1 7 2 46 36 0 1262 228 11 2 2 247 13 26 1 342 2 29 15 2 14 4 72 1 0 10 3 14 0 19 0 0 0 0 0 0 0 7 0 28 0 8 0 16 0 0 35 57 4 5 3 0 4 156 44 0 1 2 0 0 0 0 168 0 0 0 20 19 0 78 64 12 90 0 24 0 226 0 31 63 0 562 12 0 17 49 136 3 1 17 524 252 219 0 136 66 0 0 1 11 5 0 718 0 25 0 186 32 0 0 1 0 52 32 0 352 85 0 0 1 0 37 34 0 34 0 163 28 220 260 244 17 116 130 100 22 1 0 0 0 1 1 3 4 33 0 0 1 0 0 2 1 2 20 10 2 0 0 0 0 4 0 172 32 0 186 141 36 0 61 19 16 228 32 0 2 39 97 0 154 14 0 0 19 2 10 6 1 12 14 3 0 4 0 0 125 99 0 2 392 36 11 0 78 281 0 8 72 0 48 19 32 5 29 68 10 0 288 0 2 238 43 0 18 96 2 0 32 9 2 82 21 14 0 1 1 1 0 0 2 0 130 363 0 3 42 0 6 2 38 0 5 12 0 2 3 0 2 69 23 5 1440 12 314 0 18 1 0 125 7 0 8 0 10 0 27 16 1 23 14 0 0 114 17 0 0 312 8 0 229 18 5 19 13 0 4 129 45 0 0 6 162 5 4 2 7 34 3 133 1 9 43 2 145 2 1 1 0 0 0 87 15 20 80 85 9 49 10 16 88 0 201 25 8 20 354 1194 23 232 198 8 11 91 18 1 1 210 8 11 231 72 0 103 11 29 0 28 56 5 0 205 57 0 13 10 0 8 15 139 0 33 195 3 519 200 1 2 30 1 0 7 75 7 19 0 2 216 21 5 0 25 7 773 150 5 104 3 2 56 161 67 2 116 11 0 259 279 12 8 5 1 4 133 99 2 23 1 0 218 4 1 34 70 3 0 129 20 8 2 1119 31 2 68 2 0 72 15 0 14 10 36 2 67 36 15 63 6 0 16 30 11 0 38 62 13 5 4 18 3 17 19 0 42 0 16 0 14 16 249 6 1 55 41 15 45 13 0 404 20 73 1 183 40 67 75 37 0 0 3 1 0 51 710 13 2 190 3 0 649 152 2 6 0 85 3 2 11 25 3 30 42 40 1 354 131 11 27 62 177 2 13 0 5 73 10 0 0 6 44 0 16 7 0 0 73 0 2 285 1 40 2 0 219 13 0 2 3 0 0 0 2 29 1 94 40 0 113 13 1 4 2 14 13 14 1 1 58 420 1 111 46 3 4 18 174 2 81 6 0 71 20 7 145 10 0 1 4 117 5 1 10 0 75 175 1 18 22 458 2 23 100 265 61 0 92 58 33 6 14 0 18 7 4 2 40 2 1 1 47 1 65 46 11 0 45 12 0 4 20 0 0 4 1 1 12 1 10 312 192 1 190 103 8 376 360 140 8 12 110 51 4 6 2 0 225 122 0 8 36 16 4 30 19 3 40 64 0 0 116 1 0 5 3 0 310 193 0 14 0 67 137 165 0 32 1 1 0 84 8 0 86 15 12 0 46 21 3 40 9 10 147 0 0 189 399 3 5 69 1 1 132 5 38 36 21 10 229 54 0 32 2 12 7 160 0 64 235 31 0 248 665 0 5 40 1 62 7 12 5 169 129 32 6 0 3 0 69 49 5 71 12 0 188 25 7 1 1 26 0 81 10 0 157 133 0 0 9 76 0 0 5 0 104 739 33 7 244 855 0 1 29 9 0 60 29 0 73 5 0 21 143 8 0 18 2 0 141 28 0 81 11 4 10 195 11 123 689 94 1 4 69 3 3 0 0 0 79 18 13 178 154 0 38 1 0 18 39 7 44 58 65 25 62 8 76 15 25 12 2 24 2 14 48 83 0 59 9 0 0 26 5 5 30 8 25 85 252 84 8 185 9 0 0 19 0 36 5 17 37 0 407 76 10 7 21 681 21 123 16 3 142 1 5 2 0 2 0 0 7 0 3 5 0 169 76 13 433 23 134 15 0 0 617 88 1 0 4 0 38 73 1 229 1 524 23 374 580 2 30 231 0 8 30 0 1 26 451 0 7 1 0 1 27 66 2 207 696 0 0 0 29 0 28 16 9 38 5 2 3 185 0 0 2 2 0 119 1 6 147 269 1 15 0 SPP39 Bacteria;Bacteroidetes;Bacteroidia;Bacteroidales;Prevotellaceae;Alloprevotella;multispecies_spp39_2 0 0 0 0 0 0 0 0 0 0 0 0 0 0 0 0 0 0 0 0 0 0 0 0 0 0 0 0 0 0 0 0 0 0 0 0 0 0 0 0 0 0 0 0 0 0 0 0 0 0 0 0 0 0 0 0 0 0 0 0 0 0 0 0 0 0 0 0 0 0 0 0 0 0 0 0 0 0 0 0 0 0 0 0 0 0 0 0 0 0 0 0 0 0 0 0 0 0 0 0 0 0 0 0 0 0 0 0 0 0 0 0 0 0 0 0 0 0 0 0 0 0 0 0 0 0 0 0 0 0 0 0 0 0 0 0 0 0 0 0 0 0 0 0 0 0 0 0 0 0 0 0 0 0 0 0 0 0 0 0 0 0 0 0 0 0 0 0 0 0 0 0 0 0 0 0 0 0 0 0 0 0 0 0 0 0 0 0 0 0 0 0 0 0 0 0 0 0 0 0 0 0 0 0 0 0 0 0 0 0 0 0 0 0 0 0 0 0 0 0 0 0 0 0 0 0 0 0 0 0 0 0 0 0 0 0 0 0 0 0 0 0 0 0 0 0 0 0 0 0 0 0 0 0 0 0 0 0 0 0 0 0 0 0 0 0 0 0 0 0 0 0 0 0 0 0 0 0 4 0 7 1 1 0 0 0 0 0 0 5 7 0 1 0 18 40 1 0 0 2 0 7 50 16 2 0 0 0 0 0 0 0 0 0 0 0 0 0 0 0 0 0 5 0 0 0 0 0 0 0 0 0 0 0 0 0 0 0 0 0 0 16 0 0 0 0 0 0 0 0 0 0 0 0 0 0 0 0 0 0 0 1 0 0 0 0 0 0 0 0 5 0 0 29 1 0 0 0 0 4 0 0 0 0 0 0 0 0 0 0 0 0 0 0 0 0 3 0 0 0 0 0 0 0 0 0 0 0 0 0 0 0 0 0 0 0 0 0 32 0 0 0 0 0 0 8 0 0 0 0 0 0 1 0 0 0 5 0 13 0 0 0 0 0 0 0 0 0 44 2 0 0 15 0 0 0 0 1 1 1 0 0 0 0 0 0 0 18 0 0 0 0 0 1 0 0 0 0 0 0 0 0 0 3 22 14 21 3 0 5 13 0 0 232 144 35 0 0 0 1 11 10 0 0 2 0 0 0 0 0 0 0 0 0 0 0 0 0 0 0 0 0 0 0 18 0 0 0 0 6 0 0 6 0 2 0 0 259 0 5 0 1 0 1 0 0 8 2 0 0 11 0 0 0 0 0 0 0 0 19 0 4 80 8 0 28 0 0 0 0 0 0 0 0 1 0 0 0 0 0 0 0 0 0 0 0 1 0 1 0 0 0 0 0 0 10 1 0 0 9 0 5 0 10 0 0 0 0 0 2 0 0 0 0 0 0 0 0 0 0 0 0 0 0 0 2 0 0 0 3 41 0 0 0 1 1 0 0 0 0 0 5 0 0 4 0 0 1 19 0 0 0 0 0 0 0 10 0 1 0 0 0 1 1 3 0 0 0 0 0 0 0 0 0 0 0 1 0 0 0 0 2 0 0 0 3 6 0 0 3 0 0 0 0 22 0 0 0 0 0 6 4 0 0 0 0 0 74 0 1 0 3 72 0 0 0 0 0 0 0 0 0 1 0 0 1 16 15 0 0 1 0 0 0 24 0 1 0 19 1 0 3 101 0 0 0 0 0 0 0 13 0 85 0 0 0 0 0 1 37 2 0 18 0 0 0 0 0 0 0 0 3 5 18 0 0 1 0 0 15 0 0 0 0 0 0 0 0 0 0 0 3 0 0 0 3 1 0 0 0 0 0 0 0 0 0 0 0 6 0 0 0 0 0 0 0 0 0 0 0 0 0 0 0 0 0 0 5 9 0 0 0 0 1 0 0 1 0 0 0 5 0 0 0 0 0 0 0 1 0 0 34 1 0 10 0 2 1 0 1 0 0 0 21 0 0 0 56 8 0 0 44 5 59 11 0 57 0 0 0 0 1 49 0 0 0 0 1 27 0 0 0 0 0 0 0 0 0 2 0 0 0 0 0 0 0 0 0 5 0 0 0 0 0 3 0 0 0 0 5 0 0 0 1 0 0 0 0 6 0 2 1 0 0 0 0 2 53 0 5 0 0 5 0 0 0 2 5 0 0 0 0 116 25 0 26 3 0 0 0 0 0 0 188 0 6 0 0 11 0 0 1 0 0 0 0 47 5 0 0 0 0 12 12 0 0 0 25 19 3 5 0 0 3 0 0 254 8 0 0 0 0 0 4 0 0 0 0 0 0 0 1 0 0 3 0 0 0 0 0 0 0 0 0 0 0 2 8 4 0 6 6 0 29 16 0 0 5 2 0 0 0 0 39 0 0 0 0 0 0 2 7 0 0 0 0 1 8 0 0 2 0 0 0 1 87 0 0 0 0 2 0 3 0 0 0 0 0 0 0 1 6 0 0 1 4 0 0 0 0 1 2 0 0 0 0 0 0 0 0 0 0 0 0 0 0 0 0 0 0 0 0 0 0 0 4 0 0 0 0 0 2 166 0 0 0 0 0 0 0 2 0 0 0 0 0 0 0 0 0 2 0 0 0 18 0 1 12 0 0 10 0 0 1 2 0 0 0 0 0 0 0 0 0 0 0 0 12 1 5 0 0 0 0 0 0 0 0 0 0 0 0 2 0 0 7 1 0 0 0 0 0 21 0 0 0 2 53 2 1 9 1 0 0 2 0 0 16 0 0 7 0 0 1 0 3 0 10 42 0 0 38 12 0 0 1 0 0 0 44 0 9 3 0 0 10 0 0 0 0 0 1 7 0 0 0 0 21 84 0 0 1 0 3 3 0 0 0 0 9 262 19 0 8 0 0 3 7 2 0 0 0 0 97 22 0 0 0 0 0 0 0 1 0 0 0 1 0 0 0 55 0 0 14 1 0 10 0 0 1 0 0 0 9 0 0 1 1 0 0 0 0 0 0 0 0 0 0 0 0 1 0 0 15 0 0 0 0 0 0 0 0 97 22 0 3 0 0 0 7 6 0 0 0 0 0 2 0 0 0 0 0 0 68 10 0 0 0 0 15 0 0 0 0 0 0 0 2 4 0 0 23 0 0 11 14 5 124 0 0 0 0 0 0 0 0 0 0 0 0 0 0 0 0 0 0 0 0 0 0 3 1 0 9 0 0 0 0 0 0 0 0 8 0 0 32 2 1 0 0 0 0 0 0 0 0 0 0 8 0 20 11 0 0 0 52 0 0 0 0 10 0 1 1 1 0 0 0 12 1 0 11 0 0 0 0 0 0 0 0 0 0 0 0 0 0 3 0 0 18 0 0 0 0 0 0 0 0 0 0 0 0 27 0 0 0 0 0 0 0 0 0 0 0 0 1 0 0 2 111 1 7 0 9 49 28 5 0 0 2 2 2 0 0 0 10 5 0 0 0 0 0 0 0 1 1 5 0 0 8 0 0 0 0 0 1 2 0 0 0 0 7 2 0 0 1 0 0 0 0 0 17 0 6 0 10 7 0 2 0 0 0 0 0 7 0 4 0 1 0 0 0 0 0 3 0 0 0 2 0 0 0 1 1 77 0 0 5 0 0 0 3 0 0 3 1 0 0 0 3 55 12 0 0 0 1 0 0 0 0 0 0 0 2 0 5 0 0 24 0 0 8 0 3 10 0 0 0 1 0 0 0 0 0 6 1 1 7 0 0 12 0 0 0 9 3 0 1 0 0 0 0 0 0 0 0 0 0 0 0 0 0 0 0 0 6 0 82 5 0 3 0 0 0 0 0 0 16 0 0 0 0 0 4 1 0 0 0 3 6 1 0 0 0 0 0 0 0 7 1 4 0 1 0 0 0 1 0 0 0 3 1 0 0 1 0 0 0 0 0 3 0 0 0 1 0 0 0 5 33 0 7 0 0 0 0 5 0 23 3 4 0 0 0 0 0 0 0 0 0 0 0 0 0 15 25 0 5 0 1 0 0 0 311 3 0 0 0 0 9 5 0 13 0 135 2 0 17 0 0 31 0 0 1 0 0 2 0 0 1 0 0 1 0 0 1 14 26 0 0 0 0 0 0 2 0 15 0 0 0 0 0 0 0 0 0 0 0 0 1 0 0 0 0 SPP40 Bacteria;Actinobacteria;Actinobacteria;Actinomycetales;Actinomycetaceae;Schaalia;multispecies_spp40_3 0 0 0 0 0 0 0 0 0 0 0 0 0 0 0 0 0 0 0 0 0 0 0 0 0 0 0 0 0 0 0 0 0 0 0 0 0 0 0 0 0 0 0 0 0 0 0 0 0 0 0 0 0 0 0 0 0 0 0 0 0 0 0 0 0 0 0 0 0 0 0 0 0 0 0 0 0 0 0 0 0 0 0 0 0 0 0 0 0 0 0 0 0 0 0 0 0 0 0 0 0 0 0 0 0 0 0 0 0 0 0 0 0 0 0 0 0 0 0 0 0 0 0 0 0 0 0 0 0 0 0 0 0 0 0 0 0 0 0 0 0 0 0 0 0 0 0 0 0 0 0 0 0 0 0 0 0 0 0 0 0 0 0 0 0 0 0 0 0 0 0 0 0 0 0 0 0 0 0 0 0 0 0 0 0 0 0 0 0 0 0 0 0 0 0 0 0 0 0 0 0 0 0 0 0 0 0 0 0 0 0 0 0 0 0 0 0 0 0 0 0 0 0 0 0 0 0 0 0 0 0 0 0 0 0 0 0 0 0 0 0 0 0 0 0 0 0 0 0 0 0 0 0 0 0 0 0 0 0 0 0 0 0 0 0 0 0 0 0 22 3 8 8 50 14 0 21 12 52 4 95 63 263 28 122 21 62 9 49 111 67 72 28 1 18 32 167 58 0 40 106 0 244 73 9 9 77 0 253 7 8 72 8 0 109 27 0 2 19 52 0 31 95 0 291 2 4 0 70 0 1 33 7 2 25 0 1 1 13 3 0 40 0 1 2 20 7 10 24 0 0 17 33 1 9 0 2 8 0 0 0 0 5 6 0 2 11 13 0 0 0 3 88 229 8 1 0 1 16 1 6 0 1 17 4 0 0 7 1 20 7 4 0 41 1 27 8 1 11 4 281 1 16 72 0 0 0 8 1 7 11 6 5 112 2 2 16 0 202 4 18 45 50 24 14 36 19 0 1 38 1 13 26 0 10 67 46 23 45 3 12 3 4 2 66 59 3 21 57 10 84 39 7 11 94 121 3 2 20 5 0 1 24 1 1 22 651 126 1 2 119 89 7 61 27 29 16 5 12 25 7 224 24 108 17 42 4 1 0 42 31 0 12 144 0 1 75 72 49 308 178 2 146 5 2 0 470 0 6 21 263 325 0 13 3 26 9 30 0 417 1 31 22 11 4 12 22 8 2 43 0 5 1 1 2 0 31 6 0 26 18 86 106 818 3 1 3 252 24 139 35 4 10 2 9 0 0 10 253 81 3 60 318 114 83 5 0 385 2 5 35 0 0 19 0 3 5 0 0 0 2 11 11 0 19 2 3 0 2 1 64 2 4 143 1 84 50 112 0 3 0 43 9 0 0 0 0 2 3 1 0 25 39 0 32 11 5 0 17 1 200 51 0 0 68 6 9 21 93 6 9 3 0 6 52 42 41 1 77 33 5 106 16 29 151 414 0 59 29 30 9 125 30 5 2 14 52 359 0 9 4 4 15 23 21 3 136 14 494 91 1085 2 1 17 1 67 2 0 5 3 52 8 17 1 64 50 8 5 5 2 86 100 17 4 3 3 1 17 3 19 2 335 37 97 3 67 15 0 23 8 24 7 20 20 7 30 4 4 10 14 1 63 26 7 26 53 59 38 59 104 116 46 3 11 52 8 52 84 18 8 0 8 109 69 13 0 0 15 168 4 35 121 3 0 19 7 4 49 9 16 2 13 60 0 19 0 25 29 84 74 0 0 116 2 2 175 7 0 52 56 1 0 0 51 53 9 74 8 84 0 8 5 37 3 4 116 1 0 433 8 77 53 24 5 6 10 1 0 86 2 0 79 0 1 4 2 3 0 21 3 112 285 8 26 0 0 16 6 10 5 10 1 3 0 2 77 23 7 115 56 22 67 14 0 82 14 3 3 52 0 2 2 1 2 1 88 7 105 99 0 141 0 41 112 6 11 134 80 26 14 8 136 50 136 46 6 21 5 20 99 21 12 30 39 3 0 195 0 1 1 60 4 82 9 400 27 2 1 5 61 83 11 145 1 2 48 8 8 35 0 1 24 0 3 1 0 0 49 27 16 1 2 2 8 0 354 9 30 5 135 13 0 11 43 8 79 55 382 15 196 21 0 100 42 9 19 41 2 13 1 587 4 310 34 0 38 94 75 26 1 0 83 4 12 1 7 0 57 51 4 118 27 27 3 39 0 65 92 355 0 0 16 20 42 3 62 0 29 60 18 21 1 14 61 361 27 134 17 20 3 19 242 5 1 461 14 0 1 3 0 0 8 0 1 10 3 0 0 65 206 31 119 0 84 4 0 62 24 18 5 6 16 1 43 31 53 4 8 8 2 30 2 29 54 14 3 17 25 7 13 15 4 27 15 9 35 20 19 0 1 1 3 33 6 8 67 15 7 12 21 45 10 21 5 7 3 6 7 30 1 27 4 42 12 0 49 1 1 7 17 1 11 10 22 8 19 1 4 55 76 7 4 0 5 3 2 2 1 21 2 0 10 82 188 3 4 15 41 8 121 1 0 10 1 0 196 8 8 2 9 29 45 5 1 55 23 41 1 120 4 208 4 0 8 8 52 5 2 0 16 2 0 0 9 74 50 11 20 41 11 47 29 4 16 12 0 1 106 2 2 18 30 9 123 9 4 59 1 12 45 32 11 40 44 15 18 12 7 8 9 24 3 47 4 27 8 3 3 26 78 24 7 4 28 2 19 10 38 14 10 13 50 7 13 6 2 1 22 12 5 29 2 20 38 58 70 85 23 4 13 3 8 2 7 26 11 18 1 5 7 0 5 13 3 3 0 34 5 2 47 1 51 76 4 1 3 10 5 4 11 0 26 36 0 7 4 8 80 24 56 9 20 5 3 4 0 6 5 21 11 0 30 1 3 49 33 43 36 36 3 7 10 6 13 10 58 1 5 23 8 2 25 78 8 5 7 10 3 103 8 3 5 2 13 40 121 21 1 0 23 68 95 0 0 84 6 5 11 0 75 24 1 0 65 9 35 9 27 10 3 59 65 13 74 123 18 12 3 0 20 9 15 4 82 30 11 25 3 40 4 0 8 7 65 23 3 113 49 5 10 22 3 9 7 32 10 10 10 7 111 4 156 12 21 1 2 3 50 1 1 1 16 12 3 0 6 4 5 4 3 13 15 29 3 9 12 36 19 16 3 2 5 0 19 7 9 14 6 2 1 14 21 6 3 1 16 91 76 37 33 12 7 5 159 16 32 4 16 3 113 11 15 4 44 7 1 53 58 14 2 3 13 20 6 5 66 6 32 19 1 21 22 2 11 252 3 1 146 86 31 2 12 2 12 70 3 0 19 3 8 12 0 9 2 72 53 1 6 185 28 12 70 21 2 19 4 0 14 55 0 14 39 12 32 3 22 9 35 5 10 6 10 50 26 8 21 30 1 53 10 1 15 34 4 13 5 31 167 5 11 4 86 45 18 3 16 12 6 42 75 11 4 9 3 8 5 61 6 19 0 17 2 1 1 24 30 5 18 5 6 4 5 13 1 3 7 31 7 8 47 55 10 8 13 13 0 30 0 53 95 14 3 9 4 16 4 28 8 3 10 2 7 3 3 11 4 17 32 2 244 52 6 8 14 2 9 13 10 3 5 11 0 3 17 7 3 10 6 4 6 9 50 9 10 30 2 14 3 2 19 2 11 1 10 20 29 4 14 2 0 47 14 20 6 36 7 43 16 40 27 8 21 6 117 4 4 2 5 10 130 4 66 36 29 18 7 6 6 42 22 38 4 57 0 0 84 15 9 4 28 26 2 10 2 1 2 26 8 6 2 6 23 8 7 11 19 43 46 1 19 10 0 9 8 7 1 9 7 40 7 35 11 36 18 36 5 1 3 22 1 11 22 0 6 4 5 10 10 55 21 13 2 11 5 102 11 4 118 65 73 13 9 11 3 0 37 20 54 31 68 22 2 14 117 42 33 3 6 12 18 4 4 0 3 15 18 1 0 6 3 19 5 15 0 5 16 1 4 0 4 2 1 3 5 8 2 3 16 8 9 9 17 253 125 9 6 25 30 0 0 3 33 8 20 32 99 27 0 79 3 8 4 17 11 29 13 5 3 35 9 19 3 1 0 SPP47 Bacteria;Firmicutes;Bacilli;Lactobacillales;Streptococcaceae;Streptococcus;multispecies_spp47_21 0 0 0 0 0 0 0 0 0 0 0 0 0 0 0 0 0 0 0 0 0 0 0 0 0 0 0 0 0 0 0 0 0 0 0 0 0 0 0 0 0 0 0 0 0 0 0 0 0 0 0 0 0 0 0 0 0 0 0 0 0 0 0 0 0 0 0 0 0 0 0 0 0 0 0 0 0 0 0 0 0 0 0 0 0 0 0 0 0 0 0 0 0 0 0 0 0 0 0 0 0 0 0 0 0 0 0 0 0 0 0 0 0 0 0 0 0 0 0 0 0 0 0 0 0 0 0 0 0 0 0 0 0 0 0 0 0 0 0 0 0 0 0 0 0 0 0 0 0 0 0 0 0 0 0 0 0 0 0 0 0 0 0 0 0 0 0 0 0 0 0 0 0 0 0 0 0 0 0 0 0 0 0 0 0 0 0 0 0 0 0 0 0 0 0 0 0 0 0 0 0 0 0 0 0 0 0 0 0 0 0 0 0 0 0 0 0 0 0 0 0 0 0 0 0 0 0 0 0 0 0 0 0 0 0 0 0 0 0 0 0 0 0 0 0 0 0 0 0 0 0 0 0 0 0 0 0 0 0 0 0 0 0 0 0 0 0 0 2 6 2 2 15 1 0 0 0 8 3 41 19 19 0 4 26 30 7 19 23 39 14 19 30 59 7 11 26 5 1 16 31 8 7 30 13 12 35 8 7 25 5 22 4 15 24 4 6 9 16 2 5 3 15 0 3 0 0 0 0 0 1 3 11 13 3 0 0 0 0 18 3 0 0 1 4 0 21 1 0 2 4 15 46 9 1 3 3 5 3 0 69 27 22 9 2 2 3 10 13 0 9 17 1 16 28 2 0 3 2 1 0 0 0 0 1 1 13 6 0 3 4 2 0 3 7 3 19 0 7 8 12 1 0 2 0 0 0 9 23 3 11 8 5 1 4 5 23 0 7 0 13 3 3 4 6 3 21 1 0 26 24 4 20 13 10 12 5 0 2 0 1 1 6 7 10 20 0 2 4 8 1 2 12 1 0 9 2 4 6 6 5 1 0 4 2 29 0 7 0 1 4 12 56 9 28 5 32 30 4 24 7 5 0 1 7 13 8 14 1 8 12 10 0 9 13 2 4 2 9 17 12 90 0 4 1 0 13 23 0 0 4 2 20 4 2 11 3 7 3 5 10 21 21 30 9 4 30 5 21 5 5 10 1 7 21 0 5 6 16 14 22 5 3 2 0 5 6 5 6 1 9 2 8 3 0 1 0 6 2 2 1 2 9 2 1 3 0 9 4 15 1 0 3 7 2 1 1 3 0 0 1 9 17 0 1 4 0 1 12 0 0 8 0 4 4 3 31 5 0 0 0 2 0 6 2 50 11 4 11 14 4 9 6 2 2 8 7 0 20 5 2 11 8 1 43 3 25 1 15 13 3 2 44 2 8 9 11 2 3 0 4 12 5 5 14 22 0 9 71 8 6 11 1 7 6 2 3 15 0 0 1 3 0 3 7 2 1 4 1 35 36 7 1 10 1 11 40 16 4 1 19 0 6 2 44 3 3 0 1 1 33 0 10 2 6 5 0 12 2 48 3 4 9 16 32 21 3 2 11 4 2 2 2 1 0 8 0 25 1 2 1 20 5 0 3 4 21 25 6 62 2 3 0 1 41 1 14 1 9 72 13 3 10 3 12 5 4 7 9 11 19 74 41 14 8 2 3 34 33 8 1 10 21 4 12 2 11 21 10 11 21 6 19 2 15 60 6 11 17 11 2 9 0 1 1 8 6 0 4 20 0 10 7 7 0 18 20 0 5 4 44 28 4 0 1 14 12 20 17 6 9 7 44 7 0 26 62 0 0 1 10 2 0 0 0 0 6 8 27 6 0 1 24 0 0 9 2 10 18 6 1 1 0 4 2 0 0 11 6 0 20 10 8 0 11 11 22 4 27 0 5 0 5 3 0 2 3 1 4 5 2 4 6 36 1 2 0 4 15 29 0 0 0 19 4 62 0 7 7 29 33 76 0 1 12 1 0 0 5 24 5 0 1 0 3 15 28 40 7 7 22 22 0 4 5 3 0 8 10 8 4 7 19 3 5 0 0 8 15 6 14 1 8 2 6 8 17 19 1 9 10 0 49 22 27 33 27 5 3 13 33 10 15 8 187 25 3 20 13 1 8 23 7 12 26 1 8 20 7 7 4 1 1 27 10 3 5 10 18 11 0 1 43 9 21 5 0 1 8 9 1 36 7 10 40 1 3 20 10 8 0 15 1 6 11 5 1 4 0 0 0 3 0 76 0 23 0 0 8 9 2 1 9 5 8 0 34 23 25 21 50 62 31 19 20 14 14 10 52 55 13 47 10 28 44 11 20 4 33 15 15 18 12 0 10 17 33 17 26 35 6 15 34 9 14 2 35 39 27 26 22 30 32 18 5 35 22 49 18 0 22 33 41 12 30 17 11 27 55 60 17 22 13 13 3 11 9 47 2 15 31 12 24 26 5 6 22 10 16 13 13 9 17 7 21 47 8 8 5 31 3 28 2 10 29 10 11 8 21 29 16 7 2 6 18 22 2 14 5 14 13 29 0 24 21 29 15 17 32 13 13 32 24 3 1 0 27 81 30 50 17 5 50 30 3 34 23 3 56 24 15 9 16 23 9 39 6 11 4 14 17 8 17 24 14 16 14 23 30 33 16 12 8 13 33 20 30 14 50 38 43 37 37 12 75 30 12 3 32 28 12 28 12 18 74 45 41 17 30 21 23 18 4 5 15 10 17 15 20 10 7 29 18 36 6 10 33 31 11 18 28 34 14 12 37 47 22 47 12 18 61 51 23 24 44 24 9 8 34 19 18 8 8 24 6 4 20 25 39 19 37 12 57 37 54 36 18 14 15 28 38 13 36 28 10 26 4 18 29 21 26 55 37 32 124 28 9 14 19 20 15 27 4 28 15 3 11 32 29 20 6 13 14 35 21 3 41 31 30 8 21 7 72 58 39 67 14 17 10 14 65 18 21 40 19 46 55 101 15 15 44 10 19 45 27 20 32 25 11 1 10 5 27 43 74 8 32 30 23 28 21 12 22 39 20 20 7 23 31 39 48 23 29 24 18 77 44 39 39 8 61 27 27 31 1 58 59 17 56 66 26 17 74 33 6 10 10 23 14 11 8 6 2 3 9 5 19 37 23 43 7 11 4 4 2 8 13 20 5 12 30 5 20 19 10 12 29 7 44 35 6 25 29 2 30 17 43 19 31 5 11 26 12 6 6 54 38 2 30 14 38 32 12 9 43 20 22 3 25 21 14 20 7 9 13 50 35 14 2 25 35 1 15 6 3 21 18 10 31 23 15 14 8 12 15 7 35 13 1 5 16 33 11 60 4 65 45 13 27 26 6 14 16 15 27 4 26 1 29 13 40 12 16 4 17 23 70 78 15 29 28 36 10 23 27 22 34 2 30 42 58 13 21 12 14 13 19 18 3 5 21 7 22 15 8 30 7 15 20 12 10 7 15 21 26 9 25 30 31 12 3 19 26 35 30 40 17 36 6 30 22 37 23 22 60 35 31 18 15 14 5 13 15 29 24 18 17 24 61 39 53 21 26 60 25 25 33 35 33 24 20 13 17 42 16 31 56 22 35 13 69 30 34 45 39 34 19 31 7 25 47 47 38 52 21 35 83 24 16 13 40 17 24 9 25 29 20 38 18 75 23 29 10 43 26 23 14 44 38 28 27 58 30 31 32 61 23 41 27 25 47 8 81 48 24 31 74 45 28 32 43 60 37 6 5 41 9 28 44 26 53 36 11 9 44 37 12 25 27 49 17 10 62 7 13 36 9 26 15 29 68 74 11 21 40 15 19 13 20 24 5 6 6 5 7 12 12 7 15 5 10 7 2 10 5 6 1 0 15 8 24 11 18 38 7 28 25 34 5 2 24 37 23 71 49 23 18 22 0 21 25 12 47 26 17 11 16 17 20 17 14 4 44 13 18 20 25 5 40 18 51 31 40 46 16 15 18 15 44 28 15 33 24 41 5 28 22 16 10 10 7 41 10 6 19 28 30 54 0 2 40 25 35 50 20 22 8 33 13 65 14 50 17 22 58 50 55 47 16 42 31 9 48 13 SPP48 Bacteria;Firmicutes;Bacilli;Lactobacillales;Streptococcaceae;Streptococcus;multispecies_spp48_18 0 0 0 0 0 0 0 0 0 0 0 0 0 0 0 0 0 0 0 0 0 0 0 0 0 0 0 0 0 0 0 0 0 0 0 0 0 0 0 0 0 0 0 0 0 0 0 0 0 0 0 0 0 0 0 0 0 0 0 0 0 0 0 0 0 0 0 0 0 0 0 0 0 0 0 0 0 0 0 0 0 0 0 0 0 0 0 0 0 0 0 0 0 0 0 0 0 0 0 0 0 0 0 0 0 0 0 0 0 0 0 0 0 0 0 0 0 0 0 0 0 0 0 0 0 0 0 0 0 0 0 0 0 0 0 0 0 0 0 0 0 0 0 0 0 0 0 0 0 0 0 0 0 0 0 0 0 0 0 0 0 0 0 0 0 0 0 0 0 0 0 0 0 0 0 0 0 0 0 0 0 0 0 0 0 0 0 0 0 0 0 0 0 0 0 0 0 0 0 0 0 0 0 0 0 0 0 0 0 0 0 0 0 0 0 0 0 0 0 0 0 0 0 0 0 0 0 0 0 0 0 0 0 0 0 0 0 0 0 0 0 0 0 0 0 0 0 0 0 0 0 0 0 0 0 0 0 0 0 0 0 0 0 0 0 0 0 0 345 367 359 4786 2468 532 1055 2506 574 1480 2004 1678 1972 1285 441 1535 3342 2446 2716 4834 4808 4196 1078 2278 2123 7730 368 2750 2716 1153 5 2688 4893 1066 2520 2920 1294 4433 4296 3239 2632 7952 819 1256 338 11594 3302 413 546 910 3538 1015 1332 528 2099 12 3335 141 208 1 378 8 272 1193 743 5065 3785 129 177 229 1404 678 134 540 2 294 1624 174 2489 683 786 744 1190 3275 3442 998 1763 708 1557 2226 2347 344 2116 4007 2758 2603 1184 491 63 1646 959 0 2521 3362 568 2742 2758 422 684 2441 5182 1548 59 0 559 575 316 1327 3811 1443 18 144 770 80 1 511 4469 1549 3023 147 2564 1402 743 637 258 190 1792 1166 34 663 2524 2280 3008 2142 2357 703 1195 2115 1576 3 1607 244 2625 1214 842 2459 13230 1745 3473 885 1146 2457 8722 1938 1149 855 2021 2336 950 1448 734 894 446 637 697 3397 989 1682 476 621 1356 2829 373 1003 1939 660 293 4060 2644 5010 907 1402 1079 167 1990 541 1456 2542 460 422 169 176 3042 2569 2569 756 1248 3854 5593 3890 1108 2785 1442 2736 1104 789 1417 1550 751 2201 606 2782 1697 817 706 1572 2472 5495 2293 1410 14050 1486 1976 2279 4984 610 851 199 1679 2376 436 400 553 505 4025 215 2986 2012 936 1096 550 243 8284 2704 3315 4723 1212 733 769 949 2651 1230 324 1029 504 637 3094 2 2063 6267 4828 1219 2594 1183 1629 880 387 2658 2025 1806 235 728 1556 845 1829 796 281 624 306 3057 9543 867 1554 2042 601 1490 354 1913 127 1713 629 1729 2413 101 485 4673 1329 703 2403 1108 149 19 2926 1380 3085 1807 4854 706 625 5685 4113 12 1284 822 228 1848 1164 1181 3986 812 3 321 6 1405 2466 3487 515 5074 766 4872 3495 3304 970 3443 1329 936 665 755 1740 72 1458 301 515 1367 8780 271 3733 898 1113 2884 1166 2475 846 274 5368 801 1056 3173 1034 1401 905 619 1260 1387 2577 935 1423 1280 6 2892 6629 3937 1454 4388 861 2210 665 1743 1876 6698 405 1140 370 16349 808 1444 3314 545 1215 3923 806 2633 3785 711 1429 3075 1044 1296 1354 472 2211 1307 2271 270 794 8743 7807 1248 909 684 368 2086 1203 6574 9636 1136 1171 686 472 1273 5083 7697 1833 544 2846 4573 2848 6275 1808 745 5249 1382 1189 829 2320 636 3210 4253 78 2023 494 1058 418 1705 1787 711 1700 3031 1990 1416 1100 3242 3522 2761 1482 1633 3060 588 1246 405 2030 3786 1159 908 2812 870 1231 4947 448 1783 1537 1336 1978 1797 2242 1138 2782 549 573 2553 1138 1182 2264 827 611 1194 660 264 3499 2954 1965 2832 2280 1004 2430 3080 3079 4525 1695 129 2140 1611 1044 1083 241 342 121 742 1713 116 702 2089 810 1022 5085 3312 641 1938 3127 26 1313 426 2102 1632 1487 91 1071 750 3040 2148 4323 2462 2812 1914 2910 1518 4145 2093 4316 115 96 2733 2448 1322 1495 361 1612 6359 3500 2706 5397 1922 958 532 1671 35 962 1963 388 1271 3560 3667 338 522 2296 671 348 408 1256 2754 3252 355 8123 1230 1881 468 1922 876 2733 1085 4533 1475 1283 221 841 763 1013 1280 508 670 2330 3324 348 2768 383 3024 1214 349 324 2318 1664 3104 654 375 559 1668 945 1702 902 509 4836 3390 3720 7807 12027 794 1249 542 1731 3169 1194 2708 1481 1230 486 305 1134 5151 2967 2943 1870 612 2632 4388 0 786 806 1155 1 1332 2535 2283 3257 310 1398 1961 578 3174 300 1241 2558 2412 1632 387 1631 993 945 1119 3078 1929 1077 1590 1811 401 2982 2505 4710 2028 3014 626 1078 3099 2680 1300 3985 3958 9534 3575 1008 6883 2818 1634 1728 2479 554 1220 3616 37 1120 1426 1063 2930 2446 1642 2901 6297 2529 3487 1530 2734 3830 2409 491 395 7600 1323 1623 1233 5 1000 2466 1444 1400 2529 1052 1345 2886 463 1255 3492 2486 2679 236 870 192 1440 1346 2233 17 391 633 12 46 365 2181 3249 743 3402 406 12 7034 2423 1235 1170 1098 2285 4798 656 3484 4729 4094 13151 8303 15136 8637 5413 6187 6988 13561 2500 10817 12716 6173 11983 5016 3006 4131 11991 8691 6477 10437 6854 9220 6008 6199 1430 5924 9032 6534 6659 12733 5552 2491 4698 7096 3600 2918 1220 7065 10694 8190 3738 6693 9686 6541 5717 1545 5855 4568 7200 2063 7 3488 3656 3646 8516 7933 4080 5066 3623 7387 5963 11899 4888 2894 5205 4542 3576 3330 6417 2912 1794 5853 11618 9410 4689 2326 4377 5919 5916 3777 4221 3868 2829 4000 1521 6589 8525 2286 3497 2342 3538 2664 8178 1110 5391 3667 8839 10592 3160 11088 9723 3412 8833 3677 4632 4066 14717 2617 12597 4159 5963 2416 9108 210 5891 4630 2877 5084 5520 8447 4472 2043 5817 9877 1699 1111 1094 5389 5797 6582 6608 7836 11945 4863 8319 5915 7022 5767 4329 10321 3170 12538 3486 3306 7261 3030 3344 3919 5607 9333 2805 3761 2571 2732 7813 2329 3729 5397 5361 16294 8227 4419 4721 2393 1347 7167 8095 7773 3367 17218 3929 5469 16448 6395 4438 5848 15733 5996 2304 7876 8924 4723 3361 2946 4757 6919 9239 5835 2374 3955 7130 10007 5209 1757 7263 4470 3524 6543 3303 4266 2904 4082 7632 2267 11482 3901 4221 13269 6990 2989 2626 15833 9568 3448 5931 12052 13208 15470 15729 8773 9252 10086 4232 7997 6911 11073 10216 7581 16029 12136 9311 5160 8848 2727 2816 4005 9733 6171 4164 8743 4334 3697 8598 7392 2037 4300 8784 7574 3302 10754 4152 7864 4649 9954 5043 1858 8833 2495 5696 7883 5535 4586 7901 12604 6506 10460 7620 4109 6673 14519 5008 4901 3440 6483 7382 7429 6192 3045 4803 4433 3136 1966 2018 5517 4440 4991 3388 12407 6422 7773 6174 3311 2131 5082 8861 9651 8691 12643 2671 3849 2966 5962 4183 4755 6572 2483 11057 14145 13885 3106 3553 8673 4054 4102 4101 5112 5905 7192 9110 8053 791 4809 2285 7165 7977 8467 4136 5187 7820 9610 3390 2786 8549 2640 12029 7013 1907 2974 10388 8394 10344 3973 3841 3864 12702 2133 11184 6867 7009 9087 5375 11766 6408 9535 11319 1124 5820 15517 4425 14388 7766 6164 3983 12769 8882 4321 8242 5096 3992 4898 4108 1555 3410 2761 1456 1522 4149 4496 6105 8081 5977 4082 3916 2291 1603 1165 2905 3724 2086 7159 8011 7172 1255 5407 4576 3827 3312 6398 1720 2666 4762 1895 4090 7222 2152 8013 5426 7060 2355 4701 3306 3703 4051 8657 1346 3211 16051 9244 1410 7868 4489 11605 9449 12075 5843 5899 4941 7894 2010 4403 2888 2969 4709 1852 8473 4812 6039 4523 2588 1618 4403 6642 8375 9230 3488 3508 5232 4972 2325 9003 3580 6583 2629 3582 3340 12197 3977 6435 9809 806 1924 6355 7283 2500 11543 3749 7018 12709 3556 7782 6080 5537 817 2882 6099 2720 2349 1740 1876 5221 4466 9741 4794 2206 4069 11328 11666 11143 12233 3701 9954 5975 9194 5666 7616 9444 5048 6482 2309 4100 8946 7204 11640 5708 6365 5405 4590 3664 10128 2687 8795 2097 1014 1840 3486 5639 12860 4012 5502 2618 4246 5130 1654 2275 4401 6533 1500 4734 5138 3401 4074 8060 2449 5846 6627 4487 6088 5626 4832 2842 5624 3979 2905 10389 6205 8868 8044 14603 2407 3891 2891 11575 5693 4413 9409 4399 7526 1991 7557 5976 14416 8536 4355 10997 6530 6452 9899 5159 6674 5711 4672 3061 6702 5049 6920 4313 5388 7833 6735 6829 4379 8159 8942 7957 9388 4363 10302 10573 5503 2610 7133 10958 7136 12592 5844 4851 9200 7606 8608 5940 3575 8233 6869 8275 1864 1430 3877 5491 3656 2971 13813 5646 7798 2807 8726 3525 7724 5154 4612 10723 7814 4944 6496 5093 7114 1816 7922 3328 9026 5674 4985 4068 5917 9305 7152 2360 1544 4827 3603 3344 7419 5160 6881 4462 7562 1877 15480 5587 3455 10357 5751 6219 6539 7143 3010 7476 7675 2400 4605 5749 7145 3906 5961 12433 5947 6022 2935 1885 7708 6344 8508 12524 9440 10856 4775 2625 4314 2981 5557 6295 4977 1201 4971 1225 3350 2153 3888 3330 2592 3551 2679 3891 2933 6080 4045 3218 3260 1235 466 2852 2771 6898 5680 5371 3079 1556 4254 3468 4279 1268 1008 4975 8118 2890 7710 14024 10175 5244 17043 3033 5298 10097 5446 7171 9358 1939 2398 6565 3392 5342 5489 4131 5296 6659 2358 4710 8096 4744 1981 12514 2707 6461 8342 8988 7567 4966 3843 3071 3098 11867 5165 3963 4994 7543 5517 5438 3679 9221 2105 7511 3770 4937 9419 3530 2438 3551 4600 9046 6861 19279 8619 2627 2356 12951 6214 2155 3532 673 1700 1738 12805 2298 9955 5625 8786 9348 11351 7829 7940 5530 6340 4118 5111 10230 7754 SPP5 Bacteria;Proteobacteria;Gammaproteobacteria;Pasteurellales;Pasteurellaceae;multigenus;multispecies_spp5_3 0 0 0 0 0 0 0 0 0 0 0 0 0 0 0 0 0 0 0 0 0 0 0 0 0 0 0 0 0 0 0 0 0 0 0 0 0 0 0 0 0 0 0 0 0 0 0 0 0 0 0 0 0 0 0 0 0 0 0 0 0 0 0 0 0 0 0 0 0 0 0 0 0 0 0 0 0 0 0 0 0 0 0 0 0 0 0 0 0 0 0 0 0 0 0 0 0 0 0 0 0 0 0 0 0 0 0 0 0 0 0 0 0 0 0 0 0 0 0 0 0 0 0 0 0 0 0 0 0 0 0 0 0 0 0 0 0 0 0 0 0 0 0 0 0 0 0 0 0 0 0 0 0 0 0 0 0 0 0 0 0 0 0 0 0 0 0 0 0 0 0 0 0 0 0 0 0 0 0 0 0 0 0 0 0 0 0 0 0 0 0 0 0 0 0 0 0 0 0 0 0 0 0 0 0 0 0 0 0 0 0 0 0 0 0 0 0 0 0 0 0 0 0 0 0 0 0 0 0 0 0 0 0 0 0 0 0 0 0 0 0 0 0 0 0 0 0 0 0 0 0 0 0 0 0 0 0 0 0 0 0 0 0 0 0 0 0 0 0 4 0 0 5 0 1 0 0 2 0 12 4 0 0 0 13 0 0 0 0 22 2 0 7 0 6 3 12 0 0 13 1 3 5 0 0 0 10 0 28 0 0 2 0 0 0 4 0 0 0 0 1 10 0 0 6 0 0 0 0 0 0 1 2 0 0 0 0 0 0 0 17 0 0 2 0 0 0 0 0 0 20 24 0 3 0 0 0 0 2 0 0 0 0 1 0 0 0 2 3 0 1 0 0 16 5 0 0 0 0 1 0 1 3 0 0 0 2 0 0 0 0 0 0 1 4 1 4 0 9 11 43 0 0 0 0 0 0 0 0 0 10 0 0 2 0 0 8 0 0 0 4 0 0 0 0 0 1 0 0 5 1 0 3 8 0 20 3 0 0 0 0 0 0 0 0 0 0 0 7 6 0 0 0 0 0 0 0 0 0 2 6 1 0 0 0 0 0 2 0 4 1 2 0 0 4 0 9 1 0 2 2 0 0 0 14 27 12 15 2 17 2 0 0 32 33 0 0 0 0 32 12 41 0 0 0 0 0 19 0 0 0 0 0 3 0 0 0 1 0 0 0 1 0 0 1 0 0 0 1 0 0 4 0 0 0 0 70 0 0 0 0 1 0 1 0 6 2 0 0 0 0 1 0 0 6 0 0 0 0 0 0 4 7 4 0 0 0 0 0 1 2 0 0 1 0 15 2 7 0 0 0 2 0 0 0 3 1 0 0 0 0 0 0 5 0 3 0 0 0 0 0 1 0 0 0 0 0 0 1 3 1 17 8 0 0 2 0 0 0 0 0 0 0 0 7 0 4 0 0 2 0 0 6 0 5 4 0 0 0 0 1 0 4 0 0 0 0 3 0 0 0 6 2 1 0 0 1 2 1 0 0 0 0 1 1 0 0 0 2 0 88 0 0 7 0 1 24 0 0 0 0 0 1 0 0 23 1 0 0 0 35 0 0 0 3 0 0 0 0 0 1 13 0 0 0 0 0 0 0 1 0 0 0 0 0 0 0 0 2 0 0 1 1 1 0 0 8 4 2 27 0 0 0 1 1 0 13 1 5 18 23 0 15 0 4 0 0 31 1 4 2 49 25 0 0 0 25 8 0 1 1 18 0 1 0 0 6 1 0 2 0 11 2 0 0 0 3 1 1 5 0 5 0 0 0 0 1 0 17 1 0 64 0 2 0 35 4 0 0 2 21 2 0 0 0 4 3 0 0 0 1 0 1 0 0 11 7 0 0 0 0 0 0 1 0 0 0 0 1 0 0 2 0 0 0 0 4 1 15 4 0 0 0 0 0 0 0 1 0 0 2 6 0 0 6 2 0 3 0 0 0 0 0 0 0 4 0 6 0 6 0 3 0 5 0 0 0 0 21 0 0 0 0 2 0 0 0 0 7 0 0 0 0 0 0 0 0 0 0 0 0 0 0 0 0 0 6 0 1 0 2 0 0 0 8 2 0 0 0 0 3 0 0 0 1 0 0 11 1 7 16 0 0 1 0 0 4 5 0 0 5 0 15 2 0 1 5 5 1 0 2 0 5 9 0 5 12 0 1 0 0 8 0 10 0 0 0 12 3 0 0 4 0 0 1 0 2 0 0 0 0 1 0 0 0 0 0 1 0 4 2 0 0 11 1 2 2 0 0 0 1 2 1 0 0 0 0 0 0 0 0 0 0 5 0 0 0 0 0 0 0 0 0 0 4 0 37 28 1 0 76 2 1 13 0 0 1 3 4 0 73 6 9 0 6 0 12 9 0 0 5 0 0 0 0 0 21 21 0 0 36 14 0 0 0 6 0 0 2 0 34 1 0 9 3 4 10 0 43 0 0 40 5 0 6 17 7 0 0 0 0 0 0 0 0 2 1 0 0 0 7 0 0 7 0 1 1 1 114 5 19 0 0 0 0 7 0 0 2 0 0 0 3 0 27 0 2 0 1 29 9 0 1 18 2 0 1 7 0 6 1 0 0 6 24 0 1 2 31 0 10 5 0 1 21 0 2 47 29 0 4 1 46 23 0 0 6 13 19 40 0 0 46 0 16 0 0 1 0 0 0 48 87 26 23 21 24 0 0 4 0 0 26 73 0 4 6 6 0 39 25 0 1 0 5 2 0 28 2 3 37 10 0 18 12 6 0 10 30 0 0 5 9 0 0 1 0 1 0 0 4 14 0 0 3 7 0 0 0 1 0 68 4 0 6 0 0 35 6 0 0 120 2 11 41 0 36 0 0 29 31 0 0 8 1 0 95 28 0 10 12 0 34 25 5 0 22 18 0 63 10 0 8 7 0 0 223 12 0 9 43 17 0 16 0 0 17 1 0 11 3 2 0 12 15 3 12 13 1 36 49 8 0 1 5 0 8 0 3 0 25 0 0 14 0 5 1 5 0 66 3 0 5 23 0 128 9 0 12 0 17 0 17 55 1 35 13 0 0 97 33 87 1 36 4 0 35 4 0 48 18 44 3 0 17 13 0 2 21 0 43 16 48 0 32 17 0 3 8 7 1 5 0 21 4 24 0 0 11 7 0 0 0 0 0 2 0 6 26 1 3 0 0 1 0 0 1 4 0 13 0 11 0 10 1 0 4 3 3 2 0 0 0 1 5 0 0 111 18 0 19 78 0 2 11 17 5 79 0 0 1 1 0 9 7 1 0 1 22 0 3 0 3 10 27 28 20 4 14 0 0 0 6 0 0 36 9 0 13 15 0 1 0 0 6 17 0 9 0 3 0 0 7 9 0 136 1 0 7 1 0 1 2 11 2 1 23 45 25 4 0 32 25 71 4 68 18 0 3 0 9 5 0 0 0 4 7 0 11 1 0 0 0 0 0 0 3 0 0 0 0 0 0 0 0 32 0 0 92 0 41 27 43 7 3 0 0 0 24 4 0 6 22 56 0 152 100 1 9 1 0 32 0 0 34 14 2 1 30 0 1 68 8 31 41 3 0 39 3 0 1 3 1 19 5 0 1 26 0 0 14 1 0 5 1 0 8 1 0 0 21 12 1 10 12 1 0 29 2 0 14 7 0 21 0 3 0 0 21 0 18 16 1 120 22 0 0 31 3 0 0 16 0 0 65 155 31 46 90 32 0 0 7 0 77 6 0 344 116 0 1 5 0 0 36 41 22 14 3 0 22 5 1 30 12 4 0 54 47 0 0 9 0 5 0 0 0 22 7 0 16 11 4 41 4 0 8 11 5 50 71 89 37 58 12 339 2 5 1 2 16 2 0 23 78 0 26 3 0 0 3 0 0 17 16 3 2 0 7 1 13 4 0 16 0 48 0 0 22 0 0 7 17 5 0 9 111 0 5 7 27 1 2 4 0 0 31 0 0 10 5 0 3 0 7 2 1 23 6 15 2 0 0 1 1 0 1 0 0 1 3 1 5 0 0 0 29 5 0 1 34 1 3 1 37 0 8 60 0 19 0 0 0 6 54 0 8 41 0 0 38 46 0 4 9 0 6 0 0 0 0 0 0 7 0 0 111 12 43 82 76 0 16 0 SPP50 Bacteria;Firmicutes;Bacilli;Lactobacillales;Streptococcaceae;Streptococcus;multispecies_spp50_3 0 0 0 0 0 0 0 0 0 0 0 0 0 0 0 0 0 0 0 0 0 0 0 0 0 0 0 0 0 0 0 0 0 0 0 0 0 0 0 0 0 0 0 0 0 0 0 0 0 0 0 0 0 0 0 0 0 0 0 0 0 0 0 0 0 0 0 0 0 0 0 0 0 0 0 0 0 0 0 0 0 0 0 0 0 0 0 0 0 0 0 0 0 0 0 0 0 0 0 0 0 0 0 0 0 0 0 0 0 0 0 0 0 0 0 0 0 0 0 0 0 0 0 0 0 0 0 0 0 0 0 0 0 0 0 0 0 0 0 0 0 0 0 0 0 0 0 0 0 0 0 0 0 0 0 0 0 0 0 0 0 0 0 0 0 0 0 0 0 0 0 0 0 0 0 0 0 0 0 0 0 0 0 0 0 0 0 0 0 0 0 0 0 0 0 0 0 0 0 0 0 0 0 0 0 0 0 0 0 0 0 0 0 0 0 0 0 0 0 0 0 0 0 0 0 0 0 0 0 0 0 0 0 0 0 0 0 0 0 0 0 0 0 0 0 0 0 0 0 0 0 0 0 0 0 0 0 0 0 0 0 0 0 0 0 0 0 0 52 56 52 77 381 336 318 0 38 150 250 219 715 400 701 651 976 379 831 283 847 698 397 316 480 336 137 397 373 235 0 273 830 565 380 325 145 2054 2527 1014 313 149 65 463 462 92 820 115 81 153 522 369 140 101 140 0 229 3 9 0 38 0 124 758 54 90 307 0 6 7 96 235 62 39 0 45 186 182 436 156 360 53 113 148 120 268 132 108 191 467 229 0 307 227 279 426 92 395 3 586 387 1 151 145 94 156 122 102 279 2 1833 236 31 0 139 40 113 59 270 246 3 19 164 37 0 187 274 98 643 4 90 158 27 17 1179 151 219 743 6 130 260 314 283 167 348 185 442 102 239 0 370 6 201 224 412 533 55 287 406 101 379 203 191 199 179 129 296 468 212 30 66 1021 243 43 115 503 262 265 28 65 123 195 71 130 323 51 522 234 231 143 127 275 126 25 14 57 18 700 142 231 18 43 236 343 441 159 240 222 737 668 543 426 364 972 687 616 205 165 104 141 964 247 322 214 406 196 1070 89 379 273 86 397 630 415 64 135 157 2 1018 355 66 421 382 184 280 47 22 140 989 598 49 35 450 373 476 508 458 326 163 184 300 455 61 164 37 1730 138 0 535 303 229 154 244 289 60 26 45 225 126 920 26 2493 323 181 211 105 94 507 0 377 64 146 104 417 66 142 60 36 2 1360 61 171 392 0 62 265 140 84 318 297 7 0 51 297 442 69 549 116 168 168 609 3 1750 309 105 155 36 150 383 782 0 28 2 85 96 200 186 497 105 253 262 548 180 66 220 1518 182 83 175 7 381 234 139 265 296 1388 254 41 229 42 261 175 107 52 467 1055 269 357 200 32 66 14 271 264 137 209 154 205 0 1708 193 1197 814 551 78 231 341 289 275 589 130 113 493 174 47 468 674 155 491 139 128 220 377 162 92 174 121 143 200 83 248 38 655 87 71 26 185 122 61 94 54 259 143 14 709 119 1085 75 4 2000 2316 382 26 467 449 659 285 459 602 187 1324 205 40 75 256 169 1335 560 22 14 58 139 72 256 312 147 117 349 336 185 681 660 1725 703 287 452 687 395 1616 559 541 1381 102 232 240 225 187 65 64 227 661 333 455 336 274 151 338 68 144 550 231 263 474 225 426 165 67 33 211 285 477 566 464 120 270 333 215 365 268 11 473 468 797 106 33 145 186 130 1072 7 132 110 18 129 613 497 69 234 373 0 692 59 293 266 133 9 3 132 215 113 544 60 348 1218 310 535 6 290 774 1 8 259 1411 341 825 90 1 448 1314 484 304 22 2 69 102 3 16 115 28 122 156 153 26 102 184 84 473 176 361 339 173 6 309 101 167 46 162 553 342 147 1157 30 510 601 105 350 31 44 336 53 119 78 132 72 333 698 385 26 221 201 235 167 37 171 189 448 279 355 1482 127 575 221 476 267 88 186 211 32 465 20 210 480 407 377 203 732 186 263 316 260 114 97 184 224 2 95 459 191 0 283 593 2739 261 69 643 154 81 699 34 127 156 189 161 64 209 418 551 253 937 324 449 929 399 73 884 505 205 430 1010 210 220 82 1157 166 465 449 581 1241 779 429 1113 0 149 278 74 189 54 4 252 380 196 36 545 478 1172 807 469 185 498 999 244 306 206 594 365 287 1416 281 0 562 214 187 191 563 393 350 271 55 46 121 310 1057 1 689 31 64 269 417 1 35 17 0 1 132 19 526 124 353 2 3 676 1222 854 413 91 246 312 3 668 494 460 470 165 309 177 201 463 149 277 157 818 249 139 170 123 472 364 145 156 293 190 527 613 219 317 580 721 204 298 90 442 125 199 192 274 56 371 206 105 168 61 42 491 495 251 115 94 1268 228 119 232 0 114 499 387 241 160 572 40 46 478 492 1036 274 227 278 221 126 357 174 72 84 154 286 90 186 56 29 181 15 341 45 86 23 246 209 66 274 453 117 233 430 209 255 74 316 261 339 381 101 63 249 361 31 84 428 236 273 294 397 635 227 574 110 1 169 138 665 94 260 51 42 109 44 537 631 233 49 111 174 220 253 433 63 168 190 110 76 65 306 124 92 122 772 252 1135 210 372 419 64 384 434 122 151 198 297 101 139 269 181 277 543 834 238 534 149 628 83 169 236 325 698 593 241 474 816 112 117 302 536 622 104 303 733 19 263 578 91 78 368 338 66 221 245 588 221 287 1257 137 243 156 235 96 300 353 216 1451 150 176 152 755 258 90 173 172 254 127 161 82 200 245 228 128 372 55 144 234 96 135 296 79 247 712 130 301 96 168 35 160 373 99 507 198 230 176 170 568 126 293 189 91 406 360 96 104 119 86 345 208 184 249 73 349 420 878 594 204 279 181 147 492 631 383 557 181 283 124 62 81 141 554 303 103 65 96 591 1297 562 129 409 52 36 555 298 362 232 1198 406 277 1639 37 546 441 36 246 471 216 446 214 178 129 92 483 234 206 434 263 223 311 74 293 66 94 80 104 208 619 143 278 128 378 279 474 327 249 1465 283 287 198 569 766 368 275 299 104 147 260 190 608 100 654 375 111 861 454 364 115 252 145 158 115 553 43 437 551 253 407 169 252 392 179 296 95 296 243 40 487 259 127 115 49 92 120 415 155 3 129 146 163 77 48 79 355 102 140 85 181 185 327 334 396 386 254 358 601 336 310 451 44 242 256 125 234 329 80 380 487 70 129 245 469 96 292 469 516 100 236 254 157 113 287 376 158 250 101 208 216 116 252 271 157 181 56 158 147 225 146 269 153 80 74 148 115 212 199 63 147 282 228 144 167 488 463 134 396 269 16 199 196 390 108 104 86 211 206 427 188 200 776 41 152 488 263 532 521 469 1006 253 313 374 667 394 167 221 603 569 138 235 343 625 245 297 147 594 665 222 103 127 226 498 643 249 116 68 107 97 250 92 410 303 170 39 318 191 83 151 295 123 303 191 199 516 810 712 233 50 87 231 272 503 232 204 566 239 233 316 353 190 310 164 389 769 110 955 61 160 284 262 449 342 361 395 435 729 242 293 1039 152 407 709 96 105 244 145 74 86 114 73 215 154 296 230 356 162 59 317 222 226 142 186 297 18 179 493 193 290 331 349 187 106 219 52 137 402 349 586 183 301 134 266 205 243 116 425 742 147 756 285 517 414 515 423 270 152 428 122 352 335 42 296 227 170 268 291 600 166 846 370 339 443 400 413 575 1128 912 90 287 1237 452 334 198 87 329 85 136 345 248 32 546 198 193 254 110 304 453 166 359 351 404 859 346 170 333 89 159 145 346 278 164 144 325 303 133 302 83 277 295 103 40 111 111 45 228 238 16 214 221 274 374 143 507 112 222 158 252 317 361 252 232 357 244 223 234 149 402 169 198 496 67 171 3 450 350 606 216 668 401 175 479 124 183 226 94 918 130 135 691 264 312 396 194 152 435 108 474 292 495 122 143 128 85 474 186 165 158 918 251 214 368 272 235 186 640 307 322 296 244 43 395 456 750 69 424 450 515 408 215 313 193 424 394 119 940 234 180 358 1072 72 310 279 511 210 340 117 146 428 SPP51 Bacteria;Proteobacteria;Betaproteobacteria;Neisseriales;Neisseriaceae;multigenus;multispecies_spp51_2 0 0 0 0 0 0 0 0 0 0 0 0 0 0 0 0 0 0 0 0 0 0 0 0 0 0 0 0 0 0 0 0 0 0 0 0 0 0 0 0 0 0 0 0 0 0 0 0 0 0 0 0 0 0 0 0 0 0 0 0 0 0 0 0 0 0 0 0 0 0 0 0 0 0 0 0 0 0 0 0 0 0 0 0 0 0 0 0 0 0 0 0 0 0 0 0 0 0 0 0 0 0 0 0 0 0 0 0 0 0 0 0 0 0 0 0 0 0 0 0 0 0 0 0 0 0 0 0 0 0 0 0 0 0 0 0 0 0 0 0 0 0 0 0 0 0 0 0 0 0 0 0 0 0 0 0 0 0 0 0 0 0 0 0 0 0 0 0 0 0 0 0 0 0 0 0 0 0 0 0 0 0 0 0 0 0 0 0 0 0 0 0 0 0 0 0 0 0 0 0 0 0 0 0 0 0 0 0 0 0 0 0 0 0 0 0 0 0 0 0 0 0 0 0 0 0 0 0 0 0 0 0 0 0 0 0 0 0 0 0 0 0 0 0 0 0 0 0 0 0 0 0 0 0 0 0 0 0 0 0 0 0 0 0 0 0 0 0 519 509 59 0 2515 4 303 0 27 116 164 266 468 569 125 15 389 84 20 95 1532 216 469 807 105 29 835 767 167 131 0 406 99 276 15 151 80 34 159 342 163 67 143 144 31 122 14 93 1 1033 123 278 105 155 208 0 99 3 1 1 60 0 68 647 172 290 1907 6 26 97 51 157 0 54 0 6 401 5 231 24 282 617 1054 216 758 150 461 674 6 375 252 0 92 891 4182 209 169 264 2688 244 556 0 476 183 559 406 40 140 191 322 33 107 90 0 521 293 94 779 615 52 0 129 1822 661 0 1204 401 49 525 754 657 639 1086 306 232 49 209 103 4 708 883 905 526 261 157 119 578 2112 86 1 121 1 599 710 1347 9 0 185 55 622 334 236 89 1172 1256 142 26 1203 859 2672 47 8 142 164 913 2 1555 13 1 1 323 35 21 175 91 2045 0 105 1 158 1 142 89 348 3 66 133 598 0 191 38 162 5377 202 1077 26 645 1983 55 93 146 352 798 286 24 94 149 327 445 176 1640 412 99 1401 99 149 309 60 79 270 1 263 307 181 2 135 333 76 129 2270 10 0 607 86 554 155 6 12 436 272 855 352 7 100 244 379 115 138 263 1983 56 871 306 495 2788 808 408 0 278 52 159 110 44 29 105 90 184 233 226 82 1975 109 365 120 872 1740 652 491 21 1204 0 342 1192 84 113 42 17 32 7 561 2 366 32 5 211 544 407 34 1584 807 10 2 125 506 218 160 200 812 236 16 1038 4 3 396 48 129 1111 336 713 256 0 3184 0 94 113 317 920 108 2163 57 657 645 2291 88 53 76 2 184 256 842 338 1301 420 229 627 358 24 253 872 497 90 2058 1130 134 55 1165 990 833 397 0 9 13 360 251 194 574 553 1002 0 49 869 286 395 33 6014 299 1890 8 647 130 276 110 79 4 169 124 1103 1051 15 0 13 41 880 945 0 199 504 178 399 3960 25 1 13 192 159 10 0 304 7 1256 149 27 289 1 12 394 497 338 0 7 0 115 4 1981 66 19 371 95 14 2183 38 797 66 492 17 164 2 115 475 1 203 6 99 367 179 1330 1 0 360 246 103 370 97 51 1017 15 892 69 42 55 330 214 439 216 479 1 369 232 535 289 127 87 285 579 555 1373 399 151 284 362 1404 477 1046 682 40 383 990 1204 253 182 513 82 328 1985 814 417 2558 97 477 29 898 554 18 475 142 270 29 781 685 73 672 698 12 660 30 197 1009 425 2527 1 3 438 768 23 140 5020 392 4847 2259 6119 23 798 551 3 2177 2852 651 1263 269 2 54 900 26 175 75 305 9 19 53 1088 584 664 5 80 457 1 20 70 869 151 9 176 301 5 194 1342 324 36 187 569 372 55 63 275 823 5 178 724 132 22 234 1177 74 328 96 113 77 67 346 125 1161 146 87 2 376 411 25 32 118 7 292 20 412 103 336 22 103 1326 19 351 382 437 1078 0 0 9 183 61 133 398 954 608 52 2 34 64 138 18 269 618 383 657 513 605 0 584 73 226 0 888 142 1265 53 1240 654 919 1095 2 1327 203 166 2978 355 221 258 573 0 47 25 455 308 52 370 96 116 335 0 253 116 163 616 485 239 4097 146 514 1 277 131 1 68 282 1053 111 3393 128 1398 24 413 29 25 25 619 878 305 59 337 2439 95 32 0 562 22 56 175 821 29 49 0 124 86 17 235 412 19 236 335 1221 436 26 3 36 28 153 38 1866 3 93 1 19 6 0 2 1309 1 158 10 163 6 0 52 8 3 19 2130 704 922 6 247 204 224 2 165 52 60 27 68 1 29 42 69 4 5 16 6 86 239 71 36 112 69 92 160 548 0 22 171 0 53 215 0 7 236 62 212 0 23 2 0 2 15 0 23 54 5 71 288 401 80 10 95 0 7 0 365 0 115 57 104 35 56 24 8 27 207 47 0 2 216 171 0 112 181 0 22 58 1 5 93 72 20 4 70 93 36 183 4 134 30 1 235 70 345 17 70 29 404 4 59 174 2 33 20 0 33 2698 36 0 34 448 0 13 25 51 0 144 121 9 2 55 74 0 1259 7 8 35 35 0 3 9 14 2 23 7 225 21 14 59 141 1 33 77 0 214 90 59 129 1353 49 382 1 6 0 5 103 430 8 61 236 35 0 74 20 32 145 72 115 1 78 192 28 331 245 0 56 12 23 1 30 174 189 6 34 489 0 39 62 15 0 75 174 55 0 107 53 0 2 22 1 32 11 189 72 178 461 57 117 133 1 32 34 3 8 6 75 228 7 35 7 243 477 14 0 340 0 32 78 46 144 129 19 24 74 0 12 3 131 0 122 145 0 114 192 3 94 130 31 491 660 335 0 138 42 0 25 239 6 0 54 36 1 13 275 133 2 167 5 0 9 74 0 7 239 35 6 14 12 8 106 252 6 491 382 41 1 14 52 21 64 208 14 3 77 213 210 650 2 124 54 353 3 96 21 1 186 179 1511 111 360 0 7 15 15 15 92 136 73 17 56 1 7 20 14 7 26 76 76 5 255 4 1 216 152 44 77 17 75 784 79 92 317 42 49 1638 6 63 489 267 167 20 564 93 8 81 0 7 171 33 0 16 18 129 0 515 92 111 30 61 53 205 105 39 8 37 0 105 128 0 1 1 0 22 45 48 38 4 36 75 33 127 3 3 89 28 23 84 631 0 0 23 346 941 25 108 14 2 20 324 18 621 875 0 193 71 1 11 27 0 0 2 52 6 185 21 20 65 129 1 18 19 18 763 259 11 48 20 0 27 8 42 190 55 6 91 412 4 1 63 74 1 11 40 28 139 50 8 0 12 151 0 0 71 108 4 36 126 31 119 144 504 22 56 1 40 124 12 161 29 176 4 21 33 45 98 16 11 0 6 9 6 187 22 22 2 25 49 34 42 373 1 1 21 3 140 70 50 69 31 318 262 107 2 111 15 187 66 14 1 0 9 198 11 1 47 170 281 0 23 107 3 153 58 12 894 0 0 20 31 9 5 286 0 2 460 253 47 178 43 8 122 418 0 4 26 1 7 115 0 295 273 47 7 213 292 0 173 43 0 65 134 70 0 22 316 5 11 82 51 2 270 121 133 70 27 13 161 51 201 1 3 133 3 44 390 131 78 56 6 20 12 14 0 69 215 1 39 71 45 2 26 168 0 23 0 65 38 93 75 0 25 48 1 366 29 236 113 264 170 10 78 49 4 108 13 28 4 346 243 20 136 187 2 3 90 7 245 172 96 0 74 44 11 24 33 8 111 101 3 114 14 57 56 183 19 36 2 7 329 4 194 14 266 153 8 31 311 250 216 25 18 0 0 199 3 6 39 18 209 16 356 297 11 10 4 0 9 64 11 17 30 37 1 0 211 149 349 0 58 47 6 139 13 17 40 197 58 13 0 1 0 2 298 16 107 258 0 155 9 191 148 7 143 7 0 0 57 47 5 108 2 0 33 139 3 114 33 80 54 10 44 3 9 89 6 50 64 2 3 12 427 0 281 136 12 26 21 112 4 39 141 0 0 683 57 0 75 31 16 39 543 2 21 21 99 1 64 46 0 369 226 7 116 317 15 62 4 SPP54 Bacteria;Proteobacteria;Gammaproteobacteria;Pasteurellales;Pasteurellaceae;Haemophilus;multispecies_spp54_3 0 0 0 0 0 0 0 0 0 0 0 0 0 0 0 0 0 0 0 0 0 0 0 0 0 0 0 0 0 0 0 0 0 0 0 0 0 0 0 0 0 0 0 0 0 0 0 0 0 0 0 0 0 0 0 0 0 0 0 0 0 0 0 0 0 0 0 0 0 0 0 0 0 0 0 0 0 0 0 0 0 0 0 0 0 0 0 0 0 0 0 0 0 0 0 0 0 0 0 0 0 0 0 0 0 0 0 0 0 0 0 0 0 0 0 0 0 0 0 0 0 0 0 0 0 0 0 0 0 0 0 0 0 0 0 0 0 0 0 0 0 0 0 0 0 0 0 0 0 0 0 0 0 0 0 0 0 0 0 0 0 0 0 0 0 0 0 0 0 0 0 0 0 0 0 0 0 0 0 0 0 0 0 0 0 0 0 0 0 0 0 0 0 0 0 0 0 0 0 0 0 0 0 0 0 0 0 0 0 0 0 0 0 0 0 0 0 0 0 0 0 0 0 0 0 0 0 0 0 0 0 0 0 0 0 0 0 0 0 0 0 0 0 0 0 0 0 0 0 0 0 0 0 0 0 0 0 0 0 0 0 0 0 0 0 0 0 0 0 29 22 7 21 0 0 7 8 3 0 0 10 0 0 0 0 3 0 33 0 5 0 0 244 0 1 17 1 3 0 18 0 3 2 0 0 0 0 0 9 1 0 2 0 1 0 3 0 0 0 0 15 0 0 0 1 0 0 0 1 0 0 0 5 4 18 3 109 24 0 0 0 0 0 0 5 0 4 0 0 3 656 1 0 22 0 1 0 0 2 0 0 0 0 1 2 6 0 9 4 0 58 372 0 64 87 10 2 0 15 6 0 0 52 0 0 95 172 1 0 0 0 0 0 1 3 0 0 0 64 103 0 0 0 22 0 0 0 4 86 1 13 3 1 0 3 34 120 0 1 0 11 2 0 0 0 2 0 4 5 19 28 40 0 2 0 10 8 30 0 3 1 0 0 0 0 1 3 0 15 11 0 0 0 0 0 26 15 17 1 8 16 0 1020 2 0 8 0 13 8 17 0 94 2 0 0 0 187 0 0 0 51 0 27 0 1 11 61 171 68 2 1 0 0 4 13 0 7 1 12 4 0 0 0 2 0 26 0 21 0 0 0 0 0 28 12 0 3 7 12 0 168 18 138 41 28 0 0 14 5 2 1 3 0 0 0 0 53 0 1 42 0 1 2 7 5 2 285 8 0 0 0 1 3 2 4 0 3 2 0 2 4 0 0 1 2 4 0 3 0 5 3 0 1 0 20 5 173 25 7 1 118 18 3 0 0 0 8 4 25 1 1 0 5 12 49 11 0 9 0 0 0 1 0 0 4 10 1 3 51 4 8 97 10 12 46 45 0 0 2 18 1 0 82 0 0 11 0 2 1 10 8 0 0 0 2 6 0 0 146 1 2 60 1 0 0 0 0 0 0 0 11 2 1 8 10 0 8 16 13 12 2 2 281 5 152 2 0 0 3 6 4 0 5 7 14 0 0 0 0 21 0 1 0 58 0 1 0 1 2 2 1 32 9 3 115 0 4 3 0 270 22 0 7 0 0 7 0 0 0 0 19 0 40 0 0 0 10 0 0 1 0 1 0 5 0 20 8 4 0 3 0 0 0 55 1 0 53 3 1 45 55 1 63 1 24 11 0 5 2 6 22 3 26 0 3 2 94 122 218 3 6 0 1 2 0 0 135 43 0 0 17 116 2 6 0 0 8 0 2 0 0 8 2 0 0 0 12 14 33 48 17 7 0 0 1 4 0 1 0 0 2 87 83 0 1 57 23 6 1 0 24 0 0 11 9 2 1 2 21 6 1 1 0 0 0 0 0 4 42 0 28 1 4 0 2 0 1 28 13 2 0 2 0 0 0 0 1 26 20 8 1 2 12 8 1 1 0 2 1 0 0 0 2 0 572 436 0 94 37 4 0 51 0 1 1 8 1 13 5 0 2 4 5 0 0 0 2 0 42 6 7 0 40 13 0 0 0 13 1 0 1 0 0 0 0 0 2 49 71 2 13 1 0 4 8 10 0 0 1 6 2 0 0 4 20 0 2 28 156 1 10 0 1 0 0 4 35 29 1 0 0 1 0 0 0 1 0 0 1 0 1 2 1 40 17 3 0 1 0 0 18 23 2 19 0 1 0 4 0 0 0 4 0 2 7 0 0 0 0 9 0 0 2 12 0 3 0 0 0 37 29 0 0 0 3 0 1 0 0 0 3 0 2 0 0 0 0 0 2 0 0 1 0 4 490 7 1 0 10 0 7 0 1 0 0 0 21 30 1 0 251 47 84 73 11 0 2 164 0 0 282 354 139 7 0 0 619 1 0 18 441 1310 0 428 0 1 433 38 0 0 282 131 5 0 78 0 0 94 7 3 31 17 128 145 163 1 677 159 441 0 3 0 16 0 222 110 114 1367 12 0 2 11 59 14 0 407 18 0 124 1 6 0 165 291 1027 22 22 1 0 287 911 18 36 453 4 318 94 0 1 3 6 0 41 0 139 0 126 46 257 271 196 1 602 521 22 81 0 275 1 385 21 229 3 111 894 151 2 5 6 25 4 34 0 66 29 183 1 490 519 0 104 193 544 1316 265 53 263 153 184 41 33 0 9 65 23 0 0 406 0 168 209 407 672 358 89 602 383 903 4 30 0 1 489 23 85 0 56 28 13 19 40 3 23 0 30 75 2 476 95 0 236 703 0 243 388 646 72 334 144 152 2 92 3 3 59 2 1 148 66 0 1 143 0 0 2 0 0 13 0 97 1 387 0 88 352 2 15 90 349 657 29 145 0 277 939 672 430 54 0 87 31 0 379 144 104 29 405 1 0 94 305 0 31 137 20 11 83 44 3 1364 519 537 46 36 0 0 755 326 58 1583 67 258 0 141 168 0 282 52 1 945 53 102 0 22 386 66 478 39 17 54 133 495 23 44 68 3 188 1 9 109 1419 0 0 258 0 521 356 86 83 895 390 104 226 573 12 761 262 83 217 72 551 1 96 229 16 81 164 465 1 552 277 699 345 12 32 153 672 469 0 607 6 498 20 0 301 268 108 10 155 729 1 244 128 102 11 814 500 137 19 1220 58 15 1 381 19 17 448 2 23 81 0 36 31 1260 5 737 27 24 155 380 12 151 264 55 144 0 1036 145 45 423 0 405 140 220 39 249 46 90 1086 2418 51 87 19 177 45 254 1 186 29 0 1 0 7 11 285 436 1401 171 26 8 9 73 328 1955 67 0 21 75 253 1510 91 32 1 715 225 111 675 253 108 8 0 23 1 111 0 43 25 44 15 32 22 201 56 0 16 95 153 154 288 229 351 18 279 806 0 210 10 0 25 29 2 0 20 535 605 26 111 1 80 160 395 299 868 1577 33 678 22 60 184 89 291 735 7 194 0 598 200 225 90 303 6 0 23 99 154 19 119 0 0 475 17 4 0 85 9 131 0 1 823 321 135 71 11 333 0 26 0 815 218 307 12 51 69 105 6 116 504 22 154 133 5 0 40 275 96 114 0 45 543 0 57 819 62 215 296 9 36 45 0 0 353 17 0 317 673 0 0 15 21 0 30 0 0 12 2 1 447 80 47 0 138 39 246 677 70 36 0 608 155 32 17 81 1 15 196 47 0 1 68 0 86 25 133 130 470 0 0 669 178 1 1 72 0 37 689 1897 1489 128 28 98 1 896 30 13 610 51 0 2 431 182 1538 146 0 77 261 581 184 346 358 0 134 29 0 352 81 52 181 194 420 645 249 673 31 0 0 1 0 24 240 0 373 158 263 110 262 777 190 12 379 141 1047 3030 806 1088 3583 1328 215 146 7 614 65 9 1078 104 274 113 283 269 1 86 245 72 38 916 54 96 10 4 19 90 169 215 250 8 0 0 54 0 192 3 0 185 62 18 11 129 239 1 190 84 1104 47 0 240 0 24 940 23 260 0 22 130 41 0 29 108 26 384 99 120 58 0 0 0 3 2 27 12 0 51 98 0 190 129 0 0 235 312 0 0 23 8 109 47 39 0 1047 49 0 1 0 0 0 171 100 36 10 168 1 0 0 49 0 285 138 422 467 20 219 1433 39 314 0 516 11 0 87 0 563 73 362 1 3 0 SPP56 Bacteria;Firmicutes;Bacilli;Lactobacillales;Streptococcaceae;Streptococcus;multispecies_spp56_3 219 701 198 47 823 420 288 467 244 465 169 687 732 1259 81 337 608 97 803 674 265 556 739 238 441 777 1313 675 3464 2159 980 550 107 2404 248 2644 172 285 169 153 40 435 79 1440 623 438 925 76 39 1977 82 401 174 759 265 729 218 1050 175 204 587 508 227 28 1246 103 43 289 988 1869 9 212 1203 295 213 245 229 631 461 352 918 7012 2483 809 110 317 453 712 594 124 260 26 113 158 233 445 122 1437 2846 314 135 1296 717 101 166 602 1081 163 233 789 39 714 70 301 451 187 234 320 69 345 427 942 181 694 620 328 355 760 531 33 258 35 297 715 104 289 2421 328 265 95 113 92 341 252 65 689 483 201 563 1958 132 770 58 603 95 3017 766 380 576 446 1006 291 1033 2193 4133 703 102 338 338 892 1252 118 214 1933 207 571 2640 2406 99 41 140 494 997 3042 209 2415 581 677 9805 270 732 1092 972 1087 296 696 30 789 590 3400 266 472 275 119 132 125 43 184 243 2868 249 86 518 102 217 593 51 189 81 744 72 300 234 1045 199 101 775 1006 60 63 108 73 802 60 69 133 619 563 208 1491 352 95 145 1022 456 302 2611 1406 572 240 181 328 577 2800 348 1059 2470 972 97 1261 42 503 2496 2506 189 92 945 2416 0 0 0 0 0 0 0 0 0 0 0 0 0 0 0 0 0 0 0 0 0 0 0 0 0 0 0 0 0 0 0 0 0 0 0 0 0 0 0 0 0 0 0 0 0 0 0 0 0 0 0 0 0 0 0 0 0 0 0 0 0 0 0 0 0 0 0 0 0 0 0 0 0 0 0 0 0 0 0 0 0 0 0 0 0 0 0 0 0 0 0 0 0 0 0 0 0 0 0 0 0 0 0 0 0 0 0 0 0 0 0 0 0 0 0 0 0 0 0 0 0 0 0 0 0 0 0 0 0 0 0 0 0 0 0 0 0 0 0 0 0 0 0 0 0 0 0 0 0 0 0 0 0 0 0 0 0 0 0 0 0 0 0 0 0 0 0 0 0 0 0 0 0 0 0 0 0 0 0 0 0 0 0 0 0 0 0 0 0 0 0 0 0 0 0 0 0 0 0 0 0 0 0 0 0 0 0 0 0 0 0 0 0 0 0 0 0 0 0 0 0 0 0 0 0 0 0 0 0 0 0 0 0 0 0 0 0 0 0 0 0 0 0 0 0 0 0 0 0 0 0 0 0 0 0 0 0 0 0 0 0 0 0 0 0 0 0 0 0 0 0 0 0 0 0 0 0 0 0 0 0 0 0 0 0 0 0 0 0 0 0 0 0 0 0 0 0 0 0 0 0 0 0 0 0 0 0 0 0 0 0 0 0 0 0 0 0 0 0 0 0 0 0 0 0 0 0 0 0 0 0 0 0 0 0 0 0 0 0 0 0 0 0 0 0 0 0 0 0 0 0 0 0 0 0 0 0 0 0 0 0 0 0 0 0 0 0 0 0 0 0 0 0 0 0 0 0 0 0 0 0 0 0 0 0 0 0 0 0 0 0 0 0 0 0 0 0 0 0 0 0 0 0 0 0 0 0 0 0 0 0 0 0 0 0 0 0 0 0 0 0 0 0 0 0 0 0 0 0 0 0 0 0 0 0 0 0 0 0 0 0 0 0 0 0 0 0 0 0 0 0 0 0 0 0 0 0 0 0 0 0 0 0 0 0 0 0 0 0 0 0 0 0 0 0 0 0 0 0 0 0 0 0 0 0 0 0 0 0 0 0 0 0 0 0 0 0 0 0 0 0 0 0 0 0 0 0 0 0 0 0 0 0 0 0 0 0 0 0 0 0 0 0 0 0 0 0 0 0 0 0 0 0 0 0 0 0 0 0 0 0 0 0 0 0 0 0 0 0 0 0 0 0 0 0 0 0 0 0 0 0 0 0 0 0 0 0 0 0 0 0 0 0 0 0 0 0 0 0 0 0 0 0 0 0 0 0 0 0 0 0 0 0 0 0 0 0 0 0 0 0 0 0 0 0 0 0 0 0 0 0 0 0 0 0 0 0 0 0 0 0 0 0 0 0 0 0 0 0 0 0 0 0 0 0 0 0 0 0 0 0 0 0 0 0 0 0 0 0 0 0 0 0 0 0 0 0 0 0 0 0 0 0 0 0 0 0 0 0 0 0 0 0 0 0 0 0 0 0 0 0 0 0 0 0 0 0 0 0 0 0 0 0 0 0 0 0 0 0 0 0 0 0 0 0 0 0 0 0 0 0 0 0 0 0 0 0 0 0 0 0 0 0 0 0 0 0 0 0 0 0 0 0 0 0 0 0 0 0 0 0 0 0 0 0 0 0 0 0 0 0 0 0 0 0 0 0 0 0 0 0 0 0 0 0 0 0 0 0 0 0 0 0 0 0 0 0 0 0 0 0 0 0 0 0 0 0 0 0 0 0 0 0 0 0 0 0 0 0 0 0 0 0 0 0 0 0 0 0 0 0 0 0 0 0 0 0 0 0 0 0 0 0 0 0 0 0 0 0 0 0 0 0 0 0 0 0 0 0 0 0 0 0 0 0 0 0 0 0 0 0 0 0 0 0 0 0 0 0 0 0 0 0 0 0 0 0 0 0 0 0 0 0 0 0 0 0 0 0 0 0 0 0 0 0 0 0 0 0 0 0 0 0 0 0 0 0 0 0 0 0 0 0 0 0 0 0 0 0 0 0 0 0 0 0 0 0 0 0 0 0 0 0 0 0 0 0 0 0 0 0 0 0 0 0 0 0 0 0 0 0 0 0 0 0 0 0 0 0 0 0 0 0 0 0 0 0 0 0 0 0 0 0 0 0 0 0 0 0 0 0 0 0 0 0 0 0 0 0 0 0 0 0 0 0 0 0 0 0 0 0 0 0 0 0 0 0 0 0 0 0 0 0 0 0 0 0 0 0 0 0 0 0 0 0 0 0 0 0 0 0 0 0 0 0 0 0 0 0 0 0 0 0 0 0 0 0 0 0 0 0 0 0 0 0 0 0 0 0 0 0 0 0 0 0 0 0 0 0 0 0 0 0 0 0 0 0 0 0 0 0 0 0 0 0 0 0 0 0 0 0 0 0 0 0 0 0 0 0 0 0 0 0 0 0 0 0 0 0 0 0 0 0 0 0 0 0 0 0 0 0 0 0 0 0 0 0 0 0 0 0 0 0 0 0 0 0 0 0 0 0 0 0 0 0 0 0 0 0 0 0 0 0 0 0 0 0 0 0 0 0 0 0 0 0 0 0 0 0 0 0 0 0 0 0 0 0 0 0 0 0 0 0 0 0 0 0 0 0 0 0 0 0 0 0 0 0 0 0 0 0 0 0 0 0 0 0 0 0 0 0 0 0 0 0 0 0 0 0 0 0 0 0 0 0 0 0 0 0 0 0 0 0 0 0 0 0 0 0 0 0 0 0 0 0 0 0 0 0 0 0 0 0 0 0 0 0 0 0 0 0 0 0 0 0 0 0 0 0 0 0 0 0 0 0 0 0 0 0 0 0 0 0 0 0 0 0 0 0 0 0 0 0 0 0 0 0 0 0 0 0 0 0 0 0 0 0 0 0 0 0 0 0 0 0 0 0 0 0 0 0 0 0 0 0 0 0 0 0 0 0 0 0 0 0 0 0 0 0 0 0 0 0 0 0 0 0 0 0 0 0 0 0 0 0 0 0 0 0 0 0 0 0 0 0 0 0 0 0 0 0 0 0 0 0 0 0 0 0 0 0 0 0 0 0 0 0 0 0 0 0 0 0 0 0 0 0 0 0 0 0 0 0 0 0 0 0 0 0 0 0 0 0 0 0 0 0 0 0 0 0 0 0 0 0 0 0 0 0 0 0 0 0 0 0 0 0 0 0 0 0 0 0 0 0 0 0 0 0 0 0 0 0 0 0 0 0 0 0 0 0 0 0 0 0 0 0 0 0 0 0 0 0 0 0 0 0 0 0 0 0 0 0 0 0 0 0 0 0 0 0 0 0 0 0 0 0 0 0 0 0 0 0 0 0 0 0 0 0 0 0 0 0 0 0 0 0 0 0 0 0 0 0 0 0 0 0 0 0 0 0 0 0 0 0 0 0 0 0 0 0 0 0 0 0 0 0 0 0 0 0 0 0 0 0 0 0 0 0 0 0 0 0 0 0 0 SPP61 Bacteria;Firmicutes;Clostridia;Negativicutes;Veillonellaceae;Veillonella;multispecies_spp61_2 0 0 0 0 0 0 0 0 0 0 0 0 0 0 0 0 0 0 0 0 0 0 0 0 0 0 0 0 0 0 0 0 0 0 0 0 0 0 0 0 0 0 0 0 0 0 0 0 0 0 0 0 0 0 0 0 0 0 0 0 0 0 0 0 0 0 0 0 0 0 0 0 0 0 0 0 0 0 0 0 0 0 0 0 0 0 0 0 0 0 0 0 0 0 0 0 0 0 0 0 0 0 0 0 0 0 0 0 0 0 0 0 0 0 0 0 0 0 0 0 0 0 0 0 0 0 0 0 0 0 0 0 0 0 0 0 0 0 0 0 0 0 0 0 0 0 0 0 0 0 0 0 0 0 0 0 0 0 0 0 0 0 0 0 0 0 0 0 0 0 0 0 0 0 0 0 0 0 0 0 0 0 0 0 0 0 0 0 0 0 0 0 0 0 0 0 0 0 0 0 0 0 0 0 0 0 0 0 0 0 0 0 0 0 0 0 0 0 0 0 0 0 0 0 0 0 0 0 0 0 0 0 0 0 0 0 0 0 0 0 0 0 0 0 0 0 0 0 0 0 0 0 0 0 0 0 0 0 0 0 0 0 0 0 0 0 0 0 0 0 1 170 13 5 9 8 1 1 357 32 216 139 3904 83 308 150 249 57 207 153 76 6 3 28 3 9 37 343 0 16 38 382 498 152 35 16 300 49 509 1 79 5 17 4 31 2 25 34 188 83 1 0 49 0 102 8 7 0 4 0 13 39 4 2 1 0 0 14 4 2 5 6 0 226 8 877 72 62 23 3 1 0 0 98 19 1 11 5 6 197 3 53 31 92 1 1 0 9 1 0 79 4 240 85 0 129 19 16 8 9 2 0 6 1 49 10 1 1 0 11 8 4 0 0 4 2 2 2 13 45 5 0 2 254 50 10 0 2 2 0 4 5 17 13 0 24 160 0 120 4 1 8 107 10 90 36 28 4 2 0 0 1 2 9 0 147 44 105 27 26 7 36 781 71 122 11 3 3 2 6 231 56 29 0 520 284 1 19 58 517 458 25 0 1 5 21 3562 56 0 0 25 659 15 7 36 13 22 236 3 14 3 66 240 101 31 168 2 0 0 5 117 5 573 77 4 7 0 2 105 137 228 34 3437 32 2 1 1 2 68 9 6 432 7 3 16 5 0 2 0 0 3 73 7 16 17 32 1 0 0 77 3 2 1 5 14 0 13 7 62 15 10 11 15 183 0 0 0 100 19 8 14 38 16 24 36 4 1 8 5304 41 1 619 166 93 423 206 2 1 1 5 10 2 2 111 0 0 0 0 37 0 4 2 0 8 131 27 2 0 1 25 966 28 75 479 6 1 56 1 0 14 1 139 31 1 15 6 1 49 19 1 0 17 0 3 31 7 5 10 44 9 25 4 0 1 0 1 444 5 258 8 15 0 8 2 0 2 56 29 74 255 9 118 110 17 9 6 0 226 1127 60 69 17 1 1 6 403 137 116 2 227 53 63 16 77 28 0 87 1349 7 1 0 44 2 3 5 14 78 0 3 10 713 0 32 1 15 1 1 5 5 28 0 18 660 396 59 1 2 67 3167 4 4 119 34 60 4 5 30 15 176 182 81 31 218 226 1186 34 0 10 106 169 65 0 40 0 7 51 56 43 2 2 22 168 198 270 0 353 243 468 160 315 0 8 23 3 2 1 1 35 1084 6 8 2 5 1 72 77 3 4 8 3 2 3 3 0 3 0 18 28 16 436 12 4 223 14 45 188 253 2 66 48 16 1 6 163 221 39 543 7 0 0 62 1 473 65 8 84 252 1 260 0 1 3 26 2 19 0 0 0 521 0 0 168 143 2 4 63 1 1 34 43 34 18 8 53 33 70 962 32 0 94 1 3 3 3 6 115 107 195 880 0 10 9 22 21 599 324 22 22 223 11 11 64 50 35 1 24 67 125 2 0 3 0 0 9 14 2 6 59 8 0 204 1564 3 39 5 1 6 39 15 391 40 67 139 10 16 19 4 1 1 3 136 53 572 6 9 15 3 19 32 36 101 74 20 31 13 274 31 63 90 209 11 160 0 261 631 0 0 368 265 5 5 20 6 55 1 16 18 1 6 1 1 1 37 221 145 27 350 500 22 626 84 4 172 6 13 28 231 15 11 4 27 3 327 36 8 125 44 39 78 24 4 246 82 141 1 1 1 1 1 64 313 85 441 97 7 1 218 29 27 11 29 2 442 472 8 261 0 58 868 2 0 11 33 121 2 1 3 18 1073 253 30 10 4 11 224 205 0 3 61 2 1 1 3 1 11 0 18 0 275 1035 29 467 0 6 134 10 53 26 381 440 100 357 303 291 542 1116 119 59 170 203 74 98 673 84 121 206 348 1159 19 457 676 33 1295 689 446 1044 311 241 3 77 43 4 267 309 51 773 224 23 19 109 301 191 415 22 1 241 5 4 72 2 245 57 127 1891 49 250 1 5 42 133 576 125 84 10 505 134 10 3 177 201 106 631 3 10 154 4 30 11 79 1 34 103 30 221 82 67 1010 559 131 310 17 35 267 17 3 3599 116 118 48 340 2032 217 78 16 14 641 670 29 2107 78 2024 156 0 9 6 1406 67 6 1 15 29 2 12 3117 504 933 120 41 63 251 977 14 22 241 91 14 21 17 0 20 535 758 317 900 279 23 774 2 70 737 171 26 15 3 13 18 0 101 1267 170 286 331 819 3 495 327 21 56 356 40 22 1425 126 256 2 87 441 809 550 357 607 695 66 185 111 5 29 218 109 97 1174 286 295 1217 303 262 943 841 108 169 475 179 92 429 793 271 874 53 221 398 65 64 60 301 6 95 330 21 20 1248 21 28 1443 31 9 19 43 150 346 56 45 861 125 1 8 58 9 103 313 871 53 834 9 8 57 18 50 33 472 18 35 87 7 11 191 833 59 153 845 0 88 179 538 153 56 545 11 44 963 247 34 287 500 2 6 155 16 38 1255 46 28 32 118 278 1262 2267 58 69 2 1 515 1237 36 7 2005 97 79 134 28 289 350 17 2 293 18 36 0 205 18 3 306 249 17 800 1412 3 29 104 192 13 5 102 72 18 113 124 138 77 805 22 13 181 62 3047 341 101 1238 106 98 106 24 21 2 360 292 16 537 65 417 1821 20 1996 995 30 7 149 206 589 5 63 1142 163 44 236 85 89 399 60 27 626 443 903 1358 23 645 584 45 119 131 31 702 47 5 235 67 5 937 13 0 0 96 21 118 8 65 723 1863 894 28 507 23 294 281 2908 44 484 68 73 29 1633 623 543 242 1558 1102 2625 199 1965 407 76 68 277 936 45 46 166 163 59 272 341 490 341 15 60 15 1 4 974 561 217 15 135 150 135 1924 120 187 137 0 2 537 6 40 11 817 28 1 567 2695 969 493 1215 387 95 230 5 4 241 1 0 0 412 1 43 67 101 67 362 40 1146 307 1249 1768 533 1320 208 20 163 645 191 16 541 545 97 243 778 218 3934 363 345 60 1002 620 226 66 511 25 148 650 616 49 26 2 81 397 51 2182 289 2 2 1289 23 15 5 328 15 6 101 102 440 239 87 522 10 0 4 1178 199 14 494 19 4 1 27 29 5 440 67 121 2567 284 166 66 69 247 1213 1525 327 30 754 63 65 279 29 184 542 370 106 151 2243 621 106 3 30 1 12 355 20 38 162 172 59 226 601 11 63 397 84 450 1733 213 670 387 445 90 154 313 1 13 460 48 155 300 158 15 15 116 54 12 94 617 308 487 566 186 536 1874 195 251 805 173 39 238 1117 0 0 0 18 4 1492 5 145 72 109 1039 280 28 5 378 491 769 37 1497 46 1096 1458 1144 143 34 1113 7 5 102 101 83 12 772 587 79 14 0 4 10 0 116 300 988 1057 33 353 3 0 14 90 152 54 41 60 1673 112 286 433 359 237 649 168 4 59 96 25 21 568 8 23 18 212 602 371 2065 456 417 7 33 8 2813 46 80 1771 1142 1522 597 31 229 56 54 1798 1253 2244 84 20 873 424 328 2970 483 523 170 31 147 12 11 991 190 114 115 178 19 41 331 176 115 336 303 40 71 297 20 11 97 244 56 153 69 131 93 525 84 57 810 177 281 881 1825 267 69 26 234 112 177 99 140 751 1987 92 376 634 175 10 2205 55 15 18 1622 232 1554 103 43 114 264 22 108 55 20 207 SPP62 Bacteria;Firmicutes;Bacilli;Lactobacillales;Streptococcaceae;Streptococcus;multispecies_spp62_7 0 0 0 0 0 0 0 0 0 0 0 0 0 0 0 0 0 0 0 0 0 0 0 0 0 0 0 0 0 0 0 0 0 0 0 0 0 0 0 0 0 0 0 0 0 0 0 0 0 0 0 0 0 0 0 0 0 0 0 0 0 0 0 0 0 0 0 0 0 0 0 0 0 0 0 0 0 0 0 0 0 0 0 0 0 0 0 0 0 0 0 0 0 0 0 0 0 0 0 0 0 0 0 0 0 0 0 0 0 0 0 0 0 0 0 0 0 0 0 0 0 0 0 0 0 0 0 0 0 0 0 0 0 0 0 0 0 0 0 0 0 0 0 0 0 0 0 0 0 0 0 0 0 0 0 0 0 0 0 0 0 0 0 0 0 0 0 0 0 0 0 0 0 0 0 0 0 0 0 0 0 0 0 0 0 0 0 0 0 0 0 0 0 0 0 0 0 0 0 0 0 0 0 0 0 0 0 0 0 0 0 0 0 0 0 0 0 0 0 0 0 0 0 0 0 0 0 0 0 0 0 0 0 0 0 0 0 0 0 0 0 0 0 0 0 0 0 0 0 0 0 0 0 0 0 0 0 0 0 0 0 0 0 0 0 0 0 0 0 8 1 241 2 1 12 44 6 3 7 35 4 12 3 15 4 88 139 39 4 16 3 7 39 6 6 3 16 9 0 7 3 17 5 6 14 41 13 8 8 29 1 3 2 2 21 0 3 3 9 11 3 1 8 0 1 11 4 0 3 17 4 9 16 6 1 0 3 5 7 2 0 2 0 44 3 4 22 18 36 4 10 2 2 4 3 4 26 3 5 0 2 3 23 36 2 0 3 11 11 0 4 8 1 2 30 1 81 0 10 3 6 0 5 2 30 13 1 1 0 22 8 4 0 3 5 2 3 11 4 1 1 0 9 2 0 1 0 1 2 3 7 4 16 2 1 16 8 0 1 1 1 31 178 9 31 0 33 16 4 12 2 9 3 4 25 8 0 96 12 13 2 8 4 22 12 5 5 148 4 6 3 4 3 1 0 2 2 8 28 2 3 2 267 3 1 3 9091 1 3 2 1 3 24 2 10 19 11 52 6 4 5 26 1257 53 5 16 9 2 2 11 1 1 0 9 4 17 5 2 126 10 6 5 372 5 0 3 9 0 9 0 0 130 8 1 3 19 4 2 0 0 4 5 13 2 6 2 0 0 3 5 2 2 1 2 3 0 19 23 3 7 37 21 8 50 3 7 8 12 7 3 5 2 0 4 17 2 3 5 428 5 13 3 8 31 30 10 2 11 0 6 24 0 11 38 3 1 8 22 6 0 6 10 14 2 28 20 3 3 15 2 37 22 3 0 24 0 10 0 0 0 1 0 36 2 5 6 68 11 7 10 3 25 61 4 8 43 4 4 0 2 5 0 2 1 13 5 4 27 6 4 9 0 11 0 6 3 5 30 4 4 12 15 7 6 5 28 0 9 39 11 2 25 9 3 3 70 48 43 0 2 20 15 4 12 1 0 78 2 13 6 19 6 132 5 14 6 4 2 5 5 11 9 4 6 17 2 1 3 2 6 1 65 18 5 9 7 12 3 23 4 10 7 35 2 3 3 4 3 44 5 34 34 2 1 3811 2 0 2 2 8 7 4 12 0 3 45 5 5 3 25 5 5 7 29 2 1 30 0 6 1 1 10 3 15 10 0 3 6 8 27 7 5 69 55 5 7 11 10 16 10 8 3 23 7 6 9 4 11 5 5 12 1 8 1 21 1 1 38 26 19 19 0 5 6 0 35 1 0 0 3 36 7 2 4 8 3 4 0 9 2 7 1 49 1 12 1 1 2 1 0 7 19 4 11 13 7 8 1 2 13 200 292 2 54 5 458 7 13 4 69 55 2 3 0 8 2 0 51 3 1 0 6 5 4 3 3 2 6 5 1 13 2 22 16 18 18 31 4 7 20 6 1 8 0 27 22 12 1 1 0 5 2 1 2 4 1 1 41 4 119 13 30 323 4 24 8 7 7 12 7 9 39 209 0 11 7 2 14 1 15 4 5 2 6 24 3 33 1 2 1 1 0 0 5 9 6 0 43 2 3 17 0 12 6 1 7 6 3 1 5 12 6 4 11 98 1 10 6 5 6 3 0 16 5 1 2 10 9 6 1 60 2 9 24 5 8 3 37 15 4 13 8 17 4 2 2 9 2 4 2 15 14 297 64 5 0 1 2 4 1 0 4 12 6 10 0 0 3 3 12 4 6 2 13 45 0 5 1 17 75 43 7 4 2 1 1 0 13 92 3 2 29 130 6 4 12 5 1 103 55 2 3 1 2 1 11 67 33 35 204 71 98 88 69 181 220 38 59 50 42 36 17 168 243 152 177 278 431 26 234 474 13 134 557 174 38 242 87 24 34 10 9 102 17 20 243 19 45 11 45 98 158 275 96 28 236 13 87 21 1 47 28 444 454 20 165 31 9 17 32 61 25 121 150 1186 210 13 34 271 511 78 209 16 111 355 6 69 31 949 55 36 20 5 123 18 102 1203 355 296 125 22 79 75 154 12 1149 37 65 18 295 486 4 224 26 45 206 371 155 757 102 2903 82 28 45 46 810 66 10 3 18 7 1 387 1133 450 200 129 42 115 158 729 49 96 209 760 10 19 297 14 8 154 98 12 728 120 54 330 18 29 430 157 240 127 212 43 64 278 104 71 50 39 24 261 13 84 14 29 23 276 93 45 73 56 40 16 31 24 264 108 13 168 240 2 421 54 11 15 218 30 89 161 82 32 295 166 32 162 446 68 21 94 91 28 106 229 88 19 23 10 161 12 36 7 168 3 4 86 15 20 78 44 197 151 37 80 28 93 46 21 130 6 182 238 15 12 43 36 91 87 186 27 202 18 49 27 21 44 18 14 77 52 118 7 13 12 455 115 38 132 11 69 107 772 53 19 123 6 9 31 173 13 70 553 34 29 176 78 28 261 85 20 23 83 41 78 963 25 44 2 110 543 161 99 18 108 90 72 88 73 372 315 32 14 306 4 67 71 16 46 12 104 866 38 151 185 164 325 109 106 150 184 368 76 46 175 129 187 71 369 51 15 567 47 2585 159 33 376 148 104 162 21 44 197 130 119 26 543 137 217 358 22 1069 448 156 11 46 43 159 7 27 0 198 17 111 54 22 145 67 93 423 264 445 609 58 427 15 505 187 72 43 44 133 1 32 44 5 286 51 12 136 76 355 89 105 115 846 209 380 59 221 15 134 364 648 423 148 25 113 12 326 36 372 60 259 507 195 213 645 198 41 64 87 770 94 71 433 94 187 61 10 121 132 5 94 1255 13 4 388 1029 111 24 36 61 37 317 63 10 66 27 41 171 25 11 76 159 275 2 108 620 371 454 55 127 83 67 10 10 296 103 1 224 409 120 135 102 133 56 611 39 73 101 1169 1025 728 4176 216 158 121 893 188 2 103 146 72 180 150 75 1875 136 117 58 189 55 433 105 62 11 53 708 378 22 3 35 161 172 10 360 335 82 6 435 28 73 5 265 118 32 95 82 477 118 6 167 26 50 26 583 125 2 184 116 126 133 86 104 48 162 3 74 2001 83 28 46 28 8 209 333 217 21 33 5 7 50 13 18 170 179 55 64 270 130 52 91 53 48 24 466 63 31 41 104 102 7 135 5 24 50 32 10 32 64 129 121 149 92 57 116 18 24 10 20 99 206 45 142 318 94 75 6 64 48 49 49 72 79 123 52 329 183 265 195 30 127 171 23 48 10 124 212 243 93 123 2 105 258 68 53 115 292 343 468 14 946 62 290 523 431 52 39 163 233 26 77 47 17 20 255 60 167 92 129 242 84 299 384 560 517 731 3 151 21 3 149 47 208 16 191 79 1159 392 163 215 145 349 513 128 9 28 37 10 15 208 3 23 17 381 91 127 851 164 404 54 144 17 437 16 43 275 318 277 183 26 76 73 10 377 120 169 174 64 526 269 112 662 309 191 300 40 76 33 13 75 118 31 20 57 16 7 17 4 46 79 131 15 39 45 34 3 2 212 7 88 34 22 12 309 45 15 441 62 11 155 170 487 49 18 76 53 126 2 364 377 430 119 89 172 62 4 662 24 30 19 204 189 576 38 36 101 697 20 126 26 5 1332 SPP66 Bacteria;Bacteroidetes;Bacteroidia;Bacteroidales;Porphyromonadaceae;Tannerella;multispecies_spp66_2 0 0 0 0 0 0 0 0 0 0 0 0 0 0 0 0 0 0 0 0 0 0 0 0 0 0 0 0 0 0 0 0 0 0 0 0 0 0 0 0 0 0 0 0 0 0 0 0 0 0 0 0 0 0 0 0 0 0 0 0 0 0 0 0 0 0 0 0 0 0 0 0 0 0 0 0 0 0 0 0 0 0 0 0 0 0 0 0 0 0 0 0 0 0 0 0 0 0 0 0 0 0 0 0 0 0 0 0 0 0 0 0 0 0 0 0 0 0 0 0 0 0 0 0 0 0 0 0 0 0 0 0 0 0 0 0 0 0 0 0 0 0 0 0 0 0 0 0 0 0 0 0 0 0 0 0 0 0 0 0 0 0 0 0 0 0 0 0 0 0 0 0 0 0 0 0 0 0 0 0 0 0 0 0 0 0 0 0 0 0 0 0 0 0 0 0 0 0 0 0 0 0 0 0 0 0 0 0 0 0 0 0 0 0 0 0 0 0 0 0 0 0 0 0 0 0 0 0 0 0 0 0 0 0 0 0 0 0 0 0 0 0 0 0 0 0 0 0 0 0 0 0 0 0 0 0 0 0 0 0 0 0 0 0 0 0 0 0 0 57 3 0 0 4 2 0 12 10 191 0 39 61 6 225 16 0 4 0 0 21 49 0 2 0 281 16 36 0 0 2 0 0 69 31 5 0 5 0 1 0 0 0 0 0 0 0 0 2 0 0 0 0 0 0 0 0 0 0 0 0 0 0 0 0 0 0 0 0 6 0 0 7 0 5 3 0 0 1 0 0 0 0 0 6 0 0 0 0 0 0 0 0 0 0 0 0 0 0 8 0 0 0 1 15 0 0 0 0 0 4 0 0 10 5 0 0 11 5 0 0 0 0 0 21 0 0 0 0 1 1 0 0 5 18 54 0 0 5 0 0 0 94 0 15 11 0 0 0 74 0 0 0 1 1 0 1 0 0 0 0 0 4 6 58 0 2 36 0 0 0 11 0 0 3 3 0 0 0 61 3 79 0 22 0 0 0 0 1 0 0 0 0 0 0 0 1 0 24 0 0 3 0 0 5 1 0 29 0 0 1 0 2 4 1 51 28 7 21 0 39 23 0 2 115 151 0 0 0 0 14 20 0 0 0 1 0 0 0 0 0 8 0 0 0 0 0 6 0 0 0 0 4 0 0 0 3 0 1 0 3 0 0 11 0 5 0 0 14 0 5 0 1 65 2 1 0 3 8 2 0 84 1 0 0 1 0 0 0 0 61 0 6 0 66 50 132 0 0 0 19 0 0 0 0 28 1 0 0 2 0 0 1 2 0 0 0 9 0 0 0 0 0 44 1 0 120 0 3 0 5 0 54 0 180 0 0 0 0 0 6 0 1 1 0 0 5 0 0 0 0 0 0 0 0 33 47 50 0 0 4 0 0 2 1 6 7 37 0 0 2 0 9 5 38 3 0 0 15 10 0 0 0 2 8 0 0 34 0 0 4 0 0 60 13 0 0 5 0 1 0 0 7 0 0 0 0 2 0 7 0 0 13 83 1 0 6 54 0 0 27 2 0 0 0 13 122 0 0 0 0 43 1 0 4 0 0 5 0 0 18 2 0 25 26 0 6 0 0 1 2 0 0 0 1 0 6 4 0 4 0 91 30 0 5 0 2 4 10 134 6 0 45 22 0 4 0 0 4 4 0 5 0 24 0 0 38 0 2 0 34 1 70 15 1 0 0 68 10 0 58 5 0 64 26 0 0 36 0 58 40 11 1 0 0 0 0 0 1 0 0 0 1 0 3 0 1 9 0 0 0 0 0 0 0 0 1 0 0 19 0 0 0 0 0 0 0 0 0 0 2 0 0 0 0 0 0 0 0 0 0 0 0 0 0 2 0 1 0 1 0 204 0 1 0 1 0 0 0 3 0 0 0 0 0 37 1 0 25 0 0 2 0 10 53 2 0 7 109 8 3 2 23 2 21 30 0 203 0 42 0 2 6 0 21 36 0 6 2 3 36 28 0 0 6 7 0 1 0 10 0 1 0 3 0 6 0 0 22 115 0 52 15 0 13 5 1 0 18 47 0 0 18 0 12 0 0 0 5 0 0 21 2 24 125 0 12 0 18 0 12 7 0 2 5 0 0 5 1 0 0 2 0 16 7 0 4 4 1 0 0 0 73 0 97 0 4 0 0 11 0 13 11 0 29 25 0 97 14 0 11 1 0 3 10 0 8 0 66 0 97 36 0 3 15 0 0 3 1 0 0 3 11 8 16 0 66 0 0 0 0 0 2 0 0 1 1 0 0 0 1 0 1 0 3 2 0 3 1 2 0 0 1 0 70 10 0 15 7 22 0 1 0 0 29 7 0 5 2 1 0 6 0 0 5 0 0 73 7 0 1 13 0 0 0 7 14 0 0 4 0 17 1 0 16 4 24 66 0 0 0 0 100 0 0 5 7 0 0 5 0 0 17 5 1 0 0 0 0 0 0 0 0 32 1 0 0 0 0 0 1 0 0 16 0 0 15 0 0 1 0 5 3 339 2 21 0 47 13 0 7 0 0 2 0 0 0 21 3 1 2 0 0 0 9 7 1 0 83 8 0 29 2 0 2 8 0 24 1 3 0 0 0 0 0 2 1 1 22 1 5 1 5 78 0 21 2 0 1 0 0 0 200 0 0 85 0 0 0 0 6 8 0 24 125 8 0 16 2 0 4 2 0 4 9 0 2 0 33 8 0 35 12 0 7 0 0 0 21 4 1 0 12 4 0 29 1 0 7 6 52 0 13 29 0 243 18 0 0 14 0 0 0 31 0 1 0 0 65 3 1 0 0 2 14 2 0 3 1 0 19 23 0 0 18 0 0 11 13 0 2 2 0 0 32 12 0 0 27 0 9 0 1 5 1 2 0 58 0 0 0 32 28 0 38 4 0 61 0 0 0 0 0 0 49 0 0 45 4 0 247 22 0 0 6 3 0 3 0 2 0 0 0 0 0 0 12 4 1 0 17 0 0 264 19 1 13 1 0 97 2 3 0 250 45 0 23 4 0 0 0 1 0 3 4 5 0 27 0 0 22 0 0 11 0 62 3 0 5 0 0 170 12 0 0 73 1 0 12 142 0 1 0 0 0 75 0 0 0 21 2 0 12 14 0 0 26 10 0 0 0 9 0 0 81 0 0 1 0 0 0 0 0 1 0 141 23 0 120 0 0 0 4 0 24 6 0 0 0 10 0 140 62 0 0 0 39 0 3 0 0 3 3 0 37 0 0 0 1 8 0 11 25 0 0 0 0 2 50 129 0 0 0 432 1 0 28 2 2 0 4 0 140 0 0 0 1 0 0 0 0 0 8 0 0 0 0 0 0 0 154 0 0 58 0 0 1 15 0 7 2 0 9 10 0 66 275 36 0 0 5 8 0 0 1 0 53 0 0 0 5 0 0 30 4 0 42 12 0 0 27 4 0 161 9 0 111 105 0 0 6 17 8 11 0 4 1 0 0 4 6 0 150 1 17 0 7 8 0 10 1 6 14 0 0 43 9 1 0 23 0 2 13 0 0 15 0 14 2 22 0 6 2 0 0 22 0 76 17 0 0 0 49 0 3 6 0 9 0 0 0 4 7 0 0 0 0 0 18 1 0 14 0 0 12 2 4 0 0 36 0 13 2 0 22 16 0 0 21 5 0 0 16 0 28 78 0 2 57 35 0 0 4 15 0 2 11 0 2 27 0 1 1 0 0 2 0 0 49 0 0 7 0 0 0 60 30 0 189 22 0 0 11 0 0 0 0 0 37 1 0 23 0 0 54 0 0 0 0 2 6 0 0 27 0 2 5 0 0 8 0 6 0 1 151 1 1 4 0 0 0 1 4 0 5 3 1 16 28 0 60 10 2 0 0 1 0 4 60 11 1 0 251 96 3 0 7 56 0 50 1 0 13 0 3 1 0 0 0 1 1 0 19 0 0 20 43 0 53 8 10 8 0 0 129 35 0 0 0 0 16 27 0 13 5 70 0 42 28 0 9 34 0 0 0 15 0 6 0 0 6 0 0 0 3 4 0 1 18 0 0 10 0 0 0 1 0 9 2 0 0 2 1 0 1 8 1 23 0 0 0 0 1 3 0 SPP69 Bacteria;Firmicutes;Negativicutes;Selenomonadales;Selenomonadaceae;multigenus;multispecies_spp69_3 0 0 0 0 0 0 0 0 0 0 0 0 0 0 0 0 0 0 0 0 0 0 0 0 0 0 0 0 0 0 0 0 0 0 0 0 0 0 0 0 0 0 0 0 0 0 0 0 0 0 0 0 0 0 0 0 0 0 0 0 0 0 0 0 0 0 0 0 0 0 0 0 0 0 0 0 0 0 0 0 0 0 0 0 0 0 0 0 0 0 0 0 0 0 0 0 0 0 0 0 0 0 0 0 0 0 0 0 0 0 0 0 0 0 0 0 0 0 0 0 0 0 0 0 0 0 0 0 0 0 0 0 0 0 0 0 0 0 0 0 0 0 0 0 0 0 0 0 0 0 0 0 0 0 0 0 0 0 0 0 0 0 0 0 0 0 0 0 0 0 0 0 0 0 0 0 0 0 0 0 0 0 0 0 0 0 0 0 0 0 0 0 0 0 0 0 0 0 0 0 0 0 0 0 0 0 0 0 0 0 0 0 0 0 0 0 0 0 0 0 0 0 0 0 0 0 0 0 0 0 0 0 0 0 0 0 0 0 0 0 0 0 0 0 0 0 0 0 0 0 0 0 0 0 0 0 0 0 0 0 0 0 0 0 0 0 0 0 0 2 1 0 0 15 10 0 2 6 46 0 24 18 1 2 0 0 0 0 0 1 0 0 0 0 0 0 4 161 0 4 0 0 89 40 0 0 10 0 0 0 0 0 1 0 4 43 0 0 0 0 0 9 1 0 0 0 0 0 0 0 0 11 0 0 0 0 0 0 0 0 0 2 0 0 0 0 0 3 0 0 0 0 0 56 0 0 0 0 0 0 0 0 0 0 0 0 0 0 0 0 14 0 39 6 0 0 0 0 0 0 0 0 1 11 0 0 0 0 0 0 0 0 0 0 0 0 0 0 0 0 0 0 0 0 0 0 0 0 0 0 0 4 0 23 0 0 0 0 9 0 0 0 0 0 0 7 6 0 0 1 0 0 2 15 0 0 4 0 0 0 1 0 0 1 0 7 0 0 4 68 18 9 46 0 0 0 0 212 0 3 5 0 0 0 0 0 0 1 0 0 0 0 0 7 1 0 4 2 0 4 0 0 0 0 0 0 10 20 0 2 12 0 2 73 3 0 1 0 0 0 0 0 0 0 0 0 0 0 1 0 0 0 0 0 0 0 0 0 0 0 0 0 0 0 1 1 0 1 0 0 0 7 0 0 4 0 0 0 0 0 0 0 1 0 0 0 42 17 0 0 4 0 0 0 0 0 0 0 0 22 0 4 0 160 240 174 0 0 0 0 0 0 0 0 0 0 32 0 0 0 0 2 0 0 1 0 57 0 0 0 0 0 1 0 0 3 0 0 0 0 0 294 0 72 0 0 0 0 0 0 0 1 0 0 0 0 18 0 0 1 0 0 0 0 0 0 0 0 0 6 1 18 19 0 0 0 9 0 14 1 0 2 16 1 0 0 0 1 0 3 0 0 0 0 0 53 156 0 0 1 0 0 4 2 16 3 50 0 1 0 0 0 0 9 0 0 0 0 0 0 0 3 48 0 0 0 0 0 0 2 0 0 1 29 0 1 0 0 0 0 0 0 2 2 0 0 1 0 0 0 0 0 73 55 0 0 0 0 0 0 0 0 20 0 0 1 2 6 5 0 12 29 0 1 0 7 7 4 72 0 0 43 75 0 0 0 0 0 0 0 1 0 3 0 142 123 0 0 0 0 0 0 0 0 0 0 0 0 0 116 0 0 29 0 0 0 0 0 0 0 0 0 0 0 5 0 1 0 0 0 0 0 0 0 0 0 0 0 0 0 0 0 0 0 0 0 0 0 0 0 0 0 0 0 0 0 0 0 12 0 0 0 0 0 0 0 0 0 0 0 0 0 0 0 0 0 0 6 3 0 29 0 0 0 0 1 0 0 12 0 0 21 0 0 0 0 0 123 0 0 0 0 5 0 0 0 0 0 0 0 8 82 0 0 49 0 0 0 1 0 0 1 0 0 0 0 0 0 0 0 67 0 0 0 1 0 0 0 1 0 0 0 9 0 0 0 0 0 7 0 0 0 0 0 6 1 0 42 0 0 0 0 0 3 0 0 0 2 1 0 0 0 16 115 0 0 0 2 0 7 0 0 0 0 0 0 9 0 8 0 7 0 33 12 0 0 0 0 0 0 0 1 0 10 0 30 0 5 33 0 0 0 0 3 5 0 37 1 0 0 0 0 1 0 0 0 0 0 2 0 0 0 13 27 0 0 0 1 46 0 0 0 0 0 1 2 0 0 0 0 0 1 0 0 87 0 0 0 0 0 0 0 0 0 4 0 2 0 15 0 0 0 0 3 0 0 2 0 1 0 0 0 0 9 6 0 1 3 0 0 1 0 0 1 0 0 0 0 0 0 1 0 0 0 0 5 0 0 0 0 2 3 0 1 1 4 4 0 0 0 0 0 0 0 0 0 0 0 4 0 0 0 0 0 0 0 0 0 0 0 0 0 0 0 0 0 0 0 0 0 0 0 0 0 0 0 0 0 0 0 0 0 7 0 0 0 31 3 0 1 0 0 0 0 0 0 0 0 0 0 0 0 0 0 0 0 0 45 0 0 9 0 0 0 0 0 0 0 0 0 0 0 0 0 0 0 0 3 0 1 0 4 1 0 0 0 0 0 0 0 0 0 1 0 0 0 0 0 0 6 19 0 1 0 2 0 0 14 0 0 0 0 1 16 0 0 0 1 1 0 7 1 0 5 0 0 0 0 0 0 0 2 0 0 0 0 0 0 0 14 0 3 3 0 2 1 0 0 1 0 0 0 0 0 0 0 0 0 0 0 0 1 0 3 6 0 2 0 0 1 0 0 0 3 0 0 0 0 0 0 0 0 0 0 2 0 10 49 0 0 0 0 0 0 0 0 2 0 0 0 1 0 0 11 0 0 5 0 0 1 1 0 0 0 0 0 23 0 0 0 0 0 0 0 0 0 0 0 0 0 0 0 0 0 0 0 0 0 0 3 0 0 27 0 13 0 0 0 2 0 0 0 0 0 0 0 0 0 0 0 0 0 0 0 0 0 0 0 0 7 0 0 16 0 0 4 0 0 0 0 0 0 0 0 9 0 1 0 72 0 0 0 0 1 0 0 0 0 10 3 0 2 0 0 0 70 7 0 0 0 33 0 0 0 0 0 1 0 0 0 0 0 0 0 45 4 0 0 0 0 3 0 0 2 0 0 0 0 0 0 0 0 0 0 0 0 0 0 0 0 45 2 0 1 2 0 0 0 2 0 3 97 0 0 0 0 0 0 74 0 0 2 0 0 0 0 2 0 0 0 0 102 2 0 0 0 0 0 0 0 0 0 0 0 0 0 0 0 0 0 0 0 0 0 0 0 0 0 0 0 0 0 0 0 21 45 0 0 0 12 5 0 0 0 0 0 0 0 0 0 0 0 0 0 0 0 0 0 0 6 0 0 0 0 0 3 10 0 1 0 0 0 0 0 0 0 0 0 0 0 0 26 1 0 0 0 0 0 0 0 2 6 0 0 1 0 0 0 15 0 0 0 0 0 0 0 0 10 5 0 0 0 0 0 0 0 5 1 0 0 0 2 0 0 1 0 0 1 0 0 0 0 0 0 0 0 0 0 0 0 10 0 0 0 0 0 0 0 0 0 0 0 0 2 10 0 0 0 3 0 0 0 0 4 0 0 0 0 0 0 0 1 4 0 0 0 0 0 0 0 0 1 0 0 0 0 0 0 0 0 0 0 0 0 12 1 0 4 2 0 0 0 0 0 1 0 0 1 0 0 0 0 0 0 0 0 6 0 0 0 0 0 0 0 20 0 0 0 0 0 0 0 0 22 0 0 0 0 0 0 2 0 0 3 0 0 0 0 0 2 0 0 0 0 0 0 0 16 1 0 0 3 0 1 0 0 0 0 0 0 0 0 0 0 0 0 0 0 0 0 0 0 0 0 9 69 0 1 0 0 2 0 0 22 5 0 0 0 0 0 1 0 0 0 4 0 0 0 0 1 2 0 0 0 0 0 4 1 0 0 0 0 0 0 0 0 10 2 0 0 0 0 0 2 0 0 6 2 0 0 0 0 0 0 1 0 0 0 0 0 0 0 0 0 SPP72 Bacteria;Firmicutes;Negativicutes;Selenomonadales;Selenomonadaceae;Selenomonas;multispecies_spp72_9 0 0 0 0 0 0 0 0 0 0 0 0 0 0 0 0 0 0 0 0 0 0 0 0 0 0 0 0 0 0 0 0 0 0 0 0 0 0 0 0 0 0 0 0 0 0 0 0 0 0 0 0 0 0 0 0 0 0 0 0 0 0 0 0 0 0 0 0 0 0 0 0 0 0 0 0 0 0 0 0 0 0 0 0 0 0 0 0 0 0 0 0 0 0 0 0 0 0 0 0 0 0 0 0 0 0 0 0 0 0 0 0 0 0 0 0 0 0 0 0 0 0 0 0 0 0 0 0 0 0 0 0 0 0 0 0 0 0 0 0 0 0 0 0 0 0 0 0 0 0 0 0 0 0 0 0 0 0 0 0 0 0 0 0 0 0 0 0 0 0 0 0 0 0 0 0 0 0 0 0 0 0 0 0 0 0 0 0 0 0 0 0 0 0 0 0 0 0 0 0 0 0 0 0 0 0 0 0 0 0 0 0 0 0 0 0 0 0 0 0 0 0 0 0 0 0 0 0 0 0 0 0 0 0 0 0 0 0 0 0 0 0 0 0 0 0 0 0 0 0 0 0 0 0 0 0 0 0 0 0 0 0 0 0 0 0 0 0 0 90 0 0 1 0 44 0 39 37 98 0 43 9 1 30 0 1 1 0 30 2 67 0 4 0 121 26 3 239 0 7 2 81 91 78 8 0 2 0 2 0 23 0 0 0 0 0 0 15 3 0 0 29 124 0 56 0 0 0 0 0 0 0 0 0 0 0 1 0 0 0 0 2 0 16 2 0 0 4 0 0 1 1 0 11 0 0 0 2 0 0 0 2 0 4 0 3 0 0 20 0 5 0 14 49 0 0 0 0 0 13 0 0 5 3 0 0 17 7 0 0 0 0 0 22 1 1 5 0 0 64 0 0 0 13 2 0 0 5 0 0 1 112 0 31 4 0 2 0 197 0 4 4 3 131 0 49 3 0 0 0 0 44 119 48 0 2 117 0 3 0 17 0 0 0 3 0 0 0 140 21 3 0 25 0 0 5 0 26 0 118 15 0 0 1 0 2 0 21 3 0 0 3 0 67 3 0 12 0 1 61 3 6 0 55 195 4 18 85 0 18 35 0 5 186 32 0 1 0 0 8 23 0 0 0 18 0 0 0 0 0 68 7 0 1 0 0 9 4 0 0 0 3 0 0 22 1 2 12 0 7 0 32 83 0 7 0 0 56 0 35 0 3 35 2 0 0 27 38 0 0 124 0 0 1 1 3 0 3 0 168 0 79 0 41 19 30 0 0 0 0 0 0 0 1 23 2 18 0 0 0 0 3 1 0 0 44 14 0 1 0 2 0 0 0 0 54 0 29 0 0 0 160 0 87 1 0 0 1 0 5 0 5 0 0 0 8 18 0 1 0 6 1 0 1 7 18 15 0 0 4 32 0 9 73 9 35 65 0 6 9 0 1 7 60 34 0 0 92 15 6 27 0 0 0 0 32 213 0 0 3 1 3 84 42 536 0 26 0 4 1 0 18 0 64 0 1 16 0 0 0 0 12 92 0 0 11 13 0 0 34 11 0 0 15 6 12 0 0 0 0 101 13 1 8 0 0 8 0 5 7 0 0 159 60 0 8 0 0 0 4 0 2 49 0 0 13 45 20 2 0 79 0 1 1 2 6 1 5 48 2 0 126 234 0 1 0 0 19 155 0 75 0 83 0 139 174 0 3 0 188 12 22 2 0 0 0 5 9 0 73 4 16 123 143 0 0 31 9 34 28 43 3 0 3 0 0 325 1 0 0 0 6 0 104 0 4 23 0 0 0 0 0 0 0 0 0 30 3 51 0 3 0 0 0 0 18 0 0 2 4 0 5 0 0 0 0 0 5 17 0 0 0 0 0 0 0 0 6 0 0 36 0 0 0 3 1 13 0 18 0 0 54 0 0 67 0 3 36 0 0 0 0 0 9 0 0 2 111 60 2 9 21 0 67 221 0 118 0 29 0 1 66 2 6 11 0 1 0 9 1 1 0 0 1 0 0 0 0 176 0 7 0 23 0 5 0 0 2 313 119 16 16 0 17 26 2 0 72 20 35 0 2 1 89 0 0 0 39 5 2 10 0 20 66 0 4 0 24 18 56 8 2 6 3 0 7 29 1 1 1 0 0 53 137 0 57 51 0 0 0 0 18 0 208 0 8 0 0 27 0 59 32 0 15 88 0 34 8 1 44 0 0 9 2 0 6 0 144 100 57 37 1 2 29 9 2 0 0 21 0 1 8 8 40 3 18 0 0 0 0 0 8 0 0 50 0 0 0 0 0 0 1 0 1 5 0 4 0 60 0 0 25 0 8 4 0 0 1 15 0 43 2 0 92 0 0 0 3 1 0 3 0 0 0 1 0 23 0 0 0 28 2 0 0 2 241 0 0 1 0 1 0 0 0 4 4 49 0 0 0 0 0 0 0 0 3 0 0 5 0 0 24 1 0 0 0 0 0 1 0 0 0 11 0 0 0 0 0 0 0 1 0 0 0 0 3 0 0 0 17 3 1 169 0 4 0 6 0 0 2 1 0 10 18 0 0 0 4 0 1 0 0 0 20 30 0 0 45 0 0 151 1 0 0 5 0 1 1 0 0 0 1 0 1 0 0 5 3 0 13 0 6 10 1 1 0 0 0 0 0 0 40 3 0 16 14 0 0 0 1 3 0 15 19 11 0 5 42 0 14 0 0 0 0 0 0 0 27 21 0 20 3 0 6 1 1 1 4 11 0 0 28 26 0 5 0 0 2 2 225 0 17 4 0 67 18 0 0 9 0 0 0 64 2 0 0 0 9 33 0 0 0 0 2 33 0 3 0 0 2 10 0 0 16 4 0 0 38 0 14 1 0 0 22 6 0 10 36 0 4 0 0 3 0 7 0 37 0 0 0 13 56 0 79 3 0 0 0 0 23 3 1 0 1 0 1 254 3 0 9 1 0 0 0 0 0 0 0 2 0 1 0 0 4 0 3 0 0 0 13 1 0 143 19 32 3 0 0 43 6 2 0 23 4 0 1 0 0 0 1 0 0 0 0 3 0 0 1 0 28 0 0 26 0 22 2 0 0 2 1 7 13 0 0 18 1 4 0 84 0 0 0 0 0 53 0 0 0 1 21 0 1 2 0 0 10 8 0 0 0 22 0 0 19 0 0 0 0 0 0 0 0 6 0 3 9 0 5 0 0 0 5 0 6 4 0 0 12 1 0 77 1 0 0 1 5 0 0 0 0 64 1 0 4 0 0 0 0 16 1 1 241 0 0 2 0 0 2 3 2 0 0 195 1 0 9 6 0 2 2 0 16 3 18 0 1 0 0 0 0 0 3 4 0 0 2 0 0 0 58 0 0 2 0 0 1 4 0 2 12 0 14 164 0 25 115 2 0 0 2 8 0 0 0 0 19 6 0 1 1 1 0 6 2 0 16 2 0 0 4 1 0 78 5 0 27 84 0 1 1 49 2 138 0 7 0 0 0 1 0 1 54 4 12 0 1 2 0 1 0 0 70 0 0 63 0 1 0 139 0 0 1 0 0 1 0 0 357 17 0 5 6 0 1 8 0 28 11 2 0 0 5 0 0 17 0 1 0 0 0 1 6 0 0 0 0 0 0 0 0 8 0 0 17 6 7 0 0 28 0 2 1 0 2 14 0 0 0 0 0 0 15 0 40 25 0 1 19 4 0 0 0 106 0 1 8 0 0 1 0 0 2 0 0 1 0 0 2 0 0 0 0 0 0 9 33 0 81 4 0 0 9 0 2 1 0 0 3 1 0 0 0 0 0 0 0 0 4 0 3 0 0 0 0 0 1 0 4 0 0 9 0 0 1 0 0 0 2 0 0 0 3 0 2 1 0 3 0 0 4 18 0 0 0 0 0 11 7 7 0 0 20 1 1 1 47 56 0 19 0 1 2 1 1 0 0 0 0 0 0 0 23 0 0 4 199 1 3 0 4 11 0 0 139 11 0 0 1 0 4 26 0 14 0 341 1 26 41 0 1 4 0 1 0 3 0 4 0 0 3 5 0 0 0 16 0 12 5 0 0 0 0 0 1 0 0 14 24 0 0 0 0 0 0 3 0 10 0 0 0 5 0 3 0 SPP73 Bacteria;Firmicutes;Bacilli;Lactobacillales;Streptococcaceae;Streptococcus;multispecies_spp73_2 4777 1029 25 2573 289 207 103 299 58 84 2165 89 170 452 23 965 1347 454 1167 2245 730 2422 1447 656 2055 306 87 348 20 26 52 289 19 112 575 1719 2743 178 665 125 206 70 166 1112 571 694 262 647 391 554 1593 3031 810 167 439 391 6530 1264 25 606 3511 78 243 142 388 32 110 1480 905 59 329 453 475 104 2003 0 1621 1921 63 235 273 834 1772 846 498 2088 706 1197 272 3700 55 270 60 36 507 77 4 74 32 1501 131 546 1574 21 186 62 769 39 1 252 138 138 319 1042 496 574 365 800 698 696 795 2459 1056 1020 473 718 1151 204 3044 68 882 197 1459 1079 822 18 2229 976 133 1512 247 22 492 289 82 195 1236 200 930 5 95 1016 701 64 2361 1089 6545 1370 63 2443 367 13 159 64 97 3139 105 1639 6 351 2 760 16 92 4633 438 409 388 35 54 1076 2924 1 3164 1486 628 547 271 1 306 211 143 2549 487 1977 179 1076 1312 1297 102 14 131 1576 0 55 1951 9 19 82 0 1685 573 1272 744 353 158 39 3979 8 921 111 1262 353 520 3188 1060 829 162 34 1336 737 45 280 357 2808 1012 1074 832 563 110 134 49 146 55 82 2633 652 164 689 4021 4465 1 4 219 1270 1990 1448 2538 697 448 1208 3840 653 756 240 2394 1861 2333 0 0 0 0 0 0 0 0 0 0 0 0 0 0 0 0 0 0 0 0 0 0 0 0 0 0 0 0 0 0 0 0 0 0 0 0 0 0 0 0 0 0 0 0 0 0 0 0 0 0 0 0 0 0 0 0 0 0 0 0 0 0 0 0 0 0 0 0 0 0 0 0 0 0 0 0 0 0 0 0 0 0 0 0 0 0 0 0 0 0 0 0 0 0 0 0 0 0 0 0 0 0 0 0 0 0 0 0 0 0 0 0 0 0 0 0 0 0 0 0 0 0 0 0 0 0 0 0 0 0 0 0 0 0 0 0 0 0 0 0 0 0 0 0 0 0 0 0 0 0 0 0 0 0 0 0 0 0 0 0 0 0 0 0 0 0 0 0 0 0 0 0 0 0 0 0 0 0 0 0 0 0 0 0 0 0 0 0 0 0 0 0 0 0 0 0 0 0 0 0 0 0 0 0 0 0 0 0 0 0 0 0 0 0 0 0 0 0 0 0 0 0 0 0 0 0 0 0 0 0 0 0 0 0 0 0 0 0 0 0 0 0 0 0 0 0 0 0 0 0 0 0 0 0 0 0 0 0 0 0 0 0 0 0 0 0 0 0 0 0 0 0 0 0 0 0 0 0 0 0 0 0 0 0 0 0 0 0 0 0 0 0 0 0 0 0 0 0 0 0 0 0 0 0 0 0 0 0 0 0 0 0 0 0 0 0 0 0 0 0 0 0 0 0 0 0 0 0 0 0 0 0 0 0 0 0 0 0 0 0 0 0 0 0 0 0 0 0 0 0 0 0 0 0 0 0 0 0 0 0 0 0 0 0 0 0 0 0 0 0 0 0 0 0 0 0 0 0 0 0 0 0 0 0 0 0 0 0 0 0 0 0 0 0 0 0 0 0 0 0 0 0 0 0 0 0 0 0 0 0 0 0 0 0 0 0 0 0 0 0 0 0 0 0 0 0 0 0 0 0 0 0 0 0 0 0 0 0 0 0 0 0 0 0 0 0 0 0 0 0 0 0 0 0 0 0 0 0 0 0 0 0 0 0 0 0 0 0 0 0 0 0 0 0 0 0 0 0 0 0 0 0 0 0 0 0 0 0 0 0 0 0 0 0 0 0 0 0 0 0 0 0 0 0 0 0 0 0 0 0 0 0 0 0 0 0 0 0 0 0 0 0 0 0 0 0 0 0 0 0 0 0 0 0 0 0 0 0 0 0 0 0 0 0 0 0 0 0 0 0 0 0 0 0 0 0 0 0 0 0 0 0 0 0 0 0 0 0 0 0 0 0 0 0 0 0 0 0 0 0 0 0 0 0 0 0 0 0 0 0 0 0 0 0 0 0 0 0 0 0 0 0 0 0 0 0 0 0 0 0 0 0 0 0 0 0 0 0 0 0 0 0 0 0 0 0 0 0 0 0 0 0 0 0 0 0 0 0 0 0 0 0 0 0 0 0 0 0 0 0 0 0 0 0 0 0 0 0 0 0 0 0 0 0 0 0 0 0 0 0 0 0 0 0 0 0 0 0 0 0 0 0 0 0 0 0 0 0 0 0 0 0 0 0 0 0 0 0 0 0 0 0 0 0 0 0 0 0 0 0 0 0 0 0 0 0 0 0 0 0 0 0 0 0 0 0 0 0 0 0 0 0 0 0 0 0 0 0 0 0 0 0 0 0 0 0 0 0 0 0 0 0 0 0 0 0 0 0 0 0 0 0 0 0 0 0 0 0 0 0 0 0 0 0 0 0 0 0 0 0 0 0 0 0 0 0 0 0 0 0 0 0 0 0 0 0 0 0 0 0 0 0 0 0 0 0 0 0 0 0 0 0 0 0 0 0 0 0 0 0 0 0 0 0 0 0 0 0 0 0 0 0 0 0 0 0 0 0 0 0 0 0 0 0 0 0 0 0 0 0 0 0 0 0 0 0 0 0 0 0 0 0 0 0 0 0 0 0 0 0 0 0 0 0 0 0 0 0 0 0 0 0 0 0 0 0 0 0 0 0 0 0 0 0 0 0 0 0 0 0 0 0 0 0 0 0 0 0 0 0 0 0 0 0 0 0 0 0 0 0 0 0 0 0 0 0 0 0 0 0 0 0 0 0 0 0 0 0 0 0 0 0 0 0 0 0 0 0 0 0 0 0 0 0 0 0 0 0 0 0 0 0 0 0 0 0 0 0 0 0 0 0 0 0 0 0 0 0 0 0 0 0 0 0 0 0 0 0 0 0 0 0 0 0 0 0 0 0 0 0 0 0 0 0 0 0 0 0 0 0 0 0 0 0 0 0 0 0 0 0 0 0 0 0 0 0 0 0 0 0 0 0 0 0 0 0 0 0 0 0 0 0 0 0 0 0 0 0 0 0 0 0 0 0 0 0 0 0 0 0 0 0 0 0 0 0 0 0 0 0 0 0 0 0 0 0 0 0 0 0 0 0 0 0 0 0 0 0 0 0 0 0 0 0 0 0 0 0 0 0 0 0 0 0 0 0 0 0 0 0 0 0 0 0 0 0 0 0 0 0 0 0 0 0 0 0 0 0 0 0 0 0 0 0 0 0 0 0 0 0 0 0 0 0 0 0 0 0 0 0 0 0 0 0 0 0 0 0 0 0 0 0 0 0 0 0 0 0 0 0 0 0 0 0 0 0 0 0 0 0 0 0 0 0 0 0 0 0 0 0 0 0 0 0 0 0 0 0 0 0 0 0 0 0 0 0 0 0 0 0 0 0 0 0 0 0 0 0 0 0 0 0 0 0 0 0 0 0 0 0 0 0 0 0 0 0 0 0 0 0 0 0 0 0 0 0 0 0 0 0 0 0 0 0 0 0 0 0 0 0 0 0 0 0 0 0 0 0 0 0 0 0 0 0 0 0 0 0 0 0 0 0 0 0 0 0 0 0 0 0 0 0 0 0 0 0 0 0 0 0 0 0 0 0 0 0 0 0 0 0 0 0 0 0 0 0 0 0 0 0 0 0 0 0 0 0 0 0 0 0 0 0 0 0 0 0 0 0 0 0 0 0 0 0 0 0 0 0 0 0 0 0 0 0 0 0 0 0 0 0 0 0 0 0 0 0 0 0 0 0 0 0 0 0 0 0 0 0 0 0 0 0 0 0 0 0 0 0 0 0 0 0 0 0 0 0 0 0 0 0 0 0 0 0 0 0 0 0 0 0 0 0 0 0 0 0 0 0 0 0 0 0 0 0 0 0 0 0 0 0 0 0 0 0 0 0 0 0 0 0 0 0 0 0 0 0 0 0 0 0 0 0 0 0 0 0 0 0 0 0 0 0 0 0 0 0 0 0 0 0 0 0 0 0 0 0 0 0 0 0 0 0 0 0 0 0 0 0 0 0 0 0 0 0 0 0 0 0 0 0 0 0 0 0 0 0 0 0 0 0 0 0 0 0 0 0 0 0 0 0 0 0 0 0 0 0 0 0 0 0 0 0 0 0 0 0 0 0 0 0 0 0 0 0 0 0 0 0 0 0 0 0 0 0 0 0 SPP74 Bacteria;Firmicutes;Bacilli;Lactobacillales;Streptococcaceae;Streptococcus;multispecies_spp74_3 0 0 0 0 0 0 0 0 0 0 0 0 0 0 0 0 0 0 0 0 0 0 0 0 0 0 0 0 0 0 0 0 0 0 0 0 0 0 0 0 0 0 0 0 0 0 0 0 0 0 0 0 0 0 0 0 0 0 0 0 0 0 0 0 0 0 0 0 0 0 0 0 0 0 0 0 0 0 0 0 0 0 0 0 0 0 0 0 0 0 0 0 0 0 0 0 0 0 0 0 0 0 0 0 0 0 0 0 0 0 0 0 0 0 0 0 0 0 0 0 0 0 0 0 0 0 0 0 0 0 0 0 0 0 0 0 0 0 0 0 0 0 0 0 0 0 0 0 0 0 0 0 0 0 0 0 0 0 0 0 0 0 0 0 0 0 0 0 0 0 0 0 0 0 0 0 0 0 0 0 0 0 0 0 0 0 0 0 0 0 0 0 0 0 0 0 0 0 0 0 0 0 0 0 0 0 0 0 0 0 0 0 0 0 0 0 0 0 0 0 0 0 0 0 0 0 0 0 0 0 0 0 0 0 0 0 0 0 0 0 0 0 0 0 0 0 0 0 0 0 0 0 0 0 0 0 0 0 0 0 0 0 0 0 0 0 0 0 1 0 1 2 1 6 5 0 1 7 14 2 16 5 4 5 7 7 2 2 8 10 11 3 2 0 3 5 4 7 0 16 2 5 21 10 2 16 11 5 6 5 3 5 2 67 6 3 3 4 7 2 2 0 4 0 6 0 0 0 0 0 0 3 0 3 0 0 0 0 2 1 0 1 0 1 5 0 1 1 2 2 1 1 1 5 5 1 1 4 4 0 3 2 1 1 0 1 0 0 1 0 3 0 4 7 2 0 0 0 0 3 0 0 2 0 0 0 5 3 0 0 1 0 0 2 2 4 7 1 1 1 1 0 0 1 2 1 0 2 4 2 2 16 3 9 5 3 3 0 14 0 3 3 3 8 3 8 6 0 1 1 4 10 5 3 2 4 0 2 2 0 4 1 0 2 3 4 1 2 6 5 3 0 3 1 1 1 4 5 2 4 2 0 0 0 3 2 0 2 0 1 1 11 3 1 2 4 5 6 8 4 0 5 1 1 8 9 5 15 1 3 9 3 0 14 8 10 4 1 6 4 7 5 0 0 3 0 1 1 1 0 2 5 7 2 1 0 1 2 0 0 1 1 3 3 7 3 0 0 3 2 0 2 1 1 14 0 2 25 4 7 7 0 7 1 0 2 12 6 0 5 9 0 0 1 0 4 0 3 2 10 0 11 5 15 3 8 0 0 0 2 0 0 1 5 0 2 3 0 0 0 0 1 1 0 8 2 0 0 2 0 4 0 1 3 1 8 3 3 0 1 0 10 0 9 0 8 2 1 0 5 0 2 3 0 2 1 6 0 3 0 3 5 8 0 6 0 6 2 4 4 1 1 9 4 4 6 4 0 3 0 4 6 3 4 1 0 0 8 10 6 5 2 3 3 3 4 11 9 0 0 1 0 2 4 10 2 6 5 0 2 7 3 1 0 2 4 6 0 3 2 9 0 6 0 0 3 4 1 1 4 1 0 0 2 0 2 0 0 2 4 2 2 5 8 0 1 5 0 13 1 1 0 8 2 1 4 0 11 1 0 3 0 3 2 5 7 7 3 0 1 19 6 1 0 6 2 4 1 13 9 2 6 12 0 0 1 4 2 2 0 5 2 5 1 7 1 0 7 1 7 1 1 2 3 4 0 6 0 1 16 3 1 15 1 2 3 6 0 2 7 1 2 1 1 0 0 5 0 2 0 0 2 5 7 0 4 11 0 0 1 1 2 0 0 0 1 7 4 9 2 9 19 0 0 1 9 6 0 0 3 4 7 0 1 0 3 9 7 1 0 0 4 0 0 0 0 0 3 4 2 0 0 3 1 1 1 2 4 14 0 6 1 1 0 6 5 11 4 2 0 3 1 8 0 1 0 4 1 1 1 0 6 0 6 3 0 1 2 6 3 0 2 3 1 1 7 1 0 12 9 15 25 1 9 5 0 2 0 1 1 5 0 0 0 2 2 4 9 9 3 2 7 0 17 3 4 0 10 7 1 2 0 2 4 0 1 0 1 2 2 6 1 7 11 2 5 4 8 3 8 1 0 16 2 2 2 19 1 3 6 8 0 23 14 2 11 2 5 6 0 1 8 0 8 82 0 1 7 6 0 20 15 5 9 4 1 13 1 3 16 0 1 8 2 2 4 0 8 11 7 6 5 9 8 8 6 5 16 9 6 0 3 0 5 2 10 0 0 0 0 0 1 3 2 1 3 0 0 0 6 0 2 1 3 6 0 12 23 16 23 9 18 1 17 9 24 6 5 24 21 18 10 13 4 8 4 9 5 10 6 12 4 20 3 12 27 20 18 15 20 6 5 18 20 8 19 28 22 16 19 9 21 18 5 2 14 11 21 9 0 13 22 12 22 11 18 8 15 17 15 32 17 1 7 6 4 6 6 3 2 6 14 16 5 9 5 8 2 19 4 2 2 8 4 4 9 3 4 3 17 2 7 9 9 17 17 7 3 40 16 6 11 1 2 9 33 4 6 12 19 3 12 0 5 10 18 5 12 4 7 17 16 4 3 8 0 33 23 30 9 16 9 13 13 1 2 7 11 8 23 14 5 8 27 11 4 2 2 4 17 16 19 1 6 10 5 9 9 15 6 12 19 5 22 10 21 12 14 34 11 19 19 7 14 23 13 32 9 8 18 20 12 8 6 16 17 6 10 11 12 15 10 4 13 5 11 14 2 3 18 10 7 5 13 7 5 26 10 2 4 15 5 11 2 8 3 9 15 7 29 16 4 35 7 15 8 4 4 9 17 18 7 1 11 3 6 12 14 6 2 6 18 11 12 31 4 12 13 14 19 3 31 5 5 4 22 8 11 30 18 12 23 21 13 17 30 9 4 15 19 6 12 15 14 2 3 7 13 22 21 3 10 10 7 10 11 6 16 7 10 11 14 16 18 29 18 7 5 13 6 21 37 17 20 27 90 13 53 25 5 23 5 38 13 24 24 32 4 3 1 7 5 13 15 16 8 18 30 15 9 8 6 8 14 26 5 5 16 19 12 11 20 32 30 25 27 18 19 10 26 9 19 20 34 5 42 26 36 23 13 12 0 20 22 4 17 6 4 19 4 6 7 4 3 1 4 7 5 18 13 8 1 7 4 3 2 5 6 3 7 7 3 3 5 3 6 42 9 21 11 32 22 13 2 6 6 9 13 5 19 8 5 4 11 11 30 36 7 11 37 26 19 17 12 15 9 12 7 27 1 8 9 15 20 18 23 5 8 2 10 6 17 10 8 14 5 5 7 6 10 11 0 4 3 20 19 15 10 2 27 18 38 4 5 51 4 13 16 22 7 13 4 31 8 44 24 8 0 27 10 22 14 4 7 16 5 8 24 13 18 28 14 14 7 16 14 5 1 24 15 18 4 12 3 17 41 32 7 6 4 6 2 3 8 2 14 4 11 13 4 6 14 8 9 14 4 9 21 4 5 3 14 14 9 29 28 5 12 16 14 3 7 11 12 10 23 11 18 10 8 2 5 11 7 22 17 7 13 12 26 7 21 16 9 15 16 17 6 14 25 8 9 15 11 2 9 5 19 8 9 26 10 10 18 7 10 27 8 12 18 18 18 19 25 12 21 15 14 9 27 9 12 25 8 17 19 12 15 17 10 10 12 6 20 13 15 3 14 22 12 8 9 6 27 12 14 33 13 14 8 8 10 11 35 3 11 13 28 16 17 11 14 24 72 8 44 9 24 15 39 22 15 37 5 15 18 5 11 16 27 31 13 18 40 19 21 15 5 7 20 11 12 2 20 6 22 19 25 32 15 4 6 3 6 5 8 8 4 4 10 23 14 5 10 9 4 1 2 5 22 11 12 11 13 8 3 18 20 5 5 22 13 8 10 9 19 22 26 0 7 14 18 14 19 18 19 9 18 9 5 9 19 17 13 11 3 3 3 18 9 9 10 5 15 20 10 16 8 15 6 11 5 7 25 5 10 8 7 4 10 19 7 22 5 18 16 21 37 3 16 4 7 10 10 12 16 3 11 15 14 8 19 13 12 21 25 20 9 41 21 18 12 11 22 SPP76 Bacteria;Fusobacteria;Fusobacteriia;Fusobacteriales;Leptotrichiaceae;Leptotrichia;multispecies_spp76_2 0 0 0 0 0 0 0 0 0 0 0 0 0 0 0 0 0 0 0 0 0 0 0 0 0 0 0 0 0 0 0 0 0 0 0 0 0 0 0 0 0 0 0 0 0 0 0 0 0 0 0 0 0 0 0 0 0 0 0 0 0 0 0 0 0 0 0 0 0 0 0 0 0 0 0 0 0 0 0 0 0 0 0 0 0 0 0 0 0 0 0 0 0 0 0 0 0 0 0 0 0 0 0 0 0 0 0 0 0 0 0 0 0 0 0 0 0 0 0 0 0 0 0 0 0 0 0 0 0 0 0 0 0 0 0 0 0 0 0 0 0 0 0 0 0 0 0 0 0 0 0 0 0 0 0 0 0 0 0 0 0 0 0 0 0 0 0 0 0 0 0 0 0 0 0 0 0 0 0 0 0 0 0 0 0 0 0 0 0 0 0 0 0 0 0 0 0 0 0 0 0 0 0 0 0 0 0 0 0 0 0 0 0 0 0 0 0 0 0 0 0 0 0 0 0 0 0 0 0 0 0 0 0 0 0 0 0 0 0 0 0 0 0 0 0 0 0 0 0 0 0 0 0 0 0 0 0 0 0 0 0 0 0 0 0 0 0 0 0 51 9 0 4 1 2 0 8 8 2 0 75 11 7 3 3 11 2 0 135 23 34 221 0 0 83 18 1 111 0 24 2 43 16 3 0 0 17 0 5 0 1 0 0 0 0 0 0 1 2 2 0 0 0 0 1 0 0 0 0 0 0 3 0 0 1 0 0 0 7 0 0 9 0 0 1 0 0 1 0 0 0 3 0 1 0 135 0 21 32 0 0 3 0 6 0 0 0 1 98 0 0 0 2 0 0 2 0 0 0 0 0 0 0 0 0 0 0 0 0 4 1 0 0 23 86 1 4 295 2 67 0 0 0 1 0 1 0 0 6 48 0 7 0 2 1 0 5 0 12 0 1 19 0 8 0 7 16 0 0 0 0 14 0 9 1 4 7 0 0 0 1 1 9 0 45 0 0 0 2 2 15 1 0 0 0 0 0 0 1 12 1 0 0 0 0 10 0 8 4 30 0 10 1 1 148 0 0 0 5 2 46 3 0 2 4 3 180 10 0 2 16 0 7 167 352 0 0 0 0 5 3 0 0 0 83 0 0 46 0 8 2 1 0 0 0 0 0 11 0 0 0 8 0 0 7 5 0 0 0 3 0 39 0 630 0 0 13 2 0 9 0 2 1 0 5 0 7 4 0 1 13 9 0 2 1 0 0 66 0 11 0 8 0 23 12 5 0 0 0 1 1 0 6 9 41 4 207 59 0 0 8 2 0 6 4 0 2 0 0 0 2 0 0 0 0 8 0 0 0 0 0 3 1 9 0 0 0 0 0 76 19 0 0 0 2 0 5 0 0 0 0 0 0 0 0 4 16 0 0 2 3 0 0 3 6 10 13 0 0 0 6 0 0 17 6 0 0 6 0 2 0 0 1 0 0 2 7 0 630 5 18 0 27 4 2 0 3 0 0 0 0 1 0 4 7 0 0 0 0 0 0 2 15 0 0 0 0 72 0 4 28 0 0 3 0 2 0 0 0 0 0 217 0 10 0 0 10 0 0 4 0 0 4 4 0 15 5 0 0 1 0 1 2 653 0 2 0 1 0 0 16 0 0 3 62 2 2 0 11 2 0 40 26 0 12 0 0 18 1 0 0 0 537 0 2 2 8 0 0 3 0 48 0 0 0 0 11 3 0 22 46 1097 9 181 0 0 9 0 3 0 7 1 5 17 2 0 1 0 0 0 0 0 0 5 0 1 7 0 1 10 0 0 0 1 0 3 626 0 5 0 17 4 1 0 0 112 0 0 0 29 0 2 0 0 0 0 314 3 1 25 0 0 0 0 0 0 0 4 0 0 0 0 1 0 4 0 4 0 11 1 0 4 0 1 3 0 0 0 1 0 0 40 1 2 0 0 54 1 1 0 0 0 39 1 25 0 13 0 3 0 0 18 592 3 2 0 1 0 86 32 15 0 0 0 0 0 1 0 3 0 0 0 5 0 0 0 2 10 22 0 3 0 0 1 5 6 0 2 4 1 5 0 321 77 0 0 0 0 0 0 5 0 9 10 0 3 0 6 10 2 58 0 7 2 0 25 17 0 5 5 30 0 29 9 0 4 6 0 9 0 0 1 0 10 0 2 0 0 0 0 13 7 0 3 8 0 8 0 0 6 0 0 1 17 0 16 0 12 0 2 5 0 5 4 0 0 1 2 1 0 2 13 8 0 0 17 0 0 0 0 0 0 0 4 0 0 0 0 0 0 0 2 3 6 2 0 0 1 52 0 12 1 5 2 0 0 0 0 4 0 10 5 0 1 109 0 0 0 0 0 1 13 0 0 1 0 1 0 0 2 0 0 0 0 0 6 0 0 1 0 2 4 0 0 13 69 52 1 0 0 0 0 21 0 3 11 15 0 0 0 4 24 0 0 0 0 0 0 0 1 3 0 6 47 0 0 18 1 0 0 16 0 0 0 0 0 0 0 49 4 67 0 6 1 51 0 1 2 0 48 45 0 0 673 40 0 0 25 0 3 10 0 0 2 43 0 0 22 36 0 5 0 14 0 0 0 0 0 2 0 0 0 0 0 0 0 0 0 1 19 0 0 12 0 27 0 7 0 0 0 0 2 0 0 2 0 0 46 0 2 1 0 11 103 19 0 1 0 0 0 4 0 1 1 0 0 0 5 29 0 2 1 0 0 0 0 0 37 19 0 0 1 1 0 2 4 0 0 2 3 0 54 9 0 0 0 0 0 1 0 6 1 2 74 0 0 0 48 11 0 0 0 0 11 2 0 0 0 0 42 72 0 0 0 0 0 0 2 0 1 0 0 0 158 0 0 0 4 0 3 0 0 0 14 0 0 14 0 0 0 2 3 0 9 3 1 9 8 0 0 1 0 0 2 0 0 13 0 12 30 74 0 0 0 1 0 0 387 1 0 1 0 0 0 0 3 0 0 0 0 2 0 17 2 29 0 0 0 8 2 19 0 22 18 0 3 0 0 0 2 1 7 0 107 4 1 1 0 0 35 0 0 15 0 2 0 0 70 53 0 0 1 0 0 7 1 2 2 2 0 0 0 0 0 9 0 0 0 25 27 0 0 0 0 16 1 6 9 0 9 3 0 0 0 0 1 0 0 0 1 0 0 0 0 3 1 0 4 0 0 0 1 0 0 1 0 0 0 186 0 2 9 0 0 0 0 0 1 0 0 3 2 9 2 11 0 0 0 2 0 0 14 0 2 2 0 0 0 2 152 15 1 0 2 0 0 0 3 0 0 0 2 0 1 0 1 0 0 0 1 0 49 1 2 0 160 30 0 0 42 0 0 1 4 0 0 0 19 35 3 0 9 5 0 290 4 0 1 0 0 16 0 0 1 0 0 0 0 19 1 0 0 7 1 0 16 0 0 0 15 0 0 442 3 0 7 15 0 1 0 13 1 4 0 0 0 0 0 62 17 0 1 0 29 0 0 0 0 3 3 1 9 0 0 12 13 0 1 5 0 0 41 0 9 0 0 0 21 6 0 0 0 0 1 2 0 4 30 1 0 0 10 0 19 16 0 1 3 0 0 5 1 0 5 0 1 0 93 6 0 5 5 0 0 5 56 0 0 32 0 3 0 0 3 5 0 0 0 0 0 1 4 0 3 6 0 0 2 1 0 0 0 41 0 1 0 0 57 0 0 0 30 1 0 176 245 0 3 11 0 0 0 13 0 21 282 0 104 10 0 1 0 0 0 0 20 0 10 3 5 0 0 0 1 0 0 8 0 16 66 0 0 1 0 0 4 0 3 0 0 39 16 0 15 12 0 2 5 0 0 1 0 0 0 2 1 0 2 0 9 8 9 0 0 1 0 2 12 0 1 0 5 112 29 0 3 3 0 4 1 58 1 2 1 0 0 0 0 0 0 0 11 14 0 4 17 325 0 2 15 0 0 0 3 0 0 0 0 0 4 2 0 3 3 9 0 5 3 0 2 3 0 0 1 1 0 0 0 0 0 6 0 0 1 50 0 10 4 0 0 3091 0 1 0 0 4 2 0 0 20 0 1 0 131 1 0 2 1 0 11 12 0 0 0 SPP79 Bacteria;Bacteroidetes;Flavobacteriia;Flavobacteriales;Flavobacteriaceae;Capnocytophaga;multispecies_spp79_2 0 0 0 0 0 0 0 0 0 0 0 0 0 0 0 0 0 0 0 0 0 0 0 0 0 0 0 0 0 0 0 0 0 0 0 0 0 0 0 0 0 0 0 0 0 0 0 0 0 0 0 0 0 0 0 0 0 0 0 0 0 0 0 0 0 0 0 0 0 0 0 0 0 0 0 0 0 0 0 0 0 0 0 0 0 0 0 0 0 0 0 0 0 0 0 0 0 0 0 0 0 0 0 0 0 0 0 0 0 0 0 0 0 0 0 0 0 0 0 0 0 0 0 0 0 0 0 0 0 0 0 0 0 0 0 0 0 0 0 0 0 0 0 0 0 0 0 0 0 0 0 0 0 0 0 0 0 0 0 0 0 0 0 0 0 0 0 0 0 0 0 0 0 0 0 0 0 0 0 0 0 0 0 0 0 0 0 0 0 0 0 0 0 0 0 0 0 0 0 0 0 0 0 0 0 0 0 0 0 0 0 0 0 0 0 0 0 0 0 0 0 0 0 0 0 0 0 0 0 0 0 0 0 0 0 0 0 0 0 0 0 0 0 0 0 0 0 0 0 0 0 0 0 0 0 0 0 0 0 0 0 0 0 0 0 0 0 0 0 3 0 0 0 0 0 0 0 0 0 0 3 1 0 8 0 2 0 0 0 0 8 6 0 0 1 7 1 0 0 1 0 0 0 0 0 2 0 0 0 0 0 0 0 0 0 0 0 697 92 0 0 0 0 0 0 0 0 0 0 0 1 0 0 0 0 0 0 0 0 0 0 0 0 0 0 0 0 0 0 0 0 0 0 0 0 0 0 0 0 0 0 0 0 0 0 0 0 0 0 0 0 0 0 0 0 0 0 0 0 0 0 0 0 0 0 0 0 0 0 0 0 0 0 0 0 0 0 0 0 0 0 0 0 0 0 1 0 0 0 0 1 1 0 1 1 0 0 0 1 0 0 0 0 0 0 0 0 0 0 0 0 0 0 0 0 0 0 0 0 0 0 0 0 0 0 4 0 0 0 0 0 0 0 0 0 0 0 0 0 2 1 0 0 0 0 0 0 0 0 0 0 0 0 0 2 0 0 0 0 0 0 0 0 0 0 0 0 0 0 0 0 0 0 1 0 0 0 0 0 0 0 0 0 0 3 0 0 0 0 0 0 0 0 0 0 0 0 0 0 0 0 0 0 0 0 1 0 0 0 0 0 0 0 0 0 0 0 0 0 0 0 0 0 0 0 0 0 0 0 0 0 0 0 0 0 0 0 0 0 0 0 0 0 0 0 0 0 0 0 0 0 0 0 15 0 0 0 0 0 0 0 0 0 0 2 0 0 0 0 0 0 0 0 0 0 0 0 0 0 0 0 0 0 8 0 0 0 0 0 0 0 0 0 0 0 0 0 0 7 1 2 0 0 0 0 0 0 0 0 0 0 21 0 0 0 0 0 0 0 0 1 0 0 0 1 0 0 0 1 1 0 0 1 0 0 0 0 0 1 0 0 0 0 0 0 0 0 0 0 0 0 0 0 0 0 0 0 0 0 0 0 0 0 0 0 0 0 0 0 0 200 0 0 0 0 0 0 0 0 0 0 0 0 0 0 0 0 0 0 0 0 0 0 0 0 0 1 0 0 0 0 1 0 0 37 0 0 2 1 0 0 0 1 0 0 0 1 0 0 0 0 0 0 0 0 0 0 0 0 0 0 6 0 1 0 0 0 0 0 0 2 1 0 1 0 0 3 186 197 0 0 0 0 0 0 0 0 1 0 0 0 0 0 0 0 0 0 0 0 0 0 0 0 0 0 0 0 0 0 0 0 0 0 3050 0 0 0 0 0 0 0 0 0 0 0 0 1 0 0 0 1 0 0 0 0 0 0 0 0 0 0 0 0 0 0 0 0 0 0 0 0 0 0 0 47 0 1 0 0 0 0 0 0 0 0 0 0 3 0 0 0 0 0 0 0 0 2 0 0 0 6 41 0 3 0 0 0 0 0 0 0 0 0 0 0 0 0 0 0 0 0 0 0 0 4 0 0 0 0 0 0 0 0 0 20 0 0 0 0 0 0 0 0 0 0 2 0 0 0 0 0 1 0 4 0 0 0 0 0 0 0 0 1 0 0 0 0 0 0 1 0 0 412 0 0 0 0 0 39 0 15 0 0 0 0 0 1 0 0 0 0 0 0 0 0 0 0 0 0 0 1 0 0 0 0 0 0 0 0 0 0 0 0 0 0 0 0 1 0 0 0 0 0 0 0 0 0 0 0 0 0 0 0 0 0 0 0 0 0 0 0 0 0 0 0 0 0 0 0 0 0 0 0 0 0 0 2 0 0 0 0 0 0 0 1 0 4 0 0 0 0 0 0 0 0 0 0 0 0 0 0 0 0 0 0 0 0 0 0 0 0 0 0 0 0 0 0 0 0 0 16 0 0 0 0 0 0 0 0 0 0 0 0 0 0 0 0 0 0 0 0 0 0 0 0 0 0 0 0 0 0 0 0 0 0 0 0 0 0 0 0 0 0 0 0 0 0 0 0 66 0 0 0 0 0 0 1 0 0 0 0 0 0 0 0 0 0 0 0 0 0 0 0 0 0 0 0 89 40 0 0 0 0 0 0 0 0 0 0 0 0 0 0 0 0 0 0 0 0 0 0 0 0 0 0 0 0 0 0 0 0 0 0 0 0 0 0 0 0 0 0 0 1 0 0 0 1 0 0 5 1 0 0 0 0 0 0 0 0 0 0 1 0 0 0 0 0 0 0 0 0 0 0 0 0 0 0 0 0 0 0 0 0 0 55 0 0 2 3 0 0 0 0 1 0 0 0 0 3 0 0 0 0 0 0 0 0 0 0 0 0 0 0 0 0 0 0 0 0 0 0 0 1 0 0 0 0 0 0 3 0 0 0 0 0 0 1 0 0 0 0 1 0 1 0 0 0 0 0 0 0 0 0 0 0 0 0 1 0 0 0 0 0 0 0 0 0 0 0 0 0 0 0 0 0 0 0 1 0 2 0 0 0 0 1 1 0 0 0 0 0 0 0 0 0 1 0 0 0 0 0 0 0 2 33 0 0 0 0 0 0 0 0 0 0 1 0 0 0 0 0 1 1 0 2 0 0 162 1 0 0 0 0 0 0 0 0 0 0 1 0 0 6 0 0 0 0 0 0 0 0 0 0 0 0 0 1 0 0 0 0 0 0 0 1 0 0 0 0 0 0 0 0 0 1 0 0 0 0 0 0 0 0 0 0 0 0 0 0 0 0 0 0 0 0 0 0 0 0 0 0 0 0 0 0 0 0 0 0 1 0 0 0 0 0 0 0 0 0 0 0 0 0 0 0 2 0 0 0 0 0 0 0 0 0 0 0 0 0 1 0 0 0 0 0 0 0 0 0 0 0 135 0 19 155 0 0 0 0 1 0 0 0 0 0 0 0 0 0 0 0 0 0 0 0 0 0 0 0 0 0 0 1 0 0 0 0 0 0 0 22 0 1 0 0 0 0 0 5 0 0 0 0 0 0 0 0 0 0 0 0 0 0 0 0 0 0 0 1 0 0 0 0 0 0 0 0 0 0 0 0 0 0 0 0 0 2 0 0 0 426 8 0 0 0 0 34 10 0 0 0 0 0 0 0 0 0 82 112 12 0 0 0 0 0 0 0 0 0 0 0 0 0 0 0 0 0 0 0 0 0 0 0 0 0 0 0 0 0 0 0 0 1 0 1 0 0 0 0 0 0 0 620 0 0 0 0 0 0 0 0 0 0 0 0 0 0 0 0 0 0 0 0 0 0 0 0 0 0 0 1 1 0 0 0 0 0 0 0 0 0 0 0 0 0 0 0 0 0 0 0 0 0 1 0 0 0 0 0 0 0 0 0 0 0 0 0 0 0 0 0 0 0 0 0 0 4 0 0 0 0 0 0 0 0 0 0 0 0 0 0 0 1 0 0 0 0 0 0 0 0 0 0 0 1 0 0 0 1 0 0 0 0 0 0 0 0 0 0 0 0 0 0 0 0 0 0 0 0 0 0 0 0 0 0 0 0 1 0 165 107 0 0 0 0 0 0 0 0 0 9 0 0 0 0 0 0 1 0 1 0 0 0 0 0 0 0 0 0 0 0 0 0 0 SPP83 Bacteria;Firmicutes;Bacilli;Lactobacillales;Streptococcaceae;Streptococcus;multispecies_spp83_6 0 0 0 0 0 0 0 0 0 0 0 0 0 0 0 0 0 0 0 0 0 0 0 0 0 0 0 0 0 0 0 0 0 0 0 0 0 0 0 0 0 0 0 0 0 0 0 0 0 0 0 0 0 0 0 0 0 0 0 0 0 0 0 0 0 0 0 0 0 0 0 0 0 0 0 0 0 0 0 0 0 0 0 0 0 0 0 0 0 0 0 0 0 0 0 0 0 0 0 0 0 0 0 0 0 0 0 0 0 0 0 0 0 0 0 0 0 0 0 0 0 0 0 0 0 0 0 0 0 0 0 0 0 0 0 0 0 0 0 0 0 0 0 0 0 0 0 0 0 0 0 0 0 0 0 0 0 0 0 0 0 0 0 0 0 0 0 0 0 0 0 0 0 0 0 0 0 0 0 0 0 0 0 0 0 0 0 0 0 0 0 0 0 0 0 0 0 0 0 0 0 0 0 0 0 0 0 0 0 0 0 0 0 0 0 0 0 0 0 0 0 0 0 0 0 0 0 0 0 0 0 0 0 0 0 0 0 0 0 0 0 0 0 0 0 0 0 0 0 0 0 0 0 0 0 0 0 0 0 0 0 0 0 0 0 0 0 0 0 0 0 20 0 0 2 1 0 1 1 4 2 0 2 5 1 0 5 7 1 2 0 0 0 0 0 1 0 2 0 2 1 6 2 1 1 4 4 2 1 0 0 0 1 2 1 0 1 1 0 1 1 0 0 0 0 0 0 0 0 0 0 0 0 1 0 0 0 0 0 0 0 0 0 0 2 0 9 2 6 0 0 0 0 1 1 1 0 1 2 0 0 0 24 20 0 0 0 1 1 0 0 0 0 0 1 0 2 2 0 0 0 0 0 0 0 1 0 0 0 0 1 0 0 0 0 0 0 0 1 0 0 1 0 0 0 1 0 0 1 0 0 2 2 0 0 2 0 0 2 0 0 9 6 0 22 0 4 0 0 1 0 1 0 1 1 0 1 2 0 0 0 4 0 0 1 1 0 0 1 0 0 1 0 0 3 0 0 1 2 0 0 0 4 0 0 0 0 0 0 0 2 1 4 0 1 5 3 11 0 1 0 3 46 5 0 0 2 2 0 0 0 1 0 0 0 0 1 0 13 0 2 0 0 0 0 0 1 0 0 0 0 0 2 1 4 0 1 0 0 0 3 1 4 0 1 1 0 0 0 0 0 4 0 0 0 0 1 0 0 5 5 2 1 3 0 0 2 1 0 0 3 0 0 0 0 1 0 0 2 0 0 0 1 1 1 2 0 0 0 2 4 0 3 0 0 0 0 0 0 0 0 0 0 0 2 1 0 0 2 0 4 0 0 0 0 0 0 0 0 0 0 1 0 1 0 0 0 1 5 1 0 0 0 0 0 0 3 0 0 0 0 0 1 0 0 0 0 1 0 1 0 0 1 0 0 3 0 4 0 0 2 0 0 1 0 0 0 1 0 3 0 8 0 0 0 2 0 0 0 3 3 1 0 4 1 0 5 1 0 0 2 2 0 4 1 0 2 0 0 4 8 0 0 1 9 0 0 0 0 0 0 5 1 0 0 1 0 0 18 0 0 0 1 0 0 0 0 0 0 0 4 3 1 0 391 3 0 1 0 4 0 0 7 2 0 14 1 0 0 1 0 0 16 2 0 2 3 0 1 3 0 2 0 1 1 0 0 0 1 0 0 0 0 0 0 1 0 4 0 2 0 1 0 2 0 0 1 0 3 1 5 0 0 0 4 2 0 0 1 3 1 0 0 1 0 2 0 0 0 1 0 1 1 2 2 0 1 0 15 0 1 0 0 0 0 0 0 0 0 2 1 1 0 0 1 4 1 0 0 2 10 3 1 2 0 0 5 6 1 0 0 0 1 0 0 3 0 2 0 0 0 1 0 0 1 0 0 0 1 0 1 0 0 1 0 2 24 2 0 0 0 0 0 0 0 1 2 0 0 0 0 2 0 0 0 0 0 4 1 27 0 1 1 0 1 2 0 0 1 0 0 0 57 1 0 0 0 0 1 1 2 1 0 0 1 0 0 0 0 0 0 2 0 0 0 0 0 2 1 1 0 0 1 1 0 1 1 0 0 1 1 0 0 0 9 0 3 1 0 1 0 0 1 2 11 2 1 0 0 0 1 1 1 2 1 1 1 17 13 0 1 0 0 0 0 0 0 1 3 1 4 0 49 3 0 0 0 1 0 2 0 1 2 1 1 1 0 0 1 0 0 6 0 0 4 1 0 1 2 5 0 0 0 2 0 0 0 1 0 0 0 0 2 2 2 3 0 1 10 7 1 1 1 1 0 1 25 17 3 327 36 37 36 19 67 22 18 24 16 80 31 28 58 46 18 35 34 75 37 154 333 13 269 76 122 146 79 12 358 20 1 8 34 41 31 50 59 31 3 0 91 105 110 15 3 198 2 30 56 0 67 17 0 52 10 108 2 3 31 41 633 25 48 138 101 47 4 0 25 0 10 56 0 15 9 1 5 1 71 12 13 17 0 49 9 72 173 52 86 23 16 192 5 132 1 123 18 14 24 68 141 5 33 15 54 152 56 49 324 21 161 24 0 26 8 299 39 5 2 7 2 1 138 208 94 34 28 4 26 62 161 26 8 86 47 3 2 176 4 5 7 157 44 555 103 13 210 2 12 286 68 27 8 110 3 9 91 73 228 102 50 110 95 15 73 10 6 5 151 36 19 210 110 40 9 26 177 83 65 11 35 38 7 22 14 9 32 101 34 5 157 28 20 150 111 31 39 39 46 14 39 53 55 36 66 20 107 15 10 94 20 19 3 82 2 2 20 8 13 144 13 9 1 12 61 10 30 23 13 18 3 40 95 7 1 9 20 49 8 125 3 132 9 6 7 1 18 7 70 17 22 12 3 6 2 146 73 49 144 0 39 34 496 40 16 160 6 1 459 105 9 55 35 13 2 38 16 8 387 38 1 13 51 25 356 295 9 16 0 2 243 187 1 1 1171 117 54 15 2 185 237 7 5 90 1 8 28 59 4 4 208 41 15 160 125 69 106 18 195 16 8 19 2 10 97 77 76 34 176 6 16 213 12 656 110 6 52 83 104 110 2 74 7 20 11 15 247 4 111 133 15 373 186 91 1 11 75 82 4 27 0 39 245 111 64 6 58 44 3 142 34 158 144 6 82 241 23 29 0 27 106 28 0 0 3 0 35 6 7 24 87 22 22 3 22 59 278 188 17 48 2 0 357 99 127 75 0 68 5 20 11 67 41 106 272 0 36 115 164 23 9 39 237 9 31 131 34 44 31 1 33 14 1 15 1 16 0 98 26 20 6 19 18 65 85 39 3 24 9 4 16 13 28 17 8 37 2 96 54 107 224 110 4 33 4 3 0 102 7 1 21 39 5 242 52 33 26 7 14 26 42 158 199 177 260 94 41 47 319 83 6 174 54 39 58 103 62 256 217 25 12 443 70 38 34 18 0 4 344 158 12 1 11 28 105 19 232 162 15 4 212 8 11 0 142 19 26 86 53 194 76 0 84 4 15 17 74 72 2 92 26 35 61 42 55 20 151 5 34 252 36 556 14 14 2 128 137 80 24 320 9 9 177 1 299 59 53 15 5 0 38 15 0 11 12 1 2 29 8 129 57 47 8 70 7 20 68 49 11 1 15 59 104 54 23 103 43 4 23 32 19 103 177 16 26 53 79 41 3 133 74 27 29 89 24 32 453 85 243 278 14 27 14 8 2 18 15 66 53 1 32 148 28 61 186 19 19 11 81 201 207 16 355 0 1 983 313 33 10 1 21 5 41 2 7 5 207 4 85 18 22 89 37 25 102 58 182 233 2 75 43 1 90 14 33 55 41 44 72 89 24 139 46 109 99 45 5 15 15 1 11 152 2 15 12 241 69 17 224 65 54 2 38 0 169 6 13 176 83 126 114 10 10 16 0 331 9 62 0 8 96 146 62 426 53 24 95 6 38 9 4 333 39 4 2 37 1 6 134 1 49 48 39 14 19 49 17 3 49 46 2 107 7 7 66 87 16 2 66 35 10 149 212 96 20 9 114 21 955 59 0 94 194 37 36 162 33 3 128 9 3 25 61 116 502 19 40 73 161 22 58 11 8 8 SPP84 Bacteria;Firmicutes;Bacilli;Lactobacillales;Streptococcaceae;Streptococcus;multispecies_spp84_3 0 0 0 0 0 0 0 0 0 0 0 0 0 0 0 0 0 0 0 0 0 0 0 0 0 0 0 0 0 0 0 0 0 0 0 0 0 0 0 0 0 0 0 0 0 0 0 0 0 0 0 0 0 0 0 0 0 0 0 0 0 0 0 0 0 0 0 0 0 0 0 0 0 0 0 0 0 0 0 0 0 0 0 0 0 0 0 0 0 0 0 0 0 0 0 0 0 0 0 0 0 0 0 0 0 0 0 0 0 0 0 0 0 0 0 0 0 0 0 0 0 0 0 0 0 0 0 0 0 0 0 0 0 0 0 0 0 0 0 0 0 0 0 0 0 0 0 0 0 0 0 0 0 0 0 0 0 0 0 0 0 0 0 0 0 0 0 0 0 0 0 0 0 0 0 0 0 0 0 0 0 0 0 0 0 0 0 0 0 0 0 0 0 0 0 0 0 0 0 0 0 0 0 0 0 0 0 0 0 0 0 0 0 0 0 0 0 0 0 0 0 0 0 0 0 0 0 0 0 0 0 0 0 0 0 0 0 0 0 0 0 0 0 0 0 0 0 0 0 0 0 0 0 0 0 0 0 0 0 0 0 0 0 0 0 0 0 0 1 1 0 206 5 2 6 24 10 1 5 61 10 5 34 32 6 4 28 39 4 2 1 12 4 1 5 8 6 12 0 7 4 40 3 9 6 26 9 12 14 2 0 3 4 1 7 2 0 3 16 21 4 0 0 2 7 21 14 0 3 0 12 6 11 4 0 2 1 35 0 1 6 0 0 15 1 8 72 48 190 11 2 4 0 12 35 7 11 10 18 0 0 0 160 120 4 1 0 42 5 0 0 6 0 0 17 17 32 14 9 3 0 0 0 2 50 28 0 0 0 0 21 0 0 1 11 0 2 1 11 6 4 2 0 5 10 13 0 1 3 2 7 5 11 3 5 40 3 1 6 0 1 107 63 11 100 0 24 2 12 0 3 2 1 9 4 20 1 42 5 29 2 41 7 6 5 2 3 1 1 2 1 9 2 0 155 1 1 16 24 5 3 0 153 8 2 5 7 1 0 1 8 8 28 17 9 29 4 107 11 9 6 36 1313 98 5 4 4 4 4 10 3 2 2 1 3 2 16 5 47 5 7 4 4 4 5 0 17 0 60 6 0 0 6 20 36 4 5 0 1 7 15 3 7 3 2 6 0 0 1 6 1 18 4 7 1 0 2 2 2 53 28 11 12 106 5 7 1 5 0 10 2 2 4 1 26 3 9 0 6 2 2 10 18 2 19 31 4 3 0 5 25 0 50 24 1 0 4 0 0 0 25 7 2 11 8 1 2 5 5 19 96 47 2 0 0 0 24 0 1 3 0 2 78 7 1 1 1 20 26 5 1 2 14 1 0 13 19 4 4 2 4 0 1 5 3 52 0 6 1 1 21 1 8 0 4 4 4 62 24 8 34 3 0 7 0 5 0 5 0 24 3 21 0 9 2 5 3 14 4 28 57 0 23 27 2 0 65 2 3 6 7 18 0 5 11 4 0 0 9 75 21 13 0 12 55 1 0 6 6 3 0 136 7 3 5 3 68 4 164 1 16 5 13 3 3 1 3 4 8 5 117 84 2 0 9334 17 0 10 6 31 3 1 41 6 6 99 1 5 8 9 18 7 265 50 31 16 40 2 1 3 2 23 12 13 6 3 3 7 18 1 1 0 21 1 5 3 10 9 2 5 13 2 0 2 1 4 2 9 52 5 40 0 4 4 27 5 9 1 4 25 20 0 3 20 21 73 1 1 2 8 161 4 5 7 9 0 2 0 143 6 4 1 16 0 1 4 1 2 2 3 13 1 10 8 6 0 2 5 3 11 107 6 6 84 2 1 41 16 6 0 69 1 4 1 16 14 2 3 0 2 0 44 18 9 52 40 43 0 13 38 7 17 68 68 2 18 223 2 4 0 5 0 0 1 11 39 7 0 0 0 3 22 2 0 8 0 0 39 4 226 55 135 12 3 9 8 3 3 10 1 10 3 920 3 4 12 20 0 4 6 12 42 10 1 16 5 15 1 0 1 0 5 1 1 20 2 0 14 16 8 9 1 5 0 4 19 59 1 1 10 7 5 8 7 275 1 16 2 7 6 11 4 9 10 51 7 14 10 7 4 5 2 7 24 6 27 12 54 48 9 22 1 20 2 6 2 5 3 10 20 29 13 964 29 15 3 1 4 2 2 6 6 6 6 9 1 0 2 4 12 4 30 1 0 24 13 2 10 3 97 79 7 15 3 2 1 3 0 79 0 4 0 66 10 37 25 12 0 130 70 15 4 8 0 0 0 148 52 40 1012 117 108 147 73 276 93 68 75 36 131 81 57 199 388 90 164 106 564 46 689 1574 64 1197 1242 547 486 177 67 1516 49 6 41 67 139 121 273 116 63 3 0 308 190 307 69 17 526 2 57 186 0 147 99 0 132 44 359 14 6 52 61 1291 61 281 880 1403 165 42 7 184 1 44 222 10 115 67 6 25 0 203 21 83 66 12 365 22 183 1766 463 996 58 67 786 71 620 2 792 57 238 48 200 1180 12 479 53 128 400 955 164 3159 86 1762 47 11 113 25 990 117 15 1 25 9 7 505 3905 1024 418 112 10 60 216 670 111 14 246 906 19 14 1200 11 5 22 1149 206 1808 257 81 1378 6 61 1143 146 151 62 408 20 40 424 226 437 347 166 281 513 11 194 31 2 20 262 151 45 408 242 164 17 55 365 522 197 37 142 194 14 83 42 25 55 606 86 1 422 209 302 536 492 181 129 286 175 49 151 182 281 107 461 89 280 35 73 316 53 45 11 416 9 2 32 20 43 540 35 39 2 46 232 41 196 72 31 71 11 142 726 16 21 26 49 112 10 747 17 321 15 19 23 2 57 41 184 50 66 24 13 15 5 290 278 219 305 1 78 81 1135 111 24 314 8 6 1179 351 37 278 102 21 21 188 123 41 1065 96 13 15 157 92 1614 2361 28 55 1 12 1614 943 0 8 4829 356 253 183 1 1473 563 8 5 328 5 3 67 110 5 20 626 219 22 436 300 179 296 46 921 314 50 100 1 28 205 174 225 93 482 19 119 921 47 2880 326 48 383 236 245 260 21 320 48 64 46 17 699 12 343 706 18 1663 456 279 10 34 103 216 6 102 1 312 502 313 335 36 317 142 9 1165 457 1074 2763 29 1380 1989 90 149 12 40 758 121 3 0 36 3 229 32 9 128 304 195 159 20 106 431 612 1092 76 191 5 1 1315 1078 469 300 2 233 10 109 41 264 161 594 1731 3 90 1819 463 73 22 105 546 36 177 833 144 233 152 7 103 56 2 47 0 17 2 666 635 64 36 59 37 150 320 86 7 112 12 30 48 32 72 63 16 138 3 414 797 755 1222 227 61 98 19 12 1 560 22 6 72 303 8 617 162 203 77 374 61 111 211 1520 1615 1181 1586 349 107 107 1580 238 8 419 168 148 141 282 243 4701 443 97 33 2287 379 261 121 59 2 15 2378 866 38 2 58 62 447 50 1171 507 77 14 868 32 25 0 456 75 51 179 137 1091 413 10 178 10 28 28 331 280 10 215 188 168 159 101 146 64 387 7 98 2513 164 2785 37 37 8 335 1134 325 40 790 19 23 402 8 1081 180 179 68 28 0 162 63 2 34 29 1 9 67 25 435 138 127 12 168 13 32 105 115 37 1 47 240 228 142 137 232 77 16 85 92 29 242 301 68 93 211 169 109 3 242 130 47 129 175 89 68 1621 275 599 733 51 39 39 15 43 30 39 143 130 3 93 481 43 105 995 75 66 22 334 530 458 36 1265 0 3 2350 1288 48 14 2 63 13 117 8 7 4 836 27 188 78 84 314 70 149 415 255 1042 1047 12 179 92 5 477 31 144 166 93 102 236 318 177 837 386 697 1000 220 21 90 72 6 61 721 3 45 73 1618 1293 510 2448 181 129 18 113 0 742 19 37 370 662 982 392 17 60 29 2 1100 16 175 304 35 411 535 102 1526 382 85 393 25 83 34 14 1905 83 17 22 195 16 29 301 0 120 86 108 33 36 130 58 10 84 135 5 223 16 14 217 154 54 39 248 70 80 345 598 477 62 13 205 49 2549 108 2 387 310 77 124 463 220 22 697 30 11 55 145 320 1439 21 56 118 367 42 154 58 20 17 SPP85 Bacteria;Bacteroidetes;Bacteroidia;Bacteroidales;Prevotellaceae;Prevotella;multispecies_spp85_2 0 0 0 0 0 0 0 0 0 0 0 0 0 0 0 0 0 0 0 0 0 0 0 0 0 0 0 0 0 0 0 0 0 0 0 0 0 0 0 0 0 0 0 0 0 0 0 0 0 0 0 0 0 0 0 0 0 0 0 0 0 0 0 0 0 0 0 0 0 0 0 0 0 0 0 0 0 0 0 0 0 0 0 0 0 0 0 0 0 0 0 0 0 0 0 0 0 0 0 0 0 0 0 0 0 0 0 0 0 0 0 0 0 0 0 0 0 0 0 0 0 0 0 0 0 0 0 0 0 0 0 0 0 0 0 0 0 0 0 0 0 0 0 0 0 0 0 0 0 0 0 0 0 0 0 0 0 0 0 0 0 0 0 0 0 0 0 0 0 0 0 0 0 0 0 0 0 0 0 0 0 0 0 0 0 0 0 0 0 0 0 0 0 0 0 0 0 0 0 0 0 0 0 0 0 0 0 0 0 0 0 0 0 0 0 0 0 0 0 0 0 0 0 0 0 0 0 0 0 0 0 0 0 0 0 0 0 0 0 0 0 0 0 0 0 0 0 0 0 0 0 0 0 0 0 0 0 0 0 0 0 0 0 0 0 0 0 0 0 0 0 0 0 0 0 0 0 0 0 2 0 0 67 1 0 0 0 1 1 0 0 0 0 0 3 0 0 0 0 0 1 0 1 0 1 0 0 0 0 0 0 0 0 0 0 0 0 0 0 0 0 0 7 0 1 0 0 0 0 0 0 0 0 0 0 0 0 0 0 0 0 1 0 1 0 0 2 0 0 0 0 0 0 0 0 0 0 0 0 0 0 0 0 0 0 0 0 0 0 0 0 0 6 0 0 0 0 10 0 1 0 0 0 0 0 2 0 0 0 0 0 0 0 0 0 0 0 0 0 0 0 0 0 0 0 0 0 0 1 1 0 0 0 0 0 0 0 0 0 0 0 0 0 1 3 0 0 0 1 1 1 1 0 0 0 0 0 3 0 0 0 0 0 0 0 0 0 25 0 1 0 0 0 0 0 1 0 0 0 1 0 0 0 0 0 0 10 0 0 0 1 0 0 0 0 0 0 0 0 0 0 0 2 4 13 41 1 0 0 0 11 0 3 34 3 0 0 0 0 0 1 0 0 0 1 0 0 0 0 0 0 0 0 5 1 0 1 0 0 0 0 3 0 0 0 0 0 0 0 0 0 3 1 0 0 0 0 0 0 2 0 0 0 1 0 0 0 20 0 0 0 0 0 0 0 0 0 0 0 1 0 2 0 0 4 0 0 0 0 0 2 0 0 0 0 0 0 0 0 0 0 0 0 0 0 0 0 0 0 0 0 0 0 0 0 0 1 0 0 0 0 13 0 1 0 0 0 0 0 0 0 0 0 0 0 0 0 0 1 0 4 0 0 0 0 0 0 1 0 0 0 0 0 0 0 1 0 0 0 0 0 0 0 3 0 0 0 0 0 17 1 0 0 0 3 4 0 0 0 1 0 0 1 7 0 0 0 0 0 0 0 0 0 0 0 0 0 0 0 0 7 0 0 0 0 0 0 0 0 0 0 0 0 0 1 0 0 0 37 0 0 0 0 1 0 0 0 0 9 0 0 0 0 0 0 0 0 0 0 0 0 0 0 0 0 3 0 1 0 0 0 0 0 1 0 0 0 0 0 0 0 0 1 0 0 0 0 0 0 0 0 0 6 0 0 0 0 2 0 0 0 0 3 0 0 0 0 0 0 21 0 0 0 0 0 0 0 0 0 0 0 0 0 1 0 0 0 0 0 0 0 0 0 0 0 0 0 0 1 0 0 0 0 0 0 0 0 0 0 0 0 0 0 0 0 1 0 0 0 0 4 0 0 0 0 0 0 0 0 0 0 0 0 0 0 0 0 0 0 0 0 0 0 0 0 0 0 0 0 0 0 1 0 0 0 0 1 0 0 0 0 0 0 0 0 0 0 0 2 0 0 0 0 0 4 0 0 2 0 3 0 2 0 0 0 1 0 0 1 0 3 0 49 0 0 1 0 0 1 0 0 0 0 0 0 0 0 0 0 1 0 0 0 0 0 0 0 0 0 0 0 0 0 0 0 0 0 1 0 0 0 0 0 0 0 0 0 1 0 0 0 0 0 0 0 0 0 6 0 0 0 0 2 0 0 0 0 0 0 0 0 0 1 0 0 0 0 0 0 0 0 0 0 2 1 0 0 4 0 0 2 0 0 0 0 1 0 7 0 0 0 0 0 11 0 1 0 0 0 0 0 0 1 0 0 3 0 0 0 0 0 0 0 0 0 0 0 0 0 0 0 0 0 0 0 0 1 0 0 30 5 18 10 5 11 69 3 0 1 1 2 0 5 1 0 0 0 6 0 1 3 1 8 6 29 12 4 12 0 0 0 0 24 0 0 191 12 2 8 0 15 1 2 0 0 6 0 0 0 0 49 1 0 0 1 17 0 0 0 0 2 1 2 0 1 0 3 0 112 2 0 6 0 0 4 0 0 0 0 0 0 0 0 0 0 0 17 1 0 5 0 0 1 0 0 2 0 3 0 0 0 39 5 0 0 0 19 8 209 0 188 0 0 1 0 8 3 2 0 0 3 0 0 220 518 15 0 0 1 6 37 0 0 0 0 0 0 3 2 0 1 0 0 1 0 0 2 0 0 0 0 4 0 0 2 0 0 0 55 0 0 0 11 0 5 127 1 0 0 0 0 54 0 0 2 2 0 17 6 130 0 1 3 0 6 18 2 7 0 0 19 0 16 33 2 1 247 2 0 0 12 1 0 5 13 21 14 0 1 11 1 9 1 1 2 0 3 1 0 10 0 2 6 27 0 0 9 0 30 2 5 0 0 0 1 4 1 0 13 2 0 2 0 12 2 0 1 0 0 0 0 0 0 0 0 33 41 2 23 0 3 2 18 4 2 11 7 0 0 6 0 8 1 1 0 0 22 3 57 0 1 0 0 21 2 34 0 0 0 0 0 13 0 0 0 3 3 3 0 9 4 0 0 0 0 1 0 0 1 0 3 0 0 2 6 0 0 0 0 0 0 0 0 0 2 0 9 0 0 0 0 0 0 0 22 8 293 3 14 1 0 1 1 8 2 1 0 13 0 0 0 57 1 1 0 0 4 0 0 1 3 0 0 1 0 50 3 1 0 1 16 38 5 0 1 6 10 0 0 0 70 0 0 0 13 0 0 0 0 0 1 0 1 0 0 0 0 10 0 0 2 1 2 544 0 9 1 0 0 13 17 19 2 66 9 0 0 61 84 0 0 7 0 0 2 0 0 33 15 0 0 0 0 0 264 0 0 0 3 5 0 0 0 2 0 0 0 0 0 2 2 0 1 0 37 0 0 3 13 0 0 2 0 5 0 0 0 1 0 0 0 5 0 2 0 1 0 0 0 4 7 1 0 0 13 1 1 0 0 3 0 9 0 4 0 0 7 3 0 0 0 0 0 3 0 0 0 0 10 1 0 0 2 0 6 3 192 2 0 1 0 1 1 0 2 0 0 0 1 6 4 0 2 0 1 3 9 1 0 0 0 0 0 0 0 0 15 0 5 3 1 5 1 22 19 1 0 8 1 0 1 0 1 1 0 57 0 1 0 206 2 1 5 0 0 0 0 1 1 0 8 0 7 198 0 32 3 11 5 0 3 0 14 2 2 0 1 0 0 0 0 1 1 4 11 5 7 0 0 0 138 0 3 3 1 1 27 1 51 0 8 3 1 0 0 0 0 0 0 0 0 59 4 1 2 0 0 0 1 1 7 0 22 0 1 23 0 7 2 31 0 0 0 0 1 0 19 1 0 1 11 0 0 0 0 0 7 22 0 2 0 0 3 0 0 0 10 1 0 0 8 0 2 5 36 5 0 2 0 0 0 20 0 0 2 0 0 0 3 348 0 5 0 0 115 0 2 3 0 14 0 3 0 4 0 11 0 0 0 0 1 0 0 3 2 5 3 0 2 0 2 0 2 5 2 1 0 0 0 0 13 0 1 0 57 3 5 1 0 16 177 0 2 4 0 0 2 0 0 0 0 1 135 12 0 0 0 1 4 0 3 2 0 12 3 4 4 0 11 0 0 0 43 0 0 1 0 0 0 0 1 0 0 5 SPP86 Bacteria;Bacteroidetes;Bacteroidia;Bacteroidales;Prevotellaceae;Prevotella;multispecies_spp86_4 0 0 0 0 0 0 0 0 0 0 0 0 0 0 0 0 0 0 0 0 0 0 0 0 0 0 0 0 0 0 0 0 0 0 0 0 0 0 0 0 0 0 0 0 0 0 0 0 0 0 0 0 0 0 0 0 0 0 0 0 0 0 0 0 0 0 0 0 0 0 0 0 0 0 0 0 0 0 0 0 0 0 0 0 0 0 0 0 0 0 0 0 0 0 0 0 0 0 0 0 0 0 0 0 0 0 0 0 0 0 0 0 0 0 0 0 0 0 0 0 0 0 0 0 0 0 0 0 0 0 0 0 0 0 0 0 0 0 0 0 0 0 0 0 0 0 0 0 0 0 0 0 0 0 0 0 0 0 0 0 0 0 0 0 0 0 0 0 0 0 0 0 0 0 0 0 0 0 0 0 0 0 0 0 0 0 0 0 0 0 0 0 0 0 0 0 0 0 0 0 0 0 0 0 0 0 0 0 0 0 0 0 0 0 0 0 0 0 0 0 0 0 0 0 0 0 0 0 0 0 0 0 0 0 0 0 0 0 0 0 0 0 0 0 0 0 0 0 0 0 0 0 0 0 0 0 0 0 0 0 0 0 0 0 0 0 0 0 0 0 0 0 8 0 0 37 0 3 0 0 0 0 144 2 0 0 0 0 1 0 0 0 0 0 0 0 0 1 0 0 0 3 10 0 0 0 1 0 0 0 0 0 7 0 0 0 0 0 0 0 0 0 2 0 0 0 0 0 0 0 0 0 0 0 0 0 0 0 0 2 0 23 0 0 0 0 0 0 0 0 0 0 5 0 0 0 2 0 0 0 0 0 0 0 0 9 0 0 0 0 0 0 7 0 0 4 0 14 0 0 0 0 0 0 0 0 0 0 0 0 0 0 0 0 0 0 1 0 0 0 0 0 0 0 0 0 0 0 18 1 0 0 0 0 0 0 0 0 2 1 0 1 3 2 0 0 0 0 11 0 0 0 0 0 0 0 0 0 3 0 0 0 0 0 0 3 0 2 0 47 1 0 1 0 0 0 0 0 0 0 0 23 0 0 1 0 0 0 52 0 0 0 0 0 0 0 2 2 2 0 0 0 4 2 8 4 0 0 27 0 9 0 0 7 0 0 0 0 0 0 2 0 0 0 0 0 0 0 0 0 0 0 0 0 396 0 0 0 0 0 0 0 0 0 0 0 0 1 2 0 0 0 2 2 0 0 0 0 0 30 24 0 0 0 0 0 0 6 0 0 0 0 11 0 0 0 0 1 0 0 0 1 2 14 4 1 0 0 0 0 0 0 0 0 0 0 0 0 0 0 0 0 0 0 0 0 0 0 0 0 0 0 0 0 3 1 2 4 0 0 0 0 38 0 0 9 0 0 0 2 27 0 0 0 0 0 0 0 0 0 1 0 0 0 0 0 17 20 0 0 0 0 0 0 0 4 5 0 0 0 0 0 18 1 0 0 0 0 0 1 0 0 16 0 33 35 5 0 8 0 1 0 0 5 0 0 1 0 0 0 0 0 0 0 0 0 0 0 0 0 36 0 0 0 4 0 0 0 0 0 0 0 0 0 27 0 0 0 1 0 0 0 0 1 0 0 0 0 0 0 7 0 1 0 0 0 0 0 0 0 0 0 0 0 0 0 0 0 0 0 0 6 0 0 1 0 1 0 0 1 1 0 0 0 0 0 0 0 0 0 7 0 0 0 0 0 0 20 0 0 0 0 46 0 0 0 0 0 0 8 1 0 0 0 0 0 0 0 0 0 0 0 0 0 0 0 0 0 0 0 0 0 0 0 0 0 0 0 0 0 0 0 0 0 0 0 0 0 0 0 0 1 0 0 0 53 0 0 0 53 0 0 0 0 0 0 0 0 0 0 0 0 2 0 0 0 0 1 0 0 1 0 0 0 0 0 0 0 0 2 0 0 0 0 0 0 0 0 0 0 0 0 0 4 0 0 15 0 38 0 0 0 0 0 1 0 0 0 0 155 0 35 0 15 0 0 1 0 0 0 0 0 1 0 1 132 0 0 0 1 0 0 0 0 0 0 0 0 1 16 0 0 0 11 0 0 0 0 0 0 0 0 0 61 0 0 0 0 0 1 0 0 0 0 4 0 31 11 0 1 0 0 0 0 0 0 0 234 0 0 0 0 0 0 0 0 0 0 0 0 0 0 0 0 0 0 0 0 0 0 0 0 0 7 27 0 0 2 4 0 0 0 1 0 0 0 0 49 2 0 0 0 0 0 0 0 1 0 0 0 0 0 34 0 0 1 0 0 0 0 0 0 0 3 0 0 73 0 0 5 0 0 0 0 0 0 0 0 0 24 1 4 19 1 4 9 0 0 0 0 0 0 3 0 0 7 4 2 0 13 0 0 1 12 2 5 0 2 0 0 0 0 3 2 0 22 3 0 0 0 3 1 0 2 0 0 0 0 10 0 749 0 1 0 0 15 0 0 0 3 0 1 0 0 0 0 0 0 2 0 1 10 0 0 0 0 6 4 0 0 0 0 0 0 0 0 5 1 0 1 0 1 0 0 0 0 0 1 0 0 0 26 1 0 2 0 9 11 20 0 26 0 0 0 6 3 7 1 0 1 0 0 0 37 116 1 0 0 0 0 6 0 5 21 0 0 86 20 16 18 38 0 0 1 0 0 0 0 3 1 2 1 1 0 0 0 0 0 8 0 1 0 3 0 1 135 0 0 23 0 0 0 0 5 35 0 1 1 0 176 6 0 30 1 2 405 4 1 2 0 2 8 8 2 4 0 21 0 3 0 0 3 3 11 2 9 0 0 1 0 18 1 0 0 0 0 1 0 0 6 0 0 1 0 0 6 2 0 3 0 0 1 0 0 2 1 0 1 2 1 2 1 0 0 5 0 0 0 0 0 0 0 0 1 0 3 4 27 9 0 1 0 6 1 1 3 2 1 0 3 0 10 2 1 20 2 1 0 9 0 13 0 2 16 1 8 0 0 0 1 2 22 0 8 0 0 0 74 0 7 2 0 0 0 1 0 0 0 0 1 25 0 8 2 2 0 2 0 0 0 0 0 0 0 0 0 2 0 0 1 1 0 0 5 11 2 177 0 1 0 0 2 28 69 0 1 0 0 0 0 0 15 13 0 0 0 1 4 0 2 0 0 6 1 0 17 1 0 0 2 5 4 1 0 1 0 1 0 0 0 9 0 0 0 31 0 4 1 0 0 0 1 2 0 0 0 1 14 1 0 0 0 2 84 1 2 9 10 3 3 34 16 37 9 2 0 0 8 24 1 0 3 0 0 69 2 0 5 4 0 0 2 0 0 27 1 11 3 1 2 0 0 0 5 0 1 0 0 0 0 2 0 0 6 5 0 0 0 1 1 0 1 0 4 1 0 4 21 0 8 0 4 0 1 0 1 0 0 0 0 24 75 1 0 1 0 3 0 3 0 0 2 1 0 1 0 31 2 0 3 0 0 0 2 0 0 0 0 6 0 0 0 2 1 0 0 38 11 0 0 1 2 4 1 148 0 0 1 0 0 0 0 48 0 0 36 14 0 0 0 0 0 0 0 0 0 1 0 0 15 0 1 0 45 352 9 0 0 0 0 0 0 1 0 0 271 2 0 0 35 0 0 297 4 0 0 1 0 0 0 3 1 20 25 0 2 15 0 3 0 1 6 3 2 1 0 1 0 0 0 0 0 2 8 2 0 90 8 2 0 3 0 18 4 1 1 12 0 10 0 1 0 0 0 0 0 0 0 0 0 1 17 0 1 6 0 0 1 3 12 1 2 7 0 3 8 0 14 1 2 0 0 9 0 2 0 3 0 0 4 271 1 0 0 1 5 26 3 0 3 1 0 103 2 0 0 2 2 0 0 4 0 0 0 0 0 0 0 0 0 2 4 1 0 0 0 1 0 2 41 1 27 0 0 98 9 0 3 4 32 0 47 0 0 0 1 0 0 0 0 98 0 0 2 0 0 1 0 0 3 23 0 0 0 14 3 0 1 0 0 2 0 0 0 245 4 0 0 0 1 4 1 2 0 4 18 2 0 4 0 0 1 197 10 32 0 1 5 0 0 1 5 0 3 7 13 1 0 9 8 0 2 233 0 1 0 1 1 0 0 33 0 0 0 SPP87 Bacteria;Bacteroidetes;Flavobacteriia;Flavobacteriales;Flavobacteriaceae;Capnocytophaga;multispecies_spp87_2 0 0 0 0 0 0 0 0 0 0 0 0 0 0 0 0 0 0 0 0 0 0 0 0 0 0 0 0 0 0 0 0 0 0 0 0 0 0 0 0 0 0 0 0 0 0 0 0 0 0 0 0 0 0 0 0 0 0 0 0 0 0 0 0 0 0 0 0 0 0 0 0 0 0 0 0 0 0 0 0 0 0 0 0 0 0 0 0 0 0 0 0 0 0 0 0 0 0 0 0 0 0 0 0 0 0 0 0 0 0 0 0 0 0 0 0 0 0 0 0 0 0 0 0 0 0 0 0 0 0 0 0 0 0 0 0 0 0 0 0 0 0 0 0 0 0 0 0 0 0 0 0 0 0 0 0 0 0 0 0 0 0 0 0 0 0 0 0 0 0 0 0 0 0 0 0 0 0 0 0 0 0 0 0 0 0 0 0 0 0 0 0 0 0 0 0 0 0 0 0 0 0 0 0 0 0 0 0 0 0 0 0 0 0 0 0 0 0 0 0 0 0 0 0 0 0 0 0 0 0 0 0 0 0 0 0 0 0 0 0 0 0 0 0 0 0 0 0 0 0 0 0 0 0 0 0 0 0 0 0 0 0 0 0 0 0 0 0 0 4 2 0 0 1 24 0 33 37 19 0 3 8 0 96 6 0 0 0 0 57 30 0 1 0 0 6 15 1 0 2 1 0 46 12 2 1 54 0 5 0 0 0 8 0 0 0 0 14 1 0 0 10 0 0 0 2 2 0 0 0 0 4 0 0 0 0 0 0 0 0 0 0 0 0 0 0 0 0 0 0 0 0 0 117 0 0 0 112 0 0 0 10 0 0 0 0 0 0 0 0 0 0 0 4 0 0 0 0 0 22 0 0 15 10 0 1 0 0 1 0 0 0 0 11 0 30 22 0 0 0 0 0 0 0 827 0 0 4 2 0 0 39 0 1 0 0 7 0 413 0 3 3 221 231 0 107 46 0 0 0 0 0 53 2 0 0 27 0 0 0 140 0 1 1 0 5 0 0 201 260 1 9 15 0 79 4 0 0 0 31 0 0 0 0 0 0 0 107 0 0 0 64 0 8 1 0 0 7 0 24 80 1 0 0 49 29 4 0 0 5 10 0 9 8 8 0 1 43 0 8 4 0 0 0 7 0 1 0 1 0 7 0 0 0 0 0 0 0 0 0 0 3 0 0 0 0 0 5 0 0 0 40 0 0 17 0 2 0 0 3 0 73 52 0 0 0 27 52 0 2 1 2 0 0 1 0 0 0 0 6 0 16 0 25 1 0 0 0 0 1 0 0 0 0 0 0 0 0 0 0 0 14 14 0 2 4 143 0 0 0 2 0 9 0 0 19 0 26 0 0 0 0 0 111 0 0 0 0 4 0 0 21 0 0 4 4 50 0 0 0 0 0 8 0 1 0 0 0 0 4 0 0 0 0 0 9 9 0 6 3 0 4 22 0 0 0 0 16 1 0 13 0 0 0 0 21 3 3 0 4 63 0 152 48 0 0 3 0 5 30 0 0 0 36 0 5 4 0 22 0 0 0 29 1 0 5 45 0 1 23 8 0 0 17 0 12 0 0 0 3 67 0 0 27 0 1 108 0 0 0 0 0 85 19 0 0 0 0 2 3 0 0 14 0 0 0 5 0 3 2 83 47 0 5 0 15 2 11 55 116 0 133 19 0 0 0 0 5 33 0 19 0 20 0 52 309 6 21 0 2 4 42 4 0 0 0 17 116 0 23 17 0 15 9 0 0 27 0 46 63 0 0 0 4 2 0 14 0 0 0 2 19 0 15 0 0 19 0 0 1 0 0 0 0 0 0 19 0 207 0 0 0 0 0 9 1 0 0 0 0 0 2 0 0 0 0 0 4 0 0 0 0 0 0 0 0 0 3 2 1 0 0 117 0 0 30 0 2 18 0 0 91 6 0 7 0 0 0 0 0 0 0 0 0 0 0 0 0 1 0 48 0 0 1 214 0 57 0 44 0 60 6 0 2 0 0 1 2 32 0 8 0 0 0 0 0 0 0 68 0 30 0 254 0 1 0 0 27 0 0 0 9 0 0 0 0 0 14 0 0 2 0 0 50 0 1 0 78 294 0 0 0 2 19 0 11 2 17 464 31 24 0 16 0 0 3 15 0 12 0 48 0 47 21 0 54 0 0 14 0 2 0 0 5 0 0 0 33 119 0 0 7 0 17 0 0 255 17 20 37 1 0 32 31 0 23 0 43 0 3 12 0 8 18 0 8 0 0 39 0 0 8 9 0 0 2 0 0 0 0 0 3 0 0 315 0 0 0 1 0 0 1 8 5 22 0 3 5 0 0 0 0 0 16 3 0 16 0 18 0 7 1 0 22 0 0 0 6 0 0 14 14 0 0 2 0 52 2 0 0 2 15 0 0 9 3 0 0 0 1 0 0 0 0 1 50 0 0 9 0 0 0 0 0 2 52 0 0 2 4 0 11 4 0 0 0 0 0 0 0 0 0 25 0 0 7 0 0 0 0 0 0 0 0 0 0 0 0 0 6 0 0 0 1 1 0 0 0 0 13 0 0 3 5 0 0 0 6 0 19 0 0 0 0 0 0 0 70 11 0 16 0 0 3 3 0 3 0 1 0 0 0 0 0 2 0 0 0 0 3 0 2 0 0 1 0 0 0 1 0 0 17 7 0 52 23 0 0 0 5 20 0 13 0 0 0 8 6 0 9 8 0 4 24 0 0 0 15 1 0 6 1 0 8 1 0 0 0 1 0 0 7 2 0 0 35 0 0 3 10 0 1 12 0 66 10 0 0 0 0 0 6 10 0 0 0 0 0 13 0 0 0 0 1 0 0 2 28 0 1 3 0 0 16 59 0 5 17 0 3 0 0 0 2 18 0 57 257 0 13 9 0 0 1 0 0 120 0 0 0 2 0 0 0 0 0 7 0 0 0 0 0 0 338 0 1 54 0 0 0 0 0 0 0 4 0 0 0 0 0 10 0 0 14 0 0 0 0 0 0 0 0 0 6 5 105 2 0 99 8 1 0 121 6 0 28 0 0 0 0 0 0 0 0 4 0 9 1 0 45 0 0 8 0 8 0 0 0 6 0 3 0 0 0 160 5 0 0 5 0 0 1 0 0 0 0 0 0 15 10 0 0 0 0 0 56 6 7 0 0 2 0 1 17 3 0 0 0 0 0 0 0 19 0 0 0 0 0 0 0 0 0 0 1 3 0 0 0 0 0 0 0 0 0 0 1 0 0 0 0 35 8 0 5 30 0 0 2 9 0 1 21 0 42 2 0 3 16 320 0 1 3 32 0 0 14 18 0 0 4 0 18 0 13 0 5 0 0 0 0 0 4 29 0 0 0 0 0 2 0 0 0 25 0 0 1 0 0 3 0 0 21 386 0 0 15 2 0 0 61 27 0 0 2 0 0 19 1 0 10 14 0 39 16 0 0 0 0 0 18 1 0 1 1 0 4 147 0 1 0 5 8 9 0 3 0 0 0 0 1 0 0 0 1 0 2 31 0 6 2 25 1 0 0 23 5 0 0 127 0 0 0 0 0 5 0 0 16 0 0 1 0 0 1 3 0 89 8 2 0 4 17 0 0 45 0 1 4 0 0 7 0 0 0 0 0 0 4 15 0 33 0 0 3 3 2 0 0 11 0 4 3 0 1 8 0 0 9 2 0 0 1 0 12 12 0 0 22 71 0 0 0 1 0 0 14 0 0 11 0 0 0 0 0 0 0 0 0 0 0 0 1 0 0 3 6 0 17 2 0 0 5 0 0 0 0 0 0 0 0 0 0 0 0 0 0 4 0 1 0 0 9 0 0 24 4 0 11 2 0 7 0 0 0 1 0 0 0 0 0 1 6 0 0 0 0 67 0 0 7 53 2 0 0 0 0 38 1 6 0 0 7 14 0 0 11 5 0 49 2 0 4 0 6 0 0 0 0 0 0 0 0 0 0 294 0 0 13 2 6 0 0 0 67 18 1 8 3 0 27 43 0 45 1 31 0 2 1 0 33 3 0 0 1 0 0 0 1 0 6 6 0 0 0 1 0 0 0 0 0 0 0 0 1 0 0 5 0 0 1 4 0 0 1 23 0 12 0 0 1 0 0 0 1 SPP90 Bacteria;Bacteroidetes;Flavobacteriia;Flavobacteriales;Flavobacteriaceae;Capnocytophaga;multispecies_spp90_3 0 0 0 0 0 0 0 0 0 0 0 0 0 0 0 0 0 0 0 0 0 0 0 0 0 0 0 0 0 0 0 0 0 0 0 0 0 0 0 0 0 0 0 0 0 0 0 0 0 0 0 0 0 0 0 0 0 0 0 0 0 0 0 0 0 0 0 0 0 0 0 0 0 0 0 0 0 0 0 0 0 0 0 0 0 0 0 0 0 0 0 0 0 0 0 0 0 0 0 0 0 0 0 0 0 0 0 0 0 0 0 0 0 0 0 0 0 0 0 0 0 0 0 0 0 0 0 0 0 0 0 0 0 0 0 0 0 0 0 0 0 0 0 0 0 0 0 0 0 0 0 0 0 0 0 0 0 0 0 0 0 0 0 0 0 0 0 0 0 0 0 0 0 0 0 0 0 0 0 0 0 0 0 0 0 0 0 0 0 0 0 0 0 0 0 0 0 0 0 0 0 0 0 0 0 0 0 0 0 0 0 0 0 0 0 0 0 0 0 0 0 0 0 0 0 0 0 0 0 0 0 0 0 0 0 0 0 0 0 0 0 0 0 0 0 0 0 0 0 0 0 0 0 0 0 0 0 0 0 0 0 0 0 0 0 0 0 0 0 2 1 0 2 1 2 0 60 0 43 2 9 17 0 59 6 0 0 0 0 1 0 0 9 0 9 0 1 2 0 11 4 0 38 21 2 0 9 0 3 0 0 0 0 0 3 28 0 4 2 0 0 0 0 0 0 0 4 0 0 0 0 0 0 0 0 0 0 0 0 0 0 0 0 1 0 0 0 0 0 0 5 6 0 10 2 0 0 0 0 0 0 0 0 5 0 1 0 29 3 0 2 0 8 10 0 111 0 0 0 0 0 0 3 1 0 1 0 19 0 0 0 0 0 8 0 32 0 0 2 5 0 0 0 0 2 0 0 4 0 0 0 80 0 2 0 0 0 0 69 0 6 4 17 4 0 1 9 0 0 0 0 3 0 1 0 0 28 0 0 0 79 0 0 0 0 5 0 0 3 1 0 65 39 0 0 6 2 24 0 74 15 0 0 3 0 5 0 206 0 0 0 11 1 0 0 0 5 3 0 1 3 4 0 8 36 14 5 2 0 5 15 0 4 4 0 0 6 12 0 0 0 0 0 0 0 0 0 0 0 0 2 1 0 0 0 0 0 2 0 0 0 1 0 0 0 0 0 9 0 3 0 5 27 2 0 0 0 2 0 0 0 0 0 0 8 0 36 23 0 0 27 14 0 0 0 0 0 0 0 14 0 11 0 8 11 10 0 0 0 15 136 0 0 4 0 0 26 0 1 0 0 29 2 0 0 0 10 0 0 2 0 0 31 0 0 30 0 11 0 0 0 2 0 3 0 0 0 0 0 5 0 40 57 0 0 0 13 0 0 0 0 0 0 0 4 86 0 0 0 7 0 75 2 0 0 2 0 0 21 62 0 2 0 8 22 0 0 4 1 0 32 0 0 0 0 11 11 0 0 3 0 0 0 136 0 0 9 0 0 0 0 61 0 46 0 6 4 0 0 0 0 19 16 0 0 11 46 0 0 1 1 0 0 16 0 2 0 0 0 0 0 0 7 0 0 0 0 0 0 24 8 0 36 40 0 0 0 1 0 9 0 0 3 0 0 1 14 10 1 0 4 28 0 14 0 17 1 42 53 1 1 5 9 0 0 0 0 17 25 0 7 0 3 0 1 1 4 5 0 27 0 50 0 0 0 0 1 16 0 71 19 1 18 2 0 1 0 0 41 35 0 0 0 5 26 0 5 0 0 0 1 2 0 1 0 0 0 0 0 0 0 0 0 0 0 0 1 0 0 0 1 0 0 0 0 0 0 2 21 0 0 0 0 0 0 0 0 2 8 0 0 59 0 0 0 14 0 6 1 0 0 0 0 0 2 0 0 0 26 0 0 6 0 0 23 0 0 0 1 0 1 0 6 0 23 1 0 14 42 0 62 1 0 19 1 0 0 0 1 0 1 0 0 24 1 0 0 2 46 0 1 0 0 0 0 0 0 0 12 0 1 0 3 0 0 0 0 1 1 0 0 0 0 0 3 0 0 5 53 0 5 0 0 50 0 10 0 2 0 0 16 0 7 5 0 1 3 3 0 17 14 0 10 1 0 13 15 0 13 0 1 0 30 76 0 1 2 0 5 0 0 1 0 9 0 2 0 3 10 0 51 0 0 0 2 0 34 12 32 2 0 0 0 2 0 5 0 0 0 42 15 0 4 16 0 1 1 0 0 0 0 0 0 0 0 5 0 0 0 0 0 0 0 0 1 0 0 0 0 0 0 1 0 4 0 0 1 0 0 0 0 5 0 3 1 0 0 1 2 0 2 0 0 7 0 0 0 0 0 0 0 1 0 0 6 0 7 5 0 0 2 0 0 0 5 0 0 0 0 0 1 1 0 0 2 0 25 0 3 0 0 0 0 0 5 0 0 0 0 0 0 3 0 0 0 0 0 0 0 0 0 0 14 0 0 0 0 0 0 0 0 0 7 5 0 5 0 0 0 12 0 0 5 0 6 0 0 0 0 0 0 0 10 1 0 0 0 0 0 2 0 0 0 6 0 0 0 3 0 0 0 0 0 1 0 0 0 0 3 0 0 0 0 0 0 0 0 0 0 21 0 1 10 0 1 0 0 0 0 0 0 2 0 0 1 0 0 7 0 0 4 0 16 0 2 0 5 5 0 0 0 0 0 4 0 0 0 31 4 0 9 8 0 10 0 0 0 0 1 0 0 0 0 0 3 14 0 0 0 5 0 1 6 0 26 0 0 0 0 0 0 0 0 0 1 1 0 0 0 0 0 0 0 0 0 0 0 12 0 0 0 0 0 3 1 0 2 1 0 2 0 0 0 2 0 0 0 0 0 5 0 0 0 0 0 0 72 0 0 0 24 15 0 24 0 0 1 0 0 0 0 1 0 19 0 1 10 1 0 1 0 0 0 1 1 0 0 0 0 0 1 1 2 1 0 2 1 0 0 62 0 0 60 2 0 23 0 0 45 3 2 0 0 0 0 60 10 0 0 2 0 0 0 0 0 0 2 0 0 4 0 0 1 0 0 1 0 0 0 0 8 18 0 0 11 0 0 38 2 0 1 0 0 0 0 0 0 0 0 2 0 0 2 0 0 19 1 0 0 0 1 0 0 25 0 0 0 0 0 0 0 0 0 0 40 4 0 10 0 0 20 11 0 0 1 0 0 0 1 0 3 6 0 0 0 5 0 1 0 0 6 2 0 2 0 0 0 0 14 0 18 14 0 47 1 0 3 3 27 0 0 3 0 6 0 0 0 0 0 0 0 46 0 0 0 6 1 0 0 3 0 4 4 0 0 0 0 0 1 12 0 0 29 0 0 0 1 0 1 2 0 4 0 0 29 98 1 0 0 42 2 0 0 0 0 1 0 0 0 2 0 0 1 0 0 16 1 0 0 12 0 0 3 0 0 4 2 0 1 0 5 1 2 0 0 0 0 0 0 0 0 11 0 1 0 2 1 0 0 0 1 1 0 0 6 2 0 0 43 0 0 0 0 1 1 0 6 42 3 0 0 1 0 0 0 0 11 4 2 0 6 8 0 0 2 0 1 0 0 0 0 4 0 0 0 0 0 2 2 0 6 0 0 0 2 0 0 0 1 0 1 0 0 0 5 0 0 4 1 0 0 0 0 0 3 0 0 16 13 0 0 0 2 0 0 1 0 0 0 0 0 0 0 0 0 0 0 7 0 0 4 0 0 0 43 3 0 16 7 0 1 4 0 1 0 0 0 4 0 0 2 0 0 2 0 0 0 0 0 0 0 1 4 0 0 0 0 0 0 0 1 0 0 1 0 0 0 0 0 0 0 0 0 0 0 0 26 8 0 2 2 0 0 0 0 0 4 0 0 0 0 57 59 0 0 0 0 0 4 0 0 0 0 0 0 0 0 0 0 0 0 0 0 0 6 37 0 0 1 0 2 0 0 3 3 14 0 0 0 0 0 0 0 0 2 0 11 1 0 1 1 0 1 0 0 0 15 4 0 2 5 0 0 0 0 0 0 0 0 0 3 0 0 4 0 0 0 0 0 0 2 0 0 0 0 0 0 0 0 0 0 0 0 0 SPP91 Bacteria;Proteobacteria;Gammaproteobacteria;Pasteurellales;Pasteurellaceae;Haemophilus;multispecies_spp91_5 0 0 0 0 0 0 0 0 0 0 0 0 0 0 0 0 0 0 0 0 0 0 0 0 0 0 0 0 0 0 0 0 0 0 0 0 0 0 0 0 0 0 0 0 0 0 0 0 0 0 0 0 0 0 0 0 0 0 0 0 0 0 0 0 0 0 0 0 0 0 0 0 0 0 0 0 0 0 0 0 0 0 0 0 0 0 0 0 0 0 0 0 0 0 0 0 0 0 0 0 0 0 0 0 0 0 0 0 0 0 0 0 0 0 0 0 0 0 0 0 0 0 0 0 0 0 0 0 0 0 0 0 0 0 0 0 0 0 0 0 0 0 0 0 0 0 0 0 0 0 0 0 0 0 0 0 0 0 0 0 0 0 0 0 0 0 0 0 0 0 0 0 0 0 0 0 0 0 0 0 0 0 0 0 0 0 0 0 0 0 0 0 0 0 0 0 0 0 0 0 0 0 0 0 0 0 0 0 0 0 0 0 0 0 0 0 0 0 0 0 0 0 0 0 0 0 0 0 0 0 0 0 0 0 0 0 0 0 0 0 0 0 0 0 0 0 0 0 0 0 0 0 0 0 0 0 0 0 0 0 0 0 0 0 0 0 0 0 0 6 30 324 6 0 24 119 40 10 48 98 8 4 1 9 60 20 116 31 2 516 30 5 67 44 10 19 11 9 0 47 13 17 21 8 64 120 41 1 12 1 0 92 9 42 20 9 15 15 17 3 35 8 1 0 12 0 27 0 13 7 6 10 38 70 6 23 21 22 1 2 33 10 1 2 24 5 61 3 8 4 13 13 4 24 78 28 32 13 19 1 0 6 61 5 13 17 1 11 6 0 49 161 20 24 95 21 21 14 39 28 9 0 8 1 9 75 167 14 1 28 18 0 0 2 28 6 5 4 15 66 11 5 10 33 0 2 0 18 25 0 26 14 5 5 6 77 14 0 4 0 28 12 14 1 430 20 29 27 35 16 1115 29 14 109 2 2 6 84 5 147 2 1 2 0 25 28 35 0 10 191 7 2 46 273 1 74 3 261 6 5 30 6 186 25 9 22 0 28 16 12 1 91 62 6 0 12 85 82 21 10 17 3 296 16 29 93 15 13 14 71 14 17 0 139 156 163 1 153 749 13 27 15 1 31 3 4 15 30 15 0 0 1 26 7 64 1 0 29 24 1 181 49 31 17 44 1 0 16 18 8 5 9 20 0 7 0 95 3 5 62 45 3 14 20 4 17 65 120 0 15 1 2 5 1 1 1 30 39 9 7 95 1 0 6 0 137 10 84 1 8 11 6 6 17 21 7 37 158 7 3 61 4 4 9 15 10 4 600 15 3 7 21 1 618 16 32 87 8 1 0 1 6 75 4 2 38 2 10 31 67 32 148 10 8 24 24 7 4 3 13 38 3 26 1 66 14 1 21 18 8 11 3 92 0 6 30 8 49 12 98 42 62 26 5 28 16 0 9 6 26 0 248 7 5 80 9 26 104 28 2 11 0 10 5 105 4 11 0 4 8 15 0 67 15 6 2 7 4 12 116 22 43 24 58 478 15 2 16 8 9 0 2133 40 20 16 4 31 16 2 147 102 8 3 26 76 61 4 8 2 36 206 0 8 6 11 0 10 1 6 5 21 0 6 3 1 76 21 21 3 12 0 3 5 22 14 34 10 2 2 32 59 2 131 26 11 20 9 43 6 4 92 1 34 7 2 4 5 75 135 25 29 34 29 8 4 1 79 34 20 54 30 23 27 7 0 6 241 14 54 62 5 12 7 14 10 2 14 9 6 137 129 9 11 2 14 8 16 1 0 23 1 24 27 10 302 83 43 19 6 18 26 1 3 12 4 55 3 9 19 43 5 4 1 1 7 0 4 15 47 3 67 8 3 0 9 34 4 6 12 2 4 19 130 14 3 12 11 17 19 5 5 68 41 8 22 2 225 9 7 3 4 0 7 10 14 116 11 40 49 49 9 675 201 35 23 7 7 41 31 47 9 7 16 2 14 17 5 8 174 28 16 1 225 36 4 0 5 9 3 10 9 24 0 4 1 4 36 27 38 63 13 23 0 83 4 4 0 2 160 34 3 0 36 15 11 0 5 6 135 24 90 32 1 14 0 17 67 26 0 5 47 0 76 19 17 32 39 58 15 15 12 44 10 217 64 40 14 16 19 86 85 85 43 7 1 4 20 1 9 304 4 11 0 8 62 28 53 26 1 46 17 0 7 2 28 9 1 3 1 35 34 34 24 14 2 3 12 433 3 1 7 2 11 27 8 3 0 3 48 1 2 4 0 2 178 275 22 0 36 2 2 110 17 5 35 4 184 277 160 499 2737 772 773 827 264 1549 4401 195 1574 77 598 3560 1676 478 126 1295 807 1614 714 525 1340 733 84 780 213 0 2938 1495 911 541 2383 775 7 69 239 83 5 1358 5739 1999 614 246 378 1928 391 60 524 966 659 2 609 874 387 10 1021 678 371 437 1761 606 24 260 180 589 63 209 82 93 455 188 388 120 260 59 104 533 413 270 508 152 222 96 568 83 537 43 293 498 19 642 44 161 168 7 487 70 186 251 399 1287 596 17 170 226 91 638 145 235 1131 348 5 2335 11 466 1041 36 524 776 2067 2321 301 3084 1721 72 217 1676 370 1499 807 104 220 2424 895 1873 223 4164 2501 585 1019 818 643 357 747 49 118 15 175 1415 27 174 341 117 53 1526 287 156 1052 1020 2728 523 263 2095 84 79 1476 1089 2885 1049 895 203 256 2659 424 308 758 103 2805 63 1785 1164 172 348 45 997 341 1237 420 519 583 3628 16 1156 153 715 445 70 855 298 2435 753 3219 458 147 805 85 178 190 618 666 272 410 7401 147 510 1618 2082 4244 2737 1856 2053 28 255 1567 908 312 294 664 32 1486 191 704 529 25 1219 1185 565 947 301 131 24 377 44 121 402 705 1368 192 880 41 75 976 381 2352 885 222 371 307 1527 232 2604 207 321 386 130 67 1066 1343 936 781 1586 650 1620 237 154 1689 1933 401 870 299 204 568 835 1182 3599 2695 832 3134 819 1598 90 548 116 60 1314 2733 70 464 485 1198 87 1052 1607 1496 1188 319 107 1496 112 301 2051 1926 1614 391 383 265 71 641 4228 13 8 10 210 2644 505 189 835 282 957 372 350 361 916 67 110 280 230 356 402 887 699 637 544 1611 1191 1088 2881 2087 284 239 11 2143 366 1114 1496 114 1454 3617 660 2531 1427 21 799 379 3084 509 412 27 181 405 95 317 334 111 102 75 424 80 11 213 258 20 279 226 29 26 701 294 121 706 171 682 74 749 261 162 143 534 60 189 602 50 18 200 97 991 3236 1796 166 482 458 335 85 2072 364 2256 4 214 34 646 1504 442 555 491 399 980 780 2201 168 1079 162 1249 520 250 2097 8 1673 785 196 48 401 357 505 327 90 107 160 1007 312 838 352 521 68 1609 656 0 404 1972 2 51 231 474 763 13 2829 480 1218 1309 987 98 2059 852 144 138 1044 722 63 88 30 3607 246 1133 529 4 256 712 2568 5476 447 101 300 497 1101 618 485 462 1516 788 0 384 393 2252 303 6 120 1674 649 50 18 206 208 92 70 126 443 2786 4098 293 164 197 1132 467 286 63 900 930 374 101 246 213 103 12 349 1586 322 328 591 534 1362 350 14 801 291 2909 2533 2203 3986 2766 352 442 9 833 304 495 1029 498 23 66 557 320 98 1063 717 2775 751 711 1643 209 347 4970 121 572 682 1004 1279 156 418 16 808 619 152 1058 1116 2574 389 882 253 3 79 760 1501 2041 356 1530 432 2811 2757 1817 52 188 42 2074 578 8 25 201 487 1769 613 902 2721 88 858 75 1009 167 420 15 1735 1045 906 1297 1381 1156 849 303 193 1472 167 186 174 115 1156 329 406 382 99 427 748 759 558 2019 586 334 2743 1 185 123 1332 1243 62 371 2278 521 116 565 941 179 445 260 1599 2040 1757 1842 786 200 125 92 492 565 297 1336 986 1930 362 78 184 341 1362 2852 1576 12 421 113 16 17 1199 273 253 138 39 204 108 816 529 1108 788 144 7 165 58 1152 65 112 86 68 1045 109 518 19 46 1021 1213 630 1965 2 217 394 442 22 4 182 62 816 250 17 164 391 385 243 865 1506 840 33 990 480 782 998 662 48 95 129 1732 509 1847 16 753 135 399 2600 725 250 515 1053 1184 1847 1070 1554 964 1372 539 221 3711 11 712 2515 1381 3304 883 6 4 26 382 3 400 330 310 521 85 122 776 33 2612 119 609 1172 124 1567 351 1090 1559 377 67 1886 3 SPP93 Bacteria;Bacteroidetes;Bacteroidia;Bacteroidales;Prevotellaceae;Prevotella;multispecies_spp93_2 0 0 0 0 0 0 0 0 0 0 0 0 0 0 0 0 0 0 0 0 0 0 0 0 0 0 0 0 0 0 0 0 0 0 0 0 0 0 0 0 0 0 0 0 0 0 0 0 0 0 0 0 0 0 0 0 0 0 0 0 0 0 0 0 0 0 0 0 0 0 0 0 0 0 0 0 0 0 0 0 0 0 0 0 0 0 0 0 0 0 0 0 0 0 0 0 0 0 0 0 0 0 0 0 0 0 0 0 0 0 0 0 0 0 0 0 0 0 0 0 0 0 0 0 0 0 0 0 0 0 0 0 0 0 0 0 0 0 0 0 0 0 0 0 0 0 0 0 0 0 0 0 0 0 0 0 0 0 0 0 0 0 0 0 0 0 0 0 0 0 0 0 0 0 0 0 0 0 0 0 0 0 0 0 0 0 0 0 0 0 0 0 0 0 0 0 0 0 0 0 0 0 0 0 0 0 0 0 0 0 0 0 0 0 0 0 0 0 0 0 0 0 0 0 0 0 0 0 0 0 0 0 0 0 0 0 0 0 0 0 0 0 0 0 0 0 0 0 0 0 0 0 0 0 0 0 0 0 0 0 0 0 0 0 0 0 0 0 0 0 0 0 0 0 0 0 0 0 0 0 3 18 340 0 0 0 5 0 4 1 1 1 0 0 1 4 0 0 0 1 0 185 6 28 5 1 0 0 0 0 0 0 3 1 4 0 0 0 0 0 0 0 26 0 0 0 0 0 0 0 0 4 0 0 0 0 0 0 0 0 1 0 0 0 0 0 0 0 0 0 0 0 0 0 0 0 0 0 0 0 0 0 0 0 0 0 0 2 0 0 0 0 6 0 0 0 0 7 0 2 0 0 0 0 0 1 0 0 0 0 0 0 0 0 0 1 0 0 0 0 2 0 0 0 0 0 0 0 0 0 0 0 1 0 0 0 0 0 126 0 0 9 48 4 1 0 0 0 0 2 0 0 0 0 0 0 8 2 0 1 2 0 0 0 0 1 0 4 3 0 2 0 2 0 7 0 0 3 0 0 0 0 0 0 0 0 3 0 0 0 1 0 0 0 0 0 0 1 0 0 0 0 135 11 0 5 0 0 0 1 0 0 0 1 0 1 0 0 0 0 6 0 0 0 0 0 0 0 0 0 1 0 0 0 0 0 2 1 0 0 0 1 0 0 1 0 0 0 0 0 0 0 0 0 0 0 2 0 0 3 0 0 1 45 0 0 0 21 0 3 2 0 0 0 0 0 0 0 0 0 0 22 1 12 87 7 0 0 0 0 2 0 0 0 0 0 0 0 0 0 0 1 0 0 0 0 0 0 0 0 1 0 0 0 0 0 0 0 0 0 0 43 0 0 0 0 0 0 0 0 0 0 0 0 0 0 0 0 1 0 0 0 1 0 0 0 0 0 0 0 0 0 0 0 0 0 113 0 0 0 0 0 0 4 0 0 0 0 0 0 0 0 0 2 0 3 0 1 0 0 0 0 0 3 0 1 8 0 1 0 0 8 0 1 0 0 0 0 0 0 4 0 7 0 0 0 0 0 0 0 1 0 1 0 0 0 0 0 1 0 0 0 0 0 0 1 1 0 0 0 0 0 0 0 0 0 0 0 0 2 0 0 0 0 0 9 0 0 0 0 0 18 0 6 0 0 0 0 0 1 0 2 9 1 0 0 0 0 0 0 1 0 0 0 0 0 0 0 0 0 0 0 1 0 0 0 0 0 0 1 0 0 0 0 6 0 1 0 1 2 0 0 0 1 0 0 0 0 0 0 18 0 0 0 0 0 0 0 1 0 0 0 0 0 0 0 0 0 1 0 0 0 0 0 0 0 0 0 0 0 0 0 0 0 0 0 19 1 0 0 0 0 0 0 1 0 0 0 0 0 0 0 0 0 0 0 0 0 2 0 0 2 1 0 0 1 1 0 0 0 0 0 0 1 2 0 0 0 0 0 0 6 0 0 2 0 0 2 0 0 0 1 0 0 0 0 72 0 0 0 0 0 0 0 0 0 0 0 0 0 0 0 0 0 0 0 1 0 0 0 0 0 0 0 1 0 0 1 0 1 0 0 0 1 0 0 2 0 4 0 1 0 0 0 0 0 0 0 0 0 0 0 0 1 0 0 0 0 1 0 0 0 0 0 0 0 1 1 2 0 0 0 2 0 0 0 0 0 0 0 0 0 0 250 1 0 8 9 0 0 0 0 0 0 0 0 0 13 185 0 0 0 0 1 0 0 0 0 0 1 0 0 0 0 0 0 0 0 0 0 0 0 0 0 1 0 0 0 2 84 0 0 0 0 0 0 0 0 11 11 24 18 14 6 10 8 0 0 1 0 2 0 1 0 0 0 1 1 2 0 39 1 3 280 16 16 1 12 1 0 0 0 3 0 1 415 0 7 0 0 3 1 2 0 0 1 0 0 0 0 1 4 0 0 0 56 1 0 0 10 0 0 6 0 0 1 2 0 35 0 0 0 0 0 0 0 0 0 0 1 0 7 1 0 0 0 31 0 0 0 0 0 6 0 0 0 0 0 0 0 4 0 1 6 1 0 134 5 0 0 83 0 0 0 0 2 0 0 0 0 0 1 0 270 619 15 0 0 0 0 3 0 0 0 3 0 0 232 0 0 3 4 0 5 0 0 1 0 15 12 0 101 1 0 11 0 0 6 1 0 1 0 36 0 16 4 0 0 1 1 0 0 0 3 0 8 0 31 20 4 2 0 0 0 1 1 0 29 2 0 0 19 10 0 97 16 29 0 1 4 1 18 12 6 8 15 0 0 2 0 0 7 1 0 0 1 1 4 1 28 0 4 5 16 6 1 8 0 2 0 0 14 0 0 0 1 0 1 0 5 1 0 0 0 4 0 0 0 0 0 0 0 1 0 0 0 8 0 15 0 12 1 8 13 17 3 1 3 0 9 0 47 18 0 0 1 0 0 0 3 0 0 2 18 10 1 3 0 0 0 0 0 0 0 0 0 8 0 0 22 40 0 0 0 0 0 0 0 2 3 70 0 0 0 3 0 0 0 0 0 0 0 0 0 4 0 4 1 0 1 0 10 0 0 19 4 1 0 0 0 0 0 0 0 3 0 0 1 0 0 1 6 2 6 0 0 0 0 0 8 0 1 0 0 0 45 36 0 0 16 22 22 1 0 9 0 0 1 0 0 39 0 1 0 29 0 1 6 0 0 0 0 2 0 0 0 0 98 0 0 1 0 0 1264 0 10 0 12 1 0 3 5 0 3 2 0 0 8 118 0 1 22 0 2 0 0 0 1 9 0 0 2 0 0 24 0 0 0 1 0 0 8 2 0 0 0 1 0 0 0 2 0 0 0 12 0 0 0 24 1 0 0 0 0 0 0 0 0 0 0 0 11 1 67 0 2 0 1 0 7 2 0 0 0 0 1 2 0 22 1 0 9 4 6 0 4 5 1 0 1 1 0 0 0 0 0 1 0 6 16 0 0 1 0 14 7 52 1 1 0 0 0 0 0 1 0 0 5 3 0 0 0 0 0 1 0 0 1 4 0 0 0 0 0 0 0 19 0 6 0 7 8 0 31 1 47 9 0 0 0 1 4 0 2 0 1 3 1 0 1 0 0 0 0 1 0 0 1 3 0 6 0 0 138 0 18 35 3 33 0 0 7 10 8 1 0 0 0 0 0 1 0 3 378 0 1 2 8 0 0 95 0 0 0 3 3 58 0 2 0 10 0 2 0 0 0 0 2 0 0 0 124 0 1 28 0 0 0 0 0 1 2 3 0 0 3 6 11 0 0 0 0 0 0 0 0 21 0 2 3 0 0 0 0 14 10 201 5 5 0 0 0 0 0 0 0 0 0 0 0 2 0 6 1 1 2 0 3 0 0 0 2 0 0 1 0 35 3 6 97 0 8 0 0 237 75 4 0 1 139 0 37 0 0 1 0 0 0 0 0 0 3 1 0 0 0 13 0 0 0 0 0 0 18 63 0 1 0 0 0 1 0 0 1 54 11 1 0 0 15 3 5 6 0 0 1 12 1 1 2 0 0 337 29 0 0 0 0 0 0 0 24 0 2 3 1 8 0 11 6 0 0 2122 0 4 1 0 0 0 0 1 0 1 0 SPP95 Bacteria;Proteobacteria;Betaproteobacteria;Neisseriales;Neisseriaceae;Neisseria;multispecies_spp95_2 0 0 0 0 0 0 0 0 0 0 0 0 0 0 0 0 0 0 0 0 0 0 0 0 0 0 0 0 0 0 0 0 0 0 0 0 0 0 0 0 0 0 0 0 0 0 0 0 0 0 0 0 0 0 0 0 0 0 0 0 0 0 0 0 0 0 0 0 0 0 0 0 0 0 0 0 0 0 0 0 0 0 0 0 0 0 0 0 0 0 0 0 0 0 0 0 0 0 0 0 0 0 0 0 0 0 0 0 0 0 0 0 0 0 0 0 0 0 0 0 0 0 0 0 0 0 0 0 0 0 0 0 0 0 0 0 0 0 0 0 0 0 0 0 0 0 0 0 0 0 0 0 0 0 0 0 0 0 0 0 0 0 0 0 0 0 0 0 0 0 0 0 0 0 0 0 0 0 0 0 0 0 0 0 0 0 0 0 0 0 0 0 0 0 0 0 0 0 0 0 0 0 0 0 0 0 0 0 0 0 0 0 0 0 0 0 0 0 0 0 0 0 0 0 0 0 0 0 0 0 0 0 0 0 0 0 0 0 0 0 0 0 0 0 0 0 0 0 0 0 0 0 0 0 0 0 0 0 0 0 0 0 0 0 0 0 0 0 0 2 149 0 0 1 4 0 32 0 0 6 0 16 0 0 1 0 59 0 38 0 0 0 0 0 0 23 15 0 0 0 2 80 0 8 1 0 14 1528 0 0 0 34 0 0 0 0 0 17 21 730 0 0 0 0 0 0 0 0 0 0 3 3 0 0 0 0 0 4 0 0 1 0 0 0 111 100 0 32 0 0 0 0 0 0 0 2064 0 0 0 0 0 1 0 0 8 0 0 0 0 0 0 0 0 0 0 0 0 0 0 0 0 0 206 36 63 19 0 0 0 0 0 0 0 253 0 0 0 0 0 0 0 145 0 0 5 1061 0 0 0 0 0 0 0 0 13 1780 0 0 0 0 0 0 1 202 1 1 0 0 0 0 0 0 15 1 144 464 53 0 0 0 0 0 0 0 0 0 0 0 0 0 0 24 109 11 0 0 0 34 0 0 0 0 0 0 0 15 0 3 0 45 0 0 1 0 0 187 0 0 0 100 103 0 40 40 0 0 2 0 0 0 12 947 0 0 0 0 0 0 0 0 4 2 0 0 23 0 0 14 0 5 13 0 0 0 3 0 0 9 0 4 0 136 0 8 10 43 32 0 0 73 0 0 4 20 4 0 0 5 367 0 0 0 10 0 62 0 0 36 0 2 320 4 2 0 0 0 0 133 0 6 0 0 0 0 0 15 0 1 0 0 0 0 22 0 749 0 1 0 0 0 3 2 0 0 0 12 41 0 0 0 0 0 0 0 0 0 0 10 0 0 0 0 0 146 0 0 0 5 0 0 0 0 0 0 0 0 1 0 0 5 0 3 29 972 0 0 0 0 0 3 0 0 0 11 0 94 0 0 0 0 0 0 0 0 0 0 0 0 0 0 7 0 0 2 0 0 23 0 218 54 383 0 8 3 0 2 0 0 0 0 0 0 0 0 0 0 0 0 0 0 0 0 0 0 0 0 0 0 0 0 0 0 2 34 0 0 0 5 0 21 0 247 0 0 0 2 117 0 0 1 0 0 0 0 0 0 105 0 0 0 0 11 0 1 0 0 0 0 0 0 0 0 562 9 0 23 0 0 3 2 0 11 110 0 10 0 265 0 0 0 1 0 0 0 0 0 0 1 0 60 7 0 0 1 2 0 0 2 0 2 3 0 14 12 0 1 0 0 0 0 1 0 0 0 1 18 0 1 0 0 0 0 0 179 0 0 7 0 0 0 2 927 0 0 0 0 58 0 1 0 273 0 0 0 0 0 0 1 5 45 0 1 0 1 0 1 1 41 2 0 0 4 1 0 0 0 0 0 0 0 0 0 0 0 0 1 551 5 8 0 0 1 0 0 0 0 1 7 0 0 0 0 0 0 0 0 21 0 0 0 0 0 0 0 0 0 0 0 0 0 0 1 1 0 0 0 2 0 1 183 0 0 0 0 0 0 0 0 5 0 0 232 4 0 0 0 70 1 0 0 1 0 0 0 0 32 0 153 0 0 1 0 335 0 0 0 0 0 0 0 32 257 1 53 0 0 0 0 6 1 393 0 0 5 0 0 76 34 159 0 35 915 1 0 0 1 1 0 0 0 0 4 0 0 1 0 178 0 0 0 104 456 0 0 0 0 2 0 0 0 0 0 53 0 0 1 0 32 1 0 0 0 0 0 0 7 0 0 0 0 0 0 0 0 0 0 0 0 0 0 0 0 0 0 0 1 0 0 14 1 0 0 1 0 0 0 0 0 0 0 0 0 0 0 27 0 0 2 5 61 0 0 0 0 0 3 0 0 20 1 43 37 0 155 440 0 0 0 0 0 0 0 0 0 0 0 0 0 0 0 2 17 0 0 192 55 14 0 1 0 0 0 0 0 0 0 2 0 0 0 0 6 13 0 0 0 0 0 0 1 0 0 0 0 0 0 0 0 0 0 0 0 0 0 0 0 0 0 51 0 165 0 0 6 0 0 0 22 4 0 0 0 0 0 0 0 0 9 0 9 0 0 0 0 0 0 0 10 0 0 16 0 97 4 1 0 0 0 0 0 14 0 0 0 0 0 0 0 0 0 0 24 0 0 3 0 11 0 0 0 0 0 0 0 0 0 0 0 0 0 0 13 40 0 81 0 0 0 0 0 0 0 0 0 0 0 19 42 105 0 1 0 0 0 1 0 0 78 66 0 0 0 1 0 0 0 0 3 0 0 0 0 30 0 0 2 0 0 3 0 0 3 4 0 1 0 0 0 27 0 0 4 0 0 0 1 0 4 9 0 0 0 0 0 0 0 21 39 1 0 0 0 0 0 0 0 0 0 0 0 0 0 17 0 0 0 0 0 0 0 27 228 0 70 8 0 0 32 0 11 4 20 0 0 0 0 0 1 0 1 0 0 0 0 39 0 0 341 0 0 0 0 58 2 0 0 6 0 0 0 0 0 1 0 0 0 102 0 0 1 0 0 0 15 0 1 0 0 7 0 0 0 0 1 0 0 12 0 0 0 2 0 0 0 0 0 0 175 178 36 0 0 0 0 6 2 0 1 0 0 0 2 0 1 145 33 0 0 0 0 0 20 0 0 52 4 4 0 0 0 0 0 0 1 0 0 0 0 0 0 0 0 0 0 0 0 0 0 0 0 0 0 1 0 137 0 0 0 0 0 0 0 0 0 0 0 0 0 0 0 4 10 0 6 55 0 0 0 0 0 0 0 0 0 0 0 0 0 0 0 0 0 0 0 0 0 0 0 5 0 0 0 47 0 0 0 0 0 0 0 0 8 3 0 0 360 118 0 0 0 0 0 0 0 0 0 20 0 0 0 0 0 7 0 0 0 2 0 0 12 10 0 0 0 0 6 0 0 23 0 0 0 2 198 0 2 2 0 13 0 0 0 0 0 0 0 18 0 0 0 0 0 0 0 0 0 0 0 2 13 0 0 0 1 0 0 0 0 0 0 1 13 0 0 0 0 0 0 3 0 0 120 7 0 13 63 0 0 86 0 0 0 0 0 0 0 0 130 0 0 0 0 0 3 34 1 72 29 32 0 0 0 0 0 0 1 0 0 22 0 2 0 0 13 9 4 0 1 1 0 0 0 0 5 2 0 6 0 1 0 6 198 0 0 0 1 0 0 0 0 0 0 0 0 0 5 0 0 0 0 0 3 0 0 4 112 0 8 19 0 0 0 0 0 0 6 0 90 34 0 0 0 0 0 0 0 0 0 0 0 4 56 0 0 0 0 1 2 0 0 0 0 0 0 0 0 0 55 4 0 11 3 0 0 0 0 0 1 0 0 8 0 0 0 1 16 0 0 0 0 0 0 0 0 0 0 0 1 0 0 0 0 3 90 0 22 0 0 0 0 0 0 0 0 0 0 0 0 0 0 0 0 0 0 2 0 0 0 0 1 0 0 0 9 1 0 0 0 0 20 0 0 19 8 64 0 0 0 0 0 0 0 99 2 0 0 0 3 0 25 59 2 0 0 0 0 1 0 0 0 0 0 0 0 0 0 0 0 0 6 0 72 0 0 0 0 0 0 0 0 0 0 0 0 SPP99 Bacteria;Fusobacteria;Fusobacteria;Fusobacteriales;Fusobacteriaceae;Fusobacterium;multispecies_spp99_2 0 4 0 0 1 42 10 0 0 1 0 1 13 0 2 0 2 8 0 4 2 0 2 83 0 3 0 2 130 64 4 0 0 343 0 4 1 117 0 24 0 0 0 0 0 18 33 4 101 0 1 6 7 52 1 0 12 0 0 13 0 0 50 2 1 2 4 0 12 1 0 1 0 1 2 0 0 0 12 4 12 0 0 3 1 0 0 1 1 8 4 0 0 1 0 0 11 1 0 5 3 2 3 0 0 1 0 10 1 13 60 27 2 1 4 0 1 0 0 0 3 8 0 3 3 0 0 5 10 16 0 0 10 13 0 1 13 0 0 19 0 0 6 42 23 5 13 3 2 1 0 0 10 0 6 0 9 0 12 1 3 2 2 175 0 0 4 0 3 0 0 0 7 42 3 6 0 1 0 0 0 0 21 10 0 7 0 6 0 0 0 0 0 4 1 9 40 0 2 0 4 0 14 1 0 0 2 4 3 0 0 0 0 1 1 1 5 0 0 5 0 0 0 7 0 0 3 0 0 13 0 1 5 16 27 17 163 1 0 8 1 0 0 6 2 0 0 0 2 0 47 3 0 0 0 0 0 0 0 0 2 1 0 0 1 6 0 9 0 5 0 0 0 18 39 0 43 2 69 0 74 31 0 881 2 5 3 1 0 20 0 0 5 0 77 17 63 0 0 149 12 0 192 27 3 1 65 0 22 0 0 6 1 0 7 11 0 0 12 72 0 0 0 0 0 0 0 0 0 0 5 9 0 0 0 0 1 3 0 0 0 0 0 37 3 0 0 85 0 0 20 0 0 0 0 0 0 2 0 0 0 0 0 0 0 0 0 0 0 0 4 0 0 2 2 0 0 0 0 55 0 0 8 0 0 0 0 34 2 0 0 0 0 0 0 17 2 0 0 36 0 0 0 0 17 0 0 21 4 0 0 4 0 0 0 0 2 0 60 0 10 10 43 97 0 85 0 0 0 0 0 0 111 4 0 0 0 0 0 2 13 0 0 2 0 28 0 0 9 15 0 0 15 0 464 134 0 9 0 30 2 0 0 3 0 2 0 9 0 0 17 17 0 0 0 0 58 8 0 51 9 1 19 8 52 36 2 2 0 4 19 0 4 12 7 0 0 0 0 5 33 0 1 1 0 0 2 0 13 0 80 1 0 0 2 0 1 32 1 0 1 13 0 0 0 2 0 1 0 1 0 1 0 6 6 0 10 0 6 58 0 6 11 0 0 0 12 81 0 27 1 32 0 1 0 0 1 1 0 35 0 83 0 35 16 0 0 0 0 0 1 0 0 0 0 3 18 0 0 0 0 1 0 0 0 8 24 0 0 3 544 0 0 0 0 26 0 40 0 0 0 0 0 26 0 0 0 2 11 5 0 19 1 0 0 0 1 0 0 0 0 0 0 0 1 0 0 0 0 0 0 2 26 1 0 6 22 0 58 0 0 4 2 7 3 0 0 0 4 0 85 16 0 1 0 75 34 0 0 0 3 0 393 252 1 0 108 0 0 0 0 0 0 0 0 3 7 0 4 5 0 0 16 0 0 1 0 1 0 8 2 2 11 3 0 202 1 8 0 1 1 0 21 53 0 3 35 0 3 39 34 0 47 3 0 0 2 0 4 50 0 0 6 0 0 35 16 26 83 0 70 67 0 18 1 31 31 3 54 9 0 256 51 0 0 0 0 0 0 2 24 0 12 0 0 0 1 1 0 33 9 27 0 2 6 0 0 0 0 309 21 0 45 10 0 2 4 0 6 90 2 0 0 0 0 0 1 1 0 0 0 0 0 0 0 2 20 0 0 0 0 0 1 35 0 0 0 0 1 0 0 0 0 0 0 0 0 2 5 0 3 15 0 0 0 0 0 0 20 0 0 1 0 0 0 0 0 0 9 4 0 52 61 0 5 25 1 0 0 0 0 3 0 0 19 2 0 15 4 0 0 0 0 0 4 1 0 2 11 0 1 0 0 0 255 0 1 2 0 0 7 105 0 7 0 0 11 0 5 0 7 0 0 0 0 0 25 0 3 0 25 0 0 0 1 0 0 0 0 0 0 0 0 0 15 0 0 3 0 0 12 0 0 1 0 0 0 2 0 0 1 0 35 27 0 4 0 3 0 271 19 0 26 14 0 54 21 0 11 2 30 0 79 47 0 44 15 2 1 0 5 0 0 107 0 1 0 6 2 0 0 3 0 58 46 0 215 150 0 5 82 0 69 0 0 10 0 47 6 19 107 0 23 19 0 3 2 3 0 0 0 11 0 0 1 29 0 0 0 0 0 5 0 0 131 8 1 0 0 0 10 18 0 22 41 0 26 6 0 0 8 50 0 31 2 1 19 2 38 0 11 2 0 0 0 0 21 32 19 0 27 1 0 126 29 0 28 18 0 0 3 1 0 0 90 3 1 1 1 0 86 23 3 0 1 17 0 0 11 0 1 0 0 0 0 7 0 0 19 20 0 34 0 0 0 0 0 0 0 0 0 0 1 0 0 4 1 0 0 4 7 1 0 2 0 1 1 0 0 0 0 0 4 5 1 0 5 0 0 53 6 0 20 3 0 0 16 27 0 35 3 0 0 2 0 0 0 146 1 2 15 3 0 20 0 0 1 1 2 0 0 1 1 3 1 0 0 7 0 6 0 65 0 0 2 0 0 0 0 1 0 7 5 5 3 3 2 0 0 22 154 0 44 0 14 1 3 0 1 30 10 0 15 136 1 1 0 48 8 0 81 12 1 31 3 0 1 52 55 0 0 35 8 0 32 20 0 2 9 78 0 30 36 1 142 115 0 2 32 1 1 15 2 0 0 0 0 219 13 0 0 2 6 8 3 2 11 6 0 58 2 1 2 10 0 0 10 35 0 1 0 0 1 4 13 0 0 0 0 6 0 0 7 0 1 0 212 5 0 2 77 30 0 196 1 0 57 3 0 0 0 5 0 13 2 0 0 0 0 2 0 0 0 3 4 4 3 0 0 2 5 2 10 1 0 1 11 0 1 1 0 5 99 11 1 186 1 0 232 5 5 0 25 1 0 2 13 1 0 4 0 0 13 4 8 0 9 0 0 39 1 0 1 0 178 19 0 0 4 0 2 0 9 1 222 11 1 61 112 9 0 2 0 3 207 0 0 1 8 1 0 35 1 0 0 1624 0 2 1 0 42 1 0 77 6 1 1 1 0 0 0 0 37 1 239 2 0 124 1 1 11 1 0 26 0 0 1 13 1 0 53 0 0 10 9 5 0 16 0 0 67 93 0 1 35 0 1 14 236 0 44 90 0 407 12 6 5 3 47 0 0 29 11 285 0 64 5 1 0 2 1 89 5 12 0 12 0 0 0 2 2 42 11 2 0 42 0 0 20 35 0 0 0 5 6 1 5 9 21 4 0 14 2 2 0 98 1 0 0 241 20 4 23 6 0 33 46 0 0 123 4 0 23 98 0 34 51 0 0 117 3 0 4 0 1 73 0 0 0 0 23 0 10 0 3 0 0 0 10 1 0 8 1 1 0 93 9 0 6 0 25 11 0 0 190 9 0 3 84 1 1 1 0 9 0 3 55 6 10 0 4 1 2 3 0 0 20 31 1 0 107 50 0 23 110 2 34 23 0 0 36 10 0 0 0 0 0 4 0 0 202 1 0 38 11 2 0 1 15 0 14 8 0 15 12 0 0 3 0 0 0 0 0 87 25 1 2 8 2 0 0 0 0 0 6 12 1 9 4 0 1 1 1 0 0 0 0 12 0 0 11 1 1 6 99 10 0 54 48 3 4 5 0 96 0 0 1 39 13 0 12 5 0 11 0 0 11 18 1 3 17 20 3 11 1 3 4 10 0 0 8 1 1 23 1 0 54 0 0 0 74 6 0 17 13 1 3 0 0 0 366 0 0 0 127 0 103 1 8 2 0 87 12 0 8 3 1 9 88 15 0 282 1 14 0 0 7 0 0 0 1 704 1 0 306 7 0 13 5 0 104 0 0 88 65 0 12 7 0 16 62 0 29 1 112 0 89 27 0 49 22 0 7 5 0 6 34 13 0 22 18 1 1 2 0 0 53 60 0 0 0 5 0 5 3 0 11 0 20 1 34 0 0 11 13 0 2 1 1 1 1 2 2 0 SPPN10 Bacteria;Firmicutes;Bacilli;Lactobacillales;Streptococcaceae;Streptococcus;multispecies_sppn10_2_nov_97.976% 232 2 0 61 2 31 0 61 94 597 0 1 10 0 31 577 0 0 152 451 1 10081 245 0 6 279 12 33 23 2 0 0 0 1 12 1184 2484 35 89 4 601 1224 1492 204 0 0 2 50 1653 1 238 99 101 0 2 0 79 43 1 22 391 53 37 0 96 0 0 0 2 0 29 2 0 44 824 12 856 57 6 1125 0 2 1090 0 1 0 91 1045 1 965 1 172 9 178 32 37 0 0 0 126 52 84 6015 0 27 10 43 5 0 143 1 254 3 5 38 21 0 15 8 8 906 0 18 37 3 1 86 234 310 0 0 0 3739 18 1149 1 0 2318 14 0 14 7 1 0 0 1011 0 0 36 0 15 0 0 798 33 1094 251 0 0 1 9 0 102 0 36 1116 0 0 2 102 0 0 0 0 21 61 0 0 68 68 35 0 7 0 95 223 0 793 1 0 0 19 2890 9 1439 40 11 48 0 2 0 0 117 1 31 16 0 6 55 1 0 5 155 182 119 13 26 39 0 0 0 0 798 6 12 805 0 118 6808 11 4447 0 1 22 98 0 0 0 65 2 646 204 7 3 4 3120 337 0 0 1 0 0 0 28 0 0 0 32 2904 0 47 353 0 748 387 2191 7 449 0 0 0 0 0 0 0 0 0 0 0 0 0 0 0 0 0 0 0 0 0 0 0 0 0 0 0 0 0 0 0 0 0 0 0 0 0 0 0 0 0 0 0 0 0 0 0 0 0 0 0 0 0 0 0 0 0 0 0 0 0 0 0 0 0 0 0 0 0 0 0 0 0 0 0 0 0 0 0 0 0 0 0 0 0 0 0 0 0 0 0 0 0 0 0 0 0 0 0 0 0 0 0 0 0 0 0 0 0 0 0 0 0 0 0 0 0 0 0 0 0 0 0 0 0 0 0 0 0 0 0 0 0 0 0 0 0 0 0 0 0 0 0 0 0 0 0 0 0 0 0 0 0 0 0 0 0 0 0 0 0 0 0 0 0 0 0 0 0 0 0 0 0 0 0 0 0 0 0 0 0 0 0 0 0 0 0 0 0 0 0 0 0 0 0 0 0 0 0 0 0 0 0 0 0 0 0 0 0 0 0 0 0 0 0 0 0 0 0 0 0 0 0 0 0 0 0 0 0 0 0 0 0 0 0 0 0 0 0 0 0 0 0 0 0 0 0 0 0 0 0 0 0 0 0 0 0 0 0 0 0 0 0 0 0 0 0 0 0 0 0 0 0 0 0 0 0 0 0 0 0 0 0 0 0 0 0 0 0 0 0 0 0 0 0 0 0 0 0 0 0 0 0 0 0 0 0 0 0 0 0 0 0 0 0 0 0 0 0 0 0 0 0 0 0 0 0 0 0 0 0 0 0 0 0 0 0 0 0 0 0 0 0 0 0 0 0 0 0 0 0 0 0 0 0 0 0 0 0 0 0 0 0 0 0 0 0 0 0 0 0 0 0 0 0 0 0 0 0 0 0 0 0 0 0 0 0 0 0 0 0 0 0 0 0 0 0 0 0 0 0 0 0 0 0 0 0 0 0 0 0 0 0 0 0 0 0 0 0 0 0 0 0 0 0 0 0 0 0 0 0 0 0 0 0 0 0 0 0 0 0 0 0 0 0 0 0 0 0 0 0 0 0 0 0 0 0 0 0 0 0 0 0 0 0 0 0 0 0 0 0 0 0 0 0 0 0 0 0 0 0 0 0 0 0 0 0 0 0 0 0 0 0 0 0 0 0 0 0 0 0 0 0 0 0 0 0 0 0 0 0 0 0 0 0 0 0 0 0 0 0 0 0 0 0 0 0 0 0 0 0 0 0 0 0 0 0 0 0 0 0 0 0 0 0 0 0 0 0 0 0 0 0 0 0 0 0 0 0 0 0 0 0 0 0 0 0 0 0 0 0 0 0 0 0 0 0 0 0 0 0 0 0 0 0 0 0 0 0 0 0 0 0 0 0 0 0 0 0 0 0 0 0 0 0 0 0 0 0 0 0 0 0 0 0 0 0 0 0 0 0 0 0 0 0 0 0 0 0 0 0 0 0 0 0 0 0 0 0 0 0 0 0 0 0 0 0 0 0 0 0 0 0 0 0 0 0 0 0 0 0 0 0 0 0 0 0 0 0 0 0 0 0 0 0 0 0 0 0 0 0 0 0 0 0 0 0 0 0 0 0 0 0 0 0 0 0 0 0 0 0 0 0 0 0 0 0 0 0 0 0 0 0 0 0 0 0 0 0 0 0 0 0 0 0 0 0 0 0 0 0 0 0 0 0 0 0 0 0 0 0 0 0 0 0 0 0 0 0 0 0 0 0 0 0 0 0 0 0 0 0 0 0 0 0 0 0 0 0 0 0 0 0 0 0 0 0 0 0 0 0 0 0 0 0 0 0 0 0 0 0 0 0 0 0 0 0 0 0 0 0 0 0 0 0 0 0 0 0 0 0 0 0 0 0 0 0 0 0 0 0 0 0 0 0 0 0 0 0 0 0 0 0 0 0 0 0 0 0 0 0 0 0 0 0 0 0 0 0 0 0 0 0 0 0 0 0 0 0 0 0 0 0 0 0 0 0 0 0 0 0 0 0 0 0 0 0 0 0 0 0 0 0 0 0 0 0 0 0 0 0 0 0 0 0 0 0 0 0 0 0 0 0 0 0 0 0 0 0 0 0 0 0 0 0 0 0 0 0 0 0 0 0 0 0 0 0 0 0 0 0 0 0 0 0 0 0 0 0 0 0 0 0 0 0 0 0 0 0 0 0 0 0 0 0 0 0 0 0 0 0 0 0 0 0 0 0 0 0 0 0 0 0 0 0 0 0 0 0 0 0 0 0 0 0 0 0 0 0 0 0 0 0 0 0 0 0 0 0 0 0 0 0 0 0 0 0 0 0 0 0 0 0 0 0 0 0 0 0 0 0 0 0 0 0 0 0 0 0 0 0 0 0 0 0 0 0 0 0 0 0 0 0 0 0 0 0 0 0 0 0 0 0 0 0 0 0 0 0 0 0 0 0 0 0 0 0 0 0 0 0 0 0 0 0 0 0 0 0 0 0 0 0 0 0 0 0 0 0 0 0 0 0 0 0 0 0 0 0 0 0 0 0 0 0 0 0 0 0 0 0 0 0 0 0 0 0 0 0 0 0 0 0 0 0 0 0 0 0 0 0 0 0 0 0 0 0 0 0 0 0 0 0 0 0 0 0 0 0 0 0 0 0 0 0 0 0 0 0 0 0 0 0 0 0 0 0 0 0 0 0 0 0 0 0 0 0 0 0 0 0 0 0 0 0 0 0 0 0 0 0 0 0 0 0 0 0 0 0 0 0 0 0 0 0 0 0 0 0 0 0 0 0 0 0 0 0 0 0 0 0 0 0 0 0 0 0 0 0 0 0 0 0 0 0 0 0 0 0 0 0 0 0 0 0 0 0 0 0 0 0 0 0 0 0 0 0 0 0 0 0 0 0 0 0 0 0 0 0 0 0 0 0 0 0 0 0 0 0 0 0 0 0 0 0 0 0 0 0 0 0 0 0 0 0 0 0 0 0 0 0 0 0 0 0 0 0 0 0 0 0 0 0 0 0 0 0 0 0 0 0 0 0 0 0 0 0 0 0 0 0 0 0 0 0 0 0 0 0 0 0 0 0 0 0 0 0 0 0 0 0 0 0 0 0 0 0 0 0 0 0 0 0 0 0 0 0 0 0 0 0 0 0 0 0 0 0 0 0 0 0 0 0 0 0 0 0 0 0 0 0 0 0 0 0 0 0 0 0 0 0 0 0 0 0 0 0 0 0 0 0 0 0 0 0 0 0 0 0 0 0 0 0 0 0 0 0 0 0 0 0 0 0 0 0 0 0 0 0 0 0 0 0 0 0 0 0 0 0 0 0 0 0 0 0 0 0 0 0 0 0 0 0 0 0 0 0 0 0 0 0 0 0 0 0 0 0 0 0 0 0 0 0 0 0 0 0 0 0 0 0 0 0 0 0 0 0 0 0 0 0 0 0 0 0 0 0 0 0 0 0 0 0 0 0 0 0 0 0 0 0 0 0 0 0 0 0 0 0 0 0 0 0 0 0 0 0 0 0 0 0 0 0 0 0 0 0 0 0 0 0 0 0 0 0 0 SPPN3 Bacteria;Firmicutes;Bacilli;Lactobacillales;Streptococcaceae;Streptococcus;multispecies_sppn3_2_nov_97.571% 422 193 11 422 252 43 7 47 19 177 403 63 40 72 3 473 189 238 31 104 166 160 124 20 245 426 55 891 35 6 31 202 5 248 189 297 111 22 748 35 0 12 15 169 448 16 64 1253 41 210 222 725 182 346 109 402 345 243 5 219 113 51 396 0 77 11 36 106 301 15 6 42 65 81 162 14 298 403 4 223 37 69 286 154 28 180 356 510 109 53 5 68 1 23 134 7 0 50 21 272 261 47 280 419 5 30 116 0 68 201 53 198 119 39 117 16 127 67 29 34 404 186 626 95 62 331 34 108 28 19 28 3 1415 205 61 2 172 326 1 38 74 0 60 289 7 195 205 28 180 65 151 295 119 402 120 697 112 282 158 443 52 2 38 4 38 213 37 148 7 123 1 288 138 69 206 723 285 177 16 17 664 395 73 179 98 465 240 106 1 67 40 141 299 487 126 374 137 288 107 188 1 15 156 21 32 157 0 4 41 1 68 125 189 359 231 37 0 533 1 102 9 220 42 82 125 65 21 11 3 33 170 6 372 53 44 22 154 336 30 12 10 9 4 176 11 409 136 61 47 786 123 32 35 117 199 656 104 188 171 54 399 193 240 150 79 132 130 71 0 0 0 0 0 0 0 0 0 0 0 0 0 0 0 0 0 0 0 0 0 0 0 0 0 0 0 0 0 0 0 0 0 0 0 0 0 0 0 0 0 0 0 0 0 0 0 0 0 0 0 0 0 0 0 0 0 0 0 0 0 0 0 0 0 0 0 0 0 0 0 0 0 0 0 0 0 0 0 0 0 0 0 0 0 0 0 0 0 0 0 0 0 0 0 0 0 0 0 0 0 0 0 0 0 0 0 0 0 0 0 0 0 0 0 0 0 0 0 0 0 0 0 0 0 0 0 0 0 0 0 0 0 0 0 0 0 0 0 0 0 0 0 0 0 0 0 0 0 0 0 0 0 0 0 0 0 0 0 0 0 0 0 0 0 0 0 0 0 0 0 0 0 0 0 0 0 0 0 0 0 0 0 0 0 0 0 0 0 0 0 0 0 0 0 0 0 0 0 0 0 0 0 0 0 0 0 0 0 0 0 0 0 0 0 0 0 0 0 0 0 0 0 0 0 0 0 0 0 0 0 0 0 0 0 0 0 0 0 0 0 0 0 0 0 0 0 0 0 0 0 0 0 0 0 0 0 0 0 0 0 0 0 0 0 0 0 0 0 0 0 0 0 0 0 0 0 0 0 0 0 0 0 0 0 0 0 0 0 0 0 0 0 0 0 0 0 0 0 0 0 0 0 0 0 0 0 0 0 0 0 0 0 0 0 0 0 0 0 0 0 0 0 0 0 0 0 0 0 0 0 0 0 0 0 0 0 0 0 0 0 0 0 0 0 0 0 0 0 0 0 0 0 0 0 0 0 0 0 0 0 0 0 0 0 0 0 0 0 0 0 0 0 0 0 0 0 0 0 0 0 0 0 0 0 0 0 0 0 0 0 0 0 0 0 0 0 0 0 0 0 0 0 0 0 0 0 0 0 0 0 0 0 0 0 0 0 0 0 0 0 0 0 0 0 0 0 0 0 0 0 0 0 0 0 0 0 0 0 0 0 0 0 0 0 0 0 0 0 0 0 0 0 0 0 0 0 0 0 0 0 0 0 0 0 0 0 0 0 0 0 0 0 0 0 0 0 0 0 0 0 0 0 0 0 0 0 0 0 0 0 0 0 0 0 0 0 0 0 0 0 0 0 0 0 0 0 0 0 0 0 0 0 0 0 0 0 0 0 0 0 0 0 0 0 0 0 0 0 0 0 0 0 0 0 0 0 0 0 0 0 0 0 0 0 0 0 0 0 0 0 0 0 0 0 0 0 0 0 0 0 0 0 0 0 0 0 0 0 0 0 0 0 0 0 0 0 0 0 0 0 0 0 0 0 0 0 0 0 0 0 0 0 0 0 0 0 0 0 0 0 0 0 0 0 0 0 0 0 0 0 0 0 0 0 0 0 0 0 0 0 0 0 0 0 0 0 0 0 0 0 0 0 0 0 0 0 0 0 0 0 0 0 0 0 0 0 0 0 0 0 0 0 0 0 0 0 0 0 0 0 0 0 0 0 0 0 0 0 0 0 0 0 0 0 0 0 0 0 0 0 0 0 0 0 0 0 0 0 0 0 0 0 0 0 0 0 0 0 0 0 0 0 0 0 0 0 0 0 0 0 0 0 0 0 0 0 0 0 0 0 0 0 0 0 0 0 0 0 0 0 0 0 0 0 0 0 0 0 0 0 0 0 0 0 0 0 0 0 0 0 0 0 0 0 0 0 0 0 0 0 0 0 0 0 0 0 0 0 0 0 0 0 0 0 0 0 0 0 0 0 0 0 0 0 0 0 0 0 0 0 0 0 0 0 0 0 0 0 0 0 0 0 0 0 0 0 0 0 0 0 0 0 0 0 0 0 0 0 0 0 0 0 0 0 0 0 0 0 0 0 0 0 0 0 0 0 0 0 0 0 0 0 0 0 0 0 0 0 0 0 0 0 0 0 0 0 0 0 0 0 0 0 0 0 0 0 0 0 0 0 0 0 0 0 0 0 0 0 0 0 0 0 0 0 0 0 0 0 0 0 0 0 0 0 0 0 0 0 0 0 0 0 0 0 0 0 0 0 0 0 0 0 0 0 0 0 0 0 0 0 0 0 0 0 0 0 0 0 0 0 0 0 0 0 0 0 0 0 0 0 0 0 0 0 0 0 0 0 0 0 0 0 0 0 0 0 0 0 0 0 0 0 0 0 0 0 0 0 0 0 0 0 0 0 0 0 0 0 0 0 0 0 0 0 0 0 0 0 0 0 0 0 0 0 0 0 0 0 0 0 0 0 0 0 0 0 0 0 0 0 0 0 0 0 0 0 0 0 0 0 0 0 0 0 0 0 0 0 0 0 0 0 0 0 0 0 0 0 0 0 0 0 0 0 0 0 0 0 0 0 0 0 0 0 0 0 0 0 0 0 0 0 0 0 0 0 0 0 0 0 0 0 0 0 0 0 0 0 0 0 0 0 0 0 0 0 0 0 0 0 0 0 0 0 0 0 0 0 0 0 0 0 0 0 0 0 0 0 0 0 0 0 0 0 0 0 0 0 0 0 0 0 0 0 0 0 0 0 0 0 0 0 0 0 0 0 0 0 0 0 0 0 0 0 0 0 0 0 0 0 0 0 0 0 0 0 0 0 0 0 0 0 0 0 0 0 0 0 0 0 0 0 0 0 0 0 0 0 0 0 0 0 0 0 0 0 0 0 0 0 0 0 0 0 0 0 0 0 0 0 0 0 0 0 0 0 0 0 0 0 0 0 0 0 0 0 0 0 0 0 0 0 0 0 0 0 0 0 0 0 0 0 0 0 0 0 0 0 0 0 0 0 0 0 0 0 0 0 0 0 0 0 0 0 0 0 0 0 0 0 0 0 0 0 0 0 0 0 0 0 0 0 0 0 0 0 0 0 0 0 0 0 0 0 0 0 0 0 0 0 0 0 0 0 0 0 0 0 0 0 0 0 0 0 0 0 0 0 0 0 0 0 0 0 0 0 0 0 0 0 0 0 0 0 0 0 0 0 0 0 0 0 0 0 0 0 0 0 0 0 0 0 0 0 0 0 0 0 0 0 0 0 0 0 0 0 0 0 0 0 0 0 0 0 0 0 0 0 0 0 0 0 0 0 0 0 0 0 0 0 0 0 0 0 0 0 0 0 0 0 0 0 0 0 0 0 0 0 0 0 0 0 0 0 0 0 0 0 0 0 0 0 0 0 0 0 0 0 0 0 0 0 0 0 0 0 0 0 0 0 0 0 0 0 0 0 0 0 0 0 0 0 0 0 0 0 0 0 0 0 0 0 0 0 0 0 0 0 0 0 0 0 0 0 0 0 0 0 0 0 0 0 0 0 0 0 0 0 0 0 0 0 0 0 0 0 0 0 0 0 0 0 0 0 0 0 0 0 0 0 0 0 0 0 0 0 0 0 0 0 0 0 0 0 0 0 0 0 0 0 0 0 0 0 0 0 0 0 0 0 0 0 0 0 0 0 0 0 0 0 0 0 0 0 0 0 0 0 0 0 0 0 0 0 0 SPPN6 Bacteria;Firmicutes;Bacilli;Lactobacillales;Streptococcaceae;Streptococcus;multispecies_sppn6_2_nov_83.865% 0 8 8 13 3 6 6 0 19 41 0 52 11 2 24 1 0 2 3 0 6 0 0 14 0 0 19 0 87 37 4 1 9 1 5 0 3 13 23 4 5 31 281 0 47 0 91 3 2 143 18 0 0 55 3 3 1 15 3 25 1 1 2 19 1 21 7 0 27 1 26 13 157 2 10 1 1 0 54 0 8 1 73 3 0 0 25 3 0 12 104 0 547 21 0 1 95 4 3 1 0 33 38 7 0 129 90 3 0 5 186 5 3 0 1 17 7 0 1 15 110 1 1 2 12 0 4 0 1 15 2 0 0 271 138 128 2 0 0 0 23 6 27 63 25 0 1 6 0 3 6 6 212 0 0 0 0 6 4 1 70 47 0 0 0 2 784 66 258 0 37 7 0 14 2 0 2 0 374 111 1 18 18 3 8 39 0 26 2 1 0 1 4 5 1 1 0 2 0 39 365 43 20 1 35 0 18 3 327 19 1 295 152 0 6 71 40 0 2 18 34 3 1 63 13 67 0 24 178 1 45 27 4 610 0 0 35 0 0 153 48 8 0 3 2 0 1 4 0 7 0 134 13 0 0 1 0 0 0 4 4 0 1 5 1 0 0 0 0 0 0 0 0 0 0 0 0 0 0 0 0 0 0 0 0 0 0 0 0 0 0 0 0 0 0 0 0 0 0 0 0 0 0 0 0 0 0 0 0 0 0 0 0 0 0 0 0 0 0 0 0 0 0 0 0 0 0 0 0 0 0 0 0 0 0 0 0 0 0 0 0 0 0 0 0 0 0 0 0 0 0 0 0 0 0 0 0 0 0 0 0 0 0 0 0 0 0 0 0 0 0 0 0 0 0 0 0 0 0 0 0 0 0 0 0 0 0 0 0 0 0 0 0 0 0 0 0 0 0 0 0 0 0 0 0 0 0 0 0 0 0 0 0 0 0 0 0 0 0 0 0 0 0 0 0 0 0 0 0 0 0 0 0 0 0 0 0 0 0 0 0 0 0 0 0 0 0 0 0 0 0 0 0 0 0 0 0 0 0 0 0 0 0 0 0 0 0 0 0 0 0 0 0 0 0 0 0 0 0 0 0 0 0 0 0 0 0 0 0 0 0 0 0 0 0 0 0 0 0 0 0 0 0 0 0 0 0 0 0 0 0 0 0 0 0 0 0 0 0 0 0 0 0 0 0 0 0 0 0 0 0 0 0 0 0 0 0 0 0 0 0 0 0 0 0 0 0 0 0 0 0 0 0 0 0 0 0 0 0 0 0 0 0 0 0 0 0 0 0 0 0 0 0 0 0 0 0 0 0 0 0 0 0 0 0 0 0 0 0 0 0 0 0 0 0 0 0 0 0 0 0 0 0 0 0 0 0 0 0 0 0 0 0 0 0 0 0 0 0 0 0 0 0 0 0 0 0 0 0 0 0 0 0 0 0 0 0 0 0 0 0 0 0 0 0 0 0 0 0 0 0 0 0 0 0 0 0 0 0 0 0 0 0 0 0 0 0 0 0 0 0 0 0 0 0 0 0 0 0 0 0 0 0 0 0 0 0 0 0 0 0 0 0 0 0 0 0 0 0 0 0 0 0 0 0 0 0 0 0 0 0 0 0 0 0 0 0 0 0 0 0 0 0 0 0 0 0 0 0 0 0 0 0 0 0 0 0 0 0 0 0 0 0 0 0 0 0 0 0 0 0 0 0 0 0 0 0 0 0 0 0 0 0 0 0 0 0 0 0 0 0 0 0 0 0 0 0 0 0 0 0 0 0 0 0 0 0 0 0 0 0 0 0 0 0 0 0 0 0 0 0 0 0 0 0 0 0 0 0 0 0 0 0 0 0 0 0 0 0 0 0 0 0 0 0 0 0 0 0 0 0 0 0 0 0 0 0 0 0 0 0 0 0 0 0 0 0 0 0 0 0 0 0 0 0 0 0 0 0 0 0 0 0 0 0 0 0 0 0 0 0 0 0 0 0 0 0 0 0 0 0 0 0 0 0 0 0 0 0 0 0 0 0 0 0 0 0 0 0 0 0 0 0 0 0 0 0 0 0 0 0 0 0 0 0 0 0 0 0 0 0 0 0 0 0 0 0 0 0 0 0 0 0 0 0 0 0 0 0 0 0 0 0 0 0 0 0 0 0 0 0 0 0 0 0 0 0 0 0 0 0 0 0 0 0 0 0 0 0 0 0 0 0 0 0 0 0 0 0 0 0 0 0 0 0 0 0 0 0 0 0 0 0 0 0 0 0 0 0 0 0 0 0 0 0 0 0 0 0 0 0 0 0 0 0 0 0 0 0 0 0 0 0 0 0 0 0 0 0 0 0 0 0 0 0 0 0 0 0 0 0 0 0 0 0 0 0 0 0 0 0 0 0 0 0 0 0 0 0 0 0 0 0 0 0 0 0 0 0 0 0 0 0 0 0 0 0 0 0 0 0 0 0 0 0 0 0 0 0 0 0 0 0 0 0 0 0 0 0 0 0 0 0 0 0 0 0 0 0 0 0 0 0 0 0 0 0 0 0 0 0 0 0 0 0 0 0 0 0 0 0 0 0 0 0 0 0 0 0 0 0 0 0 0 0 0 0 0 0 0 0 0 0 0 0 0 0 0 0 0 0 0 0 0 0 0 0 0 0 0 0 0 0 0 0 0 0 0 0 0 0 0 0 0 0 0 0 0 0 0 0 0 0 0 0 0 0 0 0 0 0 0 0 0 0 0 0 0 0 0 0 0 0 0 0 0 0 0 0 0 0 0 0 0 0 0 0 0 0 0 0 0 0 0 0 0 0 0 0 0 0 0 0 0 0 0 0 0 0 0 0 0 0 0 0 0 0 0 0 0 0 0 0 0 0 0 0 0 0 0 0 0 0 0 0 0 0 0 0 0 0 0 0 0 0 0 0 0 0 0 0 0 0 0 0 0 0 0 0 0 0 0 0 0 0 0 0 0 0 0 0 0 0 0 0 0 0 0 0 0 0 0 0 0 0 0 0 0 0 0 0 0 0 0 0 0 0 0 0 0 0 0 0 0 0 0 0 0 0 0 0 0 0 0 0 0 0 0 0 0 0 0 0 0 0 0 0 0 0 0 0 0 0 0 0 0 0 0 0 0 0 0 0 0 0 0 0 0 0 0 0 0 0 0 0 0 0 0 0 0 0 0 0 0 0 0 0 0 0 0 0 0 0 0 0 0 0 0 0 0 0 0 0 0 0 0 0 0 0 0 0 0 0 0 0 0 0 0 0 0 0 0 0 0 0 0 0 0 0 0 0 0 0 0 0 0 0 0 0 0 0 0 0 0 0 0 0 0 0 0 0 0 0 0 0 0 0 0 0 0 0 0 0 0 0 0 0 0 0 0 0 0 0 0 0 0 0 0 0 0 0 0 0 0 0 0 0 0 0 0 0 0 0 0 0 0 0 0 0 0 0 0 0 0 0 0 0 0 0 0 0 0 0 0 0 0 0 0 0 0 0 0 0 0 0 0 0 0 0 0 0 0 0 0 0 0 0 0 0 0 0 0 0 0 0 0 0 0 0 0 0 0 0 0 0 0 0 0 0 0 0 0 0 0 0 0 0 0 0 0 0 0 0 0 0 0 0 0 0 0 0 0 0 0 0 0 0 0 0 0 0 0 0 0 0 0 0 0 0 0 0 0 0 0 0 0 0 0 0 0 0 0 0 0 0 0 0 0 0 0 0 0 0 0 0 0 0 0 0 0 0 0 0 0 0 0 0 0 0 0 0 0 0 0 0 0 0 0 0 0 0 0 0 0 0 0 0 0 0 0 0 0 0 0 0 0 0 0 0 0 0 0 0 0 0 0 0 0 0 0 0 0 0 0 0 0 0 0 0 0 0 0 0 0 0 0 0 0 0 0 0 0 0 0 0 0 0 0 0 0 0 0 0 0 0 0 0 0 0 0 0 0 0 0 0 0 0 0 0 0 0 0 0 0 0 0 0 0 0 0 0 0 0 0 0 0 0 0 0 0 0 0 0 0 0 0 0 0 0 0 0 0 0 0 0 0 0 0 0 0 0 0 0 0 0 0 0 0 0 0 0 0 0 0 0 0 0 0 0 0 0 0 0 0 0 0 0 0 0 0 0 0 0 0 SPPN7 Bacteria;Firmicutes;Bacilli;Lactobacillales;Streptococcaceae;Streptococcus;multispecies_sppn7_2_nov_94.919% 0 25 4 2 0 16 14 4 123 42 0 42 9 34 2 47 9 44 73 10 3 1 4 29 11 4 284 4 7 12 51 7 25 8 14 12 6 6 8 141 50 223 21 0 0 17 1 25 8 100 3 2 5 47 27 0 5 19 28 19 132 12 5 4 50 157 162 15 44 60 3 15 80 1 69 63 35 19 0 26 54 10 28 22 15 33 54 54 93 0 6 4 43 8 42 2 4 4 25 35 67 18 21 18 17 37 29 1 47 11 3 37 5 3 4 28 1 0 1 206 0 8 0 32 15 187 8 20 6 9 56 30 2 5 33 13 20 4 8 26 25 13 33 23 23 42 45 56 13 2 4 14 6 36 14 10 1 63 13 25 28 6 18 4 20 57 24 46 27 40 0 0 25 137 1 7 54 93 29 151 5 59 20 9 1 44 12 2 1 4 15 0 34 6 2 5 1 2 53 14 24 7 16 0 5 0 52 42 6 23 3 2 2 3 4 18 7 0 9 24 34 26 7 20 12 2 7 58 16 1 8 90 8 48 4 11 15 25 10 19 11 13 0 23 2 1 21 25 6 1 2 1 5 4 3 16 38 47 1 5 6 1 29 6 11 15 26 6 0 0 0 0 0 0 0 0 0 0 0 0 0 0 0 0 0 0 0 0 0 0 0 0 0 0 0 0 0 0 0 0 0 0 0 0 0 0 0 0 0 0 0 0 0 0 0 0 0 0 0 0 0 0 0 0 0 0 0 0 0 0 0 0 0 0 0 0 0 0 0 0 0 0 0 0 0 0 0 0 0 0 0 0 0 0 0 0 0 0 0 0 0 0 0 0 0 0 0 0 0 0 0 0 0 0 0 0 0 0 0 0 0 0 0 0 0 0 0 0 0 0 0 0 0 0 0 0 0 0 0 0 0 0 0 0 0 0 0 0 0 0 0 0 0 0 0 0 0 0 0 0 0 0 0 0 0 0 0 0 0 0 0 0 0 0 0 0 0 0 0 0 0 0 0 0 0 0 0 0 0 0 0 0 0 0 0 0 0 0 0 0 0 0 0 0 0 0 0 0 0 0 0 0 0 0 0 0 0 0 0 0 0 0 0 0 0 0 0 0 0 0 0 0 0 0 0 0 0 0 0 0 0 0 0 0 0 0 0 0 0 0 0 0 0 0 0 0 0 0 0 0 0 0 0 0 0 0 0 0 0 0 0 0 0 0 0 0 0 0 0 0 0 0 0 0 0 0 0 0 0 0 0 0 0 0 0 0 0 0 0 0 0 0 0 0 0 0 0 0 0 0 0 0 0 0 0 0 0 0 0 0 0 0 0 0 0 0 0 0 0 0 0 0 0 0 0 0 0 0 0 0 0 0 0 0 0 0 0 0 0 0 0 0 0 0 0 0 0 0 0 0 0 0 0 0 0 0 0 0 0 0 0 0 0 0 0 0 0 0 0 0 0 0 0 0 0 0 0 0 0 0 0 0 0 0 0 0 0 0 0 0 0 0 0 0 0 0 0 0 0 0 0 0 0 0 0 0 0 0 0 0 0 0 0 0 0 0 0 0 0 0 0 0 0 0 0 0 0 0 0 0 0 0 0 0 0 0 0 0 0 0 0 0 0 0 0 0 0 0 0 0 0 0 0 0 0 0 0 0 0 0 0 0 0 0 0 0 0 0 0 0 0 0 0 0 0 0 0 0 0 0 0 0 0 0 0 0 0 0 0 0 0 0 0 0 0 0 0 0 0 0 0 0 0 0 0 0 0 0 0 0 0 0 0 0 0 0 0 0 0 0 0 0 0 0 0 0 0 0 0 0 0 0 0 0 0 0 0 0 0 0 0 0 0 0 0 0 0 0 0 0 0 0 0 0 0 0 0 0 0 0 0 0 0 0 0 0 0 0 0 0 0 0 0 0 0 0 0 0 0 0 0 0 0 0 0 0 0 0 0 0 0 0 0 0 0 0 0 0 0 0 0 0 0 0 0 0 0 0 0 0 0 0 0 0 0 0 0 0 0 0 0 0 0 0 0 0 0 0 0 0 0 0 0 0 0 0 0 0 0 0 0 0 0 0 0 0 0 0 0 0 0 0 0 0 0 0 0 0 0 0 0 0 0 0 0 0 0 0 0 0 0 0 0 0 0 0 0 0 0 0 0 0 0 0 0 0 0 0 0 0 0 0 0 0 0 0 0 0 0 0 0 0 0 0 0 0 0 0 0 0 0 0 0 0 0 0 0 0 0 0 0 0 0 0 0 0 0 0 0 0 0 0 0 0 0 0 0 0 0 0 0 0 0 0 0 0 0 0 0 0 0 0 0 0 0 0 0 0 0 0 0 0 0 0 0 0 0 0 0 0 0 0 0 0 0 0 0 0 0 0 0 0 0 0 0 0 0 0 0 0 0 0 0 0 0 0 0 0 0 0 0 0 0 0 0 0 0 0 0 0 0 0 0 0 0 0 0 0 0 0 0 0 0 0 0 0 0 0 0 0 0 0 0 0 0 0 0 0 0 0 0 0 0 0 0 0 0 0 0 0 0 0 0 0 0 0 0 0 0 0 0 0 0 0 0 0 0 0 0 0 0 0 0 0 0 0 0 0 0 0 0 0 0 0 0 0 0 0 0 0 0 0 0 0 0 0 0 0 0 0 0 0 0 0 0 0 0 0 0 0 0 0 0 0 0 0 0 0 0 0 0 0 0 0 0 0 0 0 0 0 0 0 0 0 0 0 0 0 0 0 0 0 0 0 0 0 0 0 0 0 0 0 0 0 0 0 0 0 0 0 0 0 0 0 0 0 0 0 0 0 0 0 0 0 0 0 0 0 0 0 0 0 0 0 0 0 0 0 0 0 0 0 0 0 0 0 0 0 0 0 0 0 0 0 0 0 0 0 0 0 0 0 0 0 0 0 0 0 0 0 0 0 0 0 0 0 0 0 0 0 0 0 0 0 0 0 0 0 0 0 0 0 0 0 0 0 0 0 0 0 0 0 0 0 0 0 0 0 0 0 0 0 0 0 0 0 0 0 0 0 0 0 0 0 0 0 0 0 0 0 0 0 0 0 0 0 0 0 0 0 0 0 0 0 0 0 0 0 0 0 0 0 0 0 0 0 0 0 0 0 0 0 0 0 0 0 0 0 0 0 0 0 0 0 0 0 0 0 0 0 0 0 0 0 0 0 0 0 0 0 0 0 0 0 0 0 0 0 0 0 0 0 0 0 0 0 0 0 0 0 0 0 0 0 0 0 0 0 0 0 0 0 0 0 0 0 0 0 0 0 0 0 0 0 0 0 0 0 0 0 0 0 0 0 0 0 0 0 0 0 0 0 0 0 0 0 0 0 0 0 0 0 0 0 0 0 0 0 0 0 0 0 0 0 0 0 0 0 0 0 0 0 0 0 0 0 0 0 0 0 0 0 0 0 0 0 0 0 0 0 0 0 0 0 0 0 0 0 0 0 0 0 0 0 0 0 0 0 0 0 0 0 0 0 0 0 0 0 0 0 0 0 0 0 0 0 0 0 0 0 0 0 0 0 0 0 0 0 0 0 0 0 0 0 0 0 0 0 0 0 0 0 0 0 0 0 0 0 0 0 0 0 0 0 0 0 0 0 0 0 0 0 0 0 0 0 0 0 0 0 0 0 0 0 0 0 0 0 0 0 0 0 0 0 0 0 0 0 0 0 0 0 0 0 0 0 0 0 0 0 0 0 0 0 0 0 0 0 0 0 0 0 0 0 0 0 0 0 0 0 0 0 0 0 0 0 0 0 0 0 0 0 0 0 0 0 0 0 0 0 0 0 0 0 0 0 0 0 0 0 0 0 0 0 0 0 0 0 0 0 0 0 0 0 0 0 0 0 0 0 0 0 0 0 0 0 0 0 0 0 0 0 0 0 0 0 0 0 0 0 0 0 0 0 0 0 0 0 0 0 0 0 0 0 0 0 0 0 0 0 0 0 0 0 0 0 0 0 0 0 0 0 0 0 0 0 0 0 0 0 0 0 0 0 0 0 0 0 0 0 0 0 0 0 0 0 0 0 0 0 0 0 0 0 0 0 0 0 0 0 0 0 0 0 0 0 0 0 0 0 0 0 0 0 0 0 0 0 0 0 0 0 0 0 SPPN8 Bacteria;Firmicutes;Clostridia;Clostridiales;Peptoniphilaceae;Parvimonas;multispecies_sppn8_2_nov_96.842% 77 0 14 1 1 1520 0 0 2 0 0 0 33 3088 22 0 149 0 433 301 2 0 0 0 1 0 0 0 0 0 4070 2255 135 0 1 1 0 0 0 0 1404 0 33 7 0 0 0 0 0 436 0 0 0 0 0 0 0 0 0 0 0 0 0 0 0 2 0 0 638 3343 0 1 0 0 0 1721 121 1340 0 0 0 3676 0 84 0 0 67 0 1 0 0 4 3 0 0 1 0 240 29 0 2 0 0 520 0 20 701 0 1468 0 0 0 0 709 103 6 2318 0 946 0 0 0 0 50 5 0 0 0 2 0 5224 4530 12 2 0 968 1517 0 0 4042 0 4 0 91 4 0 261 1691 0 646 17 1595 62 0 15 204 360 0 0 206 0 52 20 0 0 0 0 2419 13 0 0 0 506 148 0 0 2272 1753 0 14 0 0 1637 76 0 111 1165 446 0 1 0 793 260 0 0 0 0 443 63 289 0 113 0 1249 0 0 34 0 0 0 0 0 0 0 1 0 0 102 0 2255 7 0 0 24 0 0 1965 15 0 2 0 15 12 1 0 3487 204 21 947 172 0 0 1951 0 2 0 194 80 312 0 22 914 1347 0 0 0 558 2450 0 5 0 0 875 0 0 0 6 0 0 0 0 0 0 0 0 0 0 0 0 0 0 0 0 0 0 0 0 0 0 0 0 0 0 0 0 0 0 0 0 0 0 0 0 0 0 0 0 0 0 0 0 0 0 0 0 0 0 0 0 0 0 0 0 0 0 0 0 0 0 0 0 0 0 0 0 0 0 0 0 0 0 0 0 0 0 0 0 0 0 0 0 0 0 0 0 0 0 0 0 0 0 0 0 0 0 0 0 0 0 0 0 0 0 0 0 0 0 0 0 0 0 0 0 0 0 0 0 0 0 0 0 0 0 0 0 0 0 0 0 0 0 0 0 0 0 0 0 0 0 0 0 0 0 0 0 0 0 0 0 0 0 0 0 0 0 0 0 0 0 0 0 0 0 0 0 0 0 0 0 0 0 0 0 0 0 0 0 0 0 0 0 0 0 0 0 0 0 0 0 0 0 0 0 0 0 0 0 0 0 0 0 0 0 0 0 0 0 0 0 0 0 0 0 0 0 0 0 0 0 0 0 0 0 0 0 0 0 0 0 0 0 0 0 0 0 0 0 0 0 0 0 0 0 0 0 0 0 0 0 0 0 0 0 0 0 0 0 0 0 0 0 0 0 0 0 0 0 0 0 0 0 0 0 0 0 0 0 0 0 0 0 0 0 0 0 0 0 0 0 0 0 0 0 0 0 0 0 0 0 0 0 0 0 0 0 0 0 0 0 0 0 0 0 0 0 0 0 0 0 0 0 0 0 0 0 0 0 0 0 0 0 0 0 0 0 0 0 0 0 0 0 0 0 0 0 0 0 0 0 0 0 0 0 0 0 0 0 0 0 0 0 0 0 0 0 0 0 0 0 0 0 0 0 0 0 0 0 0 0 0 0 0 0 0 0 0 0 0 0 0 0 0 0 0 0 0 0 0 0 0 0 0 0 0 0 0 0 0 0 0 0 0 0 0 0 0 0 0 0 0 0 0 0 0 0 0 0 0 0 0 0 0 0 0 0 0 0 0 0 0 0 0 0 0 0 0 0 0 0 0 0 0 0 0 0 0 0 0 0 0 0 0 0 0 0 0 0 0 0 0 0 0 0 0 0 0 0 0 0 0 0 0 0 0 0 0 0 0 0 0 0 0 0 0 0 0 0 0 0 0 0 0 0 0 0 0 0 0 0 0 0 0 0 0 0 0 0 0 0 0 0 0 0 0 0 0 0 0 0 0 0 0 0 0 0 0 0 0 0 0 0 0 0 0 0 0 0 0 0 0 0 0 0 0 0 0 0 0 0 0 0 0 0 0 0 0 0 0 0 0 0 0 0 0 0 0 0 0 0 0 0 0 0 0 0 0 0 0 0 0 0 0 0 0 0 0 0 0 0 0 0 0 0 0 0 0 0 0 0 0 0 0 0 0 0 0 0 0 0 0 0 0 0 0 0 0 0 0 0 0 0 0 0 0 0 0 0 0 0 0 0 0 0 0 0 0 0 0 0 0 0 0 0 0 0 0 0 0 0 0 0 0 0 0 0 0 0 0 0 0 0 0 0 0 0 0 0 0 0 0 0 0 0 0 0 0 0 0 0 0 0 0 0 0 0 0 0 0 0 0 0 0 0 0 0 0 0 0 0 0 0 0 0 0 0 0 0 0 0 0 0 0 0 0 0 0 0 0 0 0 0 0 0 0 0 0 0 0 0 0 0 0 0 0 0 0 0 0 0 0 0 0 0 0 0 0 0 0 0 0 0 0 0 0 0 0 0 0 0 0 0 0 0 0 0 0 0 0 0 0 0 0 0 0 0 0 0 0 0 0 0 0 0 0 0 0 0 0 0 0 0 0 0 0 0 0 0 0 0 0 0 0 0 0 0 0 0 0 0 0 0 0 0 0 0 0 0 0 0 0 0 0 0 0 0 0 0 0 0 0 0 0 0 0 0 0 0 0 0 0 0 0 0 0 0 0 0 0 0 0 0 0 0 0 0 0 0 0 0 0 0 0 0 0 0 0 0 0 0 0 0 0 0 0 0 0 0 0 0 0 0 0 0 0 0 0 0 0 0 0 0 0 0 0 0 0 0 0 0 0 0 0 0 0 0 0 0 0 0 0 0 0 0 0 0 0 0 0 0 0 0 0 0 0 0 0 0 0 0 0 0 0 0 0 0 0 0 0 0 0 0 0 0 0 0 0 0 0 0 0 0 0 0 0 0 0 0 0 0 0 0 0 0 0 0 0 0 0 0 0 0 0 0 0 0 0 0 0 0 0 0 0 0 0 0 0 0 0 0 0 0 0 0 0 0 0 0 0 0 0 0 0 0 0 0 0 0 0 0 0 0 0 0 0 0 0 0 0 0 0 0 0 0 0 0 0 0 0 0 0 0 0 0 0 0 0 0 0 0 0 0 0 0 0 0 0 0 0 0 0 0 0 0 0 0 0 0 0 0 0 0 0 0 0 0 0 0 0 0 0 0 0 0 0 0 0 0 0 0 0 0 0 0 0 0 0 0 0 0 0 0 0 0 0 0 0 0 0 0 0 0 0 0 0 0 0 0 0 0 0 0 0 0 0 0 0 0 0 0 0 0 0 0 0 0 0 0 0 0 0 0 0 0 0 0 0 0 0 0 0 0 0 0 0 0 0 0 0 0 0 0 0 0 0 0 0 0 0 0 0 0 0 0 0 0 0 0 0 0 0 0 0 0 0 0 0 0 0 0 0 0 0 0 0 0 0 0 0 0 0 0 0 0 0 0 0 0 0 0 0 0 0 0 0 0 0 0 0 0 0 0 0 0 0 0 0 0 0 0 0 0 0 0 0 0 0 0 0 0 0 0 0 0 0 0 0 0 0 0 0 0 0 0 0 0 0 0 0 0 0 0 0 0 0 0 0 0 0 0 0 0 0 0 0 0 0 0 0 0 0 0 0 0 0 0 0 0 0 0 0 0 0 0 0 0 0 0 0 0 0 0 0 0 0 0 0 0 0 0 0 0 0 0 0 0 0 0 0 0 0 0 0 0 0 0 0 0 0 0 0 0 0 0 0 0 0 0 0 0 0 0 0 0 0 0 0 0 0 0 0 0 0 0 0 0 0 0 0 0 0 0 0 0 0 0 0 0 0 0 0 0 0 0 0 0 0 0 0 0 0 0 0 0 0 0 0 0 0 0 0 0 0 0 0 0 0 0 0 0 0 0 0 0 0 0 0 0 0 0 0 0 0 0 0 0 0 0 0 0 0 0 0 0 0 0 0 0 0 0 0 0 0 0 0 0 0 0 0 0 0 0 0 0 0 0 0 0 0 0 0 0 0 0 0 0 0 0 0 0 0 0 0 0 0 0 0 0 0 0 0 0 0 0 0 0 0 0 0 0 0 0 0 0 0 0 0 0 0 0 0 0 0 0 0 0 0 0 0 0 0 0 0 0 0 0 0 0 0 0 0 0 0 0 0 0 0 0 0 0 0 0 0 0 0 0 0 0 0 0 0 0 0 0 0 0 0 0 0 0 0 0 0 0 0 0 0 0 0 0 0 0 0 0 0
;
The species listed in the table has full taxonomy and a dynamically assigned species ID specific to this report.
When some reads match with the reference sequences of more than one species equally (i.e., same percent identiy and alignmnet coverage),
they can't be assigned to a particular species. Instead, they are assigned to multiple species with the species notaton
"s__multispecies_spp2_2 ". In this notation, spp2 is the dynamic ID assigned to these reads that hit multiple sequences and the "_2"
at the end of the notation means there are two species in the spp2 .
Another type of notation is "s__multispecies_sppn2_2 ", in which the "n" in the sppn2 means it's a potential novel species because all the reads in this species
have < 98% idenity to any of the reference sequences. They were grouped together based on de novo OTU clustering at 98% identity cutoff. And then
a representative sequence was chosed to BLASTN search against the reference database to find the closest match (but will still be < 98%). This representative
sequence also matched equally to more than one species, hence the "spp" was given in the label.
Taxonomy Bar Plots for All Samples
Taxonomy Bar Plots for Individual Comparison Groups
Comparison No. Comparison Name Families Genera Species Comparison 1 W Caries Free Saliva vs W Caries Saliva vs K Caries Free Saliva vs K Caries Saliva PDF SVG PDF SVG PDF SVG Comparison 2 W Caries Free Saliva vs W Caries Saliva PDF SVG PDF SVG PDF SVG Comparison 3 K Caries Free Saliva vs K Caries Saliva PDF SVG PDF SVG PDF SVG
VIII. Analysis - Alpha Diversity
Alpha Diversity Analysis by Rarefaction
Diversity measures are affected by the sampling depth. Rarefaction is a technique to assess species richness from the results of sampling. Rarefaction allows
the calculation of species richness for a given number of individual samples, based on the construction
of so-called rarefaction curves. This curve is a plot of the number of species as a function of the
number of samples. Rarefaction curves generally grow rapidly at first, as the most common species are found,
but the curves plateau as only the rarest species remain to be sampled.
References: Willis AD. Rarefaction, Alpha Diversity, and Statistics. Front Microbiol. 2019 Oct 23;10:2407. doi: 10.3389/fmicb.2019.02407. PMID: 31708888; PMCID: PMC6819366.
Boxplot of Alpha-diversity Indices
The two main factors taken into account when measuring diversity are richness and evenness.
Richness is a measure of the number of different kinds of organisms present in a particular area.
Evenness compares the similarity of the population size of each of the species present. There are
many different ways to measure the richness and evenness. These measurements are called "estimators" or "indices".
Below is a diversity of 3 commonly used indices showing the values for all the samples (dots) and in groups (boxes).
Alpha Diversity Box Plots for All Groups
Alpha Diversity Box Plots for Individual Comparisons Group Significance of Alpha-diversity Indices
To test whether the alpha diversity among different comparison groups are different statisticall, we use the Kruskal Wallis H test
provided the "alpha-group-significance" fucntion in the QIIME 2 diversity package. Kruskal Wallis H test is the non parametric alternative
to the One Way ANOVA. Non parametric means that the test doesn’t assume your data comes from a particular distribution. The H test is used
when the assumptions for ANOVA aren’t met (like the assumption of normality). It is sometimes called the one-way ANOVA on ranks,
as the ranks of the data values are used in the test rather than the actual data points. The test determines whether the medians of two
or more groups are different.
Below are the Kruskal Wallis H test results for each comparison based on three different alpha diversity measures: 1) Observed species (features),
2) Shannon index, and 3) Simpson index.
IX. Analysis - Beta Diversity
NMDS and PCoA Plots
Beta diversity compares the similarity (or dissimilarity) of microbial profiles between different
groups of samples. There are many different similarity/dissimilarity metrics.
In general, they can be quantitative (using sequence abundance, e.g., Bray-Curtis or weighted UniFrac)
or binary (considering only presence-absence of sequences, e.g., binary Jaccard or unweighted UniFrac).
They can be even based on phylogeny (e.g., UniFrac metrics) or not (non-UniFrac metrics, such as Bray-Curtis, etc.).
For microbiome studies, species profiles of samples can be compared with the Bray-Curtis dissimilarity,
which is based on the count data type. The pair-wise Bray-Curtis dissimilarity matrix of all samples can then be
subject to either multi-dimensional scaling (MDS, also known as PCoA) or non-metric MDS (NMDS).
MDS/PCoA is a
scaling or ordination method that starts with a matrix of similarities or dissimilarities
between a set of samples and aims to produce a low-dimensional graphical plot of the data
in such a way that distances between points in the plot are close to original dissimilarities.
NMDS is similar to MDS, however it does not use the dissimilarities data, instead it converts them into
the ranks and use these ranks in the calculation.
In our beta diversity analysis, Bray-Curtis dissimilarity matrix was first calculated and then plotted by the PCoA and
NMDS separately. Below are beta diveristy results for all groups together:
NMDS and PCoA Plots for All Groups
The above PCoA and NMDS plots are based on count data. The count data can also be transformed into centered log ratio (CLR)
for each species. The CLR data is no longer count data and cannot be used in Bray-Curtis dissimilarity calculation. Instead
CLR can be compared with Euclidean distances. When CLR data are compared by Euclidean distance, the distance is also called
Aitchison distance.
Below are the NMDS and PCoA plots of the Aitchison distances of the samples:
NMDS and PCoA Plots for Individual Comparisons Interactive 3D PCoA Plots - Bray-Curtis Dissimilarity
Interactive 3D PCoA Plots - Euclidean Distance
Interactive 3D PCoA Plots - Correlation Coefficients
Group Significance of Beta-diversity Indices
To test whether the between-group dissimilarities are significantly greater than the within-group dissimilarities,
the "beta-group-significance" function provided in the QIIME 2 "diversity" package was used with PERMANOVA
(permutational multivariate analysis of variance) chosen s the group significan testing method.
Three beta diversity matrics were used: 1) Bray–Curtis dissimilarity 2) Correlation coefficient matrix , and 3) Aitchison distance
(Euclidean distance between clr-transformed compositions).
X. Analysis - Differential Abundance
16S rRNA next generation sequencing (NGS) generates a fixed number of reads that reflect the proportion of different
species in a sample, i.e., the relative abundance of species, instead of the absolute abundance.
In Mathematics, measurements involving probabilities, proportions, percentages, and ppm can all
be thought of as compositional data. This makes the microbiome read count data “compositional”
(Gloor et al , 2017). In general, compositional data represent parts of a whole which only
carry relative information (http://www.compositionaldata.com/).
The problem of microbiome data being compositional arises when comparing two groups of samples for
identifying “differentially abundant” species. A species with the same absolute abundance between two
conditions, its relative abundances in the two conditions (e.g., percent abundance) can become different
if the relative abundance of other species change greatly. This problem can lead to incorrect conclusion
in terms of differential abundance for microbial species in the samples.
When studying differential abundance (DA), the current better approach is to transform the read count
data into log ratio data. The ratios are calculated between read counts of all species in a sample to
a “reference” count (e.g., mean read count of the sample). The log ratio data allow the detection of DA
species without being affected by percentage bias mentioned above
In this report, a compositional DA analysis tool “ANCOM” (analysis of composition of microbiomes)
was used. ANCOM transforms the count data into log-ratios and thus is more suitable for comparing
the composition of microbiomes in two or more populations. "ANCOM" generates a table of features with
W-statistics and whether the null hypothesis is rejected. The “W” is the W-statistic, or number of
features that a single feature is tested to be significantly different against. Hence the higher the "W"
the more statistical sifgnificane that a feature/species is differentially abundant.
References:
Gloor GB, Macklaim JM, Pawlowsky-Glahn V, Egozcue JJ. Microbiome Datasets Are Compositional: And This Is Not Optional. Front Microbiol.
2017 Nov 15;8:2224. doi: 10.3389/fmicb.2017.02224. PMID: 29187837; PMCID: PMC5695134.
Mandal S, Van Treuren W, White RA, Eggesbø M, Knight R, Peddada SD. Analysis of composition of
microbiomes: a novel method for studying microbial composition. Microb Ecol Health Dis.
2015 May 29;26:27663. doi: 10.3402/mehd.v26.27663. PMID: 26028277; PMCID: PMC4450248.
Lin H, Peddada SD. Analysis of compositions of microbiomes with bias correction.
Nat Commun. 2020 Jul 14;11(1):3514. doi: 10.1038/s41467-020-17041-7.
PMID: 32665548; PMCID: PMC7360769.
ANCOM Differential Abundance Analysis ANCOM Results for Individual Comparisons
ANCOM-BC Differential Abundance Analysis
Starting with version V1.2, we also include the results of ANCOM-BC (Analysis of Compositions of
Microbiomes with Bias Correction) (Lin and Peddada 2020). ANCOM-BC is an updated version of "ANCOM" that:
(a) provides statistically valid test with appropriate p-values,
(b) provides confidence intervals for differential abundance of each taxon,
(c) controls the False Discovery Rate (FDR),
(d) maintains adequate power, and
(e) is computationally simple to implement.
The bias correction (BC) addresses a challenging problem of the bias introduced by differences in
the sampling fractions across samples. This bias has been a major hurdle in performing DA analysis of microbiome data.
ANCOM-BC estimates the unknown sampling fractions and corrects the bias induced by their differences among samples.
The absolute abundance data are modeled using a linear regression framework.
References:
Lin H, Peddada SD. Analysis of compositions of microbiomes with bias correction.
Nat Commun. 2020 Jul 14;11(1):3514. doi: 10.1038/s41467-020-17041-7.
PMID: 32665548; PMCID: PMC7360769.
ANCOM-BC Results for Individual Comparisons
LEfSe - Linear Discriminant Analysis Effect Size
LEfSe (Linear Discriminant Analysis Effect Size) is an alternative method to find "organisms, genes, or
pathways that consistently explain the differences between two or more microbial communities" (Segata et al. , 2011).
Specifically, LEfSe uses rank-based Kruskal-Wallis (KW) sum-rank test to detect features with significant
differential (relative) abundance with respect to the class of interest. Since it is rank-based, instead of proportional based,
the differential species identified among the comparison groups is less biased (than percent abundance based).
Reference:
Segata N, Izard J, Waldron L, Gevers D, Miropolsky L, Garrett WS, Huttenhower C. Metagenomic biomarker discovery and explanation. Genome Biol. 2011 Jun 24;12(6):R60. doi: 10.1186/gb-2011-12-6-r60. PMID: 21702898; PMCID: PMC3218848.
W Caries Free Saliva vs W Caries Saliva vs K Caries Free Saliva vs K Caries Saliva
LEfSe Results for All Comparisons
XI. Analysis - Heatmap Profile
Species vs Sample Abundance Heatmap for All Samples
Heatmaps for Individual Comparisons A) Two-way clustering - clustered on both columns (Samples) and rows (organism)
Comparison No. Comparison Name Family Level Genus Level Species Level Comparison 1 W Caries Free Saliva vs W Caries Saliva vs K Caries Free Saliva vs K Caries Saliva PDF SVG PDF SVG PDF SVG Comparison 2 W Caries Free Saliva vs W Caries Saliva PDF SVG PDF SVG PDF SVG Comparison 3 K Caries Free Saliva vs K Caries Saliva PDF SVG PDF SVG PDF SVG
B) One-way clustering - clustered on rows (organism) only
Comparison No. Comparison Name Family Level Genus Level Species Level Comparison 1 W Caries Free Saliva vs W Caries Saliva vs K Caries Free Saliva vs K Caries Saliva PDF SVG PDF SVG PDF SVG Comparison 2 W Caries Free Saliva vs W Caries Saliva PDF SVG PDF SVG PDF SVG Comparison 3 K Caries Free Saliva vs K Caries Saliva PDF SVG PDF SVG PDF SVG
C) No clustering
Comparison No. Comparison Name Family Level Genus Level Species Level Comparison 1 W Caries Free Saliva vs W Caries Saliva vs K Caries Free Saliva vs K Caries Saliva PDF SVG PDF SVG PDF SVG Comparison 2 W Caries Free Saliva vs W Caries Saliva PDF SVG PDF SVG PDF SVG Comparison 3 K Caries Free Saliva vs K Caries Saliva PDF SVG PDF SVG PDF SVG
XII. Analysis - Network Association
To analyze the co-occurrence or co-exclusion between microbial species among different samples, network correlation
analysis tools are usually used for this purpose. However, microbiome count data are compositional. If count data are normalized to the total number of counts in the
sample, the data become not independent and traditional statistical metrics (e.g., correlation) for the detection
of specie-species relationships can lead to spurious results. In addition, sequencing-based studies typically
measure hundreds of OTUs (species) on few samples; thus, inference of OTU-OTU association networks is severely
under-powered. Here we use SPIEC-EASI (SP arse I nversE C ovariance Estimation
for E cological A ssociation I nference), a statistical method for the inference of microbial
ecological networks from amplicon sequencing datasets that addresses both of these issues (Kurtz et al. , 2015).
SPIEC-EASI combines data transformations developed for compositional data analysis with a graphical model
inference framework that assumes the underlying ecological association network is sparse. SPIEC-EASI provides
two algorithms for network inferencing – 1) Meinshausen-Bühlmann's neighborhood selection (MB method) and inverse covariance selection
(GLASSO method, i.e., graphical least absolute shrinkage and selection operator). This is fundamentally distinct from SparCC, which essentially estimate pairwise correlations. In addition
to these two methods, we provide the results of a third method - SparCC (Sparse Correlations for Compositional Data)(Friedman & Alm 2012), which
is also a method for inferring correlations from compositional data. SparCC estimates the linear Pearson correlations between
the log-transformed components.
References:
Kurtz ZD, Müller CL, Miraldi ER, Littman DR, Blaser MJ, Bonneau RA. Sparse and compositionally robust inference of microbial ecological networks. PLoS Comput Biol. 2015 May 7;11(5):e1004226. doi: 10.1371/journal.pcbi.1004226. PMID: 25950956; PMCID: PMC4423992.
Friedman J, Alm EJ. Inferring correlation networks from genomic survey data. PLoS Comput Biol. 2012;8(9):e1002687. doi: 10.1371/journal.pcbi.1002687. Epub 2012 Sep 20. PMID: 23028285; PMCID: PMC3447976.
SPIEC-EASI Network Inference by Neighborhood Selection (MB Method)
Association Network Inference by SparCC
Copyright FOMC 2023

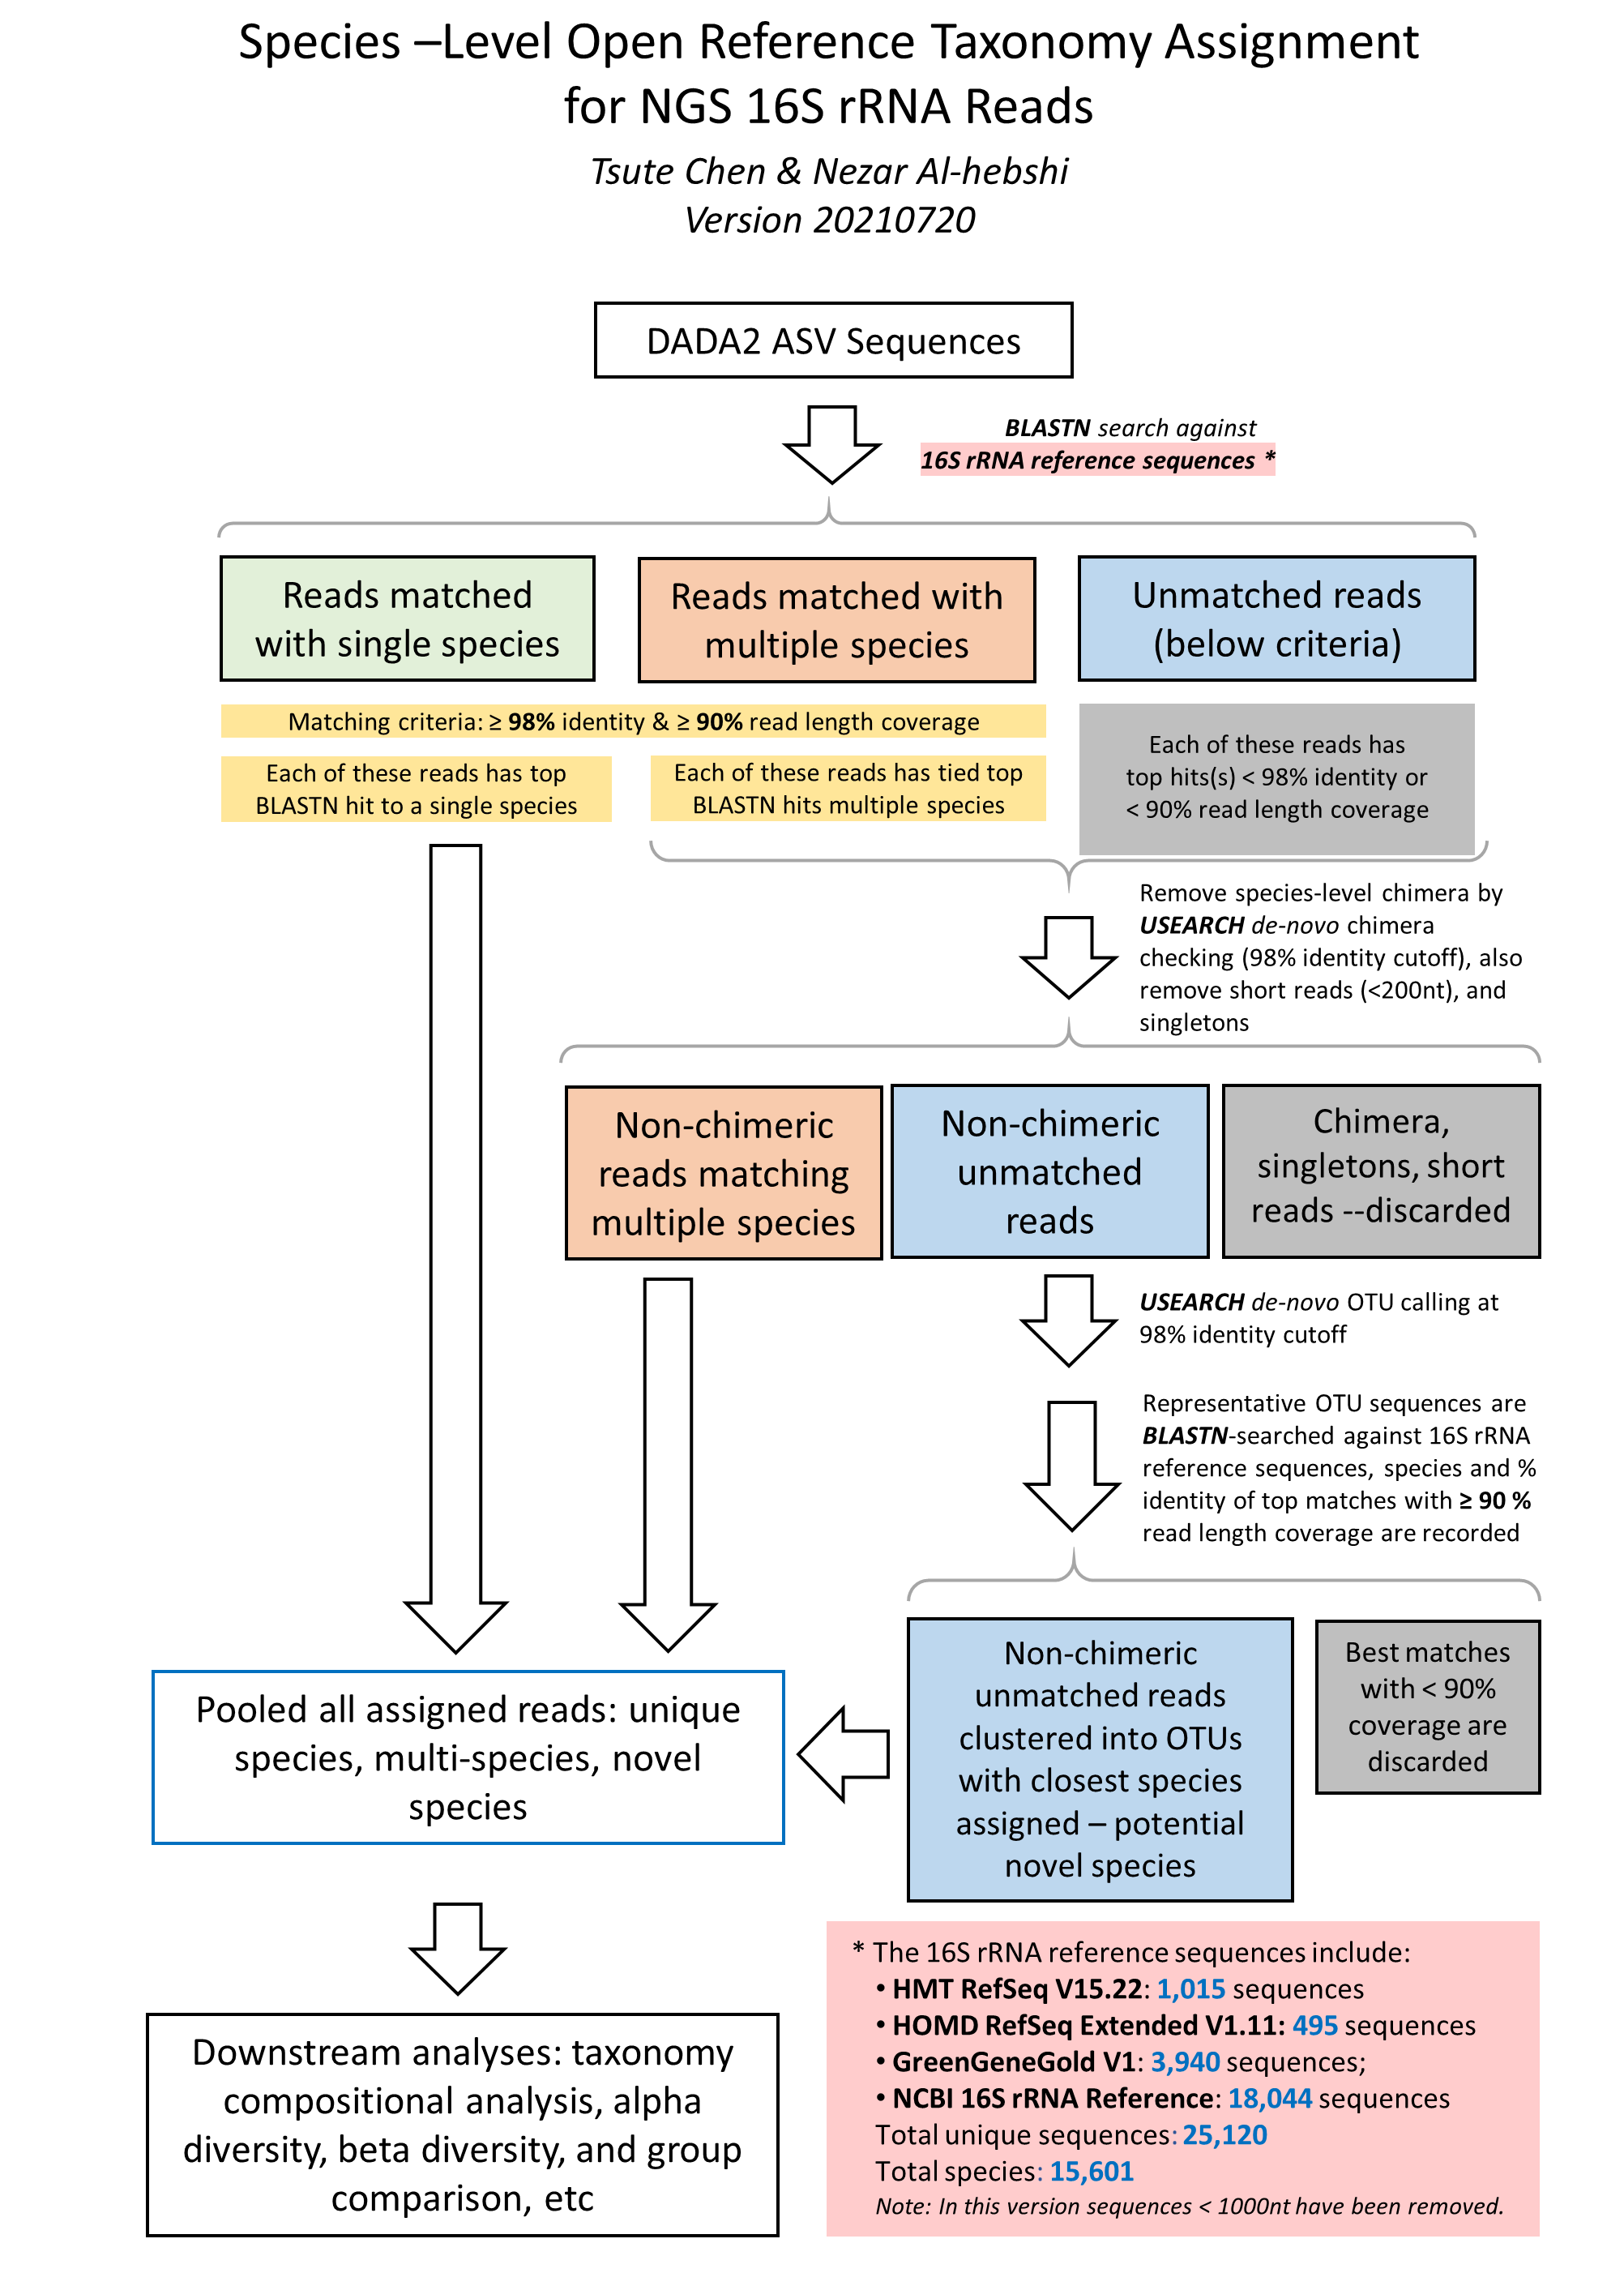


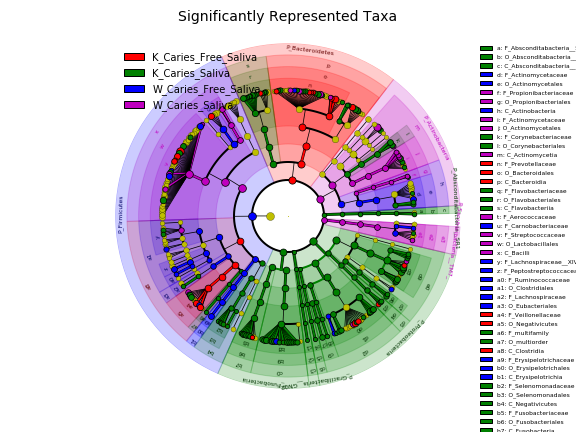


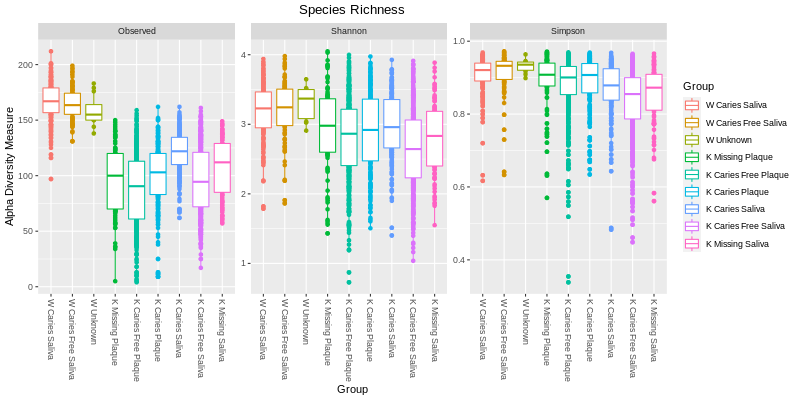